
1332 State Innovation Task Force Meeting Agenda Task Force Meeting Presentation.pdf1332 State...
41
1332 State Innovation Task Force Meeting Agenda Presenter Section April 18, 2017 1:30 p.m.-3 p.m. Oklahoma Hospital Association 4000 N. Lincoln Blvd., Seminar Room Oklahoma City, OK 73105 Time Welcome and Introductions 1:30 5 min Julie Cox-Kain, Deputy Secretary of Health and Human Services Federal Updates 1:35 10 min Julie Cox-Kain Discussion of Reinsurance and High Risk Pools 1:45 30 min Julie Cox-Kain; Buffy Heater, HHS Project Lead Preliminary Impact Assessment of Concept Paper Strategies 2:15 30 min Erik Krisle, Leavitt Partners Austin Bordelon, Leavitt Partners Timeline and Next Steps 2:45 15 min Julie Cox-Kain, Buffy Heater 1
Transcript of 1332 State Innovation Task Force Meeting Agenda Task Force Meeting Presentation.pdf1332 State...

1332 State Innovation Task Force Meeting Agenda
Presenter Section
April 18, 2017
1:30 p.m.-3 p.m.
Oklahoma Hospital Association
4000 N. Lincoln Blvd., Seminar Room
Oklahoma City, OK 73105
Time
Welcome and Introductions 1:30 5 min Julie Cox-Kain, Deputy Secretary of Health and Human Services
Federal Updates 1:35 10 min Julie Cox-Kain
Discussion of Reinsurance and High Risk Pools 1:45 30 min Julie Cox-Kain; Buffy Heater, HHS Project Lead
Preliminary Impact Assessment of Concept
Paper Strategies 2:15 30 min
Erik Krisle, Leavitt Partners
Austin Bordelon, Leavitt Partners
Timeline and Next Steps 2:45 15 min Julie Cox-Kain, Buffy Heater
1

CMS Market Stabilization
• 2018 Annual Open Enrollment Period:
– The final rule adjusts the annual open enrollment period for 2018 to more closely align with Medicare and the private market. The next open enrollment period will start on November 1, 2017, and run through December 15, 2017, encouraging individuals to enroll in coverage prior to the beginning of the year.
• Increased Special Enrollment Verification:
– The final rule promotes program integrity by requiring all individuals to submit supporting documentation for special enrollment periods and ensures that only those who are eligible are able to enroll. Verification for states served by the Healthcare.gov platform is increasing from 50% to 100% of new consumers applying for a special enrollment period.
Source: https://www.cms.gov/Newsroom/MediaReleaseDatabase/Press-releases/2017-Press-releases-items/2017-04-13-2.html
2

CMS Market Stabilization, Continued
• Payment of Past Due Premiums:
– The final rule allows issuers to require individuals to pay back past due premiums
before enrolling into a plan with the same issuer the following year. This is intended
to address gaming and encourage individuals to maintain continuous coverage
throughout the year, which will have a positive impact on the risk pool.
• Actuarial Value Flexibility:
– For the 2018 plan year and beyond, the final rule allows issuers additional actuarial
value flexibility within the metal tier system to develop more choices with lower
premium options for consumers, and to continue offering existing plans.
Source:
https://www.cms.gov/Newsroom/MediaReleaseDatabase/Press-releases/2017-Press-releases-items/2017-04-13
-2.html 3

CMS Market Stabilization, Continued
• Network Adequacy: – The final rule reduces waste of taxpayer dollars by eliminating duplicative review of
network adequacy by the federal government. The rule returns oversight of network adequacy to states that are best positioned to evaluate network adequacy.
• Essential Community Providers: – The final rule allows issuers to continue to identify essential community providers
who are not on the HHS list through a write-in process.
– It also lowers the essential community provider standard to 20% instead of 30% for the 2018 plan year. This rule is designed to make it easier for issuers to build provider networks that comply with the standard.
Source: https://www.cms.gov/Newsroom/MediaReleaseDatabase/Press-releases/2017-Press-releases-items/2017-04-13-2.html 4

1332 State Innovation Task Force Meeting Agenda
Presenter Section
April 18, 2017
1:30 p.m.-3 p.m.
Oklahoma Hospital Association
4000 N. Lincoln Blvd., Seminar Room
Oklahoma City, OK 73105
Time
Welcome and Introductions 1:30 5 min Julie Cox-Kain, Deputy Secretary of Health and Human Services
Federal Updates 1:35 10 min Julie Cox-Kain
Discussion of Reinsurance and High Risk Pools 1:45 30 min Julie Cox-Kain; Buffy Heater, HHS Project Lead
Preliminary Impact Assessment of Concept
Paper Strategies 2:15 30 min
Erik Krisle, Leavitt Partners
Austin Bordelon, Leavitt Partners
Timeline and Next Steps 2:45 15 min Julie Cox-Kain, Buffy Heater
5

Reinsurance and High Risk Pools
• A high-risk pool and/or reinsurance program is a potential tool to quickly
stabilize the market so that participating carrier’s financial risks are mitigated
and Oklahomans can continue to use their tax credits to purchase coverage
on healthcare.gov.
• In reinsurance programs, insurance carriers are paid part of a high-cost
and/or high-need individual’s claims over a specified amount. The individuals
remain in the total pool.
• Alaska and Minnesota are working to implement a reinsurance program
through a 1332 Waiver as a way to encourage market competition and keep
premium cost growth down.
6

Reinsurance and High Risk Pools
• Another way to stabilize public investment is to utilize a high-risk pool design,
where high-cost individuals are offered coverage in a separate pool. Taking
high-risk people out of the conventional market can help keep premiums
lower for those remaining in the market.
• Wisconsin is touted as having a successful state-run high risk pool program
with high per capita enrollment.
• Congress is looking at a high-risk pool/reinsurance hybrid as a possible
amendment to the ACA. Congress has used Maine’s approach as an
example model.
7

Risk Management for the Individual Market
What's the best way to isolate risk and ensure affordability to all consumers?
High-Risk Pools Segmenting the highest risk populations into a
separate pool.
Pros:
• Ability to segment most costly
populations and charge higher
premium.
• Clearly defined underwriting risk for
carriers.
Cons:
• High cost of administering the program.
• Enrollees may become trapped in the
program even after becoming healthy.
• Typically requires enrollees to be
uninsured to qualify.
Hybrid Program Health care condition used as triggering event
for state responsibility.
Pros:
• Equitable treatment of high-risk
residents.
• Highest risk conditions subsidized by
state.
• Clearly defined underwriting risk for
carriers.
• Lower administrative cost.
Cons:
• Enrollees may remain in program even
after becoming healthy.
• Inability to charge high-risk populations
more premium.
*Note: Pros and cons of these programs still very much contingent on aspects of program design.
Reinsurance Gov’t shares in financial risk to reduce cost of
high-risk enrollees.
Pros:
• Equitable treatment of high-risk
residents.
• Shared risk as incentive for carriers to
keep costs down.
• Lower administrative cost.
• Greatest financial certainty of program
risk and funding.
Cons:
• Highest risk populations not fully
removed from risk pool.
• Inability to charge high-risk populations
more premium.
8

Options for Individual Eligibility
Cost-based
• Rather than setting up a separate high-risk pool, one approach is to use funds to reimburse health plans a portion of the claims costs of their high-cost enrollees. (MN example) High cost individuals would remain in the private individual market. States establish the definition of “high-cost” as an attachment point and claims cap.
Condition-based
• As an alternative, reimbursements could be based on an enrollee having one or more specified high-risk conditions. (AK or AZ example)
Hybrid
• Both cost and condition based (ME example)
9

Wisconsin High Risk Pool
• Wisconsin’s Health Insurance Risk-Sharing Plan (HIRSP) ran from 1979 – 2014
• Funded through premiums, insurance company assessments and reduced payments to providers
• Statutes required policyholder premiums to fund 60% of estimated operating and administrative costs of the state-based HIRSP Plan.
• Variety of plan choices at varying levels of premium to meet the needs of individuals with pre-existing conditions.
10

Wisconsin High Risk Pool
• Premium, deductible and drug out-of-pocket maximum
discount if applicant’s household income was below
$34,000/year
• Individuals had maximum annual individual out-of-pocket
costs from $2,000 to $8,500
• Monthly premiums ranged from $158 for someone under
age 18 to $1,500 for a male over age 60
• HIRSP premiums varied by as much as 15% per year
11

Alaska Reinsurance Program
• Only funded for 2017, the state has drafted a 1332 waiver
proposal that seeks 5 years of federal funding
• The program will use $55 million of the $64 million that
was collected in 2015 to cover claims for high-cost
insured lives in the individual market
• Funding generated by a 2.7% premium tax on all insurers
in AK
12

Maine Invisible High Risk Pool (Hybrid)
• Helped cover claim costs for individuals with high medical claims in the market (reinsurance)
• Targeted a subset of individuals based on specific conditions (high-risk pool)
• Did not move individuals with pre-existing conditions out of the traditional market
• Individuals were charged the same premium as everyone else
13

Maine Invisible High Risk Pool (Hybrid)
• Age rating bands were expanded from 1.5-to-1 to 3-to-1
• Helped drive premiums down, increasing the number of
younger, healthier people purchasing insurance
• Two primary funding sources:
– 90% of pool premiums were transferred to the high risk pool
(known as the Maine Guaranteed Access Reinsurance
Association), which covered 42% of all claim expenses
– $4 per member per month assessment on all policies, which
raised nearly $28 million
14

Implementation of Reinsurance/High Risk Pools
Considerations for Oklahoma:
• Need authorizing legislation and 1332 waiver approval
• Need upfront funding, via an insurance plan assessment
• Need to identify administering entity and infrastructure
• The federal government will reimburse a majority of the costs via pass through funding
• The remaining state funds necessary will be a portion of the total funding
• Timing and coordination of multiple activities occurring simultaneously
15

1332 State Innovation Task Force Meeting Agenda
Presenter Section
April 18, 2017
1:30 p.m.-3 p.m.
Oklahoma Hospital Association
4000 N. Lincoln Blvd., Seminar Room
Oklahoma City, OK 73105
Time
Welcome and Introductions 1:30 5 min Julie Cox-Kain, Deputy Secretary of Health and Human Services
Federal Updates 1:35 10 min Julie Cox-Kain,
Discussion of Reinsurance and High Risk Pools 1:45 30 min Julie Cox-Kain; Buffy Heater, HHS Project Lead
Preliminary Impact Assessment of Concept
Paper Strategies 2:15 30 min
Erik Krisle, Leavitt Partners
Austin Bordelon, Leavitt Partners
Timeline and Next Steps 2:45 15 min Julie Cox-Kain, Buffy Heater
16
April 18, 2017
Oklahoma 1332 Task Force: Modeling Overview

©2016 LEAVITT PARTNERS 18
Modeling Overview
Leavitt Partners worked closely with Oklahoma Health Department staff to prioritize the following solutions from the Modernized Marketplace concept paper for comprehensive modeling and impact analysis:
• Impact of a High-Risk Pool or Reinsurance Program – Introducing new stability funding—whether through a reinsurance program or high-risk pool—has the ability to directly reduce the underlying cost of a risk pool and, in turn, lower premiums and slow cost growth.
• Effects of Moving to a Wider Age Band – Allowing greater variance to the age bands for underwriting insurance may
support greater participation among younger age, and lower risk, Oklahomans. • Standardizing Subsidies Based on Age and Income – With the goal of providing additional support to younger
populations and moving to a subsidy structure that also places more downward pressure on premiums, the State will evaluate calculating insurance subsidies based on age and income.
• Reallocating Subsidies for 0-300% FPL Population – With a significant population lacking coverage below the Federal
Poverty Line (FPL), Oklahoma would also like to evaluate the effects of moving eligibility for premium assistance down to 0-300$ FPL (adjusting from 100-400% FPL today).
The results of this analysis are preliminary and additional refinements to the model are predicted. Leavitt Partners and the Oklahoma team also expect to model a handful of select combinations of the solutions listed above.

©2016 LEAVITT PARTNERS 19
Modeling Overview
The various solutions are likely to have different affects on total enrollment. Subsidizing the gap population (Solution 5) has the largest effect on total enrollment driven by large increases in spending for a new population.

©2016 LEAVITT PARTNERS 20
Modeling Overview
Summary of the analysis and composite score for each proposed solution:
Legislative Impact Budget Operations
Federal State Enrollment Premiums Market Stability
Financial Commitment
Implemen- tation
Composite
Solution 1: Reinsurance / High Risk Pool ● ◐ ◐ ◕ ◐ ◔ ◐ ◐
Solution 2: Wider Age Band ◔ ◕ ◐ ◐ ◐ ● ● ◕
Solution 3: Age + Income Subsidies ◕ ◐ ◔ ◐ ◐ ◕ ◔ ◔
Solution 4: Moving Eligibility to 0-300% FPL ◐ ◔ ● ◔ ◐ ○ ○ ◐
Unfavorable Favorable
○ ◔ ◐ ◕ ●
Methodology
Leavitt Partners utilized the following data and research in modeling the proposed solutions:
– Secondary research and literature review
– Time series modeling – CMS enrollment and
premium data – MLR, NAIC, and U.S.
Census market data – Price elasticity modeling – Regulatory research

Solution 1: Impact of a High-Risk Pool or Reinsurance Program

©2016 LEAVITT PARTNERS 22
Solution 1: Impact of a High-Risk Pool or Reinsurance Program
The introduction of stability funding—through a reinsurance program or high-risk pool—has the ability to directly reduce the underlying cost of a risk pool and, in turn, lower premiums and slow cost growth .
Aggregate Incurred Claims under Varying Amounts of Stability Funding
$200,000,000
$400,000,000
$600,000,000
$800,000,000
$1,000,000,000
$1,200,000,000
$1,400,000,000
2014 2015 2016 2017 2018 2019 2020
Low (50 M) Medium (100 M) High (200 M) Baseline Incurred Claims
Leavitt Partners modeled the influence of reinsurance program or high-risk pool funding of $50M, $100M, and $200M. These amounts were determined as a function of 5%, 10% and 20% of the aggregate individual market incurred claims amount.
Source: Market data obtained through Leavitt Partners analysis of CMS Medical Loss Ratio (MLR) data

©2016 LEAVITT PARTNERS 23
Solution 1: Impact of a High-Risk Pool or Reinsurance Program
The introduction of stability funding—through a reinsurance program or high-risk pool—has the ability to directly reduce the underlying cost of a risk pool and, in turn, lower premiums and slow cost growth.
Aggregate Incurred Claims under Varying Amounts of Stability Funding
Year Baseline Incurred Claims
Low (50 M) Medium (100 M)
High (200 M)
2017 $795 $795 $795 $795
2018 $926 $890 $852 $772
2019 $1,099 $1,063 $1,025 $946
2020 $1,239 $1,203 $1,165 $1,087

©2016 LEAVITT PARTNERS 24
Solution 1: Impact of a High-Risk Pool or Reinsurance Program
Directly subsidizing the individual market risk pool has an immediate affect on premiums for the state. Based on the subsidy amount, premiums are estimated to drop 5% (50 M), 11% (100 M), and 22% (200 M).
Average Premium with Reinsurance
$235
$282
$330
$401
$322
$355
$386 $415
$235
$282
$330
$401 $410 $434
$460 $487
$-
$100
$200
$300
$400
$500
$600
2014 2015 2016 2017 2018 2019 2020 2021
Low (50 M) Medium (100 M) High (200 M) Baseline Premiums
-5.4%
-10.8%
-21.6%
-4.5%
-9.1%
-18.2%
-4.0%
-8.1%
-16.1%
-25%
-20%
-15%
-10%
-5%
0%
2018 2019 2020
Percent Premium Change
Year Low (50 M) Medium (100 M)
High (200 M)
2018 -5.4% -10.8% -21.6%
2019 -4.5% -9.1% -18.2%
2020 -4.0% -8.1% -16.1%
Low Medium High
©2016 LEAVITT PARTNERS 25
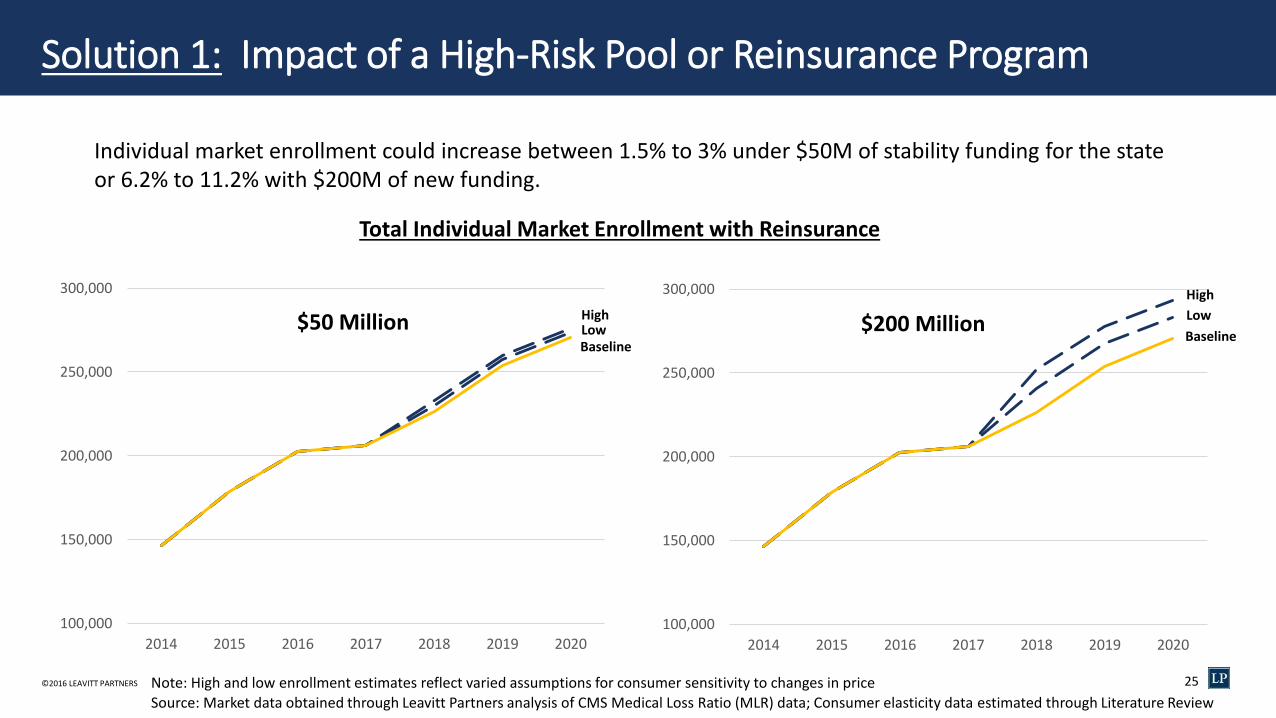
Solution 1: Impact of a High-Risk Pool or Reinsurance Program
Individual market enrollment could increase between 1.5% to 3% under $50M of stability funding for the state or 6.2% to 11.2% with $200M of new funding.
100,000
150,000
200,000
250,000
300,000
2014 2015 2016 2017 2018 2019 2020
100,000
150,000
200,000
250,000
300,000
2014 2015 2016 2017 2018 2019 2020
$50 Million
Total Individual Market Enrollment with Reinsurance
$200 Million
Source: Market data obtained through Leavitt Partners analysis of CMS Medical Loss Ratio (MLR) data; Consumer elasticity data estimated through Literature Review
High
Low
Baseline
Note: High and low enrollment estimates reflect varied assumptions for consumer sensitivity to changes in price
High Low Baseline

©2016 LEAVITT PARTNERS 26
Solution 1: Impact of a High-Risk Pool or Reinsurance Program
As premium’s are reduced, savings to the federal government from lower subsidy payments are realized and may be eligible to be collected for future program funding
Baseline APTC Subsidy New APTC Subsidy (low) New APTC Subsidy (high) Potential APTC Savings1 Original Funds Eligible for Pass-
Through Savings (%)
$ 828.92 M $ 784.19 M $ 806.25 M $ 22.67 M - $ 44.74 M 45.3% - 89.5%
$ 1002.55 M $ 956.93 M $ 979.66 M $ 22.89 M - $ 45.61 M 45.8% - 91.2%
$ 1139.88 M $ 1093.87 M $ 1116.94 M $ 22.95 M - $ 46.02 M 45.9% - 92.0%
$ 828.92 M $ 739.45 M $ 780.95 M $ 47.97 M - $ 89.48 M 48.0% - 89.5%
$ 1002.55 M $ 911.32 M $ 954.47 M $ 48.08 M - $ 91.23 M 48.1% - 91.2%
$ 1139.88 M $ 1047.85 M $ 1091.89 M $ 48.00 M - $ 92.03 M 48.0% - 92.0%
$ 828.92 M $ 649.97 M $ 722.84 M $ 106.08 M - $ 178.95 M 53.0% - 89.5%
$ 1002.55 M $ 820.10 M $ 897.62 M $ 104.92 M - $ 182.45 M 52.5% - 91.2%
$ 1139.88 M $ 955.82 M $ 1036.01 M $ 103.87 M - $ 184.06 M 51.9% - 92.0%
$50 Million in Program Funding
2018
2019
2020
$100 Million in Program Funding
2018
2019
2020
$200 Million in Program Funding
2018
2019
2020
1 Note: Savings reflect APTC reduction only. Does not reflect mandate penalties or FFM user fee adjustment.
Source: Market data obtained through Leavitt Partners analysis of CMS Medical Loss Ratio (MLR) data

Solution 2: Effects of Moving to a Wider Age Band

©2016 LEAVITT PARTNERS 28
Solution 2: Effects of Moving to a Wider Age Band
• The current, 3:1 ratio for Age Banding means that insurers cannot charge seniors more than three times what younger patients pay in premium value.
• These rating rules attempt to strike
a balance between promoting market stability and sound risk pools, while at the same time assuring that younger, healthier individuals can participate in the coverage marketplace.
• These age band curves reflect the “default” slope for reaching the upper band. However, states do have the option to customize.

©2016 LEAVITT PARTNERS 29
Solution 2: Effects of Moving to a Wider Age Band
Percent Change from 3:1 Age Band (2019)
3 to 1 3.5 to 1 4 to 1 4.5 to 1 5 to 1
0% -13% -23% -32% -40%
0% -9% -17% -23% -29%
0% -6% -11% -16% -19%
0% -4% -7% -9% -12%
0% 1% 2% 3% 4%
0% 5% 10% 14% 17%
0% 6% 12% 17% 21%
Age Bands
Age < 18
Age 18-25
Age 26-34
Age 35-44
Age 45-54
Age 55-64
Age ≥65
Avg. Monthly Premiums ($’s)
Age Bands 3 to 1 3.5 to 1 4 to 1 4.5 to 1 5 to 1
Age < 18 228 199 174 154 136
Age 18-25 264 240 220 203 189
Age 26-34 302 284 268 255 243
Age 35-44 344 331 321 312 304
Age 45-54 471 477 481 485 488
Age 55-64 696 733 764 791 813
Age ≥65 802 854 898 935 967
0
200
400
600
800
1000
1200
Age < 18 Age 18-25 Age 26-34 Age 35-44 Age 45-54 Age 55-64 Age ≥65
PR
EMIU
M
3 to 1 3.5 to 1 4 to 1 4.5 to 1 5 to 1
2019 Premium Impact of Wider Age Bands
Widening the age band is likely reduce premiums for young enrollees and increase them for older populations. A 5:1 age band could reduce young adult premiums as much as 29% and increase them by 21% for older enrollees.

©2016 LEAVITT PARTNERS 30 (5,000)
-
5,000
10,000
15,000
ENR
OLL
MEN
T Solution 2: Effects of Moving to a Wider Age Band
Lower premiums are likely to encourage new enrollment among younger populations while “pricing out” a subset of the older population.
3.5:1 Ratio 4:1 Ratio 4.5:1 Ratio 5:1 Ratio
Range of Possible Enrollment Gains Across Age Bands, 2019

Solution 3: Standardizing Subsidies Based on Age and Income

©2016 LEAVITT PARTNERS 32
Solution 3: Standardizing Subsidies Based on Age and Income
Guiding principles for developing a new subsidy structure based on “age” and “income:”
1. Should make coverage more affordable to younger populations 2. Total subsidies will be budget neutral relative to anticipated APTC funding 3. Spread across ages should still require some ‘skin in the game’ for enrollees 4. Cost-sharing reduction (CSR) are assumed to remain in place 5. Only available to plans purchased on marketplace
-
10,000
20,000
30,000
40,000
50,000
60,000
Age 18-25 Age 26-34 Age 35-44 Age 45-54 Age 55-64 Age ≥65
Possible Enrollment Impact of New Subsidy Structure in Year 1
Baseline New Policy
New Subsidy Amount
Federal Poverty Level
100-138% (Old)
100-138% (New)
139-200% 201-250% 251-400% 400%+
Age 18-25 $ 383 $ 395 $ 371 $ 296 $ 217 $ -
Age 26-34 $ 441 $ 454 $ 427 $ 341 $ 250 $ -
Age 35-44 $ 506 $ 514 $ 483 $ 385 $ 282 $ -
Age 45-54 $ 703 $ 691 $ 650 $ 518 $ 380 $ -
Age 55-64 $ 1,050 $ 1,027 $ 965 $ 770 $ 565 $ -
Age ≥65 $ 1,214 $ 1,106 $ 1,040 $ 830 $ 608 $ -

©2016 LEAVITT PARTNERS 33
Solution 3: Standardizing Subsidies Based on Age and Income
100,000
150,000
200,000
250,000
2015 2016 2017 2018 2019 2020 2021
On Exchange Market Enrollment with Standardized Subsidy Based on Age and Income
Year Exchange Enrollment (baseline)
Solution Low
Solution High
2016 130,000 - -
2017 134,000 - -
2018 155,000 - -
2019 182,000 188,000 196,000
2020 198,000 205,000 215,000
2021 208,000 214,000 225,000
Older populations have much lower demand elasticity for health care services and are less sensitive to changes in price. Thus, moderate reductions in premium to young enrollees and slight increases to older enrollees have the potential to increase aggregate enrollment for the market (shown at left).
High
Low
Baseline
Source: Market data obtained through Leavitt Partners analysis of CMS Medical Loss Ratio (MLR) data; Consumer elasticity data estimated through Literature Review Note: High and low enrollment estimates reflect varied assumptions for consumer sensitivity to changes in price

Solution 4: Reallocating Subsidies for 0-300% FPL Population

©2016 LEAVITT PARTNERS 35
As a potential way to cover the Medicaid “gap population,” we considered the effects of lowering subsidy eligibility below 100% and two possible methods for subsidy calculation. Concerns of Medicaid enrollees cannibalization warranted a second scenario (at right) with higher member cost-sharing.
Solution 4: Reallocating Subsidies for 0-300% FPL Population
Scenario #1: ACA subsidy shifted downward
Gap Population
(<100%) 100-138% 139-200% 201-250% 251-300% 301-400%
Individual FPL Guidelines (monthly):
$ 661 $ 1,211 $ 1,724 $ 2,294 $ 2,803 $ 3,565
Income Limit for Premium 2% 3-5.9% 6-7.85% 7.86-9.10% 9.11-9.69% 0%
Average Premium $ 13.49 $ 49.39 $ 120.70 $ 197.83 $ 269.87 $ 419.23
Avg. Change in Premium $ (405.74) $ 24.69 $50.35 $ 37.26 $ 34.98 $ 117.68
Low Enrollment Projection 47,682 (10,494)
(7,980)
(1,760) (788) (143)
High Enrollment Projection 118,352 (26,024) (19,789)
(2,056) (878) (304)
Net New Enrollment (2019): 26,500 – 69,000 individuals
Scenario #2: ACA subsidy swapped from upper end
Gap Population
(<100%) 100-138% 139-200% 201-250% 251-300% 301-400%
Individual FPL Guidelines (monthly):
$ 661 $ 1,211 $ 1,724 $ 2,294 $ 2,803 $ 3,565
Income Limit for Premium 9.11-9.69% 2% 3-5.9% 6-7.85% 7.86-9.10% 0%
Average Premium $ 64.07 $ 24.69 $ 70.35 $ 160.57 $ 234.89 $ 419.23
Avg. Change in Premium $ (355.16) $ - $ - $ - $ - $ 117.68
Low Enrollment Projection 39,616 - - - - (143)
High Enrollment Projection 98,746 - - - - (304)
Net New Enrollment (2019): 39,500 – 98,500 individuals
Net New Spend (2019): $194 – $499 million Net New Spend (2019): $150 – $387 million

©2016 LEAVITT PARTNERS 36
Solution 4: Reallocating Subsidies for 0-300% FPL Population
Based on these parameters, the “gap population” is likely to see greater enrollment due to the significantly lower premiums. However, a key factor for total enrollment gains is the degree of premium change for the other low income populations (i.e., 100-300% FPL).
Total Exchange Enrollment (Scenario 1- Shifting) Total Exchange Enrollment (Scenario 2- Swapped)
0
50,000
100,000
150,000
200,000
250,000
300,000
350,000
2014 2015 2016 2017 2018 2019 2020 2021
0
50,000
100,000
150,000
200,000
250,000
300,000
350,000
2014 2015 2016 2017 2018 2019 2020 2021
69,000 Net New
26,500
98,500 Net New
39,500
Source: Market data obtained through Leavitt Partners analysis of CMS Medical Loss Ratio (MLR) data; Consumer elasticity data estimated through Literature Review Note: High and low enrollment estimates reflect varied assumptions for consumer sensitivity to changes in price
High
Low
Baseline
High
Low
Baseline

©2016 LEAVITT PARTNERS 37
Solution 4: Reallocating Subsidies for 0-300% FPL Population
Gains in enrollment among the low income will not come cheap. The population between 300-400% FPL is much smaller than the “gap population” and the cost to subsidize their coverage is much greater.
Total Spending (Scenario 1- Shifting)
$0
$200,000,000
$400,000,000
$600,000,000
$800,000,000
$1,000,000,000
$1,200,000,000
$1,400,000,000
$1,600,000,000
$1,800,000,000
$2,000,000,000
2014 2015 2016 2017 2018 2019 2020 2021$0
$200,000,000
$400,000,000
$600,000,000
$800,000,000
$1,000,000,000
$1,200,000,000
$1,400,000,000
$1,600,000,000
$1,800,000,000
$2,000,000,000
2014 2015 2016 2017 2018 2019 2020 2021
Total Spending (Scenario 2- Swapped)
Additional $499M
$194M
Additional $387M
$150M
High
Low
Baseline
High
Low
Baseline
Source: Market data obtained through Leavitt Partners analysis of CMS Medical Loss Ratio (MLR) data; Consumer elasticity data estimated through Literature Review Note: High and low enrollment estimates reflect varied assumptions for consumer sensitivity to changes in price

A health care intelligence business
LeavittPartners.com

1332 State Innovation Task Force Meeting Agenda
Presenter Section
April 18, 2017
1:30 p.m.-3 p.m.
Oklahoma Hospital Association
4000 N. Lincoln Blvd., Seminar Room
Oklahoma City, OK 73105
Time
Welcome and Introductions 1:30 5 min Julie Cox-Kain, Deputy Secretary of Health and Human Services
Federal Updates 1:35 10 min Julie Cox-Kain,
Discussion of Reinsurance and High Risk Pools 1:45 30 min Julie Cox-Kain; Buffy Heater, HHS Project Lead
Preliminary Impact Assessment of Concept
Paper Strategies 2:15 30 min
Erik Krisle, Leavitt Partners
Austin Bordelon, Leavitt Partners
Timeline and Next Steps 2:45 15 min Julie Cox-Kain, Buffy Heater
39

1332 WAIVER, STATE, AND CMS RATE REVIEW TIMELINES
1332 Application Drafting & Actuarial Analysis
30 Day Public Comment Period
CMS 45-Day Review for Completion
Apr May June July Aug Sept Oct Nov Dec Jan Feb Mar Apr May
13
32
Wa
ive
r
Pro
ce
ss
OK
Le
gis
lati
ve T
ime
lin
e
CM
S R
ate
Re
vie
w
Tim
elin
e
Bills out of House and Senate
Comm. (mid April)
3rd Readings in Opposite
Chamber (April 27)
2017 Adjournment
End of FY 17
State Agencies Submit FY18-19 Budget
Request
OMES Reviews FY18-19 State Agency Budget Requests; Agency Performance Review Hearings
Initial Rate Submission due to
CMS June 1
Changes to Rates due July 25
CMS Review and Finalization of QHP Plan Data
2018 Open Enrollment
(Proposed Nov 1-Dec 15)
Expected Reinsurance/HRP Expedited Review
CMS 45-Day Review for Completion
Begin Waiver January 1, 2018
Gov. Submits FY 18-19 Budget to Legislature
CMS Statutory Review and Approval (up to 180 days)
Appropriation of State Agency Budgets (JCAB)
Submit Budget Work Program to OMES
Bill Filing Deadline
Bills out of Comm. of
Origin
2018 Session Begins 2018 Adjournment
Legislative Review of State Agency Budgets
2018 Plan Year
Coverage Effective
40

Next Steps
41
• Conduct legislative review mid-April
• Continue impact analysis assessment by consultants, engagement of federal officials and stakeholders, report at June Task Force meeting
• Monitor federal developments regarding ACA amendments, CSR decision, etc.
• Secure actuarial consultant, proceed with waiver development
• Schedule tribal consultation and public comment periods
• Monitor progress on authorizing legislation and funding
• Pursue rate and form review responsibilities of OID
• Develop plans for potential administration responsibilities and infrastructure