12/3/2015 3:16 AM 1 Influence of Land Use Land Cover (LULC) on Cyclone Track Prediction – A Study...
33
03/26/22 23:45 1 Influence of Land Use Land Cover (LULC) on Cyclone Track Prediction – A Study during AILA Cyclone COSPAR Training and Capacity Building Course , 1 – 12 Nov 2010, Fortaleza, Brazil D. V. Mahalakshmi and K. V. S. Badarinath Atmospheric Science Section, National Remote Sensing Centre, Dept. of Space, Govt. of India Hyderabad, India Email – [email protected]
-
Upload
leon-banks -
Category
Documents
-
view
214 -
download
0
Transcript of 12/3/2015 3:16 AM 1 Influence of Land Use Land Cover (LULC) on Cyclone Track Prediction – A Study...
04/18/23 17:59 1
Influence of Land Use Land Cover (LULC) on Cyclone Track Prediction – A Study during AILA Cyclone
COSPAR Training and Capacity Building Course , 1 – 12 Nov 2010, Fortaleza, Brazil
D. V. Mahalakshmi and K. V. S. Badarinath
Atmospheric Science Section,National Remote Sensing Centre,
Dept. of Space, Govt. of IndiaHyderabad, India
Email – [email protected]

04/18/23 17:59 2
OBJECTIVE
To study the influence of Land Use/ Land Cover (LULC)
Change on the forecasting of cyclone intensity and track
prediction. In the Mesoscale Model(MM5) terrain, Indian
portion of LU/LC data from USGS was replaced IRS AWiFS
derived LULC map.

04/18/23 17:59 3
AILA CYCLONE METEOSAT IMAGES22May2009_00UTC
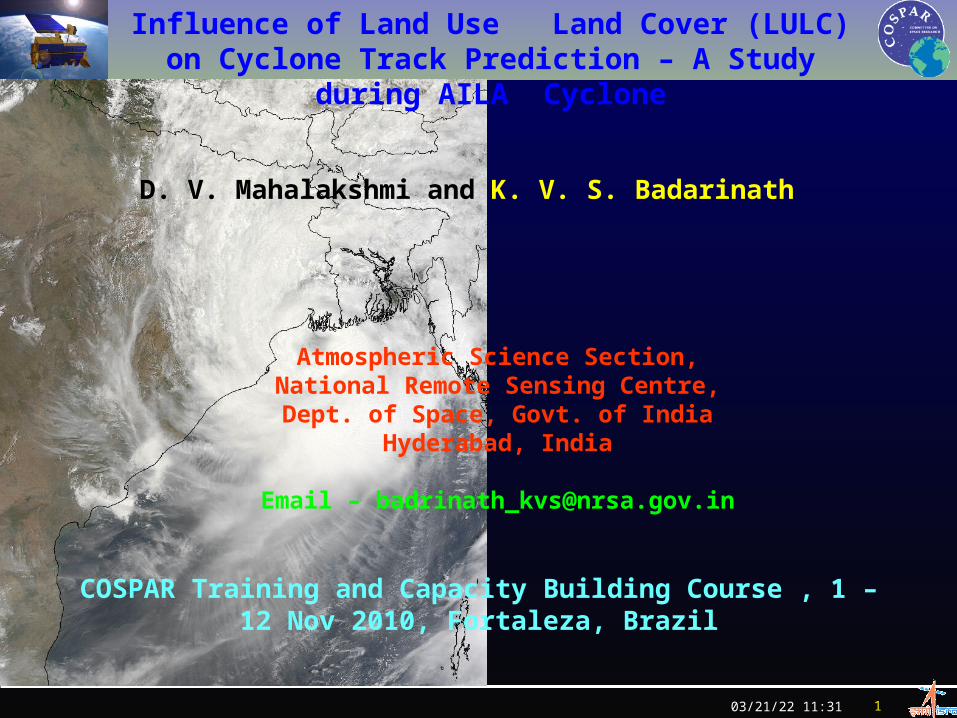
04/18/23 17:59 4
22May2009_06UTC

04/18/23 17:59 5
22May2009_12UTC

04/18/23 17:59 6
22May2009_18UTC

04/18/23 17:59 7
23May2009_00UTC

04/18/23 17:59 8
23May2009_06UTC

04/18/23 17:59 9
23May2009_12UTC

04/18/23 17:59 10
23May2009_18UTC

04/18/23 17:59 11
24May2009_06UTC

04/18/23 17:59 12
24May2009_12UTC
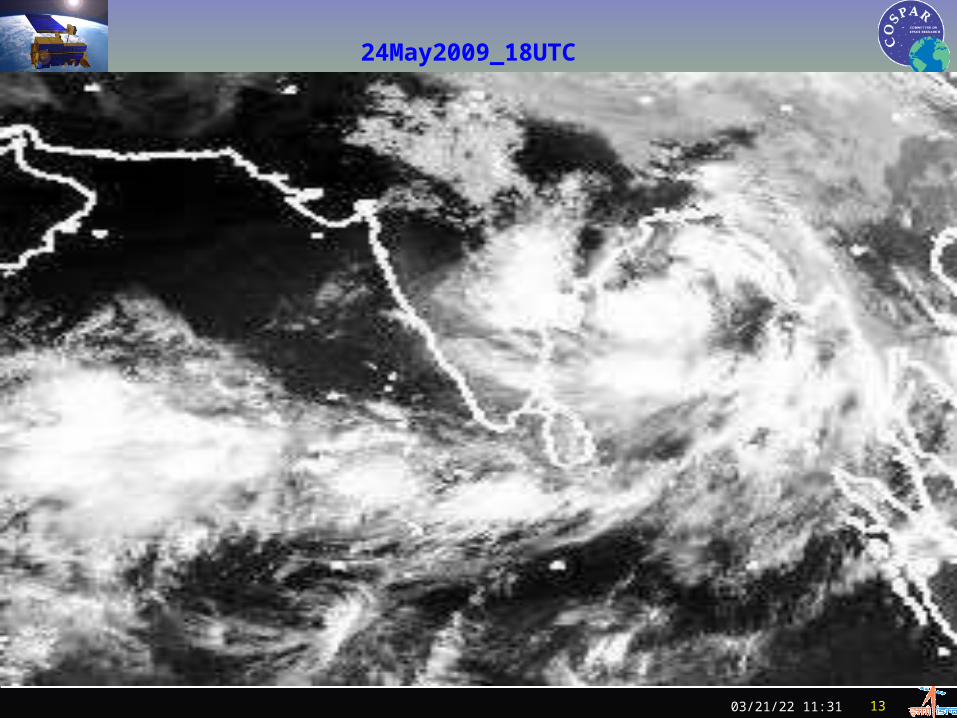
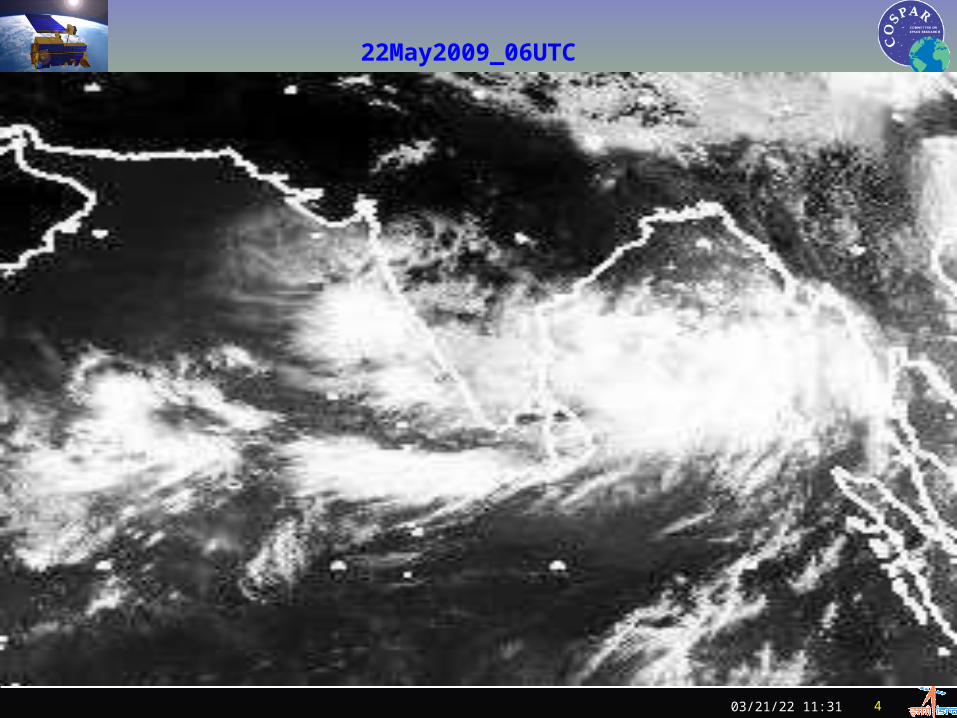
04/18/23 17:59 13
24May2009_18UTC

04/18/23 17:59 14
25May2009_00UTC

04/18/23 17:59 15
25May2009_06UTC

04/18/23 17:59 16
25May2009_12UTC

04/18/23 17:59 17
25May2009_18UTC

04/18/23 17:59 18
26May2009_00UTC
04/18/23 17:59 19
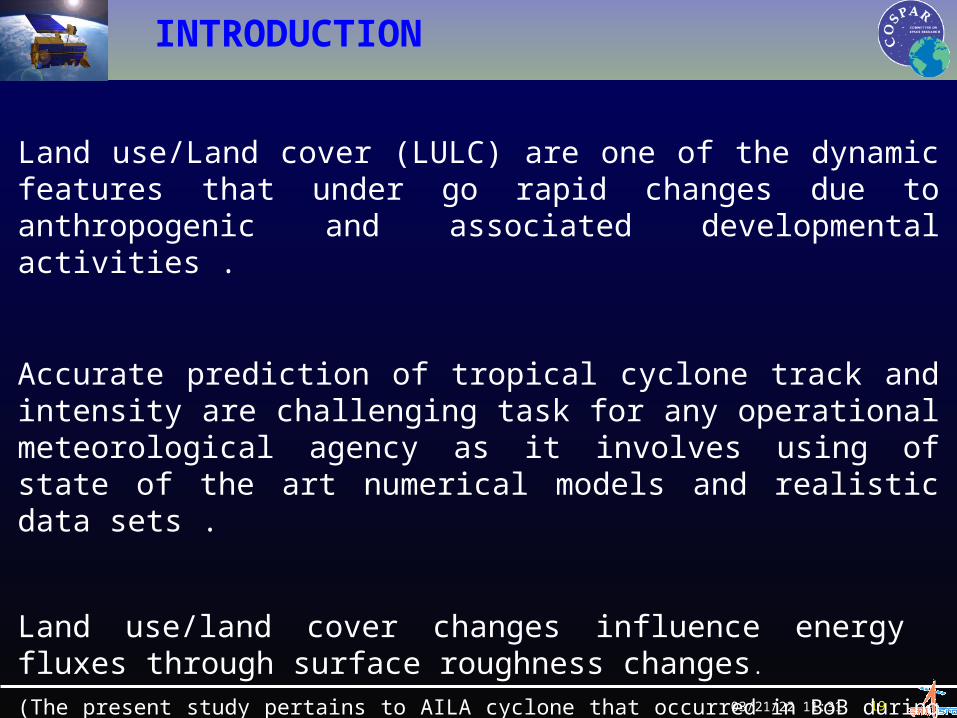
Land use/Land cover (LULC) are one of the dynamic features that under go rapid changes due to anthropogenic and associated developmental activities .
Accurate prediction of tropical cyclone track and intensity are challenging task for any operational meteorological agency as it involves using of state of the art numerical models and realistic data sets .
Land use/land cover changes influence energy fluxes through surface roughness changes.
(The present study pertains to AILA cyclone that occurred in BoB during May 22 – 25, 2009.)
INTRODUCTION

04/18/23 17:59 20
Comparison of USGS & AWiFS derived classified data

04/18/23 17:59 21
AWiFS derived Land use/ Land cover data input for NWP AWiFS derived Land use/ Land cover data input for NWP modelsmodels
So far USGS derived global coverage with resolution of 1 degree,30,10,5,2 minutes and 30 seconds has been used to run Mesoscale Models. (1993 AVHRR based)
IRS-AWiFS derived LU/LC with 56 m resolution have been scaled to different resolutions & Indian region is replaced with AWiFS derived data and made compatible to mesoscale model run.
WRF/MM5 compatible inputs provided to CTCZ program, NCMRWF, SHAR Centre, IMD for evaluation and operational use.
As per user feedback, model output provides better results with the use of AWiFS derived LULC layer instead of using USGS derived LULC layers.
Fig1-30sec USGS LU/LC Fig 2 -30s AWiFS derived LU/LC
USGS-LULC AWiFS -LULC
Fig-3 Comparison of 2min Global USGS LU/LC and AWiFS derived Indian region replaced USGS data
Deciduous Forest / ScrubEvergreen Forest Water
Fig4 - SHAR MM5 Prediction of Acc. Rain (mm) on 21 June 2008 using (a) Land use USGS(2min) and (b) AWiFS derived Land use (2min)
Prediction between 22nd June 2008 06-12 UTC
(a) (b)

04/18/23 17:59 22
IRS – P6 ( RESOURCESAT-1)
Payloads LISS-IV LISS-III AWiFS
Spatial resolution (m)
5.8 23.5 56
Swath (Km) 23.9 (MX mode)
70.3 (PAN mode)
141 740
Spectral Bands (micron)
0.52 – 0.59
0.62 – 0.68
0.77 – 0.86
0.52 – 0.59
0.62 – 0.68
0.77 – 0.86
1.55 – 1.70
0.52 – 0.59
0.62 – 0.68
0.77 – 0.86
1.55 – 1.70
Quantization (bits) 7 7 10

04/18/23 17:59 23
MM5 Flow Chart
04/18/23 17:59 24
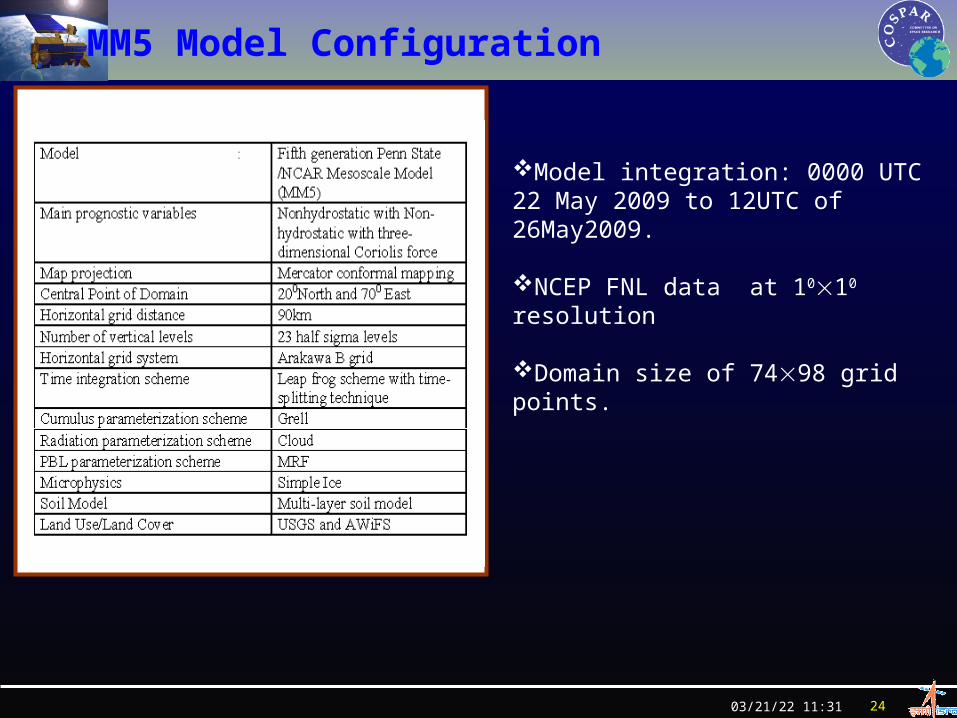
MM5 Model Configuration
Model integration: 0000 UTC 22 May 2009 to 12UTC of 26May2009.
NCEP FNL data at 1010 resolution
Domain size of 7498 grid points.

04/18/23 17:59 25
22May2009_12UTC_PSLV_850hPa
USGS AWiFS

04/18/23 17:59 26
23May2009_12UTC_PSLV_850hPa
USGS AWiFS
04/18/23 17:59 27
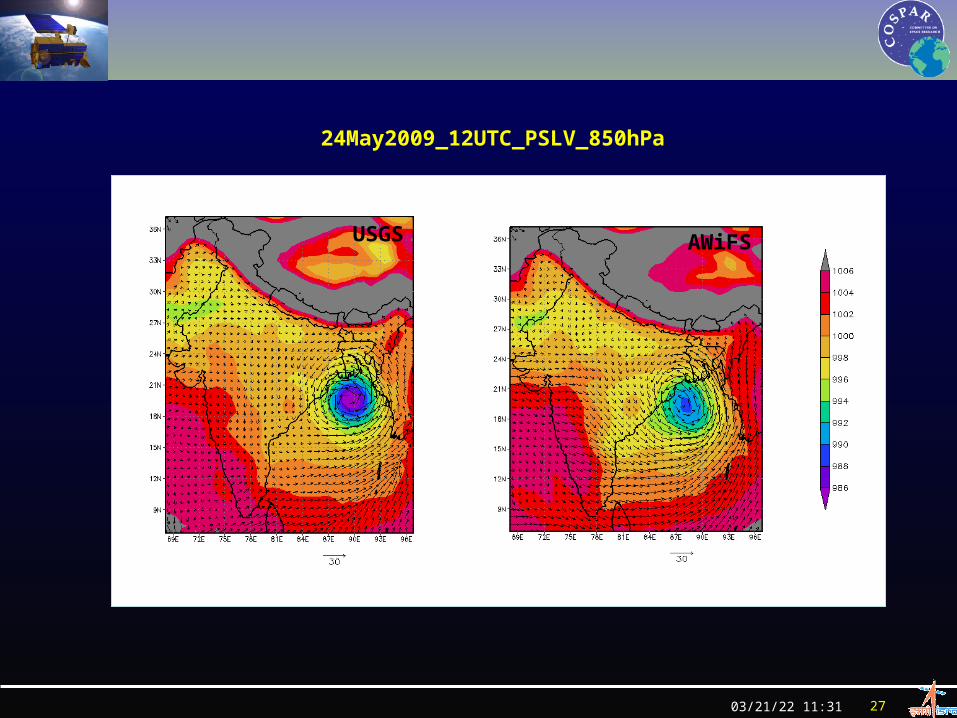
24May2009_12UTC_PSLV_850hPa
USGS AWiFS

04/18/23 17:59 28
25May2009_09UTC_PSLV_850hPa
USGS AWiFS

04/18/23 17:59 29
26May2009_09UTC_PSLV_850hPa
USGS AWiFS

04/18/23 17:59 30
Comparison between Model and Actual Track

04/18/23 17:59 31
Comparison between Model and Actual Observation of Central Pressure & Wind Speed

04/18/23 17:59 32
The movement of the system was better simulated in terms of direction and intensity with AWiFS LULC data compared to that in USGS. This has been attributed to better representation of surface roughness and energy fluxes with the current land use/land cover data set.
The intensity of tropical cyclones in terms of MSLP and maximum sustainable wind illustrates that USGS has a tendency to intensify the system earlier than actual observation. AWiFS gives reasonably good results for the time variation of MSLP and wind matching with the observations.
Conclusions

04/18/23 17:59 33