12 Years Later: The Resilience in Survivors of Katrina (RISK) Project€¦ · 20-09-2019 ·...
46
JEAN RHODES FRANK L. BOYDEN PROFESSOR UNIVERSITY OF MASSACHUSETTS, BOSTON CHANGING CLIMATE, CHANGE HEALTH FORUM SEPTEMBER 20, 2019 12 Years Later: The Resilience in Survivors of Katrina (RISK) Project
Transcript of 12 Years Later: The Resilience in Survivors of Katrina (RISK) Project€¦ · 20-09-2019 ·...

J E A N R H O D E SF R A N K L . B O Y D E N P R O F E S S O R
U N I V E R S I T Y O F M A S S A C H U S E T T S , B O S T O N
C H A N G I N G C L I M A T E , C H A N G E H E A L T H F O R U MS E P T E M B E R 2 0 , 2 0 1 9
12 Years Later: The Resilience in Survivors of Katrina
(RISK) Project

Plan for the Talk
Overview of the project and key findings
What does recovery look like 12-14 years later?
Some thoughts about disasters, climate change and social science research.

Funding Support
NICHD (NIH)▪ RO1 HD046162 PO1 116353▪ R01 HD057599
National Science Foundation (NSF)
MacArthur Foundation
Robert Wood Johnson Foundation Investigator Awards in Health Care Policy
Harvard Catalyst National Center for Research Resources and the National
Center for Advancing Translational Sciences, NIH Award 8UL1TR000170-05

Opening Doors Demonstration Project

Becoming a Disaster Researcher

RISK sample baseline characteristics
To qualify for the Opening Doors Demonstration in Louisiana, students had to be:
Between the ages of 18-34
Parent of at least one dependent child under the age of 18
Family income < 200% of poverty level
GED or High School diploma
No degree or occupational certificate from an accredited college or university

RISK sample baseline characteristics
Baseline characteristics of the Opening Doors Louisiana sample:
92% female
85% black
Average age 26
Average age of children 3 years
98% had ever worked
52% currently employed
71% receiving government benefits (mostly food stamps)
Median monthly income ($619.85)
A disproportionate number (40%) come from the 9th Ward

Hurricane Katrina – 2005 Timeline
August 25th
Arrives in the Gulf of Mexico
August 28th
Increased to Category 5 with winds at 175 mph
Mandatory evacuation of New Orleans City
Approx. 85% of New Orleans City evacuates (Groen and Polivka
2010)
August 29th
Landfall in Louisiana as Category 3 with winds at ~125 mph
53 levee breaches produce extensive flooding
September 2nd
80% of New Orleans City flooded, with water reaching 20 feet


Hurricane Katrina - overview
> 1,800 deaths The majority of which were in Louisiana
Destroyed 217,000 homes 60% of housing stock in the City of New Orleans was destroyed 30% of housing stock in the New Orleans MSA (city and inner
suburbs) was destroyed
Displaced > 600,000 people in Louisiana > 85% of population in the City of New Orleans evacuated The City of New Orleans lost 29.1% of its population between
2000 and 2010


Resilience in Survivors of Katrina Study (RISK)
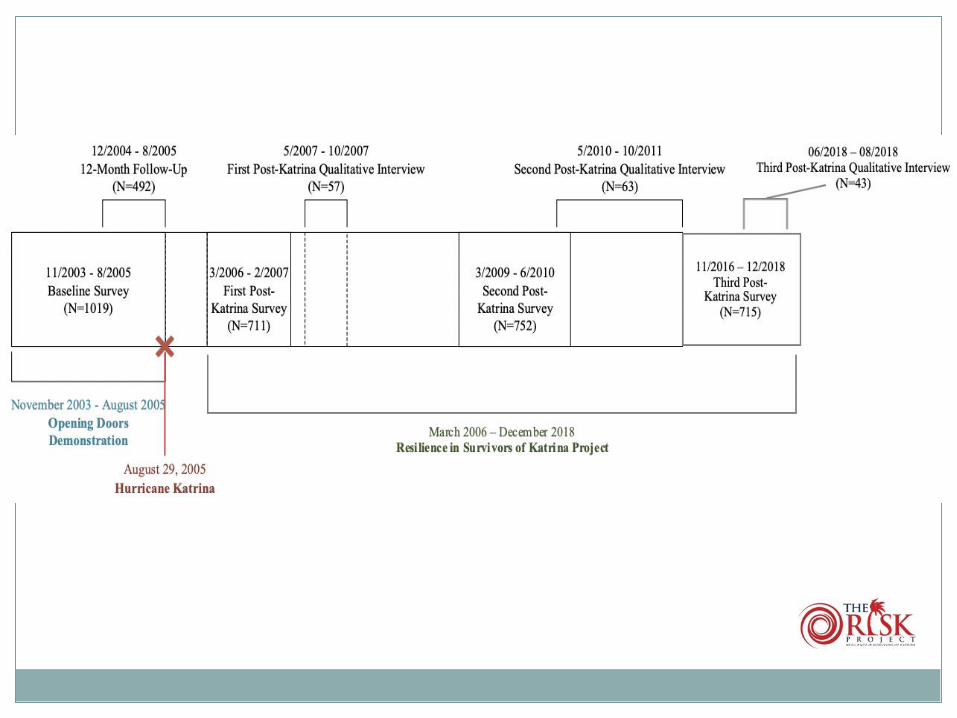

Response Rates by Wave
Wave Baseline 2004-5
12M 2005 PK1 2005-6 PK2 2009-10 PK3 2016-2018
N 1019 492 711 752 715
Response rate (69.8%) (71.7%) (75.9%)
(dropped men)
Of the original 1, 019 respondents, 938 or 92.1% of respondents were surveyed at least once since baseline.9 respondents had died by 2016-2018.
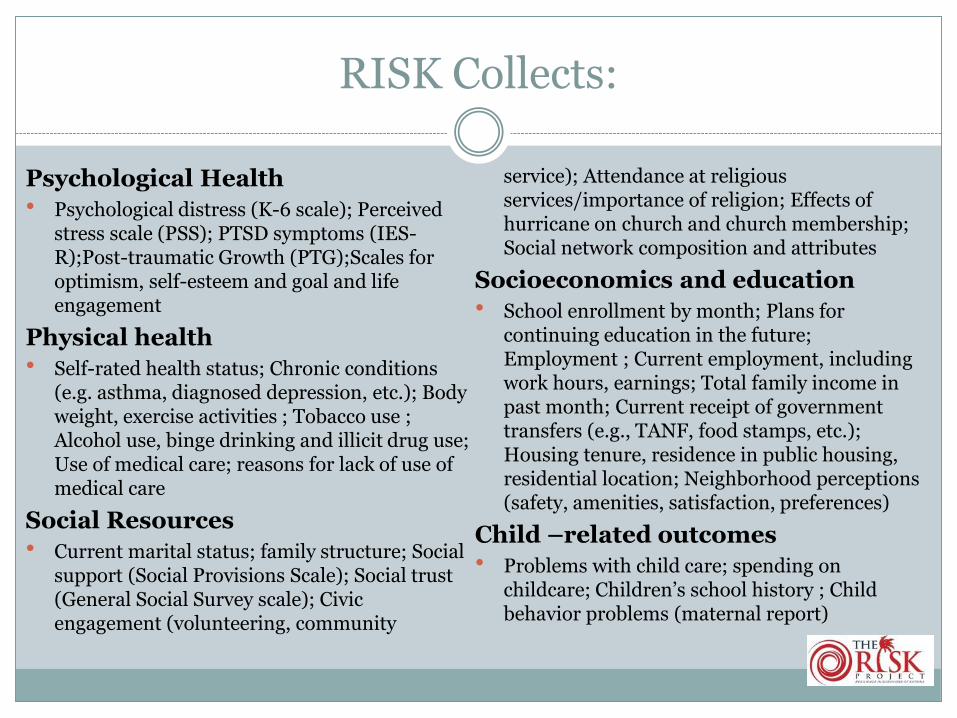
RISK Collects:
Psychological Health Psychological distress (K-6 scale); Perceived
stress scale (PSS); PTSD symptoms (IES-R);Post-traumatic Growth (PTG);Scales for optimism, self-esteem and goal and life engagement
Physical health Self-rated health status; Chronic conditions
(e.g. asthma, diagnosed depression, etc.); Body weight, exercise activities ; Tobacco use ; Alcohol use, binge drinking and illicit drug use; Use of medical care; reasons for lack of use of medical care
Social Resources Current marital status; family structure; Social
support (Social Provisions Scale); Social trust (General Social Survey scale); Civic engagement (volunteering, community
service); Attendance at religious services/importance of religion; Effects of hurricane on church and church membership; Social network composition and attributes
Socioeconomics and education School enrollment by month; Plans for
continuing education in the future; Employment ; Current employment, including work hours, earnings; Total family income in past month; Current receipt of government transfers (e.g., TANF, food stamps, etc.); Housing tenure, residence in public housing, residential location; Neighborhood perceptions (safety, amenities, satisfaction, preferences)
Child –related outcomes Problems with child care; spending on
childcare; Children’s school history ; Child behavior problems (maternal report)

Gaps in the Literature
pre-disaster data
Health and Mental Health
multi-wave longitudinal research
multilevel research
mixed-methods research

Studies to DateAvailable at www.riskproject.org
College Re-enrollment Pet Loss Pre-disaster social
support Child-related stressors Natural mentors Intimate relationships Interviewer race Decisions to evacuate Resilience Trajectories Children’s Functioning Combining Quantitative
and Qualitative Methods
Religion Barriers to Community
College Completion Geographic Mobility Relocation Decision
Making Neighborhood Attainment Employment Trajectories Changes in BMI Post Traumatic Growth Conservation of Resources
Theory Transition to Adulthood

Trauma Exposure
Katrina Traumas Percent
Did not have enough fresh water to drink 26
Did not have enough food to eat 35
Felt your life was in danger 32
Didn’t have medicine you needed 32
Needed medical care and couldn’t get it 30
With a family member who needed medical care and could not get it. 33
Didn’t know if child/children were safe 23
Didn’t know if other family members were safe 77
Were any of your relatives or close friends killed because of
Hurricane Katrina or Rita?31
Mean # Katrina Traumas 3.14


Additional Measures of Exposure to Katrina
Home Damage
Flood Depth

Exposure
The six items most strongly associated with poor functioning were bereavement
property loss
pet loss
lack of food
lack of medicine
not evacuating
Chan, C. & Rhodes, J. (2014). Measuring exposure in Hurricane Katrina: A meta-analysis and an integrative data analysis. PLOS ONE. Vol. 9 Issue 4, p1-15. 15p. DOI: 10.1371/journal.pone.0092899.

Voices of Katrina (truncated)
IT WAS VERY DEVASTING. ESPECIALLY IN NOT HAVING FOOD OR WATER
MY DAD WAS ON EMERGENCY RESPONSE TEAM AND WE DIDN'T KNOW WHERE HE WAS
HAD A BABY IT WAS HARD. HELICOPTERS DIDN'T PICK THEM UP WERE STRANDED ON THE ROOF
IT WAS HORRIBLE FOR YOU BECAUSE MY MOM WAS TRAPPED IN THE ATTIC FOR 2-3 DAYS
WE WERE STRANDED ABOUT 2 DAYS WITH MY 3 KIDS IN OUR CAR BECAUSE THE TRAFFIC
IT WASA LIVING HELL/NOT HAVING ANYTHING TO EAT OR DRINK/WATCHING PEOPLE SUFFER
IT WAS TERRIBLE/SLEEP ON THE STREET SLEPT IN THE CAR FOR ONE NITE
BABY WAS BORN AT 26 WEEKS ON ROOF OF HOUSE SURROUNDED BY WATER
IT WAS VERY SAD, I HAD FAMILY MEMBERS WHO NEEDED MEDICINES AND THEY COULD NOT GET
I WAS HYSTERICAL, DIDN'T SLEEP FOR FIVE DAYS, WAS ON A BRIDGE, TERRIFIED FOR MY LIFE

Health-related research
Post-traumatic stress disorder symptoms and health Avoidance based coping predicted asthma attacks
Intrusive reminders predicted Migraine/frequent headache
Arcaya, M., Lowe, S., Asad, A.L, Subramanian, S.V., Waters, M.C., & Rhodes, J. (2017). Association of Post-Traumatic Stress Disorder Symptoms with Migraine and Headache after a Natural Disaster. Health Psychology. .
Arcaya, M. C., Lowe, S. R., Rhodes, J. E., Lowe, Waters, M. C., & Subramanian, S. V.(2014). Association of PTSD symptoms with asthma attacks among Hurricane Katrina survivors. Journal of Traumatic Stress

0
10
20
30
40
50
60
70
0 2 4 6 8 10 12 14
Perc
en
t (%
)
Years since baseline
Back pain
Digestive problems
Migraines or headaches
Hurricane Katrina
Physical Health trajectories

0
10
20
30
40
50
60
70
80
0 2 4 6 8 10 12 14
Per
cen
t (%
)
Years since baseline
Poor or fair
Good
Very good or
excellent
Hurricane
Percent reporting poor or fair, good, and very good or excellent health in each survey
Self Rated Physical Health

Neighborhood effects on health

New Orleans


Neighborhood effects on BMI
Participants moved to areas that were 1.5 standard deviations (SD) more sprawling than New Orleans, on average.
Each SD change in sprawl was associated with 1.49 unit increase in BMI
Arcaya, M. C., Subramanian, S. V., Rhodes, J. E., & Waters, M. C. (2014). The role of health in predicting moves to poor neighborhoods among Hurricane Katrina survivors. Proceedings of the National Academy of Science, 111(46), 16246-16253

Short- and Long-term Mental Health
PTSS – Post-Traumatic Stress Symptoms (IES-R)
PD – Psychological Distress (Kessler-6)
SMI – Serious Mental Illness (Kessler-6)

1-3 Years Later: Mental health effects
Prevalence of serious mental illness doubled from 6.9% to 13.8%
Nearly half (47.9%) of respondents exhibited probable PTSD post Katrina.
Lowe, S. R., & Rhodes, J.E.(2013). Trajectories of psychological distress among low-income,female survivors of Hurricane Katrina. American Journal of Orthopsychiatry, 83(2-3), 398-412.

Six Trajectory Solution:1-3 years
0
4
8
12
16
20
Time 1: Pre-Katrina Time 2: 1 Year Post-Katrina Time 3: 3 Years Post-Katrina
Increased, 3.9%
Delayed, 4.5%
Decreased, 3.9%
Coping, 22.2%
Improved, 3.2%
Resilient, 62.4%

Key Finding 1:
The Role of Pre-Disaster Functioning
0
4
8
12
16
20
Time 1: Pre-Katrina Time 2: 1 Year Post-Katrina Time 3: 3 Years Post-Katrina
Increased, 3.9%
Coping, 22.2%
Resilient, 62.4%

Predictors of Resilience vs. Other Trajectories
Some of (but not all) the “usual suspects”
Pre-Katrina mental health
Exposure to fewer hurricane-related stressors
Fewer experiences of bereavement
Higher social support

5 Years Later Findings
Predictors of PD and PTSD
Katrina-related home damage
Exposure to traumatic events
Lower earnings
Less social support
Paxson, C., Rhodes, J., Waters, M. & Fussell, E. (2012). Five years later: Recovery from posttraumatic stress and psychological distress among low-income mothers affected by Hurricane Katrina. Social Science and Medicine, 74(2), 150-157

12 Years Later Findings (N = 438)
Raker et al. (2019). Twelve years later: Recovery from posttraumatic stress and psychological distress among low-income mothers affected by Hurricane Katrina. Manuscript under review)

Within Respondent Transition in PD (n=438)

Within Respondent Transition in PTSS (n=438)

Results – 12 Year Follow-Up (2016-2018)
Multinomial Logistic Regression: For each wave, relative risk ratios of (1) PTSS alone, (2) PD alone, & (3) PTSS and PD, relative to having neither PTSS nor PD.
No relationship between sociodemographic variables and PTSS and PD in 2016-2018
Time to follow-up (months); baseline: age, partnership status, race, number of children, earnings before hurricane

Results – Third Follow-Up (2016-2018)
Relative to having neither PD nor PTSS, net of other covariates…
Pre-K PD increases risk of PTSS & PD by 4.61 (p.001)
Trauma score increases risk of PTSS & PD by 1.26 (p.05)

Results – Within-Respondent Trajectories
Multinomial Logistic Regression: For each condition, relative risk ratios of (1) never, (2) delayed, (3) recovered, (4) persistent

PTSS Trajectories
Black = 3X more likely to be persistent (vs. never)
Age = 10% more likely to be recovered (vs. never)
Bereavement = 2X more likely to be persistent (versus never)
Trauma Score = 15% more likely to be persistent (vs recovered or incident)
Pre-K PD = 3x increased likelihood of all trajectories (vs. never)
Home damage = no associations

Conclusions (12 -13 years out)
Mental health problems declined but remained high in our sample
1 in 6 have PTSS 12 years later
At each wave, Pre-K PD and Traumatic Events were strongest predictors of PTSS & PD
Housing damage was very consequential early on for PTSS but not in long-term for either PTSS or PD
Thank you!
Riskproject.org