US010266485B2 ( 12 ) United States Patent ( 10 ) Patent No ...

US007596521B2
(12) United States Patent (10) Patent No.: US 7,596,521 B2 Lepman (45) Date of Patent: Sep. 29, 2009
(54) PROCESS FOR DETERMINING OBJECT 6,092,064 A 7/2000 Aggarwal et al. LEVEL PROFITABILITY 6,098,070 A * 8/2000 Maxwell ..................... 707/102
6,144,893 A * 1 1/2000 Van Der Vegt et al. ...... TOOf 108 (75) Inventor: Richard Tad Lepman, London (GB) 6,154,731. A 1 1/2000 Monks et al.
6.292,811 B1* 9/2001 Clancey et al. .............. 71.5/210 6,360,210 B1 3/2002 Wallman
(73) Assignee: Berkeley *EOR, Berkeley, CA (US) 6.826,538 B1 * 1 1/2004 Kalyan et al. .................. 705/7 c - r 6,882,538 B1 * 4/2005 Frisch .............. ... 361 (728
(*) Notice: Subject to any disclaimer, the term of this 7,162,689 B2 * 1/2007 Demers et al. .............. 715/227 patent is extended or adjusted under 35 7,231,082 B2 * 6/2007 Lenoir .............. ... 382,154 U.S.C. 154(b) by 301 days. 7.379,908 B2 * 5/2008 Clancey et al. ................ 705/35
(21) Appl. No.: 11/354,798 OTHER PUBLICATIONS
(22) Filed: Feb. 15, 2006 Price et al., "College Accounting”. Glencoe Macmilan/McGraw 9 Hill, Seventh Edition, 1994, pp. 28-41, 529-531, 966,982.*
O O Chan, DKC; A document-driven approach to database report genera (65) Prior Publication Data tion; Aug. 26, 1998; pp. 925-930; XPO10296617.
US 2006/O178960 A1 Aug. 10, 2006 Gupta, VR: An Introduction to Data Warehousing; Aug. 1997; XPOO2204504.
Related U.S. Application Data * cited by examiner
(63) Style apps No. 09/545,628, filed on Primary Examiner Andrew Joseph Rudy pr. 1, s (74) Attorney, Agent, or Firm—Kelly Lowry & Kelley, LLP
(60) Provisional application No. 60/128,769, filed on Apr. 9, 1999. (57) ABSTRACT
(51) Int. Cl. A process for determining object level profitability includes G06O 40/00 (2006.01) the steps of (1) preparing information to be accessed elec
(52) U.S. Cl. ........................................... 705/35; 705/38 tronically, (2) establishing rules for processing the prepared 58) Field of Classification Search ................... 705/35 information, (3) calculating at least one marginal value of (58) s 9. 9.
705/36 R. 37, 38 profit using established rules as applied to a selected set of See application file for complete search history. prepared information, (4) calculating a fully absorbed value
of profit adjustment using established rules as applied to the (56) References Cited selected set of prepared information, and (5) combining the at
U.S. PATENT DOCUMENTS
5,446,890 A 8, 1995 Renslo et al. 5,615,109 A 3, 1997 Eder 5,712,987 A 1/1998 Waits et al. 5,721,831 A 2f1998 Waits et al. 5,721,903. A 2f1998 Anand et al. 5.999,914 A * 12/1999 Blinn et al. ................... 705/26 6,026,382 A 2, 2000 Kalthoff
21
M A PRCNG R
G N EVENT
COSTING
M O D REVENUES E L S
20
22
N
PROVISIONING
24
least one marginal value of profit and fully absorbed value of profit adjustment to create a measure for object level profit ability. The inventive process gives management profit mea sures tailored to its need for accurate decision oriented profit information required to manage a large organization based on profit measurement.
32 Claims, 12 Drawing Sheets
- 25 ALLOCATIONMODEL
-1N-N INDIRECT COSTING
DETALED PROFIT MEASURE
26
27

U.S. Patent Sep. 29, 2009 Sheet 1 of 12 US 7,596,521 B2
CUSTOMER
LEDGER ORGANIZATION
AGGREGATION EXTRAPOLATION
FIG. PRIOR ART
25 ALLOCATION MODEL 1. 21 -1N-N
FUNDS TRANSFER INDIRECT PRCING COSTING
M A R G
22 26 N EVENT A COSTING L N DETALED
PROFIT g NON-INTEREST MEASURE D REVENUES E 27 L S
PROVISIONING
24
FIG. 2 20

U.S. Patent Sep. 29, 2009 Sheet 2 of 12 US 7,596,521 B2
ORGANIZATION PRODUCT CUSTOMER re NS -> N. u-r1-1 WO
ae OBJECT GENERALLEDGER e SOR'S 32
OBJECT ORIENTED EVENT
33
FIG. 3
PROCESSING OUTPUT N
OBJEC
43-1 ATTRIBUTES N EVENT
ATTRIBUTES
ORGANIZATION
44 FIVE 49 ANALYTICAL V. N. \
FINANCIAL PROCESSES El) DETALED STATEMENT FOR OBJECT YOE RadPROFITABILITY
45-1 ATTRIBUTES PROFIT E DAA CALCULATION / P PRODUCT
CUSTOMER
PROFIT FACTORS
RULE 47 MAPPING FIG. 4
46

U.S. Patent Sep. 29, 2009 Sheet 3 of 12 US 7,596,521 B2
POPULATE 50 DATABASE
MANTAN 51 RULES
52
CAL CULATEN CALCULATE OR CALCULATE DE CALCULATE P
CALCULATEE 56
CALCULATE OBJECT 57 PROFIT
NO LAST 58 OBJECT?
YES
FIG. 5

U.S. Patent Sep. 29, 2009 Sheet 4 of 12 US 7,596,521 B2
START POPULATE DATABASE
DATABASE INITIALIZATION
60
EC OBJECT
ATTRIBUTES 61
ECL EVENT
A TRIBUTES 62
ECL FINANCIAL ATTRIBUTES
63
CALCULATE & LOAD FUNDS TRANSFER TREATMENTRATES
64
FIG. 6

U.S. Patent Sep. 29, 2009 Sheet 5 of 12 US 7,596,521 B2
START MANTAIN RULES
70 SPECIFY GROUPNGS
SPECIFY CALCULATION 71 PARAMETERS
72
FIG. 7

U.S. Patent Sep. 29, 2009 Sheet 7 of 12 US 7,596,521 B2
START OR CALCULATION
TYPE OR CALCULATION
TYPE OR CALCULATION
TYPE OR CALCULATION
TYPE IV OR CALCULATON
TYPE V OR CALCULATION
FIG. 9

U.S. Patent Sep. 29, 2009 Sheet 8 of 12 US 7,596,521 B2
START DE CALCULATION
TYPE DE CALCULATION
TYPE I DE CALCULATION
TYPE I DE CALCULATION
TYPE IVDE CALCULATION
TYPE V DE CALCULATION
FIG 10

U.S. Patent Sep. 29, 2009 Sheet 9 of 12 US 7,596,521 B2
START P CALCULATION
TYPE P CALCULATION
TYPE P CALCULATION
TYPE IP CAL CULATION
TYPE IV P CALCULATION
TYPE V P CALCULATION
FIG 11

U.S. Patent Sep. 29, 2009 Sheet 10 of 12 US 7,596,521 B2
START IE CALCULATION
YPE IE CALCULATION
TYPE IE CALCUATION
TYPE IE CALCULATION
TYPE IV E CACULATION
TYPE VE CALCULATION
FIG. 12

U.S. Patent Sep. 29, 2009 Sheet 11 of 12 US 7,596,521 B2
START PROFIT SUMMARY
CALCULATION
CALCULATE OBJECT LEVEL PROFIT
FIG. 13

US 7,596,521 B2 Sheet 12 of 12 Sep. 29, 2009 U.S. Patent

US 7,596,521 B2 1.
PROCESS FOR DETERMINING OBJECT LEVEL PROFITABILITY
RELATED APPLICATION
This application is a continuation application of U.S. patent application Ser. No. 09/545,628, filed Apr. 7, 2000, now abandoned which claims priority from provisional patent application Ser. No. 60/128,769, filed Apr. 9, 1999.
BACKGROUND OF THE INVENTION
The process of measuring profit is an important business activity. Profit measures are the primary basis for understand ing financial performance and value creation in a business. Once a business is owned publicly, an independent review of a firm’s financial position becomes a mandatory process well known as measuring profit according to "generally accepted accounting principles’ (GAAP.) While these standards and regulations are adequate for an external view of a company’s financial condition, the measurement of profit contribution amongst the business is required for proper management of the franchise. Internal financial performance measurement is especially complex for a multi-product, multi-location, and/ or large customer based businesses. The use of internal finan cial performance measures drives most businesses planning processes, management incentive processes and control pro cesses. Many businesses have found that internal profit mea Sures can be consistent with the external financial statement measures. These businesses implement internal accounting processes consistent with external measures using common metrical units similar to a GAAP Financial Statement presen tation—a consistent metric or yard Stick” (i.e. numerically the Sum-of-the-profit-parts equals the whole company’s profit according to GAAP) Many businesses today are struggling to accurately mea
Sure profit contribution at a level necessary to accurately measure profit contribution of individual customer interac tions. The reason for dilemma is found in the manner in which generally accepted accounting principles are applied. Funda mental accounting theory takes lumpy cash flows that occur in the day-to-day management of a business conducted with its customers and transform them into Smoothed income or expense items (known as accruals.) At the end of every profit reporting cycle these income and expense items are consoli dated into a period end balance sheet and income statements. Reports on the state of the business can then be presented by accountants in formats necessary for the independence of ownership and management that is the basis of capital mar kets. Indeed, most businesses today would call its accounting process critical for survival. Unfortunately, the complexity of maintaining an accurate financial accounting process has obscured the measurement of profit contribution at a very detailed level. While the aggregate cash flows of a large company are relatively stable the individual customer-to business cash flows are very volatile. Accounting practice to date has been comfortable with using aggregate cash flow information for the accrual accounting process (10), as illus trated in FIG.1. The accounting process based on aggregates has lead to blindness by businesses of incremental customer profit contribution measures necessary to implement cus tomer level decision making, particularly in large businesses with many millions of customers.
General Ledgers (double entry bookkeeping systems) (11) were early adapters of automated data processing solutions due to the match between computing capabilities of comput ers and the execution of the accounting process. The benefit,
10
15
25
30
35
40
45
50
55
60
65
2 from reduced cost for accounting processes easily justified large expenditures in information processing technology, both in hardware and in software development. The complex ity of today’s general ledger applications and the age of these systems have retarded the innovation of new automated tech niques taking advantage of technological advances in mas sively parallel computing capability.
References describing generally accepted accounting prin ciples and financial performance measurement procedures are listed below, and are incorporated by reference herein: The money market /, Marcia Stigum. 3rd ed. Homewood,
III.: Dow Jones-Irwin, c1990. Money market and bond calculations f, Marcia Stigum and
Franklin L. Robinson. Chicago: Irwin Professional Publ., c1996. Money market calculations: yields, break-evens, and arbi
trage /, Marcia Stigum, in collaboration with John Mann. Homewood, III.: Dow Jones-Irwin, c1981. The money market: myth, reality, and practice / Marcia
Stigum. Homewood, III.: Dow Jones-Irwin, c1978 Quantifying the market risk premium phenomenon for
investment decision making: Sep. 26-27, 1989, New York, N.Y./, Keith P. Ambachtsheer... et al.: edited by William F. Sharpe and Katrina F. Sherrerd; sponsored by the Institute of Chartered Financial Analysts. Charlottesville, Va.: CFA: May be ordered from Association for Investment Management and Research, c1990
Fundamentals of investments /, Gordon J. Alexander, Wil liam F. Sharpe, Jeffery V. Bailey. 2nd ed. Englewood Cliffs, N.J.: Prentice Hall, c1993.
Microeconomics/, Richard G. Lipsey. et al.).9th ed. New York: Harper & Row, c1990.
Economics of the firm: theory and practice /. Arthur A. Thompson, Jr., John P. Formby. 6th ed. Englewood Cliffs, N.J.: Prentice Hall, c1993. The FASB conceptual framework project, 1973-1985: an
analysis /. Pelham Gore. Manchester, UK; New York: Manchester University Press; New York, N.Y., USA: Distrib uted exclusively in the USA and Canada by St. Martin’s Press, c1992.
Statement of financial accounting standards no.5: impact on corporate risk and insurance management /, Robert C. Goshay. Stamford, Conn. Financial Accounting Standards Board of the Financial Accounting Foundation, 1978. Common cents: the ABC performance breakthrough: how
to succeed with activity-based costing /. Peter B. B. Turney. Hillsboro, Oreg.: Cost Technology, 1991. Aguide to the SQL standard; a user's guide to the standard
relational language SQL /Date, C. J. Addison-Wesley Pub. Co., 1987.
Accountants SEC practice manual, Kellogg, Howard L.: Commerce Clearing House, 1971.
Risk theory; the stochastic basis of insurance/, Beard, R.E. (Robert Eric): 3rd ed., Chapman and Hall, 1984.
Practical risk theory for actuaries /, Daykin, C. D. (Chris D.): 1st ed., Chapman & Hall, 1994.
Actuarial mathematics /:2nd ed., Society of Actuaries, 1997.
Objectives and concepts underlying financial statements / United Nations, 1989.
Cost accounting for factory automation / National Asso ciation of Accountants, 1987.
Interest rate risk models: theory and practice f: Glenlake Publ. Co. Fitzroy Dearborn, 1997.
Economic analysis for management decisions, Elliott, Jan Walter: R. D. Irwin, 1973.

US 7,596,521 B2 3
Microeconomic theory / Ferguson, C. E. (Charles E.): 4th ed. R. D. Irwin, 1975.
Planning and measurement in your organization of the future /, Sink, D. Scott. Industrial Engineering and Manage ment Press, 1989.
Economics (, Paul A. Samuelson, William D. Nordhaus. 16th ed. Boston, Mass: Irwin/McGraw-Hill, c1998.
Setting intercorporate pricing policies / Business Interna tional Corporation, New York: Business International Corpo ration, 1973.
Controversies on the theory of the firm, overhead alloca tion, and transfer pricing /, Murry C. Wells, editor. New York: Arno Press, 1980. The transfer pricing problem: a theory for practice?, Robert
G. Eccles. Lexington, Mass.: Lexington Books, 1985. Transfer pricing /. Clive R. Emmanuel and Messaoud
Mehafodi. London; San Diego: Academic Press, 1994. Internal transfer pricing of bank funds /, by Valerie Giar
dini. Rolling Meadows, III.: Bank Administration Institute, 1983.
Transfer pricing: economic, managerial, and accounting principles /, by Clark J. Chandler . . . et al. Washington, D.C.: Tax Management, Inc., 1995.
International intracorporate pricing; non-American sys tems and views, Jeffrey S. Arpan. New York, Praeger Pub lishers, 1971.
There remains, however, a need to resolve profit measures at a detailed level without using analytical models or statisti cal extrapolation. Such a process should utilize rule driven and database measurement processes which will give large scale businesses a lower cost of maintenance and a techno logically scalable tool to measure profit at a level of precision or resolution not possible in prior financial performance mea surement processes. The present invention fulfills this need and provides other related advantages.
SUMMARY OF THE INVENTION
Prior approaches to management’s desire for an accurate measure of individual decisions (incremental or marginal) profit impact have been solved by automating the accounting process for implementing accounting methods. Cash flows are transformed into two parts, a debit part or credit part, according to an accounting rule. Other non-cash accounting rules are implemented to create “accrual debits and credits Smoothing income and expenses and adjusting for future contingencies. (see Management Accounting Theory books or any source of accounting theory, where the balance sheet equation and the consolidation process, the combination of flows and stocks of financial data, are developed.) The first large Scale use of automated computing technology is fre quently found to be the automation of the financial control or accounting processes, since it is easy to develop Software to implement accountancy rules and there were large benefits in staff productivity easily observable. For businesses to observe marginal profit contributions it was necessary to use accounting information and make reasoned conclusion on how to apportion or extrapolate this information into incre mental customer, product or organizational profit detail. (See FIG. 1) What these methods of profit measurement lack are the
adequate level of detail to measure an individual or incremen tal decision's impact on profit. To gain this new level of profit resolution this invention is designed to use micro profit mea Surement rules applied at a granular level consistent with standard accounting practice using a combination of actuarial Science and mathematical set theory. The invention is
10
15
25
30
35
40
45
50
55
60
65
4 designed to utilize massively parallel computing operations using relational database management techniques enabling profit measurement at a level not available today in a large individual customer Scale business. This invention does this through a consistent application of measures to a class of business entities which represent the Smallest common com ponent of profit measurement desired the Profit Object. The invention's method of apportionment of non-object
related profit measures specifies a method which will not change the ordinal or cardinal profit contribution ranking when only marginal profit measures are counted. This speci fication is what makes it possible to apply marginal measure ment rules (see Micro-economic theory literature) with macro economic principles; namely the Sum-of-the-parts equals the whole criterion which is the basis of financial accounting theory and practice. The invention decomposes profit measurement analytical
calculations into five classifications: 1. Marginal profit measures associated with use of the busi
ness balance sheet resources; 2. Marginal measures of non-balance oriented revenues; 3. Marginal cost measures; 4. Marginal measures of expected costs or revenues; and, 5. Apportioned cost measures.
This classification provides for additive profit measures across the five components. The calculation process is designed to be independent across classes 1, 2, 3, & 4 above with the addition of class five to preserve sum-of-the-parts integrity without simultaneous calculations typically found in profit measurement processes. When all five profit measures are summed at the lowest level of profit detail, a consistent set of profit values for all types of aggregations are possible—all profit measurement then originates from the same point in a profit database. The simultaneous use of these five analytical frameworks makes possible a detailed level of profit calcula tion consistent with GAAP.
In particular, the present invention relates to a process for determining object level profitability. In its basic form the process includes the steps of 1. Preparing information to be accessed electronically; 2. Establishing rules for processing the prepared information; 3. Calculating at least one marginal value of profit using
established rules as applied to a selected set of prepared information;
4. Calculating a fully absorbed value of profit adjustment using established rules as applied to the selected set of prepared information; and,
5. Combining the at least one marginal value of profit and fully absorbed value of profit adjustment to create a mea sure for object level of profitability. More specifically in the step of preparing information to be
accessed electronically, the database is prepared, object attributes are extracted, conditioned and loaded into the data base, and financial statement attributes are extracted, condi tioned and loaded into the database. If desired the step may also include extracting, conditioning and loading the event attributes into the database, and calculating funds transfer treatment rates.
In the step of establishing for processing the prepared information for rule establishment providing the information necessary to select objects and perform the correct profit calculus is accomplished. The step of calculating at least one marginal value of profit using established rules as applied to a selected set of prepared information includes calculating net interest, other revenue, direct expense, and/or provision for the selected set of prepared information. Net Interest (NI) is the Summation of interest income, value of funds provided

US 7,596,521 B2 5
and earnings on equity funds used less the Sum of interest expense and cost of funds used. Other Revenues (OR) is a measure of profit contribution from non-interest related sources. Direct Expense (DE) is the profit value reduction due to marginal resource consumption by the object. Provisioning (P) is the expected profit value adjustment for future out comes related to the object. The step of fully absorbed profit adjustment, Indirect
Expense (IE), is an apportioned profit value adjustment for all non-object related resource consumption by the business.
In the step of combining the five profit values, NI+OR DE-P-IE, may be adjusted for taxes and/or object economic value. The foregoing elements of the invention, which have been
explained at a micro elemental level can be advantageously employed in massive amounts and parallel process power. For example, in the macro perspective of the invention the basic steps can be utilized. The present invention gives management profit measures
tailored to its need for accurate decision oriented profit infor mation required to manage a large organization based on profit measurement. This invention gives businesses the abil ity to resolve profit measures at a level of detail necessary for all types of application of profit oriented performance mea Surement.
Other features and advantages of the present invention will become apparent from the following more detailed descrip tion, taken in conjunction with the accompanying drawings which illustrated, by way of example, the principles of the invention.
BRIEF DESCRIPTION OF THE DRAWINGS
The accompanying drawings illustrate the invention. In Such drawings:
FIG. 1 shows existing profit calculation process flow. FIG. 2 shows analytical processing relationships. FIG. 3 shows the inventions information flow. FIG. 4 shows the invention's data relationships. FIG. 5 shows the invention’s process flow. FIG. 6 shows the invention's database preparation process
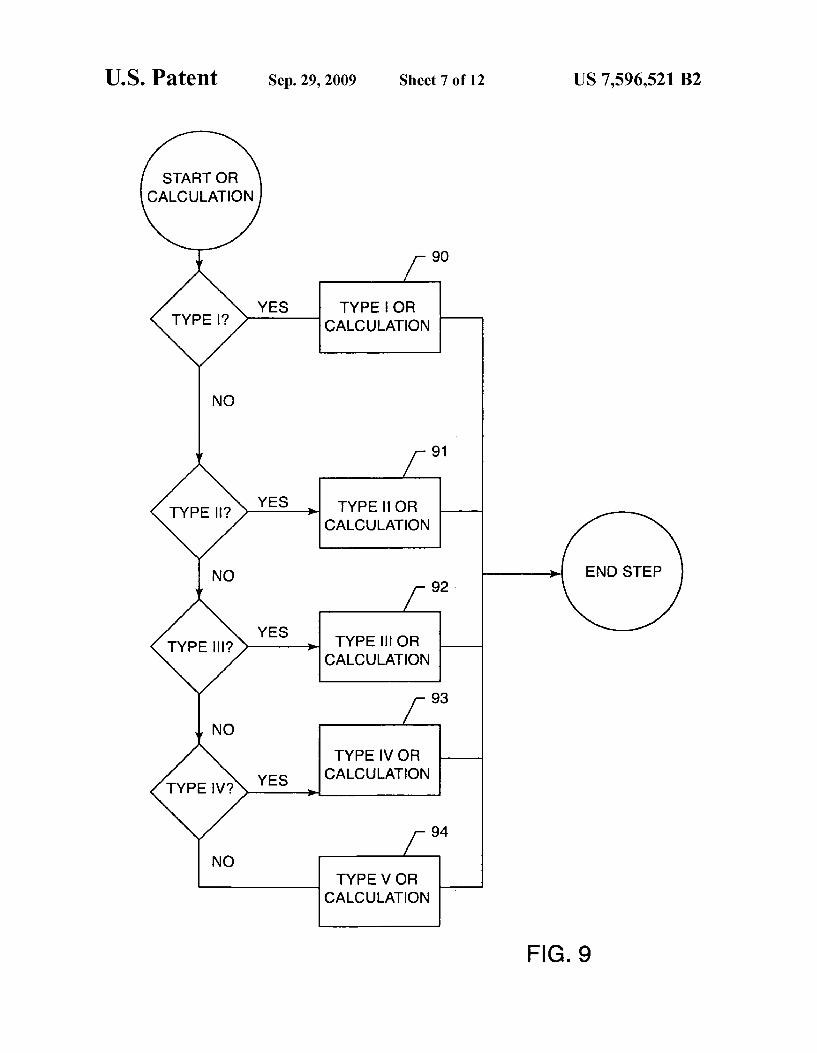
step detail. FIG. 7 shows the rule maintenance process. FIG. 8 shows the net interest measuring process. FIG. 9 shows the other revenue measuring process. FIG. 10 shows the direct expense measuring process. FIG. 11 shows the provision measuring process. FIG. 12 shows the indirect expense measuring process. FIG. 13 shows the profit component aggregation and
adjustment process. FIG. 14 shows a partial relational database schema for an
airline industry example.
DETAILED DESCRIPTION OF THE PREFERRED EMBODIMENT
As shown in the accompanying drawings for purposes of illustration, the present invention is concerned with a detail profit metric (DPM) designed to be a computer database application (i.e. software) for profitability measurement. DPM’s profit measurement system is fundamentally different from the common profit measurement system used by regu lators and public accountancy—yet, it is consistent with gen erally accepted accounting principles.
With reference now to FIGS. 2 and 3, the invention is designed to utilize massively parallel computing operations using relational database management techniques enabling
10
15
25
30
35
40
45
50
55
60
65
6 profit measurement at a level not available today in a large individual customer Scale business. This invention does this through a consistent application of measures (27) to a class of business entities (32) which represent the smallest common component of profit measurement desired the Profit Object. The invention's method of apportionment of non-object
related profit measures (34) specifies a method which will not change the ordinal or cardinal profit contribution ranking when only marginal profit measures are counted. This speci fication is what makes it possible to apply marginal measure ment rules with macro economic principles; namely the Sum of-the-parts equals the whole criterion which is the basis of financial accounting theory and practice. As shown in FIG. 2, the invention decomposes profit mea
Surement analytical calculations into five classifications: 1. Marginal profit measures associated with use of the busi
ness balance sheet resources, also referred to as funds transfer pricing (21);
2. Marginal measures of non-balance oriented revenues, also referred to as non-interest revenues (23);
3. Marginal cost measures, also referred to as event costing (22);
4. Marginal measures of expected costs or revenues, also referred to as provisioning (24); and,
5. Apportioned cost measures and indirect costing, in accor dance with an allocation model of the present invention (26). This classification provides for additive profit measures
across the five components. The calculation process is designed to be independent across classes 1, 2, 3, & 4 above with the addition of class five to preserve Sum-of-the-parts integrity without simultaneous calculations typically found in profit measurement processes. When all five profit measures (49) are summed at the lowest level of profit detail, a consis tent set of profit values for all types of aggregations (30) are possible—all profit measurement then originates from the same point in a profit database. The simultaneous use of these five analytical frameworks makes possible a detailed level of profit calculation consistent with GMP. FIG.3 illustrates DPM data flow: where systems of record
(SORs) (31) data source object (32) and object oriented event (33) data; where General Ledger data sources appor tionment data; and, where event and general ledger data are used with activity based costs (35). DPM is based on object level detail of cash flows, customer events and management profit allocations of profit arising from non-customer related events. More particularly, DPM is based on object level detailed data extracted from the SORs (31), customer object oriented event data (33) and non-SORApportionments (34). DPM provides both marginally (20) and fully absorbed profit measures (25), something traditional “general ledger based profit accounting systems cannot accomplish due to reliance on aggregate debit and creditamounts (10). The differences in measures are directly observable in comparisons of detailed customer (13), product (14) or organizational (15) profit val ues calculated using prior art (12) methods with profit values derived using aggregations (30) of object data, per FIG. 3. More specifically, with reference to FIG.4, in the step of
preparing information to be input (40) to be accessed elec tronically, a database is prepared. Object attributes are extracted, conditioned, and loaded into the database (43), and financial statement attributes are extracted, conditioned and loaded into the database (45). If desired, the method may also include extracting, conditioning and loading the event attributes into the database (44) and calculating funds transfer treatment rates and activity based costing rates (46).

US 7,596,521 B2 7
In the step of establishing for processing (41) the prepared information on how to select objects and perform the correct profit calculus rule mapping (47) is accomplished. The step of calculating (48) at least one marginal value of profit using established rules as applied to a selected set of prepared information includes calculating net interest (NI), other rev enue (OR), direct expense (DE), and/or provision for the selected set of prepared information. Provisioning (P) is expected profit value adjustment for future outcomes related to the object. The step of fully absorbed profit adjustment, indirect expense (IE), is an apportioned profit value adjust ment for a non-object related resource consumption by the business. The foregoing elements of the invention, which have been explained at a micro-elemental level, can be advan tageously employed in massive and parallel processing power (41). The present invention gives businesses the ability to resolve profit measures at a level of detail (49) necessary for all types of applications of profit oriented performance mea surement or detailed profitability data as an output (42) for enabling aggregation (30) to a particular customer, productor organization within a business. The following is a definition of the inputs (attributes or
measurement parameters), the method of processing and the output of the DPM process. Definitions
Object Attributes (43) These are data about the object being measured. Different
businesses have different objects of detailed profit measure ment. Examples of profit measurement objects include an airline using 'seat' as the profit object, an insurance company using a “policy'' object or a bank using an “account’ object— these objects represent the lowest level of detail required to Support consistent internal multi-dimensional internal profit analyses. Types of data attributes associated with these objects include: balances, rates (or interest accrued), product identification, exposures, expected loss frequency, and vari ous dates (e.g., start, finish, rate reset, last payment, next payment, life, etc.)
Event Attributes (44) These data are about events (a resource consuming activ
ity) related to the object being measured. Data found here include object identification, transaction amounts, quantities, event location, event time, counter-party identification, event type (e.g., payments, interest paid or earned, purchases, refunds, etc.) At least one of these attributes must relate the event to at least one Object. Financial Statement Attributes (45)
These are data about the company's financial statement. Data found here include balance sheet and profit statement amounts usually aggregated by the legal or management enti ties that own a group of objects being measured. These data will be current accounting period either actual or planned.
Profit Measurement Parameters (46) These data include parameter values necessary to perform
the object or event level profit calculations. The major clas sifications of these data are:
Funds valuing rates (“Treatment Rates')—DPM’s funds transfer pricing method uses maturity opportunity rates used in valuing each object's marginal use or source of internal funds (balance sheet resources).
Unit Costs—DPM's Direct Expense calculations require unit cost parameters. DPM can calculate unit costs, when unit cost data are not available; in these instances, if the total cost is provided a financial statement attribute
5
10
15
25
30
35
40
45
50
55
60
65
8 and then unit cost is derived by dividing total cost by an appropriate attribute quantity amount.
Allocated Amounts—In both Other Revenue and Indirect Expense calculations this amount is apportioned amongst all objects in a group.
Miscellaneous Calculation Values—Some of DPM's cal culations require non-system of record values. For example, number of days in profit measurement period or equity allocation weighting. These values are known as "modeling parameters.
Amortization Parameters—Interest amortization requires an interest rate and expected life attributes. Straight line and declining balance methods of amortization require expected life values.
Expected Profit Adjustment Measurement Parameters— Provision calculations require appropriate attributes, Such as: expected loss rates, reserve percentages, expo sure factors, recovery rates, default probabilities and collection costs.
Tax Rates Tax rates are required for after-tax profit cal culation. DPM is designed to calculate pre-tax income on a taxable equivalent basis (where an single effective tax rate is all that is required to transform pre-tax income into after tax earnings.)
Profit Measurement Rule Specification DPM’s processing approach is to combine profit measure
ment techniques with (non-modeled) data and calculation parameters. Each application of this calculus is called a rule (47). DPM is designed to allow the user the freedom to asso ciate a group of objects with a rule and to use object-level information in combination with rule parameters to calculate profit values. The DPM invention uses profit measurement rules separate from, but applied to, object data and the use of relational database concepts, giving the user flexibility in both the assignment and depth of definition of measurement rules and measurement resolution. Use of this method is especially Suited for massively parallel computing technol ogy where linear Scaleable capital investment in processing technology is possible vis-a-vis object and event count and rule complexity. The types of calculation (Rule types) are: Funds Treatment Every object with cash flows affecting
a financial statement's balance sheet requires a method of valuing an objects use or source of funds. The com mon name for this approach to valuing is know as “Matched Maturity Funds Transfer Pricing.” DPM uses a canonical representation an object’s funding charac teristics for computational performance. DPM’s meth odology requires effective yield adjustment to eliminate the allocation of interest payable/receivable required by GAAP. A value, based on effective yield adjusted market price (the yield curve), is then determined by DPM for each instance that requires an interest rate transfer pric ing to calculate an object’s marginal Net Interest (NI).
Equity Allocation. In order for precise net interest rev enue or economic value adjusting calculations the amount of equity funds required at an object level must be determined. DPM's equity allocation to the object level calculations may use any of the following methods: simple ratios; regulatory definitions; economic alloca tions based on econometric modeling (see book on Mod ern Portfolio Theory) methodologies; or, as statistically defined allocations.
Balance Sheet Allocations—Complete calculation of Net Interest may require an object level allocation of some financial statement balance sheet amounts.

US 7,596,521 B2 9
Apportionment—In Other Revenue, Provision and Indi rect Expense calculations are applied at the object level using Financial Statement Attributes which are not related directly to an object. These profit adjustments are made so that the sum of all object profit equals the whole enterprise's profit—an important property of DPM’s output. Accountants refer to this profit measurement technique as “full allocation of profit.” DPM’s approach is to pool indirect costs and revenues and then apportion them. Apportionment rules specify how the pool is com pletely allocated to appropriate objects. DPM uses a specific closed form (mathematical formula that require only information known in the current period and no iterative computation) allocation rules.
Amortization—Some types of income or expense are deferred or accrued over multiple periods including and Subsequent to the current accounting period. This is common to accrual accounting methods used in finan cial statement presentation and give rise to timing dif ferences between cash flows and their related profit as presented in a financial Statement in any accounting period. Since DPM is designed to mirror a financial statement’s profit measure it must Support deferral and accrual accounting principles. Amortization methods are included in DPM to reflect these GAAP concepts. DPM’s amortization methods include: interest method of amortization (used for interest income and expense accruals and for deferral of fees that are in lieu of inter est); and, Straight line or declining balance amortization methods (used for cost or income deferrals and capital ized investment depreciation.)
Other Revenue Pricing. In situations where object and event activity can be used to derive object level income or fees DPM provides for the calculation of these drivers of profitability in Other Revenue profit calculations. These calculations take the mathematical form of a lin ear combination of event or object values and modeled coefficients.
Direct Expense Calculation of object profit adjustment due to object related activity requires rules that take the form of linear combinations of eventor object values and modeled coefficients.
Indirect Expense-In situations where expense apportion ment or amortization amounts are aggregated the user may want different rules applied depending on the path (or dimension) of aggregation. These rules allow for multiple profit calculations rules to be applied to derive multiple object level indirect expense amounts.
Provision Adjusting current profit for expected future value changes is known as “actuarial provisioning. The technique is well known by the financial industry’s accounting practice. DPM applies actuarial based meth ods in its object level profit calculations where the Pro vision pre-adjusts profit for contingent or known expo sures to future profit.
Taxable Equivalent Gross-up Profit is usually an after tax measure. Some events or portions of some object profit may be excluded from normal taxation. DPM’s approach is to adjust these pre-tax values so that a sin gular tax rate can be used to convert pre-tax profit into after-tax values, known as taxable equivalent adjust ment. For the purpose of the remaining detailed descrip tion all profit and loss profit measures are tax equivalent amounts (e.g., TEG * Amount.) These rules use object and event attributes to drive an adjustment for each of the five classes of profit amounts to a taxable equivalent basis.
10
15
25
30
35
40
45
50
55
60
65
10 Interest Yield Adjustments—Since DPM can derive profit
for any length of accounting period from daily to annual, the adjustment of cash interest payments and the finan cial statement’s accrual or Smoothed representation of interest related Profit, DPM requires a method for con Verting cash interest amounts to financial statement accrual amounts. DPM implements the mathematical concept of “effective interest rate' conversion to accom plish this type of calculation.
Before the calculation rules can be applied at the object or event level a calculation rule must be associated with an object, designating the methods DPM will use to calculate components of profit at the object level. An object grouping is designed to associate objects having common and defined set of object attributes for similar processing (note that a group may consist of one object). The association of a group of objects with a calculation rule is referred here as a Rule Map (47). Inheritance Functionality
In nature the concept of inheritance is where a descendant receives properties of its predecessors, in computer Science inheritance is defined in "Object Oriented software devel opment theory as the ability to increase function without loss of function using the same data. In DPM the concept of inheritance is applied and in essence it means that an imple mentation can change Rules (change profit calculus) without loosing any profit measurement capabilities of the preceding state(s). This feature allows DPM users a unique ability to apply techniques of differing levels of Sophistication to dif ferent sets of objects according to the trade-off between the value of more accurate object-focused profit measures and the cost of obtaining and populating data and maintaining Rule Maps. The DPM system is designed for Rules to be applied to any
object without loss of integrity of output. This design feature allows the user to incrementally migrate objects to increased measurement precision as justified. This valuable piecewise increase in functionality is possible due to DPM’s combina tion of rules and data in a mathematical set theoretic frame work (41). This approach allows for a relational database management system implementation (42). It is nearly impos sible develop and maintain procedural based software with as much flexibility and with the capability to simultaneously Support the number of calculation permutations required by DPM.
Restatement Functionality Since DPM is a rule based system the ability to restate prior
periods Profit calculations are systematically possible pro viding historical data exists. DPM's design of object level profit measurement enables a unique historical profit restate ment capability. Three features of DPM’s restatement capa bility are: 1. Produces a mathematically consistent time series (i.e. no measurement bias) of object level Profit. DPM restatement functionality is designed to apply the same Rules to all available historical object or event level data.
2. DPM’s restatement functionality preserves object accrual integrity when the object history is restated for different length accounting periods. Implementations of daily, weekly, monthly, quarterly, semi-annual, or annual profit calculations and mixing different periodicity in historical data without loss of analytical integrity.
3. Capable of objects profit history restatement. If a DPM user changes Rules or Rule Maps and/or changes the way a subset of object’s Profit are calculated and if the historical

US 7,596,521 B2 11
data is available per the new set of Rules then the user can restate historical profit measures for these subset of objects.
Processing (see FIG. 5) With reference to FIG. 5, the database is first populated
(50). Rules are maintained (51), as will be more fully dis cussed herein, and the NI, OR, DE, and P are calculated (52-55). Next, the IE is calculated (56) to arrive at a calcula tion of the object profitability (57). This process is repeated for all objects. After the last object (58), the process is finished as the detailed profitability database is obtained. FIGS. 6-13 describe in more detail the steps taken in FIG. 5 in accordance with the present invention. 1. Populate Database (see FIG. 6)
Perform standard database administration actions to ini tialize data for the required calculations: 1. Perform database Initialization (60) 2. Extract, condition & load object attributes (61) 3. Extract, condition & load event attributes (62) 4. Extract, condition & load financial Statement attributes
(63) 5. Calculate and populate NI treatment rate attributes (64). 2. Maintain Object Groups and Rule Maps (SEE FIG. 7)
Populate or edit Rule parameters necessary to perform calculations. Rules definition is by association of specific, non-iterative calculation, as described below, a set of objector event attributes defined as a data filter (see Relational Data Base Management System textbooks). Rules have two pieces: 1. Parameters to drive the object selection or data filter for
calculations (70); and, 2. Parameters specific to the appropriate calculation method
ology (71). An easy-to-use graphical user interface can be used to
maintain these data for all rules (72). The following processing steps, Steps 3 through 6 perform
object and event level profit calculations. Steps 3, 4, 5, and 6 can be processed independently; step 7 requires values derived in step 3, 4, 5, and 6 and therefore occurs sequentially. 3. Calculate Net Interest for All Objects (see FIG. 8)
Net Interest is:
NI=Interest Income-Cost of Funds+Value of Funds-Interest Expense+Earning on Allocated Equity
Correct interest rates for calculation of interest income or expense depend on the length of the profit measurement period. Using actuarial mathematical techniques the book keeping required by GAAP for interest receivables and Pay ables can be avoided in NI calculus. A known technique (see MStigum, Money Markets) to accomplish this adjustment for profit measurement according to GAAP (i.e. accruals) the following calculation is used to convert interest rates: Let
r annualized rate with new compounding factor r annualized rate with old compounding factor m number of old compounding periods per year n number of new compounding periods per year
Then
5
10
15
25
30
35
40
45
50
55
60
65
12 NI Calculation Rule Type I The object balance is either an asset or a liability amount
for Type I calculation. Let
AAB (o)=Average Asset Balance of the object o, ALB (o)=Average Liability Balance of the object o, rate (o.) Effective interest rate for object o, as an asset
balance
rate in (o)-Effective interest rate for object o, as a liability balance
Rt=Treatment rate based on the identified treatment for the objects product attributes
Int Inc (o)=Interest Income of object o, COF (o)-Cost of funds used by object o, Int Exp (o)=Interest Expense for object o, VOF (o)=Value of funds provided by object o,
Then, Int Inc (o.) AAB (o) * rate (o.) {Compute only if object attribute doesn't exist COF (o)=AAB (o) *Rt Int Exp (o.)=ALB (o) * rate iiability (o,) {Compute only if object attribute doesn't exist VOF (o)=ALB (o) * Rt
NI Calculation Rule Type II (81) Let
AB(o,) Average Balances of the object o, rate (o)-Effective interest rate for the corresponding
balance asset or liability Rt(o)=Object o’s product type/group as needed to identify
treatment rate
R(pt(o))-Rate (treatment rate) for objects of this prod uct type? group, given the balance class, and tier
Int Inc(o)=Interest Income of object o, COF (o)=Cost of funds used by object o, Int Exp (o)=Interest Expense for object o, VOF (o)=Value of funds provided by object o, Then, where summations are over the possible balance
variables (class, tier) for the object,
In Inc(o) =XABasic (o) rate assac (o) We,t
{calculate only if object attribute doesn’t exist
COF(o;) = X. A Basset cit) (o;): Rassetct) Rect) (pito)) WC,t
Int Exp(o;) = X. ABuiability cit) (Oi)* rate(iiability cit) (Oi) We,t
{calculate only if object attribute doesn’t exist
VOF(o) = X. ABuiability c.) (O; )* Reliability cit) Rect) (Pt(O)) WC,t

US 7,596,521 B2 13
Allocated Balances
Let Total Amount=Balance Sheet amount to be allocated to
object Rule-Rule for allocating Amount
Then, DPM calculates the allocation to object o to determine the allocated balance:
B(o)=Rule applied to (Total Amount) =The Allocated Balance
Treat this balance as any one of the average balances associ ated with the object, where class is specified by users, tier is “allocated”. Thus, B,(o)is one of the AB(o) defined above.
NI Calculation Rule Type III (82) Let
AB(o,) Average Balances of the object o, rate (o)-Effective interest rate for the corresponding
balance Type, (o)-Object o,’s product and object attributes as
needed to identify treatment R (type, (o))-Rate (treatment rate) for this object's
product type, given the balance class, and tier/tenor Int Inc (o)=Interest Income of object o, COF (o)=Cost of funds used by object o, Int Exp (o)=Interest Expense for object o, VOF (o)=Value of funds provided by object o, Then, where summations are over the possible balance
attributes (state, tier) for the object,
In Inc(o) =XABasic (o) rateasec (o) WC,t
(calculate only if object attribute doesn't exist
COF(o;) = X. ABasset cit) (oi): Rasset cit) (type (Oi)) WC,t
Int Exp(o;) = X. ABuiability cit) (Oi)* rateliability cit) (Oi) WC,t
(calculate only if object attribute doesn't exist
VOF(o;) = X. ABuiability cit)(oi) 8 Rect) (type (oil)) Wet
NI Calculation Rule Type IV (83) Let
AB(o) Average Balances of the object rate (o)-Effective interest rate for the corresponding
balance amounts type (o)-Object o,’s product, object attribute, and
behavior types as needed to identify treatment rate R (type (o))-Rate (treatment rate) for objects of this
product type, balance class, and tier?tenor Int Inc(o)=Interest Income of object o, COF (o)=Cost of funds used by object o,
10
15
25
30
35
40
45
50
55
60
65
14 Int Exp (o)=Interest Expense for object o, VOF (o)=Value of funds provided by object o, Then, where summations are over the possible balance
variables (state, tier) for the object, Int Inc.( o,)=X AB(asset (o,)* rate(asset c)(O.) {calculate only if object attribute doesn’t exist COF(o)=X. AB(asse, (o)* Rasset.) (type,(o,)) Int Exp(o)-X. ABhabha(O.)” rate natina (o,) {calculate only if object attribute doesn’t exist VOF(o)=X ABhabha (O.)* Rciability,t) (type p.a.l. (O)
NI Calculation Rule Type V (84) Any Net Interest calculation that is non-iterative, canoni
cal, and represents the marginal GAAP valuation of an object's balance sheet resource related revenues or expenses for each (o).
Note that in firms that are highly leveraged, the use of COF/VOF separation leads to a significant and volatile piece of NI, the net difference between to sum of COF and the sum of VOF (after adjusting for EOAE per the following section) and the firms total NI. This is known by a banker as “mis match profits arising from the difference intenors' (duration) of the assets and liabilities. If VOF and COFrates are based on matched maturity of objects then the difference between the firms total NI and the sum of the objects is the profit arising from the firm having different duration of balance sheet related objects. Since this profit is not related to a specific object, but the combination of objects in the enterprise, a separate profit measure is appropriate and possible using DPM’s approach. The use of the rules above allow for a novel method of calculating funds transfer pricing, since the rules are based on sets, the processing can be preformed in parallel. Further, since the rules are canonical this approach leads to a computationally efficient method of calculating these types of profit values. NI Calculations of EOAE
Since GAAP financial statement's balance sheet is based on the balancing equation Assets equals Liabilities plus Equity, NI should be adjusted for the value of the Equity resource consumed by each Asset or Liability object. Calcu lating Earnings on Allocated Equity as part of an object’s NI: Four exclusive options are provided for allocating equity to objects. DPM's options are as follows:
Option 1 No calculation of EOAE. Option 2 EOAE calculation based on a simple equity ratio. Option 3 Equity allocation for all assets following industry
standards.
Option 4 Equity allocation using an economic allocation rule, based on object cohorts and modern portfolio theo ry's capital asset pricing model.
Option 1 (85) EOAE(o)=0 Option 2 (86) Let
AB(o,) Average Asset balances of the object of including any allocated asset balances
ER=Equity Ratio R-Treatment Rate for equity
Then, EOAE(o)=R egality * ER : X AB(assert ( o,) where the Summation is taken over all asset balances.

US 7,596,521 B2 15
Option 3 (87) Let
Amount(o)=Amount(s) associated with object a This may be the average asset balances of the object 'o, including any allocated asset balances, or may be an object parameter, etc.
Wit(type(o))=Code needed to identify the weight for object o balances, at the object-type level
W(Wt(type(o)))=determined by the weight code Cap Ratio An appropriate risk-weighted capital ratio cho
Sel
R =Treatment Rate for equity egality
Then, EOAE(o)=R
Ratio where the summation is taken overall balances ofo, if there
are multiple amounts.
* X. Amount(o)* W(Wt(o)) * Cap egality
Option 4 (88) Let
Amount(o.) An amount or amounts related to the object, Such as average balances of the object (denoted AB(e)(O.)
Cohort(o)=The cohort of objects in which object o is a member
Ecohort(o)=The equity allocation rule for the cohort of object o.
This is a linear (two-valued) function that operates on Amount(o) of the form C.--f'Amount(o). R-Treatment Rate(s) for equity for the Amount(o)
value(s)
Then,
EOAE(O) = X. Requity 3: Ecohort (o) (Amounto;))
X. Retuity: a + f3: Amounto;)
where Summation occurs if Amount(o)is a set of values (such as the object and allocated balances related to the object).
4. Calculate Other Revenue for All Objects (see FIG.9) OR Calculation Rule Type I (90) Let
OR-Financial Statement Other Revenue attribute subset OR,(o)=The amount of OR, apportioned to object o, O(OR)=the objects that map to OR. Let M bean OR calculation method, where M is dependent
upon the OR subset under consideration. We then have the following.
If
M(OR)=a “balance' attribute method.
10
15
25
30
35
40
45
50
55
60
65
16 Define
M(OR)(o)=An average balance method for calculating o,’s OR
and
Balance(oil) OR;(o;) = OR; : X. (Balance(oil))
f
where the Summation is over allo, in o, (OR). If
M(OR)=A “count’ method for calculating os OR Define
M(OR)(o)=1 and
1 OR (o;) = OR; :
(count (a) in O (OR))
where the count is over allo, in o, (OR). If
M(OR)="event count, we can define M(OR)(o)=Count of events in profit measurement period
for object o,
and
count of events for object of OR (o;) = OR: X (count of events for object (oil))
where the summation is over allo, in o, (OR). If
M(OR)="event amount”
Define M (OR)(o;) = X. (event amounts for oi) events over the period
and
X. (events amounts for object o;) events over the period
OR;(o;) = OR; : i events over the period
(events amounts for object o;)
where the summation is over all events in o, (OR), and the events are restricted to a class of event type. Then, we have the total OR for objecto given by the sum of these allocations for all sets for which a has an association:
OR(o) so,(o)), Summing over i. As a generalization, these formulas can be written in short
hand where M(OR) is the corresponding function of 'o' above, as:

US 7,596,521 B2 17 18
where C, B are pre-entered values based on event type. For completeness, C.B=0 in the event amount is null.
M (OR)(o) AM=The method of amortization=cash, SL, DB, interest OR (o) = OR; : org M (OR)(oil) AM{amount-Deferral on amount, using method AM, at
i iv -i, 5 timek (=0 if k>life and life=1 if cash basis is selected.) AM{amount-Deferral on amount, using method M, at
this period note that this is at various points of life for and various amounts.
10 Let o; eO(OR;) OR(o)=Total OR apportioned to object o.
M (OR)(o) OR (o;) = X. OR; : - - aie A (OR;)
2. M (OR)(o) Then OR (o;) = Amortized amounts in their first amortization
15 period -- amortized amounts in their higher
OR Calculation Rule Type II (91) amortization periods -- amounts not amortized The formula for OR calculation is given as follows: but apportioned from a pool as in Type I
Let 2O o, Object being considered OR,(o)=OR apportioned to a (if any) from a set OR, We take this step at a time. First, consider the amounts in their Event(t),(o)=The event reflecting the activity of object o, first amortization period. These are calculated as follows,
in the period restricted to a given event type t. using the formula generated in Type II: Amount(Event(o)) An event amount 25 Rev(Evt,(o))=The revenue amount associated with this
event. This is Then OR (o) =XX(Rey (Event (t) (o)) type t i
summed over all the transcations of object i+ assumed to be X; : Count (Event (t), (o)) + 30 of the form B; : Amt (Event(t); (O)) apportioned revenue as in the Type I case.
type t i
xi : Count (Event(t); (oil)) + XX. B, Amt (Event();(o) ' type t i
where C, B are pre-entered values. p OR(o)=Total OR apportioned to object o, 35 X. (OR (o;))
Then OR (o) = (Rey (Event(t); (a)) 22, where the AM methods vary with the event types. We can Summed over all the events of o; + " group the amounts being amortized by their amortization
characteristics. For this purpose, let Pool (L.M)—the pools of appointed revenue as in the Type I case. amounts amortizing in this period for the first time according
to life L and amortization method M. The new amortizing X; : Count (Event (t); (a)) + X. X. -- amounts can be rewritten as follows: f; : Amt (Event(t); (a)) 45
type t i
X (OR (o;)) i New amortized amounts = X. Pool (L. M.) LM
50
OR Calculation Rule Type III (92) Similarly, define Let - Y1 Pool (L, M)=the pools of amounts amortizing in this
o, Obi ect being considered M period for the k" time according to life Land amortiza Os) OR apportioned to the object (if any) from a set 55 tion method M. where Lsk. Event(t),(o)=The events reflecting the activity of object o N.B. any amortization calculation can be u sed if the calcu
vs. i. lation can be derived using known Object Attributes. in the period restricted to a given event type t Amount(Event,(o))=The event amount Then, the total OR for objecto, in this period is computed as Rev(Event,(o))=The revenue amount associated with this 60 follows:
event.
OR(o;) = X. X. xi : Count(Event(t), (oil)) + (8; 8 Ant(Event(t), (oil)) + This is assumed to X. X. | : Count (Event (t), (o)) + typet i
be of the f ; : Amt (E e O the O. type t i f3 mt (Event(t); (O)) 65 XX. Pool (L, M) +

US 7,596,521 B2 19
-continued
X. (OR (oil))
X. X. Pool (L, M) + X. (OR (oil)) LM i k
OR Calculation Rule Type IVI (93) Foregone OR: Let Actual OR for object of OR (o.) CASH AMOUNTS
Let Expected OR for object of OR (o) Then, Foregone OR for object
O; F OR foregone (oil)
= ORected (o;) - ORica (o;) - CASH AMOUNTS
OR Calculation Rule Type V (94) Any Other Revenue calculation that is non-iterative,
canonical, and represents the entire GGAP valuation of non balance sheet resource related revenues or expenses. 5. Calculate Direct Expense for All Objects (see FIG. 10) DE Calculation Rule Type I (100) None directly specified use IE calculation rules (any
type). For each IE rule used in this way, substitute DE(o) for IE(o) in any IE calculations used as DE. DE Calculation Rule Type II (101)
Direct expense will be a variable dependent upon the object and the event being costed. These determine the unit cost to be used and the calculation type, along with the multiplier rule being used if external amounts are needed. Thus, using Sub Scripts to indicate variables used,
DE object event-type unit CoStevent type *
(no. of events of this type in the period) +
amounts taken from an event file--
costs calculated as a percentage of Event Amount
Where the unit costs, and revenue percentage by event type, are all entered by the user as pre-processing inputs. Then,
DEobject X. Pobject event-type event types
where the Summation is over event types. DE Calculation Rule Type II (102)
Dobject,event-type event-sub Funit COStevent type *
(no. of events of this type in the period) +
10
15
25
30
35
40
45
50
55
60
65
20
-continued amounts taken from an event file--
costs calculated as a percentage of
eWent amount
DE Calculation Rule Type IV (103) Two calculations are made, each one using the above cal
culations, processing two independent DE attributes for each object. DE is calculated twice for each object, allowing for comparison of plan to actual values or standard to actual values or any scenario to scenario comparison.
DE Calculation Rule Type V (104) Any Direct Expense calculation that is non-iterative,
canonical, and represents the entire GGAP valuation of costs related to object or sub-object level details.
6. Calculate Provision for All Objects (see FIG. 11) P Calculation Rule Type I (110) The formula for calculating P of Object i is as follows,
where PG(o) denotes the P group in which o, is a member:
P = PG Balance of o; (o;) = PG(o;): of eRPG(oil)
X Balance of k
P Calculation Rule Type II (111) The formula for calculating P of o, is as follows, using the
same symbols as above and RF(o) denotes the expected adjustment factor for o, .
X Balance(oil): RF(o) k
P Calculation Rule Type III (112) The formula for calculating P of object “o, is as follows,
where Pr(o) is a probability for object o, P(o)=Exposure (o,)* Pr(o) * Expected Value Adjustment
(o;): -
Where L is the expected number of reporting periods during the life of o, . P Calculation Rule Type IV (113) The addition of any of the Type I, II or III Prules applicable
to an object i.
P Calculation Rule Type V(114) Any Provision calculation that is non-iterative, canonical,
and represents the entire GGAP valuation of expected costs related to future events, contingencies, timing effects.

US 7,596,521 B2 21
7. Calculate Indirect Expense for All Objects (see FIG. 12) Indirect expense, by its nature is not related directly to an
Object, therefore apportionment techniques are used to allo cate indirect expense to an Object. Any apportionment func tion is allowed as long as it is derivable at the object level using ratios of attributes available at the object level to the summation of this available attribute across all objects receiv ing the apportioned expense. Examples of this type of ratio calculation (the function “F” used in the IE calculation types) 10 a.
Ratio 1: Balance-based apportionment of IE. Define Apportionment ratio using Current Balance of (o). Thus, the allocation of Indirect Expense k becomes 15 (function F(IE)(o) in IE rules below):
IE Current Balance of o; k : X (Current Balance of of) 2O
f
Summed over all objects in groupingj. Ratio 2: Count-based apportionment of IE 25
Thus, the allocation of Indirect Expense k becomes (function F(IE)(o) in IE rules below):
30
IE — * * (count of of in O(IE.)
35
for all objects in grouping. Ratio 3: Revenue-based apportionment of IE
Define NI(o,)+OR(o)=Total Revenue (using NI & OR rules above) for (o). Thus, the allocation of Indirect Expense k 40 becomes (function F(IE)(o) in IE rules below):
NIR (or) + OR (o) ky (NIR (o) + OR (o)) 45
Summed over all objects in grouping Ratio 4: Event Count apportionment of IE Count of events 50
for (o) are restricted to an event type.
Thus, the allocation of Indirect Expense k becomes (function F(IE)(o) in IE rules below): 55
IE count of event for object o; k : X. (count of event for object (oil))
f
60
for some event type, Summed over all objects in grouping. Ratio 5: Transaction Amount apportionment of IE Summa
tion of event amounts for (o), restricted to a event type. 65 Thus, the allocation of Indirect Expense k becomes (function F(IE)(o) in IE rules below):
X. (event amounts for object (oil)) event over the period
IE : X X (event amounts for object (oil)) i event over the period
for Some event type, Summed over all objects in grouping. Ratio 6: Direct Expense apportionment of IE Using DE
rules above for O,.
Thus, the allocation of Indirect Expense k becomes (function F(IE)(o) in IE rules below):
DE (o;) E. : , ky (DEco).
f
Summed over all objects in groupingj. Ratio 7: Normalized (averaged) apportionment of IE
Thus, the allocation of Indirect Expensek becomes in IE rules below:
F(IE)(o)=IE using Ratio 1 F(IE)(o)+IE using Ratio 3 F(IE)(o) +IE using Ratio 6 F(IE)(o)+3.
IE Calculation Rule Type I (120) Indirect expense is apportioned to accounts using one of
the first three apportionment ratios above. Accordingly, using the nomenclatures above,
IE (o;) = (Total IE to be apportioned): y F (IEkoi, k
IE Calculation Rule Type I (121) The rules for partitioning IE and defining corresponding
object groups are based on product and event attributes. The calculation of IE(o) is exactly as described above, and is given by the following, where the F’s are the given apportion ment ratios (any of the seven apportionment ratios are per mitted for any partition O or groupings of objects).
o;eo (IE) F (IE )(o; IE (o;) = IE - I -
oeo (E) k X F (IE)(of)
f
IE Calculation Rule Type III (122) For Indirect Expense before deferral calculations, the pro
cess is similar to that as listed for the Type II Level, where:
IE (o;) = New amounts in their first period of amortization+
Amounts not being amortized (cash basis) +
Amounts in their 2" through last amortization period.

US 7,596,521 B2 23
Since we include non-amortized amounts (cash basis) to be considered as amortized with only one period, this is re written as follows:
IE (o;) = New amounts in their first period of amortization
(including cash-basis) +
Amounts in their 2' through last amortization period.
Note that non-amortized amounts are made to fit this equa tion by considering them to be an amortization of one profit reporting period only. Each IE set can have a different amor tization type or period, though all objects receiving a specific apportionment will share the same amortization Rule. The new amounts to be deferred are computed, therefore, as the following:
Before deferral
added over each set IE to which o, is related.
: k oieo(E)
Each of these terms may be deferred over its amortization period according to any of the amortization rules (cash, straight line, declining balance, or interest amortization cal culations). Since amortization methods may vary by set, we have the following, where AM (L.R.) is used to denote the amortization rule and its life:
o;eo(IE)
IE(o;) = AM, (L. RIE. --All - 1. kilote
k X F(IE)(of) f
To this is added the amounts with remaining amortization life for which amortization was begun in earlier periods.
IE Calculation Rule Type IV (123) Multiple combinations of the any of the above IE type rules
I, II, or III are calculated per object.
IE Calculation Rule Type V (124) Any Indirect Expense apportionment calculation that is
non-iterative, canonical, and represents the GAAP evaluation of indirect costs.
8. Calculate After-Tax Object Profit for All Objects (see FIG. 13)
10
15
25
30
35
40
45
50
55
60
65
24 where, for a two tier taxation system, Effective Tax Rate is calculated as:
Effective Tax Rate=(1-tax rate 2)*(tax rate 1)+tax rate 2.
In the calculation of Effective Tax Rate, this formula assumes the two rates are effective rates which apply to the business conditions (not the nominal statutory rates), and that tax rate can be deducted from income in the calculation of tax rate. Then,
Total Profit= X. Profit (of)
For those companies which use economic profit value cal culations, the formula changes to:
where
and
C.(o), B(o,) are functions for a cohort of objects in which o, is a member, and Amount(o) is given by a rule which maps o, to a data value (Such as balance, or allocated equity) also defined at the cohort level. (A cohort defined here represents a grouping of objects with similar risk characteristics, consistent with Modern Portfolio Theory and the Capital Asset Pricing Model.)
Shareholder Value Add (SVA) is a method financial ana lysts use to adjust profit measures for risk. The idea is to subtract from the profit measure the cost of the equity required to Support whatever object is being measured. Com panies use this risk adjustment measure essentially to burden the profit for risk being taken with the equity funds used by the object. These institutions will classify cohorts of risk and the risk cost equivalent as a percentage of account balance or allocated equity (i.e., “Hurdles').
DPM Example In the airline industry a need for detailed customer profit
ability can be measured using DPM. Here the fundamental object is the seat, allowing consistent profitability values aggregated by route, aircraft type, as well as customer dimen sions using data warehousing technology. The need for detailed customer profitability is being driven by the business impact analysis required to Support loyalty and alliance Stra tegic decisions. The following is a DPM profit calculation for a seat, with real profit measurement parameters simplified (not all aspects of true airline business is demonstrated) and where examples of each type of rule are utilized in DPM processing. Flight: Air101 Date: 7/1f1998 From: London To: New York
Equipment: Boeing 747400 Classes: First (20 Seats); Business (80 Seats); Economy (300
seats)

US 7,596,521 B2 25
Detailed Profit Metric Processing Step 1: Populate Database—assuming a relational database management system and terminology.
Initialize database; Extract, Condition, and Load the following tables:
Planes, Flights, Customers, Employees, Locations: The net balances in
the Planes entity can be maintained by use of DPM amortization IE calculation from the prior period.
Extract, Condition, and Load the following tables: Finan cial Transactions, Events; Manifest (occupant, seat, flight, date attributes);
Extract, Condition, and Load the Financial Statement table;
Calculate and populate Rate table; FIG. 14 shows a partial relational database schema show
ing the entities and attributes used in the example's process 1ng.
Step 2: Maintain Object Groups and Rule Maps—a database processing routine is performed creating the following group ings: Class to Seat
Flight to Locations Seat to Plane For ease in understanding the rule the specifications used to
populate the database with rule parameters the processing instructions are shown below in the Rules. Also, most rules group by plane - the rule discussion below assumes this grouping without reference. Step 3: Calculate Net Interest for Seat Four types of NIR rules are processed—type I, II, III, IV for each seat. Interest rates are matched to plane purchase date for initial plane investments, and interest rates for plane net capitalizable improvements are funded with a 5 year pool of rates. Plane asset balances are kept in the Plane table maintained in Step 1.2 above. NIRType I: Carry cost of plane asset by seat is determined.
Rule Populated in Step 2 are: The AAB(seat) parameter is Plane: net orig bal * (1/total
seats on plane) The rt parameter is Treatment rts: 25 yr rate (maintained
for each plane) There is no need for liability rates. Calculate COF(seat)=AAB(seat) *rt for all seats on flight. All other attributes are NI Type I calculations results are
null. No grouping. NIRType III: Allocate net receivable/payable to seat for carry cost profit adjustment. This adjusts profitability for the impact of cash flows VS. accounting flows. This airline wants to apportion this cost across all revenue seats based on class wit, a modeling parameter. A total weighted seat (tws) for the accounting period is a modeling parameter, where the seat factoris determined as a ratio of seat footprint to class portion of the plane's seat revenue space. (e.g. 1'=15%, 2"–25% & 3'-60% of plane's seat revenue space with each seat evenly apportioned in class—1/20, 1780, 1/300 respectively, in this case.) Rule
Populated in Step 2 are: The AB(seat) parameter is Financial: net recvble *
(1/tws) Thert parameter is Treatment rts: pool (for null plane row) There is no need for liability rates.
10
15
25
30
35
40
45
50
55
60
65
26 Calculate COF(seat)=AB(seat) * rt * class wt Grouped by class all seats, so no seats??? is no seats 1st value in the plane entity for first class seats on this plane, and so on for 2" & 3" class seat groups. The net recvble column is derived from the difference between sums of period amts for the receivables minus sum of payable rows for this profit period.
All other attributes and NIType II calculations results are null.
NIRType III: Calculate the NI value of the customer mileage benefit payable for each seat.
Rule Populated in Step 2 are: The AB(seat) parameter is Customer: bene miles loyalty
factor Thert parameteris Treatment rts: pool (for null plane row)
There is no need for an asset rate. Calculate COF(seat)=AB(seat) *rt Since a customer can only occupy one seat, no groupings
are used in this rule map. All other attributes and NIType III calculations results are
null. NIR Type IV: Calculate the NI impact of the plane's improvements for each seat. Upper classes interior, customer electronics and seating are improved faster during the life of the plane. Management strategy is for these improvements to be loyalty program related; they are amortized quicker and hence shorter funding requirement with less certain life. Therefore the loyal customers to pay proportionately more of the funding costs of improvement assets.
Rule Populated in Step 2 are: The AB(seat) parameter is Plane:imp net bal * (1/tsw) The rt parameter is Treatment rts: pool (for plane row) *
Customer: loyalty rting There is no need for a liability rate. Calculate COF(seat)=AB(seat) *rt * class fac The unique class fac values Sum to 1. The rule map is
grouped by classes (or class fac). All other attributes and NI Type IV calculations results are null. NI EOAE. Option 4: Allocate equity based on mileage
benefit and have it reduce NI by the weighted average cost of capital for the airline.
Rule Populated in Step2 are: The Amount(seat) parameter is Customer:bene miles The equity rate is 9.75% Calculate EOAE(seat)=Amount(seat) * equity rate *
cohort wit The cohort is based groups of each instance of loyalty rting
and class of seat paired. Cohort wt is “beta’ and no “alpha.” All other attributes and EOAE calculations results are null.
Step 4: Calculate Other Revenues for each Seat—Revenue arises from ticket fares, duty free sales on board aircraft, excess baggage penalties collected, alliance code sharing license and multiple leg customer trips. OR Type I: Apportion revenue from code sharing with
alliance. Apportion revenue by seat allocated to alliance pas Senger.
Rule Populated in Step 2 are: Flight:period amt is alliance revenue per flight plus the Sum of all flight/date alliance financial transactions.
Calculate OR(seat)=sum of Flight:period amt (1/no alli ance seats available on flight)

US 7,596,521 B2 27
Only for seats occupied by an alliance customer or a seat that is empty.
ORType II: Use Transaction table to find direct passenger revenue by seat. Rule
Populated in Step 2 are: Transaction: (amounts, seats, flight, date, transaction
type) are populated for events, financial or non-financial. Calculate OR(seat) sum of Transaction:trn amt where 10
type=passenger payment' for each seat. No seat grouping in rule map.
OR Type III: Apportion flight freight revenue amongst all seats, weighted by class wt. Rule 15
Calculate OR(seat)=sum of Transaction: trn amt * class wt * (1/ (no seats???))
where type “freight' for each seat. Group seats by class (??? Is 1,2"3".) Class wt is a 2O
normalized weight for apportioning revenue amongst classes. ORType IV: Calculate the loyalty mileage benefit by seat. Rule Calculate Forgone OR(seat)=Flight: ??? fare sum of
transactions:trn amt where type="passenger payment' for each seat.
Group by class for loyalty passenger occupied seats only. 25
Step 5: Calculate Direct Expenses for each Seat Compute the direct cost of using the seat. This is true for both occupied and unoccupied seats. Fuel and flight deck crew are costs of all seats, while cost of duty free goods sold and meals are a function of occupied seats. Some costs are a function of the plane taking off, no matter the duration of the flight (e.g., maintenance.) Some costs are a function of class, such as cabin crew expense and customer consumables. DE Type I: Show direct cost of non-food materials con Sumed in flight.
Rule Populated in Step 2 are: Transactions:* is populated based on these direct costs.
Calculate DE(seat)=Transactions:trn amt for all flight and date rows where type direct exp for each seat.
No grouping in rule map. DE Type II: Show direct cost duty free goods sold by seat.
Rule Populated in Step 2 are: Transactions: are populated based on these direct costs.
Calculate DE(seat)=Transactions:trn amt for all flight and date rows where type duty jree for each seat.
No grouping in rule map. DE Type III: Show direct cost of food and beverage con
Sumed. Rule Populated in Step 2 are: Transactions:* are populated based on these direct costs Loading is calculated as the ratio of occupied to total class
seats by class (cl load) using manifest table and plane configuration values.
Calculate DE(seat)=Flight: catering cost class wt * cl load for each seat.
Grouped by class in rule map. DE Type IV: The staffing of each cabin has a maximum
count with a minimum of 1 per 50 passengers. The air 65 deck crew must fly the plane even if there are no passen gers. Calculate DE twice, once for based on a labor cost
30
35
40
45
50
55
60
28 per seat based on total crew cost and total seats; and calculate DE a second time with actual staff apportioned to actual passengers.
Rule Populated in Step 2 are: Total crew cost (tcc 1) parameter is derived using the
employee entity for all crew on flight. Tcc=Employee: salary--bene * (Flight:schd hours--1.5) /110
Total crew cost (tcc.2) parameter is derived using the employee entity for all crew on flight by class. Tcc???=Employee: salary+bene * (Flight:schd hours-- 1.5) /110 Note: tcc tcc 1st--tcc2nd--tcc3rd
Calculate DE 1 (seat)=tcc * (1/(total no. of seats on plane)) Calculate DE2(seat)=tcc?? * (1/(no. of seats occupied in
class)) for each seat. Grouped by class in rule map.
Step 6: Calculate Provisions for each Seat The cost of expected future events are measured here. The airline self insures property, casualty and miscellaneous insurance pre miums on a per flight basis. And a provision for future loyalty benefit, a function of loyalty rating, claimed is made in Step 6. P Type I: The cost of the flights insurance premium is
apportioned to each seat. Rule
Populated in Step 2 are: Insurance premium is maintained in the flight entity (total PG) Calculate P(seat)=Flightins prem * 1/(total no. seats on
plane) No grouping in rule map. P Type II: Provision for unusual maintenance cost is made on a function of the inverse of flight time and takeoffs in the last 12 months.
Rule Populated in Step 2 are: Financial:period amt is maintained in the financial entity by equipment type.
Total flight hours and last 12 months take-offs are accumu lated each month, their product is to hrs parameter. Calculate P(seat)=Financial:period amt * 1/(total no.
of seats on plane) * (Plane: to last12 * Flight: Schd hrs) / to hrs
No seat grouping in rule map. PType III: Providing for future loyalty benefit.
Rule Populated in Step 2 are: Customer:bene miles is maintained using prior periods
provision for benefit miles by loyalty customer A parameter estimating the usage rate by loyalty cohart
called burn factor Calculate P(seat)=Flight:distance * burn(loyalty rat
ing) Grouping by loyalty rating in rule map. PType IV: Future order cancellation reserve.
Rule Populated in Step 2 are: Future airplane order cancellation penalty (pen) and order
size (fut planes) is maintained in the financial entity Last 12 months loading is calculated by plane
Calculate P(seat) pen * ( Plane:orig bal/fut planes)* 1/(total no. seats on plane) * 1/24,where last 12 months loading less than 75%.
Only seats on where last 12 months loading less than 75%.

US 7,596,521 B2 29
Step 7: Calculate Indirect Expenses for each Seat The cal culation of indirect expense is the final step of detailed level profit calculation. Here remaining cost measures that are not differentiable by seat are measured. Fuel and oil, ground costs, regular aircraft maintenance, overheads, and general marketing expenses are apportioned in IE. The airline also wants to view customer profitability loaded with the cost of unoccupied seats.
IEType I: General and administrative costs are apportioned to a seat in this rule.
Rule Populated in Step 2 are: The periods financial entity is populated with all of the
airlines G&A expenses (e.g., type of G&A are passenger services, navigation licenses, rentals, miscellaneous costs, premises and property taxes.) Allocate these costs based on seat revenue (NI+OR.) Calculate IE(seat) sum(Financial:trn amt) * (sum(NI
(seat))+sum(OR(seat)))/(Total OR+NI for period) No seat grouping in rule map for all Financial: type="G&A'. IEType II: Ground location costs, airport specific and
gate expenses are apportioned by flight. Rule
Populated in Step 2 are: Populate all of these expenses for the period Transactions:
trn amt with the type being the three letter international airport identifier.
Calculate the number of seats flown to the flight airports during the profit period (ffc) Calculate IE(seat) sum of Transactions: trn amt *
(1/ffc)/2 Group transactions by pair of airports in flight row for
rule map, where only these types of expenses are included in the tuple. IEType III: Fixed asset depreciation is allocated to a
Seat.
Rule Populated in Step 2 are: The net plane balances (Plane.net orig ball & Plane:imp
net bal) are updated for last periods amortization or write-off.
The amortization factor (function of amortization) given age of asset (for both original investment and improve ments) is amfo and amfi for each plane.
The tax planning estimate for taxable equivalent gross-up, due to accelerated tax amortization, is 0.8 teg (less than 1 since a tax credit)
Calculate IE (seat) = ((Plane.net orig bal-Plane:orig bal): amfo) +
Plane.imp org bal - Plane.imp org bal): amfi)): teg :
(1 f (total no. seats on plane)): (Flightschd hrs/Plane.hrs last 12/12)
No grouping of seats in rule map. IE Type IV. Indirect marketing expenses are appor
tioned by loyalty class for customer profit aggrega tions and by seat for other aggregations.
Rule Populated in Step 2 are: Indirect marketing expense per loyalty tier per flight is
parameterized as mef???, where??? is 1'', 2',3' class.
5
30 Calculate IE(seat)-mef???* (1/(no. of occupied seats in Group seats by class in rule map. IE Type V: For loyalty investment analysis, allocate
all DE for empty seats to occupied seats equally. Populated, after all prior steps are calculated, are the total DE less OR for each flight during the period, idef, Calculate IE(seat) idef/(total no. of occupied seats) Only calculate for occupied seats.
O Step 8: Calculate After-tax Seat Profit. The After-tax Profit:
15
25
30
35
40
45
50
55
60
65
Rule Populated in Step 2 are: The effective tax rate (etr) for the airline is maintained in
the database. Calculate Profit(seat)=Sum(NI(seat)+OR(seat)+DE
(seat)+IE(seat)+P(seat)) * (1-etr) Each seat is calculated individually, no grouping is used.
Shareholder Value-add: The airline has determined that some routes have a greater risk of loss due to the volatility of loading factors. Therefore each route is given a risk factor based on the last 12 months standard deviation of loading.
Rule Populated in Step 2 are: Flight:risk factor is maintained here Economic equity per average seat parameter (Flight:risk
factor) per route Cost of capital rate is parameterized (eqrt)
Calculate SHV(seat)=Profit(seat)–(Flight:risk factor * eqrt) Each seat is calculated.
From the foregoing, it will be appreciated that DPM pro vides a metric of profit measurement consistent with GAAP at a level of detail that has not been accomplished using the traditional General Ledger based data with analytical (appor tioned) and/or sample Survey based information.
This new ability to resolve profit measures at a detailed level without using analytical models or statistical extrapola tion is a capability needed throughout industries that find their ability to determine a marginal decision’s profit impact inad equate for optimization of ownership value. The use of rule driven and database measurement processes will give large scale businesses a lower cost of maintenance and technologi cally scaleable tool to measure profit at a level of precision or resolution not possible in prior financial performance mea Surement processes.
Although a particular embodiment of the invention has been described in detail for purposes of illustration, various modifications may be made without departing from the spirit and scope of the invention. Accordingly, the invention is not to be limited, except as by the appended claims. What is claimed is: 1. A process for determining object level profitability in a
computer, comprising the steps of providing a relational database management system oper
able in association with a computer; preparing information to be accessed electronically
through the relational database management system; establishing, in the relational database, rules for processing
the prepared information; using the relational database management system to inde
pendently calculate at least one marginal value of profit for each object being measured using the established rules as applied to a selected set of prepared information;
using the relational database management system to cal culate a fully absorbed profit adjustment value for each object being measured; and

US 7,596,521 B2 31
combining the at least one marginal value of profit and the fully absorbed profit adjustment value to create a mea sure for object level profitability.
2. The process of claim 1, wherein the relational database comprises a structured query language (SQL).
3. The process of claim 1, wherein the preparing step further includes the step of calculating opportunity values of funds used or Supplied by each object being measured.
4. The process of claim 1, wherein the establishing step includes the steps of providing the information necessary to select objects, and performing the correct profit calculus.
5. The process of claim 1, wherein the step of calculating at least one marginal value of profit includes the steps of calcu lating net interest (NI), other revenue (OR) and direct expense (DE), wherein net interest (NI) is the summation of interest income, value of funds provided and earnings on equity funds used less the Sum of interest expense and costs of funds used, other revenue (OR) is a measure of profit contribution from non-interest related Sources, and direct expense (DE) is the profit value reduction due to marginal resource consumption by the object.
6. The process of claim 1, wherein the step of calculating at least one marginal value of profit includes the step of provi Sioning (P) for the selected set of prepared information, pro visioning being the expected profit value adjustment for future outcomes related to the object.
7. The process of claim 6, wherein the step of calculating a fully absorbed profit adjustment value includes the step of calculating the value for indirect expense (IE) which is an apportioned profit value adjustment for all non-object related resource consumption.
8. The process of claim 7, wherein the combining step includes the steps of adding net interest (NI) and other rev enues (OR), and subtracting therefrom direct expense (DE), provisioning (P) and indirect expense (IE).
9. The process of claim 8, including the step of adjusting the measure for object level profitability for taxes and/or object economic value.
10. The process of claim3, wherein the opportunity values are based on matched maturity funds transfer pricing theory, where the values are market alternative supplies or uses of funds having matched interest and payment characteristics.
11. The process of claim 5, wherein the Net Interest (NI) is calculated as:
Int Inc(o)=Interest Income of objecto,
-COF(o)=Cost of funds used by objecto,
-Int Exp(o)=Interest Expense for object o,
+VOF(o)=Value of funds provided by object o, according to:
Int Inc(o)=AAB(o)*rates (o), only if object attribute doesn't exist,
Int Exp(o)=ALB(o)*rate (o), only if object attribute doesn't exist, and
wherein: AAB(o)=Average Asset Balance of the object of ALB(o)=Average Liability Balance of the object o rate (o.) Effective interest rate for object o, as an asset
balance,
5
10
15
25
30
35
40
45
50
55
60
65
32 rate, (o)-Effective interest rate for object o, as a
liability balance, and Rt=Treatment rate based on the identified treatment for the
objects product attributes. 12. The process of claim 11, including the step of calculat
ing earnings on allocated equity, where the Summation is taken over all asset balances, according to:
*ERX AB. (o), wherein: AB. (o,) Average Asset balances of the object of
including any allocated asset balances, ER=Equity Ratio, and R-Treatment Rate for equity. 13. The process of claim 11, including the step of calculat
ing earnings on allocated equity according to:
Ratio), wherein:
Amount(o)=Amount(s) associated with object a This may be the average asset balances of the object 'o, including any allocated asset balances, or may be an object parameter,
Wit(type(o))=Code needed to identify the weight for object o balances, at the object-type level.
W(Wt(type(o)))=determined by the weight code, Cap Ratio An appropriate risk-weighted capital ratio cho
Sen, and R-Treatment Rate for equity. 14. The process of claim 11, including the step of calculat
ing earnings on allocated equity, according to:
*C.--f'Amount(o)), wherein: Amount(o.) An amount or amounts related to the object,
Such as average balances of the object (denoted AB((o),
Cohort(o,)=The cohort of objects in which object o is a member,
E(o)=The equity allocation rule for the cohort of object o, according to a linear (two-valued) function that operates on Amount(o) of the form C.--fi Amount(o). and
R-Treatment Rate(s) for equity for the Amount(o) value(s).
15. The process of claim 5, wherein Net Interest (NI) is calculated as the Summations over the possible balance vari ables for the object, according to:
- X. Int Inc(o)-vo, ABasset c(o) ratecasse, c(o), calcul late only if object attribute doesn't exist,
-COF(o, v. ABasser c.)(o;)"Rasset cR(c)(pt(o)) - X: -Int Exp(o)-vo, AB(liability c(o) rate(iiability c(o),
only if object attribute doesn't exist,
+VOF(o)-v. AB in c)(oi)"Raibility c.it) R(c)(pt (o)), wherein:
AB(o) Average Balances of the objecto, Rate (o)- Effective interest rate for the corresponding balance asset or liability,
Rt(o)=Object o’s product type/group as needed to identify treatment rate,
R(pt(o))-Rate (treatment rate) for objects of this prod uct type? group, given the balance class, and tier,
Int Inc(o)=Interest Income of object o, COF (o)-Cost of funds used by object o, Int Exp (o)=Interest Expense for object o, and VOF (o)=Value of funds provided by object o,

US 7,596,521 B2 33
16. The process of claim 15, including the step of calculat ing earnings on allocated equity, where the Summation is taken over all asset balances, according to:
*ERXABsse (o;), wherein: AB. (o) Average Asset balances of the object of
including any allocated asset balances, ER=Equity Ratio, and Requity-Treatment Rate for equity. 17. The process of claim 15, including the step of calculat
ing earnings on allocated equity according to:
Ratio), wherein:
Amount(o)=Amount(s) associated with object a This may be the average asset balances of the object 'o, including any allocated asset balances, or may be an object parameter,
Wit(type(o))=Code needed to identify the weight for object o balances, at the object-type level.
W(Wt(type(o)))=determined by the weight code, Cap Ratio An appropriate risk-weighted capital ratio cho
Sen, and R-Treatment Rate for equity. 18. The process of claim 15, including the step of calculat
ing earnings on allocated equity, according to: EOAE(O)-XR.E.(o) (Amount(o)),
or XER
Amount(o.) An amount or amounts related to the object, Such as average balances of the object (denoted AB(e)(O.),
Cohort(o)=The cohort of objects in which object o is a member,
E coacort (oi ob & o, according to a linear (two-valued) function that operates on Amount(o) of the form C+3* Amount(o), and
R-Treatment Rate(s) for equity for the Amount(o) value(s).
19. The process of claim 5, wherein Net Interest (NI) is calculated as the Summations over the possible balance attributes for the objects, according to:
- X: Int Inc(o)—we, ABsse (o;)*ratesse (o), only if object attribute doesn't exist,
-COF(o)-v. AB, c)(o;)*Rasset c(type ea (o;)), – X. -Int Exp(o)=v, AB(liability c(o)"rate(iiability c(o),
only if object attribute doesn't exist,
+VOF(o)-v. ABui, c)(o;)*Rec(type...(o;)), wherein:
AB(o) Average Balances of the object of rate (c.t)(o)=Effective interest rate for the corresponding
balance, Type,(o)-Object o,’s product and object attributes as
needed to identify treatment, R (type (o))-Rate (treatment rate) for this object's
product type, given the balance class, and tier/tenor, Int Inc(o)=Interest Income of object o, COF (o)=Cost of funds used by object o, Int Exp (o)=Interest Expense for object o, and VOF (o)=Value of funds provided by object o. 20. The process of claim 19, including the step of calculat
ing earnings on allocated equity, where the Summation is taken over all asset balances, according to:
*ERXABsse (o;), wherein:
)=The equity allocation rule for the cohort of
10
15
25
30
35
40
45
50
55
60
65
34 AB. (o,) Average Asset balances of the object of
including any allocated asset balances, ER=Equity Ratio, and R-Treatment Rate for equity. 21. The process of claim 19, including the step of calculat
ing earnings on allocated equity according to:
Ratio), wherein:
Amount(o))=Amount(s) associated with object a This may be the average asset balances of the object 'o, including any allocated asset balances, or may be an object parameter,
Wit(type(o))=Code needed to identify the weight for object o balances, at the object-type level.
W(Wt(type(o)))=determined by the weight code, Cap Ratio An appropriate risk-weighted capital ratio cho Sen, and
R-Treatment Rate for equity. 22. The process of claim 19, including the step of calculat
ing earnings on allocated equity, according to: EOAE(0)=R.E.,(o) (Amount(o)), or X.
R *C.--f'Amount(o)), wherein: Amount(o.) An amount or amounts related to the object,
Such as average balances of the object (denoted ABs) (O.),
Cohort(o,)=The cohort of objects in which object o is a member,
E(o)=The equity allocation rule for the cohort of object o, according to a linear (two-valued) function that operates on Amount(o) of the form C.--fi Amount(o). and
R-Treatment Rate(s) for equity for the Amount(o) value(s).
23. The process of claim 5, wherein Net Interest (NI) is calculated where summations are over the possible balance variables for the object, according to:
Int Inc(o)-XABsse (o;)*ratesse (O) only if object attribute doesn't exist,
-Int Exp(o;)-XAB(iitii, (o;)*raterizii (o;)) only if object attribute doesn't exist,
+VOF(o)-XAB(liability (o) Rotiatio (type, (o)), wherein:
AB(o) Average Balances of the object, rate (o)-Effective interest rate for the corresponding
balance amounts, type,(o)-Object o,’s product, object attribute, and
behavior types as needed to identify treatment rate, R(type))-Rate (treatment rate) for objects of this
product type, balance class, and tier?tenor, Int Inc(o)=Interest Income of object o, COF(o)=Cost of funds used by object o, Int Exp(o)=Interest Expense for object of and VOF(o)=Value of funds provided by object o, 24. The process of claim 23, including the step of calculat
ing earnings on allocated equity, where the Summation is taken over all asset balances, according to:
*ERXABsse (o;), wherein:
AB. (o,) Average Asset balances of the object of including any allocated asset balances,
ER=Equity Ratio, and R-Treatment Rate for equity.

US 7,596,521 B2 35
25. The process of claim 23, including the step of calculat ing earnings on allocated equity according to:
Ratio, Wiscein. Amount(o)=Amount(s) associated with object a This 5 may be the average asset balances of the object 'o, including any allocated asset balances, or may be an object parameter,
Wit(type(o))=Code needed to identify the weight for object 10 o balances, at the object-type level.
W(Wt(type(o)))=determined by the weight code, Cap Ratio An appropriate risk-weighted capital ratio cho
Sen, and Requity-Treatment Rate for equity. 15 26. The process of claim 23, including the step of calculat
ing earnings on allocated equity, according to: EOAE(O)-RE,(o) (Amount(o;)),
or X.R.C.--f'Amount(o,)), wherein: Amount(o,) An amount or amounts related to the object, 2O
Such as average balances of the object (denoted AB(e)(O.),
Cohort(o)=The cohort of objects in which object o is a member,
E(o.) The equity allocation rule for the cohort of 25 object o, according to a linear (two-valued) function that operates on Amount(o) of the form C+3* Amount(o), and
R-Treatment Rate(s) for equity for the Amount(o) 30 value(s).
27. The process of claim 7, wherein the value for indirect expense (IE) is calculated as:
before deferral IE(o)= 35
F(E)(oi IE rail k). )
40
added over each set IE, to which o, is related,
oeo(E)
X. F(IE )(oil) 45 E. : oieo(E)
k X F(IE)(of) f
and each of these terms is deferred over its amortization so period according to any of the amortization rules (cash, straight line, declining balance, or interest amortization calculations), and where AM (L.R) is used to denote the amortization rule and its life:
55
F(IE ) (oil) IE(o;) = AM (L, RIE.
X F(IE)(of) f
and
k
60
36 the result increased by the amounts with remaining amor
tization life for which amortization was begun in earlier periods.
28. The process of claim 6, provisioning (P) of each object is calculated according to:
Balance of o; P(O) = PG(o): , wherein:
ote RPG(oil) X Balance ok k
PG(o) denotes the P group in which o, is a member. 29. The process of claim 6, wherein provisioning (P) is
calculated as:
Balance (oil): RF(oil) P(O) = PG(o):
ote RPG(o;) X Balance (ok): RF(ok) k
, wherein:
PG(o) denotes the P group in which o, is a member, and RF(o) denotes the expected adjustment factor for o, . 30. The process of claim 6, wherein provisioning (P) is
calculated as: P(o)=Exposure(o) * Pr(o) * Expected Value Adjust
ment
(o)
wherein: Pr(o) is a probability for object o and L is the expected number of reporting periods during the
life of o, 31. The process of claim 9, wherein the step of adjusting
the measure for object level profitability is calculated as:
where
and C.(o), f(o,) are functions for a cohort of objects in which o,
is a member, and Amount(o) is given by a rule which maps o, to a data value (such as balance, or allocated equity) also defined at the cohort level.
32. The process of claim 9, wherein the step of adjusting the measure for object level profitability includes the calcu lation:
Profit(o)=NIR(o)+OR(o)-DE(o)-IE(o,)-P(O)*(1- Effective Tax Rate) where,
for a two tier taxation system, Effective Tax Rate is calculated aS
Effective Tax Rate=(1-tax rate 2)* (tax rate 1)+ tax rate 2.

![UIIitBd States Patent [19] [11] Patent Number -](https://static.fdocuments.net/doc/165x107/621b0823733f465c1365ba14/uiiitbd-states-patent-19-11-patent-number-.jpg)