
1,2, Maria-Monika Metallinou 3,* and Torgrim Log
23
materials Article Industrial Thermal Insulation Properties above Sintering Temperatures Amalie Gunnarshaug 1,2 , Maria-Monika Metallinou 3, * and Torgrim Log 3,4 Citation: Gunnarshaug, A.; Metallinou, M.-M.; Log, T. Industrial Thermal Insulation Properties above Sintering Temperatures. Materials 2021, 14, 4721. https://doi.org/ 10.3390/ma14164721 Academic Editor: Anton Trník Received: 26 July 2021 Accepted: 19 August 2021 Published: 21 August 2021 Publisher’s Note: MDPI stays neutral with regard to jurisdictional claims in published maps and institutional affil- iations. Copyright: © 2021 by the authors. Licensee MDPI, Basel, Switzerland. This article is an open access article distributed under the terms and conditions of the Creative Commons Attribution (CC BY) license (https:// creativecommons.org/licenses/by/ 4.0/). 1 Q Rådgivning AS, Øvregata 126, 5527 Haugesund, Norway; [email protected] 2 Department of Physics and Technology, University of Bergen, 5020 Bergen, Norway 3 Fire Disasters Research Group, Department of Safety, Chemistry and Biomedical Laboratory Sciences, Western Norway University of Applied Sciences, 5528 Haugesund, Norway; [email protected] 4 Gassco Inc., Bygnesvegen 75, 4250 Kopervik, Norway * Correspondence: [email protected]; Tel.: +47-9882-5104 Abstract: Processing highly flammable products, the oil and gas (O&G) industry can experience major explosions and fires, which may expose pressurized equipment to high thermal loads. In 2020, oil fires occurred at two Norwegian O&G processing plants. To reduce the escalation risk, passive fire protection may serve as a consequence-reducing barrier. For heat or cold conservation, equipment and piping often require thermal insulation, which may offer some fire protection. In the present study, a representative thermal insulation (certified up to 700 ◦ C) was examined with respect to dimensional changes and thermal transport properties after heat treatment to temperatures in the range of 700 ◦ C to 1200 ◦ C. Post heat treatment, the thermal conductivity of each test specimen was recorded at ambient temperature and up to 700 ◦ C, which was the upper limit for the applied measurement method. Based on thermal transport theory for porous and/or amorphous materials, the thermal conductivity at the heat treatment temperature above 700 ◦ C was estimated by extrapolation. The dimensional changes due to, e.g., sintering, were also analyzed. Empirical equations describing the thermal conductivity, the dimensional changes and possible crack formation were developed. It should be noted that the thermal insulation degradation, especially at temperatures approaching 1200 ◦ C, is massive. Thus, future numerical modeling may be difficult above 1150 ◦ C, due to abrupt changes in properties as well as crack development and crack tortuosity. However, if the thermal insulation is protected by a thin layer of more robust material, e.g., passive fire protection to keep the thermal insulation at temperatures below 1100 ◦ C, future modeling seems promising. Keywords: fire testing; heat transfer; thermal insulation; thermal conductivity; transient plane source method 1. Introduction The process industry may represent a major accident hazard, e.g., an ignited hy- drocarbon leak, resulting in an explosion, or a jet fire exposing adjacent equipment for a prolonged time period. In 2020, two fires occurred in the Norwegian process industry, i.e., on September 28th at the Hammerfest LNG plant [1,2] and on December 2nd at the Tjeldbergodden methanol plant [3,4]. In order to inhibit further escalation, critical equip- ment is often protected with a layer of passive fire protection. This is sometimes applied in addition to thermal insulation for heat or cold conservation required to maintain the optimal operating temperature [5–7]. This thermal insulation may indeed provide some reduction in heat flux to fire-exposed pipes and equipment. The application of passive fire protection may vary between different countries and companies. A main concern with using passive fire protection is corrosion under insulation (CUI), if not designed and maintained correctly [8]. Excessive fire protection should be avoided by applying fire protection only where strictly required [9]. Hence, there are several factors that should be evaluated before applying the PFP. The international recommended Materials 2021, 14, 4721. https://doi.org/10.3390/ma14164721 https://www.mdpi.com/journal/materials
Transcript of 1,2, Maria-Monika Metallinou 3,* and Torgrim Log

materials
Article
Industrial Thermal Insulation Properties aboveSintering Temperatures
Amalie Gunnarshaug 1,2, Maria-Monika Metallinou 3,* and Torgrim Log 3,4
�����������������
Citation: Gunnarshaug, A.;
Metallinou, M.-M.; Log, T. Industrial
Thermal Insulation Properties above
Sintering Temperatures. Materials
2021, 14, 4721. https://doi.org/
10.3390/ma14164721
Academic Editor: Anton Trník
Received: 26 July 2021
Accepted: 19 August 2021
Published: 21 August 2021
Publisher’s Note: MDPI stays neutral
with regard to jurisdictional claims in
published maps and institutional affil-
iations.
Copyright: © 2021 by the authors.
Licensee MDPI, Basel, Switzerland.
This article is an open access article
distributed under the terms and
conditions of the Creative Commons
Attribution (CC BY) license (https://
creativecommons.org/licenses/by/
4.0/).
1 Q Rådgivning AS, Øvregata 126, 5527 Haugesund, Norway; [email protected] Department of Physics and Technology, University of Bergen, 5020 Bergen, Norway3 Fire Disasters Research Group, Department of Safety, Chemistry and Biomedical Laboratory Sciences,
Western Norway University of Applied Sciences, 5528 Haugesund, Norway; [email protected] Gassco Inc., Bygnesvegen 75, 4250 Kopervik, Norway* Correspondence: [email protected]; Tel.: +47-9882-5104
Abstract: Processing highly flammable products, the oil and gas (O&G) industry can experiencemajor explosions and fires, which may expose pressurized equipment to high thermal loads. In 2020,oil fires occurred at two Norwegian O&G processing plants. To reduce the escalation risk, passive fireprotection may serve as a consequence-reducing barrier. For heat or cold conservation, equipment andpiping often require thermal insulation, which may offer some fire protection. In the present study,a representative thermal insulation (certified up to 700 ◦C) was examined with respect to dimensionalchanges and thermal transport properties after heat treatment to temperatures in the range of 700 ◦Cto 1200 ◦C. Post heat treatment, the thermal conductivity of each test specimen was recorded atambient temperature and up to 700 ◦C, which was the upper limit for the applied measurementmethod. Based on thermal transport theory for porous and/or amorphous materials, the thermalconductivity at the heat treatment temperature above 700 ◦C was estimated by extrapolation. Thedimensional changes due to, e.g., sintering, were also analyzed. Empirical equations describing thethermal conductivity, the dimensional changes and possible crack formation were developed. Itshould be noted that the thermal insulation degradation, especially at temperatures approaching1200 ◦C, is massive. Thus, future numerical modeling may be difficult above 1150 ◦C, due to abruptchanges in properties as well as crack development and crack tortuosity. However, if the thermalinsulation is protected by a thin layer of more robust material, e.g., passive fire protection to keep thethermal insulation at temperatures below 1100 ◦C, future modeling seems promising.
Keywords: fire testing; heat transfer; thermal insulation; thermal conductivity; transient planesource method
1. Introduction
The process industry may represent a major accident hazard, e.g., an ignited hy-drocarbon leak, resulting in an explosion, or a jet fire exposing adjacent equipment fora prolonged time period. In 2020, two fires occurred in the Norwegian process industry,i.e., on September 28th at the Hammerfest LNG plant [1,2] and on December 2nd at theTjeldbergodden methanol plant [3,4]. In order to inhibit further escalation, critical equip-ment is often protected with a layer of passive fire protection. This is sometimes appliedin addition to thermal insulation for heat or cold conservation required to maintain theoptimal operating temperature [5–7]. This thermal insulation may indeed provide somereduction in heat flux to fire-exposed pipes and equipment.
The application of passive fire protection may vary between different countries andcompanies. A main concern with using passive fire protection is corrosion under insulation(CUI), if not designed and maintained correctly [8]. Excessive fire protection should beavoided by applying fire protection only where strictly required [9]. Hence, there are severalfactors that should be evaluated before applying the PFP. The international recommended
Materials 2021, 14, 4721. https://doi.org/10.3390/ma14164721 https://www.mdpi.com/journal/materials
Materials 2021, 14, 4721 2 of 23
practice for application of passive fire protection is given by API RP 2218 [10], wherethe applied material, i.e., fire-resistive barrier systems for electrical system components,shall be certified according to ASTM E1725-19 [11]. It runs either according to the E119or the E1529 temperature curves. The first of these, which does not reach 1000 ◦C within1 h, corresponds to the temperatures of representative building fires, while the secondcurve reaches a constant temperature of 1100 ◦C after about 5 min, which is typical forhydrocarbon pool fires. These are fires of lower severity than the high-intensity firesaddressed in the present study where temperatures of 1200 ◦C may be expected overprolonged periods.
There are several types of passive fire protection materials on the market, dependingon the equipment to be protected. For fire protection of structures in the O&G industry,materials such as Chartek or Fendolite are widely used. The lightweight Fendolite isusually applied as a cementitious spray to structural elements. The epoxy-based Chartekis also mainly sprayed onto these elements for structural fire protection. In some cases,Chartek was previously used also for the fire protection of process equipment. For theprotection of pipes or vessels, mineral-based passive fire protection is most often used.
In the oil and gas industry, an unacceptable rupture is often defined as a rupture thatmay cause fatalities or serious injuries, a rupture that may hinder escape or evacuation, ora rupture that may lead to major additional economic losses [12]. An effective blowdownsystem is the preferred solution to prevent escalation rather than using passive fire pro-tection [13]. However, in some cases, the blowdown time is too long to avoid a rupturebefore the system is sufficiently depressurized. In those situations, passive fire protection isrequired. The general acceptance criteria for the passive fire protection are to avoid ruptureof the protected equipment, until the system is depressurized and/or personnel have beenevacuated [5]. For simplicity, rupturing or severe structural damage are typically assumedto take place at temperatures above 400 ◦C, i.e., where the steel types in use start to losemuch tensile strength with further temperature increase.
Thermal insulation is widely used in several industries, especially the building in-dustry. There are several studies investigating the thermal properties of thermal insula-tion [14–17]. Recently, new materials such as silica-based aerogel were also tested andimplemented for combined heat insulation and fire protection of buildings [18]. Thesewere, however, within the operating range of the industrial thermal insulation of interest,i.e., at temperatures below 700 ◦C, or within temperatures and heat fluxes associated withbuilding fires.
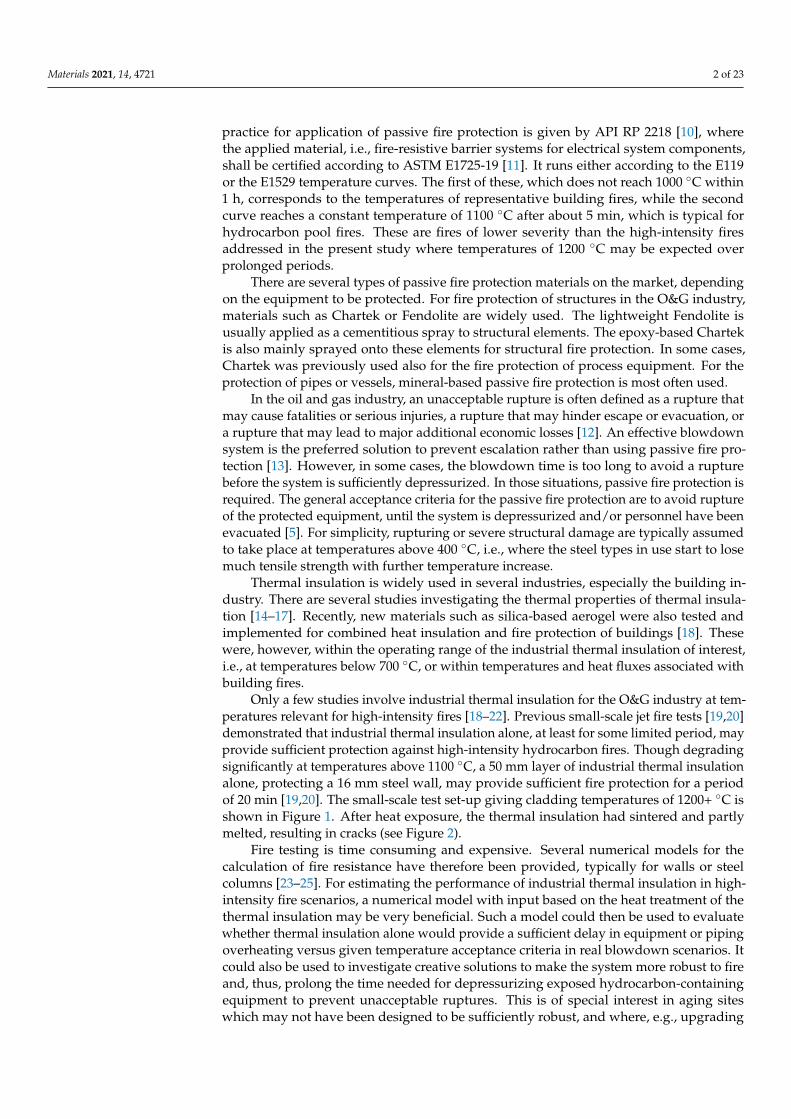
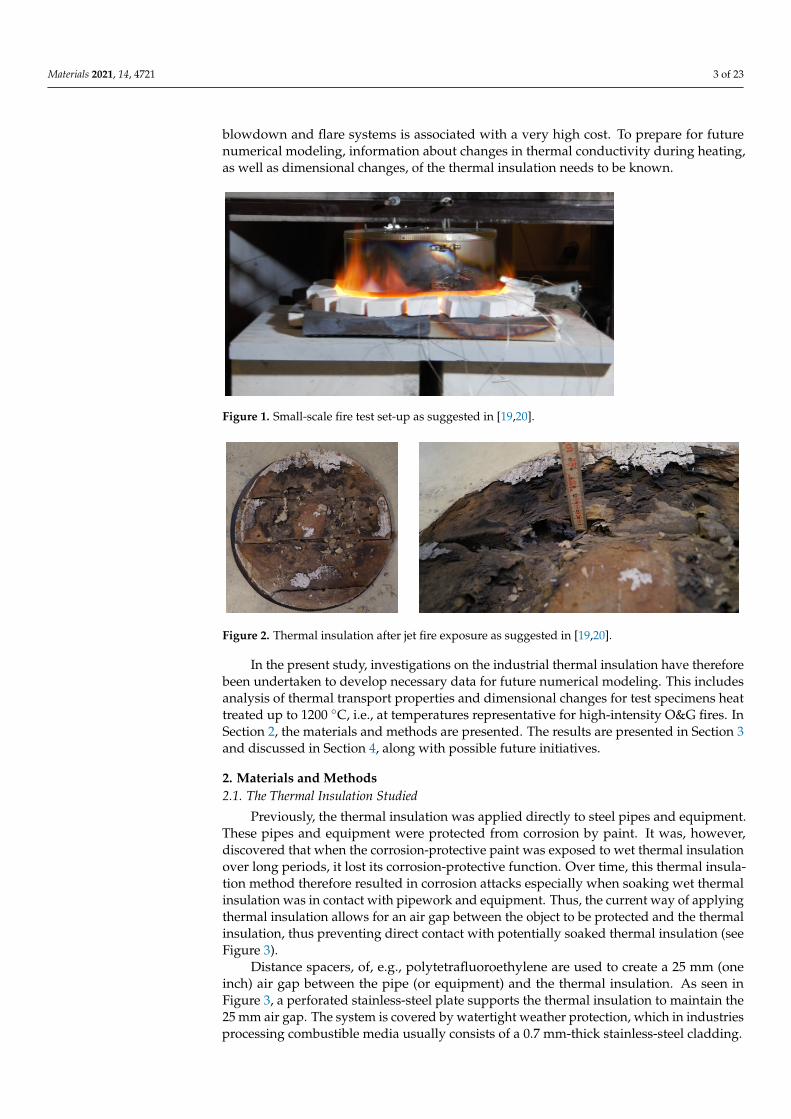
Only a few studies involve industrial thermal insulation for the O&G industry at tem-peratures relevant for high-intensity fires [18–22]. Previous small-scale jet fire tests [19,20]demonstrated that industrial thermal insulation alone, at least for some limited period, mayprovide sufficient protection against high-intensity hydrocarbon fires. Though degradingsignificantly at temperatures above 1100 ◦C, a 50 mm layer of industrial thermal insulationalone, protecting a 16 mm steel wall, may provide sufficient fire protection for a periodof 20 min [19,20]. The small-scale test set-up giving cladding temperatures of 1200+ ◦C isshown in Figure 1. After heat exposure, the thermal insulation had sintered and partlymelted, resulting in cracks (see Figure 2).
Fire testing is time consuming and expensive. Several numerical models for thecalculation of fire resistance have therefore been provided, typically for walls or steelcolumns [23–25]. For estimating the performance of industrial thermal insulation in high-intensity fire scenarios, a numerical model with input based on the heat treatment of thethermal insulation may be very beneficial. Such a model could then be used to evaluatewhether thermal insulation alone would provide a sufficient delay in equipment or pipingoverheating versus given temperature acceptance criteria in real blowdown scenarios. Itcould also be used to investigate creative solutions to make the system more robust to fireand, thus, prolong the time needed for depressurizing exposed hydrocarbon-containingequipment to prevent unacceptable ruptures. This is of special interest in aging siteswhich may not have been designed to be sufficiently robust, and where, e.g., upgrading
Materials 2021, 14, 4721 3 of 23
blowdown and flare systems is associated with a very high cost. To prepare for futurenumerical modeling, information about changes in thermal conductivity during heating,as well as dimensional changes, of the thermal insulation needs to be known.
Materials 2021, 14, 4721 3 of 24
Figure 1. Small-scale fire test set-up as suggested in [19,20].
(a) (b)
Figure 2. Thermal insulation after jet fire exposure as suggested in [19,20].
Fire testing is time consuming and expensive. Several numerical models for the cal-culation of fire resistance have therefore been provided, typically for walls or steel col-umns [23–25]. For estimating the performance of industrial thermal insulation in high-intensity fire scenarios, a numerical model with input based on the heat treatment of the thermal insulation may be very beneficial. Such a model could then be used to evaluate whether thermal insulation alone would provide a sufficient delay in equipment or piping overheating versus given temperature acceptance criteria in real blowdown scenarios. It could also be used to investigate creative solutions to make the system more robust to fire and, thus, prolong the time needed for depressurizing exposed hydrocarbon-containing equipment to prevent unacceptable ruptures. This is of special interest in aging sites which may not have been designed to be sufficiently robust, and where, e.g., upgrading blowdown and flare systems is associated with a very high cost. To prepare for future numerical modeling, information about changes in thermal conductivity during heating, as well as dimensional changes, of the thermal insulation needs to be known.
In the present study, investigations on the industrial thermal insulation have there-fore been undertaken to develop necessary data for future numerical modeling. This in-cludes analysis of thermal transport properties and dimensional changes for test speci-mens heat treated up to 1200 °C, i.e., at temperatures representative for high-intensity O&G fires. In Section 2, the materials and methods are presented. The results are pre-sented in Section 3 and discussed in Section 4, along with possible future initiatives.
Figure 1. Small-scale fire test set-up as suggested in [19,20].
Materials 2021, 14, 4721 3 of 24
Figure 1. Small-scale fire test set-up as suggested in [19,20].
(a) (b)
Figure 2. Thermal insulation after jet fire exposure as suggested in [19,20].
Fire testing is time consuming and expensive. Several numerical models for the cal-culation of fire resistance have therefore been provided, typically for walls or steel col-umns [23–25]. For estimating the performance of industrial thermal insulation in high-intensity fire scenarios, a numerical model with input based on the heat treatment of the thermal insulation may be very beneficial. Such a model could then be used to evaluate whether thermal insulation alone would provide a sufficient delay in equipment or piping overheating versus given temperature acceptance criteria in real blowdown scenarios. It could also be used to investigate creative solutions to make the system more robust to fire and, thus, prolong the time needed for depressurizing exposed hydrocarbon-containing equipment to prevent unacceptable ruptures. This is of special interest in aging sites which may not have been designed to be sufficiently robust, and where, e.g., upgrading blowdown and flare systems is associated with a very high cost. To prepare for future numerical modeling, information about changes in thermal conductivity during heating, as well as dimensional changes, of the thermal insulation needs to be known.
In the present study, investigations on the industrial thermal insulation have there-fore been undertaken to develop necessary data for future numerical modeling. This in-cludes analysis of thermal transport properties and dimensional changes for test speci-mens heat treated up to 1200 °C, i.e., at temperatures representative for high-intensity O&G fires. In Section 2, the materials and methods are presented. The results are pre-sented in Section 3 and discussed in Section 4, along with possible future initiatives.
Figure 2. Thermal insulation after jet fire exposure as suggested in [19,20].
In the present study, investigations on the industrial thermal insulation have thereforebeen undertaken to develop necessary data for future numerical modeling. This includesanalysis of thermal transport properties and dimensional changes for test specimens heattreated up to 1200 ◦C, i.e., at temperatures representative for high-intensity O&G fires. InSection 2, the materials and methods are presented. The results are presented in Section 3and discussed in Section 4, along with possible future initiatives.
2. Materials and Methods2.1. The Thermal Insulation Studied
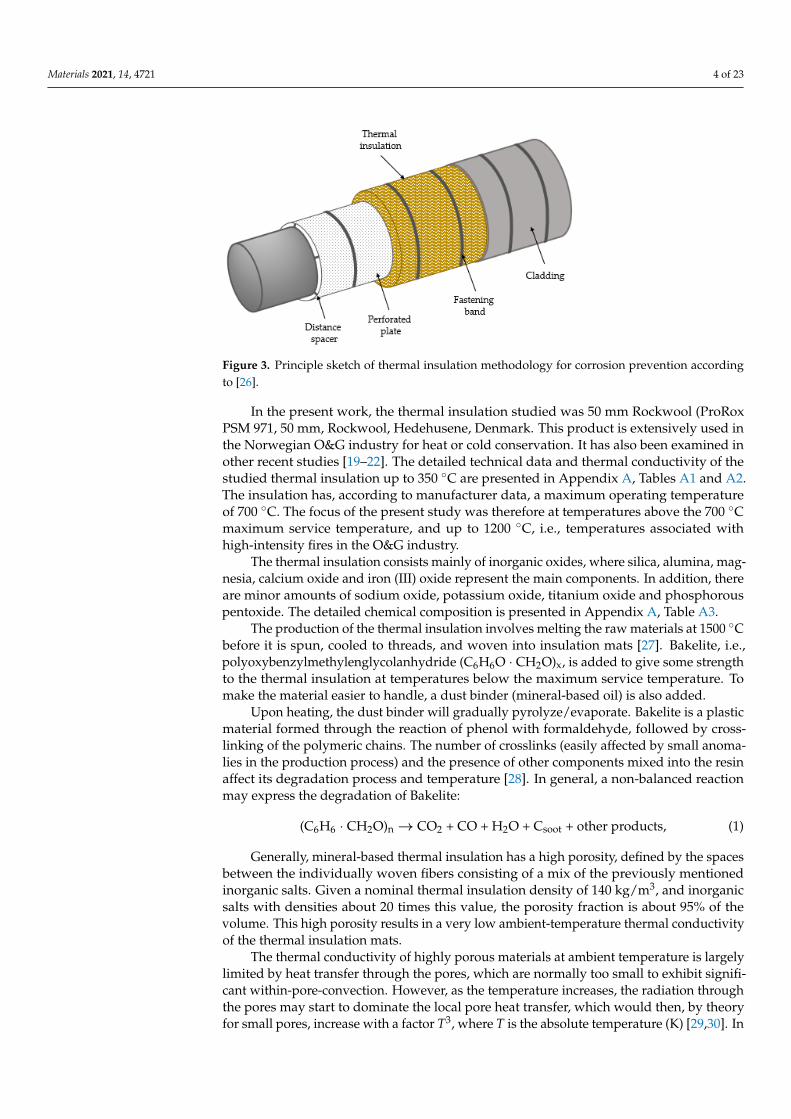
Previously, the thermal insulation was applied directly to steel pipes and equipment.These pipes and equipment were protected from corrosion by paint. It was, however,discovered that when the corrosion-protective paint was exposed to wet thermal insulationover long periods, it lost its corrosion-protective function. Over time, this thermal insula-tion method therefore resulted in corrosion attacks especially when soaking wet thermalinsulation was in contact with pipework and equipment. Thus, the current way of applyingthermal insulation allows for an air gap between the object to be protected and the thermalinsulation, thus preventing direct contact with potentially soaked thermal insulation (seeFigure 3).
Distance spacers, of, e.g., polytetrafluoroethylene are used to create a 25 mm (oneinch) air gap between the pipe (or equipment) and the thermal insulation. As seen inFigure 3, a perforated stainless-steel plate supports the thermal insulation to maintain the25 mm air gap. The system is covered by watertight weather protection, which in industriesprocessing combustible media usually consists of a 0.7 mm-thick stainless-steel cladding.
Materials 2021, 14, 4721 4 of 23
Materials 2021, 14, 4721 4 of 24
2. Materials and Methods 2.1. The Thermal Insulation Studied
Previously, the thermal insulation was applied directly to steel pipes and equipment. These pipes and equipment were protected from corrosion by paint. It was, however, dis-covered that when the corrosion-protective paint was exposed to wet thermal insulation over long periods, it lost its corrosion-protective function. Over time, this thermal insula-tion method therefore resulted in corrosion attacks especially when soaking wet thermal insulation was in contact with pipework and equipment. Thus, the current way of apply-ing thermal insulation allows for an air gap between the object to be protected and the thermal insulation, thus preventing direct contact with potentially soaked thermal insu-lation (see Figure 3).
Figure 3. Principle sketch of thermal insulation methodology for corrosion prevention according to [26].
Distance spacers, of, e.g., polytetrafluoroethylene are used to create a 25 mm (one inch) air gap between the pipe (or equipment) and the thermal insulation. As seen in Fig-ure 3, a perforated stainless-steel plate supports the thermal insulation to maintain the 25 mm air gap. The system is covered by watertight weather protection, which in industries processing combustible media usually consists of a 0.7 mm-thick stainless-steel cladding.
In the present work, the thermal insulation studied was 50 mm Rockwool (ProRox PSM 971, 50 mm, Rockwool, Hedehusene, Denmark. This product is extensively used in the Norwegian O&G industry for heat or cold conservation. It has also been examined in other recent studies [19–22]. The detailed technical data and thermal conductivity of the studied thermal insulation up to 350 °C are presented in Appendix A, Tables A1 and A2. The insulation has, according to manufacturer data, a maximum operating temperature of 700 °C. The focus of the present study was therefore at temperatures above the 700 °C maximum service temperature, and up to 1200 °C, i.e., temperatures associated with high-intensity fires in the O&G industry.
The thermal insulation consists mainly of inorganic oxides, where silica, alumina, magnesia, calcium oxide and iron (III) oxide represent the main components. In addition, there are minor amounts of sodium oxide, potassium oxide, titanium oxide and phospho-rous pentoxide. The detailed chemical composition is presented in Appendix A, Table A3.
The production of the thermal insulation involves melting the raw materials at 1500 °C before it is spun, cooled to threads, and woven into insulation mats [27]. Bakelite, i.e., polyoxybenzylmethylenglycolanhydride (C6H6O · CH2O)x, is added to give some strength to the thermal insulation at temperatures below the maximum service temperature. To make the material easier to handle, a dust binder (mineral-based oil) is also added.
Upon heating, the dust binder will gradually pyrolyze/evaporate. Bakelite is a plastic material formed through the reaction of phenol with formaldehyde, followed by cross-
Figure 3. Principle sketch of thermal insulation methodology for corrosion prevention accordingto [26].
In the present work, the thermal insulation studied was 50 mm Rockwool (ProRoxPSM 971, 50 mm, Rockwool, Hedehusene, Denmark. This product is extensively used inthe Norwegian O&G industry for heat or cold conservation. It has also been examined inother recent studies [19–22]. The detailed technical data and thermal conductivity of thestudied thermal insulation up to 350 ◦C are presented in Appendix A, Tables A1 and A2.The insulation has, according to manufacturer data, a maximum operating temperatureof 700 ◦C. The focus of the present study was therefore at temperatures above the 700 ◦Cmaximum service temperature, and up to 1200 ◦C, i.e., temperatures associated withhigh-intensity fires in the O&G industry.
The thermal insulation consists mainly of inorganic oxides, where silica, alumina, mag-nesia, calcium oxide and iron (III) oxide represent the main components. In addition, thereare minor amounts of sodium oxide, potassium oxide, titanium oxide and phosphorouspentoxide. The detailed chemical composition is presented in Appendix A, Table A3.
The production of the thermal insulation involves melting the raw materials at 1500 ◦Cbefore it is spun, cooled to threads, and woven into insulation mats [27]. Bakelite, i.e.,polyoxybenzylmethylenglycolanhydride (C6H6O · CH2O)x, is added to give some strengthto the thermal insulation at temperatures below the maximum service temperature. Tomake the material easier to handle, a dust binder (mineral-based oil) is also added.
Upon heating, the dust binder will gradually pyrolyze/evaporate. Bakelite is a plasticmaterial formed through the reaction of phenol with formaldehyde, followed by cross-linking of the polymeric chains. The number of crosslinks (easily affected by small anoma-lies in the production process) and the presence of other components mixed into the resinaffect its degradation process and temperature [28]. In general, a non-balanced reactionmay express the degradation of Bakelite:
(C6H6 · CH2O)n→ CO2 + CO + H2O + Csoot + other products, (1)
Generally, mineral-based thermal insulation has a high porosity, defined by the spacesbetween the individually woven fibers consisting of a mix of the previously mentionedinorganic salts. Given a nominal thermal insulation density of 140 kg/m3, and inorganicsalts with densities about 20 times this value, the porosity fraction is about 95% of thevolume. This high porosity results in a very low ambient-temperature thermal conductivityof the thermal insulation mats.
The thermal conductivity of highly porous materials at ambient temperature is largelylimited by heat transfer through the pores, which are normally too small to exhibit signifi-cant within-pore-convection. However, as the temperature increases, the radiation throughthe pores may start to dominate the local pore heat transfer, which would then, by theoryfor small pores, increase with a factor T3, where T is the absolute temperature (K) [29,30]. In
Materials 2021, 14, 4721 5 of 23
a previous study [22], it was shown that the thermal conductivity of the insulation studiedin the present work could indeed be expressed by the simple relationship a + b·T3.
With increasing temperature, the thermal conductivity of crystalline materials gen-erally passes through a peak in thermal conductivity and then experiences a decay withincreasing temperatures due to the mean free path limitation of the phonon interactions.Thus, above the maximum, the thermal conductivity decays as 1/T (K−1) for increasingtemperatures [29]. For amorphous materials, the thermal conductivity is in general muchlower, and increases quite linearly with temperature [29]. It may therefore be assumed thatthe thermal conductivity of the amorphous inorganic salt fibers exhibits a linear functionof temperature, i.e., increases modestly with increasing temperature.
At temperatures above 700 ◦C, the thermal insulation is known to start sintering,and when approaching the eutectic temperature of the salt mixture, it will gradually startmelting. The pores gradually collapse with increasing temperatures, making this a verycomplex system. It should also be noted that it passes through the glass transition temper-ature somewhere in the range 850 ◦C to 900 ◦C. Such a complex system is best analyzedexperimentally to understand the involved thermal insulation degradation mechanisms.
2.2. Heat Treatment of Thermal Insulation Test Specimens
To investigate the dimensional changes and the breakdown temperature of the thermalinsulation when exposed to temperatures representing a high-intensity fire, as in [19,20],muffle furnace tests were conducted based on previous successful studies [22].
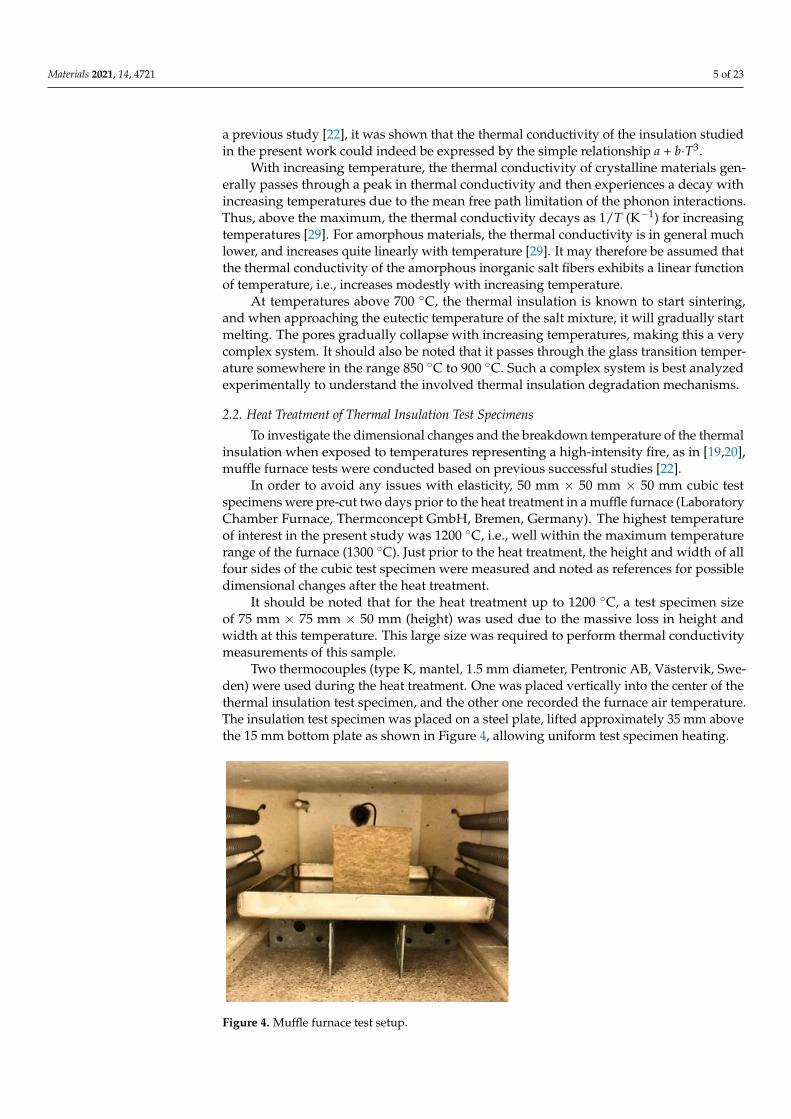
In order to avoid any issues with elasticity, 50 mm × 50 mm × 50 mm cubic testspecimens were pre-cut two days prior to the heat treatment in a muffle furnace (LaboratoryChamber Furnace, Thermconcept GmbH, Bremen, Germany). The highest temperatureof interest in the present study was 1200 ◦C, i.e., well within the maximum temperaturerange of the furnace (1300 ◦C). Just prior to the heat treatment, the height and width of allfour sides of the cubic test specimen were measured and noted as references for possibledimensional changes after the heat treatment.
It should be noted that for the heat treatment up to 1200 ◦C, a test specimen sizeof 75 mm × 75 mm × 50 mm (height) was used due to the massive loss in height andwidth at this temperature. This large size was required to perform thermal conductivitymeasurements of this sample.
Two thermocouples (type K, mantel, 1.5 mm diameter, Pentronic AB, Västervik, Swe-den) were used during the heat treatment. One was placed vertically into the center of thethermal insulation test specimen, and the other one recorded the furnace air temperature.The insulation test specimen was placed on a steel plate, lifted approximately 35 mm abovethe 15 mm bottom plate as shown in Figure 4, allowing uniform test specimen heating.
Materials 2021, 14, 4721 6 of 24
The insulation test specimen was placed on a steel plate, lifted approximately 35 mm above the 15 mm bottom plate as shown in Figure 4, allowing uniform test specimen heat-ing.
Figure 4. Muffle furnace test setup.
A heating rate of 15 K/min was applied to heat the test specimens from ambient tem-perature to respective maximum holding temperatures in the range of 700 °C to 1200 °C. The holding time at the maximum temperature was 30 min. After heat treatment and cool-ing of the oven to below 100 °C, the dimensions of the four vertical cube surfaces were again measured at three locations, both in width and height. The average width and height were reported for each test specimen. It should be noted that tests were also per-formed with vertically aligned test specimens (referring to the thermal insulation mat), but the main focus was kept on tests resembling the fire test set-up shown in Figure 1.
2.3. Thermal Conductivity Measurements The virgin industrial thermal insulation is a pours material, with low thermal con-
ductivity at ambient temperature. Since the pore radiation dominates the internal pore heat transfer, the thermal conductivity is a function of absolute temperature to the third power [28]. For the tested thermal insulation, the conductivity is given by:
kiso = 0.034 + 0.311∙10−9∙T3 (W/mK), (2)
However, when exposed to temperatures above 700 °C, the thermal insulation starts sintering, and changes considerably, especially at temperatures above 1100 °C. In the pre-sent study, thermal conductivity of heat-treated thermal insulation was recorded using the Transient Plane Source (TPS) method [31,32]. The TPS measurements for the heat-treated test specimens were performed using the Hot Disk Standard, double-sided accord-ing to [32] up to 700 °C, which is the temperature limit of this method. The pre-heated samples were cut in half and the TPS sensor was placed between the two sample halves, as shown in Figure 5.
Figure 4. Muffle furnace test setup.

Materials 2021, 14, 4721 6 of 23
A heating rate of 15 K/min was applied to heat the test specimens from ambienttemperature to respective maximum holding temperatures in the range of 700 ◦C to 1200 ◦C.The holding time at the maximum temperature was 30 min. After heat treatment andcooling of the oven to below 100 ◦C, the dimensions of the four vertical cube surfaces wereagain measured at three locations, both in width and height. The average width and heightwere reported for each test specimen. It should be noted that tests were also performedwith vertically aligned test specimens (referring to the thermal insulation mat), but themain focus was kept on tests resembling the fire test set-up shown in Figure 1.
2.3. Thermal Conductivity Measurements
The virgin industrial thermal insulation is a pours material, with low thermal con-ductivity at ambient temperature. Since the pore radiation dominates the internal poreheat transfer, the thermal conductivity is a function of absolute temperature to the thirdpower [28]. For the tested thermal insulation, the conductivity is given by:
kiso = 0.034 + 0.311·10−9·T3 (W/mK), (2)
However, when exposed to temperatures above 700 ◦C, the thermal insulation startssintering, and changes considerably, especially at temperatures above 1100 ◦C. In thepresent study, thermal conductivity of heat-treated thermal insulation was recorded us-ing the Transient Plane Source (TPS) method [31,32]. The TPS measurements for theheat-treated test specimens were performed using the Hot Disk Standard, double-sided ac-cording to [32] up to 700 ◦C, which is the temperature limit of this method. The pre-heatedsamples were cut in half and the TPS sensor was placed between the two sample halves, asshown in Figure 5.
Materials 2021, 14, 4721 7 of 24
Figure 5. Principle sketch of the TPS measurement set-up.
It should be noted that new samples were made for the thermal conductivity meas-urements, i.e., without a thermocouple penetrating the insulation, as described in Section 2.2. Each recording reported in the present study is an average of three consecutive meas-urements with a relaxation time of 60 min between each measurement. The thermal con-ductivity results at temperatures up to 700 °C were further extrapolated up to the respec-tive heat treatment temperature.
2.4. Density of Heat Treated Test Specimens Based on the measured height and width after heat treatment, as described in Section
2.2, the volume of each test specimen was estimated. The mass of the test specimens was also measured after heat treatment. Based on the volume and the mass, the room temper-ature density as a function of heat treatment temperature was established.
2.5. Specific Heat The specific heat of the thermal insulation as a function of temperature was calcu-
lated based on the given composition of the inorganic salts supplied by the manufacturer and presented in Appendix A. The data and equations used for calculating the specific heat for each inorganic salt, and for the final mixture, are presented in Appendix C.
Volumetric heat capacity, ρ∙Cp (J/m2K), may also be calculated from the TPS meas-urements based on the recorded thermal conductivity k (W/mK) and the thermal diffusiv-ity a (m2/s), i.e., by ρ∙Cp = k/a.
3. Results 3.1. Dimensional Changes
A significant shrinkage took place, especially at temperatures above 1100 °C, hence the temperature range above 1100 °C was of most interest. It was therefore decided to have a “finer mesh” when approaching 1200 °C, i.e., shorter temperature intervals between the heat treatment temperatures. Virgin thermal insulation and test specimens heat treated to 700 °C, 800 °C, 1000 °C, 1140 °C, 1180 °C, 1190 °C and 1200 °C are shown
Figure 5. Principle sketch of the TPS measurement set-up.
It should be noted that new samples were made for the thermal conductivity measure-ments, i.e., without a thermocouple penetrating the insulation, as described in Section 2.2.Each recording reported in the present study is an average of three consecutive mea-surements with a relaxation time of 60 min between each measurement. The thermal

Materials 2021, 14, 4721 7 of 23
conductivity results at temperatures up to 700 ◦C were further extrapolated up to therespective heat treatment temperature.
2.4. Density of Heat Treated Test Specimens
Based on the measured height and width after heat treatment, as described in Section 2.2,the volume of each test specimen was estimated. The mass of the test specimens was alsomeasured after heat treatment. Based on the volume and the mass, the room temperaturedensity as a function of heat treatment temperature was established.
2.5. Specific Heat
The specific heat of the thermal insulation as a function of temperature was calculatedbased on the given composition of the inorganic salts supplied by the manufacturer andpresented in Appendix A. The data and equations used for calculating the specific heat foreach inorganic salt, and for the final mixture, are presented in Appendix C.
Volumetric heat capacity, ρ·Cp (J/m2K), may also be calculated from the TPS measure-ments based on the recorded thermal conductivity k (W/mK) and the thermal diffusivitya (m2/s), i.e., by ρ·Cp = k/a.
3. Results3.1. Dimensional Changes
A significant shrinkage took place, especially at temperatures above 1100 ◦C, hencethe temperature range above 1100 ◦C was of most interest. It was therefore decided to havea “finer mesh” when approaching 1200 ◦C, i.e., shorter temperature intervals between theheat treatment temperatures. Virgin thermal insulation and test specimens heat treatedto 700 ◦C, 800 ◦C, 1000 ◦C, 1140 ◦C, 1180 ◦C, 1190 ◦C and 1200 ◦C are shown in Figure 6.It is clearly seen in Figure 6 that the “breaking point” of the insulation is around 1200 ◦C.It should be noted that the test specimen heat treated to 1200 ◦C, i.e., sample h, had anoriginal size of 75 mm × 75 mm × 50 mm prior to heat treatment.
Materials 2021, 14, 4721 8 of 24
in Figure 6. It is clearly seen in Figure 6 that the “breaking point” of the insulation is around 1200 °C. It should be noted that the test specimen heat treated to 1200 °C, i.e., sample h, had an original size of 75 mm × 75 mm × 50 mm prior to heat treatment.
The measured height and width after heat treatment of each sample is presented in Figure 7 as a function of heat treatment temperature. For the sample heat treated to 1200 °C, the width and height in Figure 7 are normalized to a 50 mm virgin cube. The calculated density at room temperature is presented in Figure 8.
Figure 6. Thermal insulation after heating in muffle furnace to (a) virgin sample, (b) 700 °C, (c) 800 °C, (d) 1000 °C, (e) 1140 °C, (f) 1180 °C, (g) 1190 °C and (h) 1200 °C.
Figure 7. Height (H) and width (W) of the test specimen after heat treatment. The values represent an average of three measurements at each vertical side.
Figure 6. Thermal insulation after heating in muffle furnace to (a) virgin sample, (b) 700 ◦C, (c) 800 ◦C, (d) 1000 ◦C,(e) 1140 ◦C, (f) 1180 ◦C, (g) 1190 ◦C and (h) 1200 ◦C.

Materials 2021, 14, 4721 8 of 23
The measured height and width after heat treatment of each sample is presented inFigure 7 as a function of heat treatment temperature. For the sample heat treated to 1200 ◦C,the width and height in Figure 7 are normalized to a 50 mm virgin cube. The calculateddensity at room temperature is presented in Figure 8.
Materials 2021, 14, 4721 8 of 24
in Figure 6. It is clearly seen in Figure 6 that the “breaking point” of the insulation is around 1200 °C. It should be noted that the test specimen heat treated to 1200 °C, i.e., sample h, had an original size of 75 mm × 75 mm × 50 mm prior to heat treatment.
The measured height and width after heat treatment of each sample is presented in Figure 7 as a function of heat treatment temperature. For the sample heat treated to 1200 °C, the width and height in Figure 7 are normalized to a 50 mm virgin cube. The calculated density at room temperature is presented in Figure 8.
Figure 6. Thermal insulation after heating in muffle furnace to (a) virgin sample, (b) 700 °C, (c) 800 °C, (d) 1000 °C, (e) 1140 °C, (f) 1180 °C, (g) 1190 °C and (h) 1200 °C.
Figure 7. Height (H) and width (W) of the test specimen after heat treatment. The values represent an average of three measurements at each vertical side.
Figure 7. Height (H) and width (W) of the test specimen after heat treatment. The values representan average of three measurements at each vertical side.
Materials 2021, 14, 4721 9 of 24
Figure 8. Calculated density at room temperature as a function of heat treatment temperature.
The corresponding volume reduction ratio (VRR) and density increase ratio (DIR) relative to the virgin test specimens are presented in Figure 9.
Figure 9. The volume reduction ratio (VRR) and density increase ratio (DIR) as a function the heat treatment temperature.
3.2. Thermal Conductivity Measurements While the test specimens heat treated to temperatures of up to 1190 °C could be cut
and measured using the TPS method, the 50 mm × 50 mm × 50 mm (height) thermal insu-lation test specimens heat treated at 1200 °C did shrink too much. It was therefore decided to make this test specimen from an original sample of 75 mm × 75 mm × 50 mm (height). The ambient temperature thermal conductivity of heat-treated thermal insulation is pre-sented in Figure 10.
Figure 8. Calculated density at room temperature as a function of heat treatment temperature.
The corresponding volume reduction ratio (VRR) and density increase ratio (DIR)relative to the virgin test specimens are presented in Figure 9.

Materials 2021, 14, 4721 9 of 23
Materials 2021, 14, 4721 9 of 24
Figure 8. Calculated density at room temperature as a function of heat treatment temperature.
The corresponding volume reduction ratio (VRR) and density increase ratio (DIR) relative to the virgin test specimens are presented in Figure 9.
Figure 9. The volume reduction ratio (VRR) and density increase ratio (DIR) as a function the heat treatment temperature.
3.2. Thermal Conductivity Measurements While the test specimens heat treated to temperatures of up to 1190 °C could be cut
and measured using the TPS method, the 50 mm × 50 mm × 50 mm (height) thermal insu-lation test specimens heat treated at 1200 °C did shrink too much. It was therefore decided to make this test specimen from an original sample of 75 mm × 75 mm × 50 mm (height). The ambient temperature thermal conductivity of heat-treated thermal insulation is pre-sented in Figure 10.
Figure 9. The volume reduction ratio (VRR) and density increase ratio (DIR) as a function the heattreatment temperature.
3.2. Thermal Conductivity Measurements
While the test specimens heat treated to temperatures of up to 1190 ◦C could be cutand measured using the TPS method, the 50 mm × 50 mm × 50 mm (height) thermalinsulation test specimens heat treated at 1200 ◦C did shrink too much. It was thereforedecided to make this test specimen from an original sample of 75 mm × 75 mm × 50 mm(height). The ambient temperature thermal conductivity of heat-treated thermal insulationis presented in Figure 10.
Materials 2021, 14, 4721 10 of 24
Figure 10. Ambient temperature thermal conductivity of heat-treated industrial thermal insulation measured by the TPS-method.
The thermal conductivity of all the test specimens, i.e., after heat exposure to 700 °C, 800 °C, 900 °C, 1000 °C, 1100 °C, 1140 °C, 1180 °C, 1190 °C and 1200 °C, was recorded by the TPS method from room temperature to 700 °C at each 100 °C interval. A selection of the thermal conductivity measurement results are shown in Figure 11, while all the meas-urement results are presented in Appendix B. The results represent an average of three measurements at each temperature, with 60 min relaxation time between consecutive measurements at the same temperature. The accuracy of the TPS method is ±2% to 5% at ambient temperatures and ±5% to 7% at elevated temperatures [32]. The thermal conduc-tivity of the test specimens preheated to 800 °C and above seems to comply fairly well with a linear increase with increasing temperature.
Figure 11. Results from TPS measurement of selected pre heated insulation samples, to 1100 °C, 1180 °C, 1190 °C and 1200 °C.
The only exception was the test specimen heat treated to 700 °C, as presented in Figure 12. It should be noted that the maximum operating temperature of the thermal insulation is 700 °C. Thus, upon heating to this temperature, there is little change in the thermal insulation, except for the loss of the dust binder and Bakelite materials. This may explain the results presented in Figure 6 for the test specimen treated at 700 °C, where the
Figure 10. Ambient temperature thermal conductivity of heat-treated industrial thermal insulationmeasured by the TPS-method.
The thermal conductivity of all the test specimens, i.e., after heat exposure to 700 ◦C,800 ◦C, 900 ◦C, 1000 ◦C, 1100 ◦C, 1140 ◦C, 1180 ◦C, 1190 ◦C and 1200 ◦C, was recordedby the TPS method from room temperature to 700 ◦C at each 100 ◦C interval. A selectionof the thermal conductivity measurement results are shown in Figure 11, while all themeasurement results are presented in Appendix B. The results represent an average ofthree measurements at each temperature, with 60 min relaxation time between consecutivemeasurements at the same temperature. The accuracy of the TPS method is ±2% to 5%at ambient temperatures and ±5% to 7% at elevated temperatures [32]. The thermal

Materials 2021, 14, 4721 10 of 23
conductivity of the test specimens preheated to 800 ◦C and above seems to comply fairlywell with a linear increase with increasing temperature.
Materials 2021, 14, 4721 10 of 24
Figure 10. Ambient temperature thermal conductivity of heat-treated industrial thermal insulation measured by the TPS-method.
The thermal conductivity of all the test specimens, i.e., after heat exposure to 700 °C, 800 °C, 900 °C, 1000 °C, 1100 °C, 1140 °C, 1180 °C, 1190 °C and 1200 °C, was recorded by the TPS method from room temperature to 700 °C at each 100 °C interval. A selection of the thermal conductivity measurement results are shown in Figure 11, while all the meas-urement results are presented in Appendix B. The results represent an average of three measurements at each temperature, with 60 min relaxation time between consecutive measurements at the same temperature. The accuracy of the TPS method is ±2% to 5% at ambient temperatures and ±5% to 7% at elevated temperatures [32]. The thermal conduc-tivity of the test specimens preheated to 800 °C and above seems to comply fairly well with a linear increase with increasing temperature.
Figure 11. Results from TPS measurement of selected pre heated insulation samples, to 1100 °C, 1180 °C, 1190 °C and 1200 °C.
The only exception was the test specimen heat treated to 700 °C, as presented in Figure 12. It should be noted that the maximum operating temperature of the thermal insulation is 700 °C. Thus, upon heating to this temperature, there is little change in the thermal insulation, except for the loss of the dust binder and Bakelite materials. This may explain the results presented in Figure 6 for the test specimen treated at 700 °C, where the
Figure 11. Results from TPS measurement of selected pre heated insulation samples, to 1100 ◦C,1180 ◦C, 1190 ◦C and 1200 ◦C.
The only exception was the test specimen heat treated to 700 ◦C, as presented inFigure 12. It should be noted that the maximum operating temperature of the thermalinsulation is 700 ◦C. Thus, upon heating to this temperature, there is little change in thethermal insulation, except for the loss of the dust binder and Bakelite materials. This mayexplain the results presented in Figure 6 for the test specimen treated at 700 ◦C, where thepore radiation may still dominate, i.e., the thermal conductivity versus temperature stillfollows Equation (2) quite well, as shown in Figure 12. The measured thermal conductivityas a function of absolute temperature to the third power is shown in Figure 13.
Materials 2021, 14, 4721 11 of 24
pore radiation may still dominate, i.e., the thermal conductivity versus temperature still follows Equation (2) quite well, as shown in Figure 12. The measured thermal conductivity as a function of absolute temperature to the third power is shown in Figure 13.
Figure 12. Thermal conductivity as a function of temperature for the test specimen preheated to 700 °C, supplier data available up to 350 °C and Equation (2) (---).
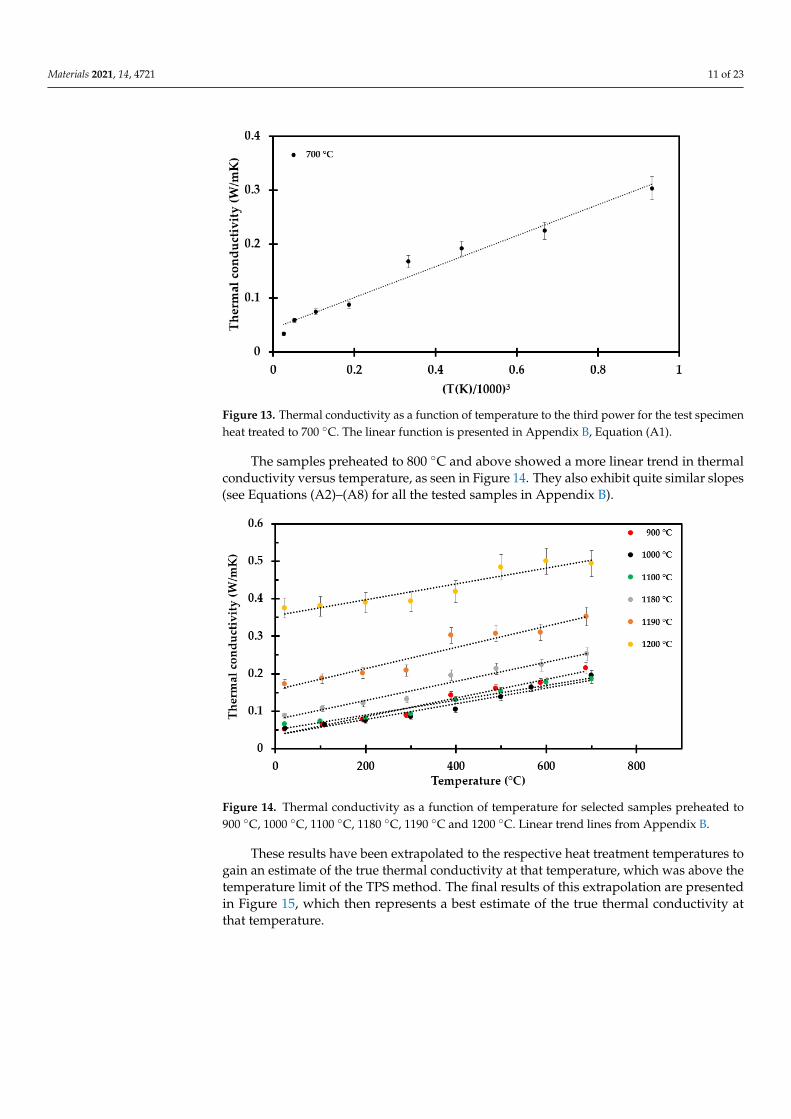
Figure 13. Thermal conductivity as a function of temperature to the third power for the test specimen heat treated to 700 °C. The linear function is presented in Appendix B, Equation (A1).
The samples preheated to 800 °C and above showed a more linear trend in thermal conductivity versus temperature, as seen in Figure 14. They also exhibit quite similar slopes (see Equations (A2)–(A8) for all the tested samples in Appendix B).
Figure 12. Thermal conductivity as a function of temperature for the test specimen preheated to700 ◦C, supplier data available up to 350 ◦C and Equation (2) (—).
Materials 2021, 14, 4721 11 of 23
Materials 2021, 14, 4721 11 of 24
pore radiation may still dominate, i.e., the thermal conductivity versus temperature still follows Equation (2) quite well, as shown in Figure 12. The measured thermal conductivity as a function of absolute temperature to the third power is shown in Figure 13.
Figure 12. Thermal conductivity as a function of temperature for the test specimen preheated to 700 °C, supplier data available up to 350 °C and Equation (2) (---).
Figure 13. Thermal conductivity as a function of temperature to the third power for the test specimen heat treated to 700 °C. The linear function is presented in Appendix B, Equation (A1).
The samples preheated to 800 °C and above showed a more linear trend in thermal conductivity versus temperature, as seen in Figure 14. They also exhibit quite similar slopes (see Equations (A2)–(A8) for all the tested samples in Appendix B).
Figure 13. Thermal conductivity as a function of temperature to the third power for the test specimenheat treated to 700 ◦C. The linear function is presented in Appendix B, Equation (A1).
The samples preheated to 800 ◦C and above showed a more linear trend in thermalconductivity versus temperature, as seen in Figure 14. They also exhibit quite similar slopes(see Equations (A2)–(A8) for all the tested samples in Appendix B).
Materials 2021, 14, 4721 12 of 24
Figure 14. Thermal conductivity as a function of temperature for selected samples preheated to 900 °C, 1000 °C, 1100 °C, 1180 °C, 1190 °C and 1200 °C. Linear trend lines from Appendix B.
These results have been extrapolated to the respective heat treatment temperatures to gain an estimate of the true thermal conductivity at that temperature, which was above the temperature limit of the TPS method. The final results of this extrapolation are pre-sented in Figure 15, which then represents a best estimate of the true thermal conductivity at that temperature.
Figure 15. Thermal conductivity as a function of temperature, extrapolated to the respective heat treatment temperatures.
At temperatures below 700 °C, i.e., Equation (2), the recorded thermal conductivity is highly dependent on the pore radiation, i.e., dependent on the absolute temperature to the third power. For the next 100 °C interval, sintering closes pores and results, counter-intuitively, in lower thermal conductivity.
At temperatures above 800 °C, the increased level of sintering results in an increase in the recorded thermal conductivity, which increases very much between 1180 °C and 1200 °C. However, in future numerical modeling the shrinkage must also be taken into consideration, as it either influences the size of the grid studied or the effective thermal conductivity in a constant grid system.
The Fourier law of heat conduction is given by:
Figure 14. Thermal conductivity as a function of temperature for selected samples preheated to900 ◦C, 1000 ◦C, 1100 ◦C, 1180 ◦C, 1190 ◦C and 1200 ◦C. Linear trend lines from Appendix B.
These results have been extrapolated to the respective heat treatment temperatures togain an estimate of the true thermal conductivity at that temperature, which was above thetemperature limit of the TPS method. The final results of this extrapolation are presentedin Figure 15, which then represents a best estimate of the true thermal conductivity atthat temperature.

Materials 2021, 14, 4721 12 of 23
Materials 2021, 14, 4721 12 of 24
Figure 14. Thermal conductivity as a function of temperature for selected samples preheated to 900 °C, 1000 °C, 1100 °C, 1180 °C, 1190 °C and 1200 °C. Linear trend lines from Appendix B.
These results have been extrapolated to the respective heat treatment temperatures to gain an estimate of the true thermal conductivity at that temperature, which was above the temperature limit of the TPS method. The final results of this extrapolation are pre-sented in Figure 15, which then represents a best estimate of the true thermal conductivity at that temperature.
Figure 15. Thermal conductivity as a function of temperature, extrapolated to the respective heat treatment temperatures.
At temperatures below 700 °C, i.e., Equation (2), the recorded thermal conductivity is highly dependent on the pore radiation, i.e., dependent on the absolute temperature to the third power. For the next 100 °C interval, sintering closes pores and results, counter-intuitively, in lower thermal conductivity.
At temperatures above 800 °C, the increased level of sintering results in an increase in the recorded thermal conductivity, which increases very much between 1180 °C and 1200 °C. However, in future numerical modeling the shrinkage must also be taken into consideration, as it either influences the size of the grid studied or the effective thermal conductivity in a constant grid system.
The Fourier law of heat conduction is given by:
Figure 15. Thermal conductivity as a function of temperature, extrapolated to the respective heattreatment temperatures.
At temperatures below 700 ◦C, i.e., Equation (2), the recorded thermal conductivity ishighly dependent on the pore radiation, i.e., dependent on the absolute temperature to thethird power. For the next 100 ◦C interval, sintering closes pores and results, counterintu-itively, in lower thermal conductivity.
At temperatures above 800 ◦C, the increased level of sintering results in an increasein the recorded thermal conductivity, which increases very much between 1180 ◦C and1200 ◦C. However, in future numerical modeling the shrinkage must also be taken intoconsideration, as it either influences the size of the grid studied or the effective thermalconductivity in a constant grid system.
The Fourier law of heat conduction is given by:
qx = k·∆T/∆x (W/mK), (3)
where ∆x (m) is along the path of heat conduction, i.e., during fire testing as shown inFigure 1, through the thickness of the thermal insulation mat. The results presented inFigure 13 are representative estimates for the thermal conductivity at these respectivetemperatures.
A simple way to correct for the shrinkage would be to still use the original thicknessdimension of the thermal insulation in the modeling and adapt an apparent thermalconductivity, kapp (W/mK), correcting for the shrinkage, i.e.,:
kapp,x = k·(Ho/H(T)) (W/mK), (4)
where Ho (m) is the virgin thermal insulation mat thickness and H(T) (m) is the thicknessafter heat treatment to temperature T (K), as presented in Figure 7. When correcting thethermal conductivity by the shrinkage factor, Ho/H(T), the numerical domain size may beconsidered constant.
The resulting apparent thermal conductivity, kapp, at the respective heat treatmenttemperatures are presented in Figure 16.
Materials 2021, 14, 4721 13 of 23
Materials 2021, 14, 4721 13 of 24
qx = k∙ΔT/Δx (W/mK), (3)
where Δx (m) is along the path of heat conduction, i.e., during fire testing as shown in Figure 1, through the thickness of the thermal insulation mat. The results presented in Figure 13 are representative estimates for the thermal conductivity at these respective tem-peratures.
A simple way to correct for the shrinkage would be to still use the original thickness dimension of the thermal insulation in the modeling and adapt an apparent thermal con-ductivity, kapp (W/mK), correcting for the shrinkage, i.e.,:
kapp,x = k∙(Ho/H(T)) (W/mK), (4)
where Ho (m) is the virgin thermal insulation mat thickness and H(T) (m) is the thickness after heat treatment to temperature T (K), as presented in Figure 7. When correcting the thermal conductivity by the shrinkage factor, Ho/H(T), the numerical domain size may be considered constant.
The resulting apparent thermal conductivity, kapp, at the respective heat treatment temperatures are presented in Figure 16.
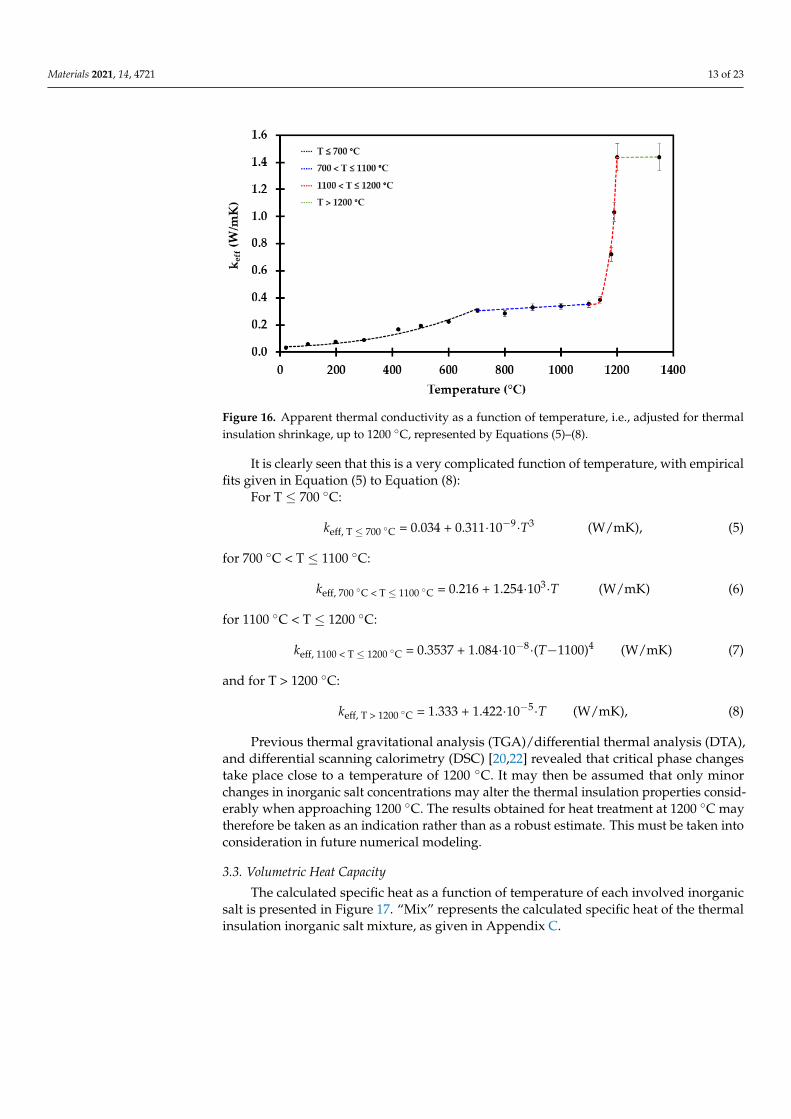
Figure 16. Apparent thermal conductivity as a function of temperature, i.e., adjusted for thermal insulation shrinkage, up to 1200 °C, represented by Equations (5)–(8).
It is clearly seen that this is a very complicated function of temperature, with empirical fits given in Equation (5) to Equation (8):
For T ≤ 700 °C:
keff, T ≤ 700 °C = 0.034 + 0.311⋅10−9⋅T3 (W/mK), (5)
for 700 °C < T ≤ 1100 °C:
keff, 700 °C < T ≤ 1100 °C = 0.216 + 1.254⋅103⋅T (W/mK) (6)
for 1100 °C < T ≤ 1200 °C:
keff, 1100 < T ≤ 1200 °C = 0.3537 + 1.084⋅10−8⋅(T−1100)4 (W/mK) (7)
and for T > 1200 °C:
keff, T > 1200 °C = 1.333 + 1.422⋅10−5⋅T (W/mK), (8)
Figure 16. Apparent thermal conductivity as a function of temperature, i.e., adjusted for thermalinsulation shrinkage, up to 1200 ◦C, represented by Equations (5)–(8).
It is clearly seen that this is a very complicated function of temperature, with empiricalfits given in Equation (5) to Equation (8):
For T ≤ 700 ◦C:
keff, T ≤ 700 ◦C = 0.034 + 0.311·10−9·T3 (W/mK), (5)
for 700 ◦C < T ≤ 1100 ◦C:
keff, 700 ◦C < T ≤ 1100 ◦C = 0.216 + 1.254·103·T (W/mK) (6)
for 1100 ◦C < T ≤ 1200 ◦C:
keff, 1100 < T ≤ 1200 ◦C = 0.3537 + 1.084·10−8·(T−1100)4 (W/mK) (7)
and for T > 1200 ◦C:
keff, T > 1200 ◦C = 1.333 + 1.422·10−5·T (W/mK), (8)
Previous thermal gravitational analysis (TGA)/differential thermal analysis (DTA),and differential scanning calorimetry (DSC) [20,22] revealed that critical phase changestake place close to a temperature of 1200 ◦C. It may then be assumed that only minorchanges in inorganic salt concentrations may alter the thermal insulation properties consid-erably when approaching 1200 ◦C. The results obtained for heat treatment at 1200 ◦C maytherefore be taken as an indication rather than as a robust estimate. This must be taken intoconsideration in future numerical modeling.
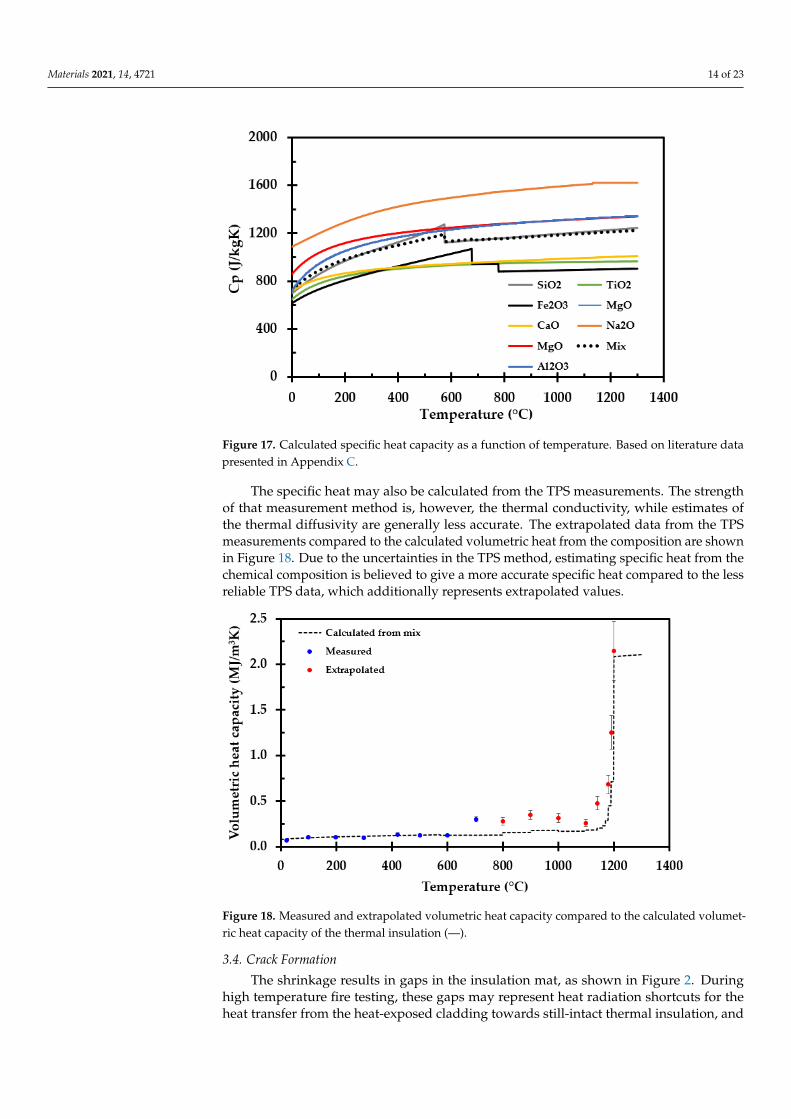
3.3. Volumetric Heat Capacity
The calculated specific heat as a function of temperature of each involved inorganicsalt is presented in Figure 17. “Mix” represents the calculated specific heat of the thermalinsulation inorganic salt mixture, as given in Appendix C.
Materials 2021, 14, 4721 14 of 23
Materials 2021, 14, 4721 14 of 24
Previous thermal gravitational analysis (TGA)/differential thermal analysis (DTA), and differential scanning calorimetry (DSC) [20,22] revealed that critical phase changes take place close to a temperature of 1200 °C. It may then be assumed that only minor changes in inorganic salt concentrations may alter the thermal insulation properties con-siderably when approaching 1200 °C. The results obtained for heat treatment at 1200 °C may therefore be taken as an indication rather than as a robust estimate. This must be taken into consideration in future numerical modeling.
3.3. Volumetric Heat Capacity The calculated specific heat as a function of temperature of each involved inorganic
salt is presented in Figure 17. “Mix” represents the calculated specific heat of the thermal insulation inorganic salt mixture, as given in Appendix C.
The specific heat may also be calculated from the TPS measurements. The strength of that measurement method is, however, the thermal conductivity, while estimates of the thermal diffusivity are generally less accurate. The extrapolated data from the TPS meas-urements compared to the calculated volumetric heat from the composition are shown in Figure 18. Due to the uncertainties in the TPS method, estimating specific heat from the chemical composition is believed to give a more accurate specific heat compared to the less reliable TPS data, which additionally represents extrapolated values.
Figure 17. Calculated specific heat capacity as a function of temperature. Based on literature data presented in Appendix C. Figure 17. Calculated specific heat capacity as a function of temperature. Based on literature datapresented in Appendix C.
The specific heat may also be calculated from the TPS measurements. The strengthof that measurement method is, however, the thermal conductivity, while estimates ofthe thermal diffusivity are generally less accurate. The extrapolated data from the TPSmeasurements compared to the calculated volumetric heat from the composition are shownin Figure 18. Due to the uncertainties in the TPS method, estimating specific heat from thechemical composition is believed to give a more accurate specific heat compared to the lessreliable TPS data, which additionally represents extrapolated values.
Materials 2021, 14, 4721 15 of 24
Figure 18. Measured and extrapolated volumetric heat capacity compared to the calculated volumetric heat capacity of the thermal insulation (---).
3.4. Crack Formation The shrinkage results in gaps in the insulation mat, as shown in Figure 2. During high
temperature fire testing, these gaps may represent heat radiation shortcuts for the heat transfer from the heat-exposed cladding towards still-intact thermal insulation, and pos-sibly to the perforated plate and the steel object to be protected. For future modelling, the heat radiation through these gaps also has to be modelled.
The cracking caused by the insulation shrinkage is temperature-dependent. As the temperature increases during fire testing, more cracking will occur deeper into the ther-mal insulation.
The shrinkage of the samples, presented in Figure 7, was measured in both directions, i.e., along the length and width of the thermal insulation mat of the originally 50 mm by 50 mm (long and wide) test specimens. The shrinkage in height (z-direction) is accounted for in the apparent thermal conductivity, while the shrinkage in the x- and y-direction may represent the cracking.
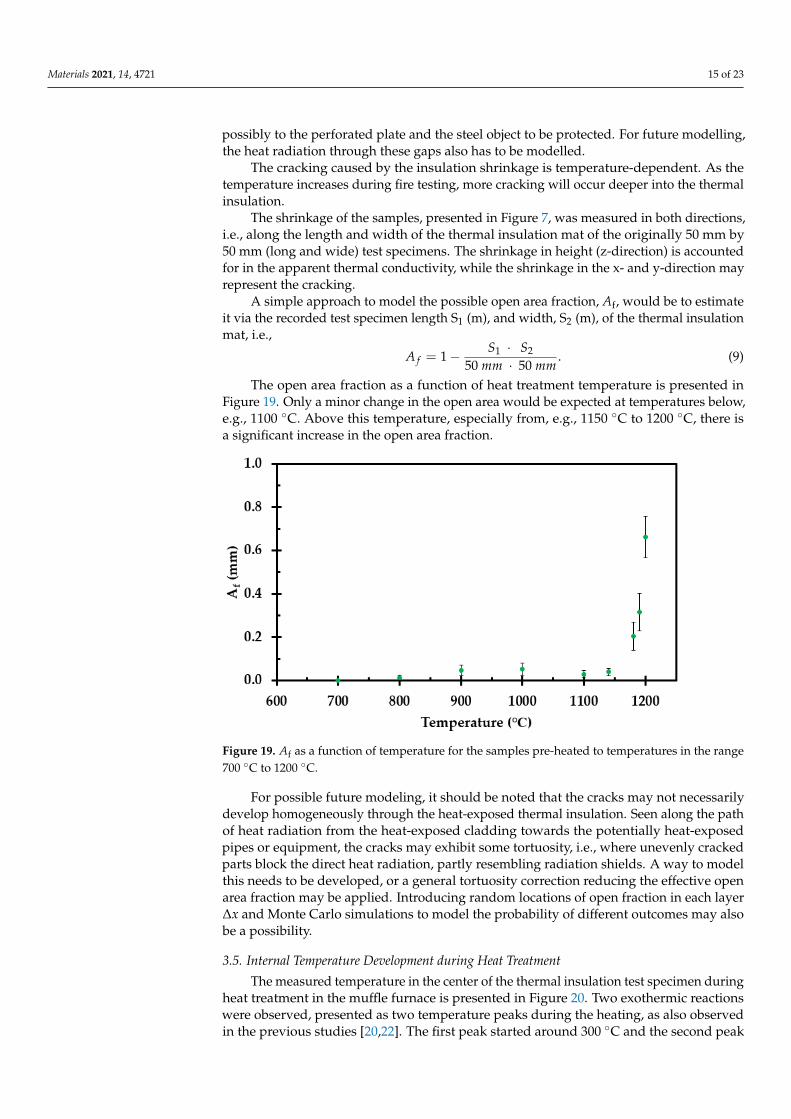
A simple approach to model the possible open area fraction, Af, would be to estimate it via the recorded test specimen length S1 (m), and width, S2 (m), of the thermal insulation mat, i.e., 𝐴 = 1 − ⋅ ⋅ . (9)
The open area fraction as a function of heat treatment temperature is presented in Figure 19. Only a minor change in the open area would be expected at temperatures be-low, e.g., 1100 °C. Above this temperature, especially from, e.g., 1150 °C to 1200 °C, there is a significant increase in the open area fraction.
Figure 18. Measured and extrapolated volumetric heat capacity compared to the calculated volumet-ric heat capacity of the thermal insulation (—).
3.4. Crack Formation
The shrinkage results in gaps in the insulation mat, as shown in Figure 2. Duringhigh temperature fire testing, these gaps may represent heat radiation shortcuts for theheat transfer from the heat-exposed cladding towards still-intact thermal insulation, and
Materials 2021, 14, 4721 15 of 23
possibly to the perforated plate and the steel object to be protected. For future modelling,the heat radiation through these gaps also has to be modelled.
The cracking caused by the insulation shrinkage is temperature-dependent. As thetemperature increases during fire testing, more cracking will occur deeper into the thermalinsulation.
The shrinkage of the samples, presented in Figure 7, was measured in both directions,i.e., along the length and width of the thermal insulation mat of the originally 50 mm by50 mm (long and wide) test specimens. The shrinkage in height (z-direction) is accountedfor in the apparent thermal conductivity, while the shrinkage in the x- and y-direction mayrepresent the cracking.
A simple approach to model the possible open area fraction, Af, would be to estimateit via the recorded test specimen length S1 (m), and width, S2 (m), of the thermal insulationmat, i.e.,
A f = 1 − S1 · S2
50 mm · 50 mm. (9)
The open area fraction as a function of heat treatment temperature is presented inFigure 19. Only a minor change in the open area would be expected at temperatures below,e.g., 1100 ◦C. Above this temperature, especially from, e.g., 1150 ◦C to 1200 ◦C, there isa significant increase in the open area fraction.
Materials 2021, 14, 4721 16 of 24
Figure 19. Af as a function of temperature for the samples pre-heated to temperatures in the range 700 °C to 1200 °C.
For possible future modeling, it should be noted that the cracks may not necessarily develop homogeneously through the heat-exposed thermal insulation. Seen along the path of heat radiation from the heat-exposed cladding towards the potentially heat-ex-posed pipes or equipment, the cracks may exhibit some tortuosity, i.e., where unevenly cracked parts block the direct heat radiation, partly resembling radiation shields. A way to model this needs to be developed, or a general tortuosity correction reducing the effec-tive open area fraction may be applied. Introducing random locations of open fraction in each layer Δx and Monte Carlo simulations to model the probability of different outcomes may also be a possibility.
3.5. Internal Temperature Development During Heat Treatment The measured temperature in the center of the thermal insulation test specimen dur-
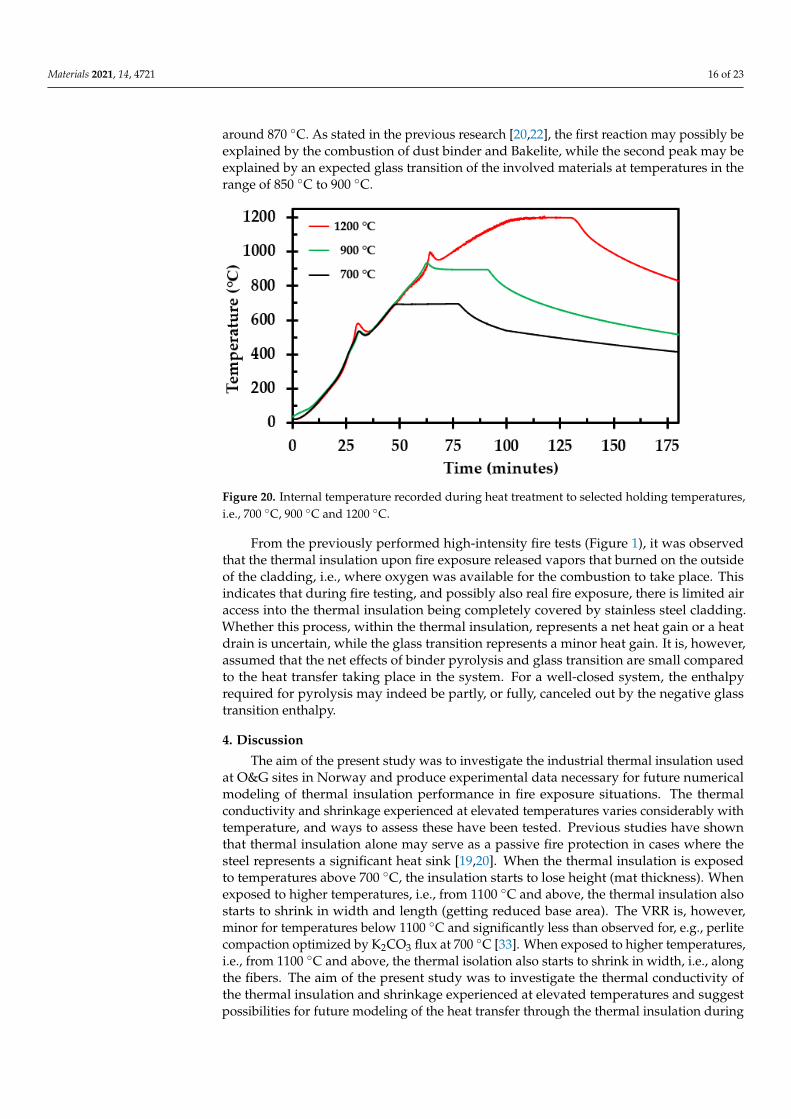
ing heat treatment in the muffle furnace is presented in Figure 20. Two exothermic reac-tions were observed, presented as two temperature peaks during the heating, as also ob-served in the previous studies [20,22]. The first peak started around 300 °C and the second peak around 870 °C. As stated in the previous research [20,22], the first reaction may pos-sibly be explained by the combustion of dust binder and Bakelite, while the second peak may be explained by an expected glass transition of the involved materials at tempera-tures in the range of 850 °C to 900 °C.
From the previously performed high-intensity fire tests (Figure 1), it was observed that the thermal insulation upon fire exposure released vapors that burned on the outside of the cladding, i.e., where oxygen was available for the combustion to take place. This indicates that during fire testing, and possibly also real fire exposure, there is limited air access into the thermal insulation being completely covered by stainless steel cladding. Whether this process, within the thermal insulation, represents a net heat gain or a heat drain is uncertain, while the glass transition represents a minor heat gain. It is, however, assumed that the net effects of binder pyrolysis and glass transition are small compared to the heat transfer taking place in the system. For a well-closed system, the enthalpy re-quired for pyrolysis may indeed be partly, or fully, canceled out by the negative glass transition enthalpy.
Figure 19. Af as a function of temperature for the samples pre-heated to temperatures in the range700 ◦C to 1200 ◦C.
For possible future modeling, it should be noted that the cracks may not necessarilydevelop homogeneously through the heat-exposed thermal insulation. Seen along the pathof heat radiation from the heat-exposed cladding towards the potentially heat-exposedpipes or equipment, the cracks may exhibit some tortuosity, i.e., where unevenly crackedparts block the direct heat radiation, partly resembling radiation shields. A way to modelthis needs to be developed, or a general tortuosity correction reducing the effective openarea fraction may be applied. Introducing random locations of open fraction in each layer∆x and Monte Carlo simulations to model the probability of different outcomes may alsobe a possibility.
3.5. Internal Temperature Development during Heat Treatment
The measured temperature in the center of the thermal insulation test specimen duringheat treatment in the muffle furnace is presented in Figure 20. Two exothermic reactionswere observed, presented as two temperature peaks during the heating, as also observedin the previous studies [20,22]. The first peak started around 300 ◦C and the second peak
Materials 2021, 14, 4721 16 of 23
around 870 ◦C. As stated in the previous research [20,22], the first reaction may possibly beexplained by the combustion of dust binder and Bakelite, while the second peak may beexplained by an expected glass transition of the involved materials at temperatures in therange of 850 ◦C to 900 ◦C.
Materials 2021, 14, 4721 17 of 24
Figure 20. Internal temperature recorded during heat treatment to selected holding tem-peratures, i.e., 700 °C, 900 °C and 1200 °C.
4. Discussion The aim of the present study was to investigate the industrial thermal insulation used
at O&G sites in Norway and produce experimental data necessary for future numerical modeling of thermal insulation performance in fire exposure situations. The thermal con-ductivity and shrinkage experienced at elevated temperatures varies considerably with temperature, and ways to assess these have been tested. Previous studies have shown that thermal insulation alone may serve as a passive fire protection in cases where the steel represents a significant heat sink [19,20]. When the thermal insulation is exposed to tem-peratures above 700 °C, the insulation starts to lose height (mat thickness). When exposed to higher temperatures, i.e., from 1100 °C and above, the thermal insulation also starts to shrink in width and length (getting reduced base area). The VRR is, however, minor for temperatures below 1100 °C and significantly less than observed for, e.g., perlite compac-tion optimized by K2CO3 flux at 700 °C [33]. When exposed to higher temperatures, i.e., from 1100 °C and above, the thermal isolation also starts to shrink in width, i.e., along the fibers. The aim of the present study was to investigate the thermal conductivity of the thermal insulation and shrinkage experienced at elevated temperatures and suggest pos-sibilities for future modeling of the heat transfer through the thermal insulation during fire testing. However, concepts for analyzing gap formation also have to be included in a prospective model.
The industrial thermal insulation studied is a material with concentrations of inor-ganic salts varying within given limits (Table A3), i.e., the composition of the insulation may determine the eutectic point of the insulation, and hence this may vary between dif-ferent production batches. This may be seen from the muffle furnace tests performed in this study, compared with the muffle furnace tests performed in the previous study [17], considering samples heat treated to 1200 °C. There is a clear difference between the two samples, both visually and as demonstrated by the measured density. The thermal insu-lation changed from a soft, porous consistency to a stone like material after exposure to 1200 °C. This is more obvious in [22], where it shows total breakdown/melting of the in-sulation. In the present study, the thermal insulation had still shrunk considerably in all directions; however, clear signs that melting had taken place were not observed. Consid-ering flame, or cladding, temperatures of 1200 °C, an, e.g., ±20 °C variation in the eutectic temperature could have a large influence on the performance of the thermal insulation when exposed to a cladding temperature of 1200 °C. The shrinkage of the insulation test
Figure 20. Internal temperature recorded during heat treatment to selected holding temperatures,i.e., 700 ◦C, 900 ◦C and 1200 ◦C.
From the previously performed high-intensity fire tests (Figure 1), it was observedthat the thermal insulation upon fire exposure released vapors that burned on the outsideof the cladding, i.e., where oxygen was available for the combustion to take place. Thisindicates that during fire testing, and possibly also real fire exposure, there is limited airaccess into the thermal insulation being completely covered by stainless steel cladding.Whether this process, within the thermal insulation, represents a net heat gain or a heatdrain is uncertain, while the glass transition represents a minor heat gain. It is, however,assumed that the net effects of binder pyrolysis and glass transition are small comparedto the heat transfer taking place in the system. For a well-closed system, the enthalpyrequired for pyrolysis may indeed be partly, or fully, canceled out by the negative glasstransition enthalpy.
4. Discussion
The aim of the present study was to investigate the industrial thermal insulation usedat O&G sites in Norway and produce experimental data necessary for future numericalmodeling of thermal insulation performance in fire exposure situations. The thermalconductivity and shrinkage experienced at elevated temperatures varies considerably withtemperature, and ways to assess these have been tested. Previous studies have shownthat thermal insulation alone may serve as a passive fire protection in cases where thesteel represents a significant heat sink [19,20]. When the thermal insulation is exposedto temperatures above 700 ◦C, the insulation starts to lose height (mat thickness). Whenexposed to higher temperatures, i.e., from 1100 ◦C and above, the thermal insulation alsostarts to shrink in width and length (getting reduced base area). The VRR is, however,minor for temperatures below 1100 ◦C and significantly less than observed for, e.g., perlitecompaction optimized by K2CO3 flux at 700 ◦C [33]. When exposed to higher temperatures,i.e., from 1100 ◦C and above, the thermal isolation also starts to shrink in width, i.e., alongthe fibers. The aim of the present study was to investigate the thermal conductivity ofthe thermal insulation and shrinkage experienced at elevated temperatures and suggestpossibilities for future modeling of the heat transfer through the thermal insulation during
Materials 2021, 14, 4721 17 of 23
fire testing. However, concepts for analyzing gap formation also have to be included ina prospective model.
The industrial thermal insulation studied is a material with concentrations of inorganicsalts varying within given limits (Table A3), i.e., the composition of the insulation maydetermine the eutectic point of the insulation, and hence this may vary between differentproduction batches. This may be seen from the muffle furnace tests performed in this study,compared with the muffle furnace tests performed in the previous study [17], consideringsamples heat treated to 1200 ◦C. There is a clear difference between the two samples, bothvisually and as demonstrated by the measured density. The thermal insulation changedfrom a soft, porous consistency to a stone like material after exposure to 1200 ◦C. Thisis more obvious in [22], where it shows total breakdown/melting of the insulation. Inthe present study, the thermal insulation had still shrunk considerably in all directions;however, clear signs that melting had taken place were not observed. Considering flame,or cladding, temperatures of 1200 ◦C, an, e.g., ±20 ◦C variation in the eutectic temperaturecould have a large influence on the performance of the thermal insulation when exposedto a cladding temperature of 1200 ◦C. The shrinkage of the insulation test specimen is notproportional—the insulation may shrink more in one direction than another, especiallyat temperatures above 1100 ◦C, as shown in Figure 6. Hence, the measurement of theremaining test specimen volume is a “best estimate” for a random thermal insulation batch.
It was demonstrated that the thermal conductivity is dominated by heat radiationwithin the pores up to 700 ◦C, i.e., the thermal conductivity increased with absolute tem-perature to the third power. The reported ambient thermal conductivity is slightly higherin the present study compared to the previously reported ambient thermal conductivityin [22]. This may be explained by differences between different thermal insulation batches,e.g., chemically or by different weaving of the thermal insulation fibers.
With further temperature increase, the thermal conductivity decreased due to sinteringand pore size reduction at 800 ◦C. Above 900 ◦C, i.e., above the glass transition tempera-ture, the thermal conductivity increased with temperature as expected for an amorphousmaterial. Additionally, further compacted by sintering, and finally by partly melting as itapproached an assumed eutectic temperature close to 1200 ◦C, the thermal conductivityincreased with temperature.
It may seem quite strange that the thermal conductivity increases up to 700 ◦C, forit then to drop significantly at 800 ◦C, and above this temperature it starts increasingagain with increasing temperature. This may, however, be explained by the fact that whenpreheating the insulation to 700 ◦C, there are limited dimensional changes in the inorganicinsulation components, i.e., the pore radiation is still dominating. The sample preheated to900 ◦C and above shrank in height and was more compact. These samples are amorphous,explaining the drop in the conductivity, evidenced by the conductivity following a morelinear trend with increasing temperature [34]. From 700 ◦C to 900 ◦C, there seems to bea drop in the thermal conductivity. This may be explained be the sintering process thatstarts just above 700 ◦C, before the transition to a more amorphous material at around900 ◦C. Above 1100 ◦C, the breakdown of the thermal insulation accelerates, also affectingthe thermal conductivity. The concept of apparent thermal conductivity was introduced tocompensate for the observed shrinkage along the insulation mat thickness. This apparentthermal conductivity may enable/enhance future numerical modeling.
Extrapolating the thermal conductivity results to heat treatment temperatures be-yond 700 ◦C increases the ±7% uncertainty in the recorded thermal conductivity. Up to1100 ◦C, it may seem reasonable to extrapolate the trend, as there is little change in theinsulation. However, extrapolation up to temperatures near the eutectic point, where thereis a significant change in the thermal insulation properties, there is a much higher degreeof uncertainty in the results. Hence, a ±10% uncertainty is considered as an uncertaintyestimate. As the chemical compositions of the different thermal insulation batches mayvary some, especially the recorded and extrapolated results at heat treatment temperaturesclose to 1200 ◦C may be different from one batch to another batch. Thus, the differences

Materials 2021, 14, 4721 18 of 23
in thermal conductivity at these temperatures may deviate even more for a random ther-mal insulation batch. Studying this variation was, however, not within the scope of thepresent study.
As for the upper temperature region, this may also apply for the lowest region ofthe testing, regarding the measurements around 700 ◦C. Small differences between insu-lation batches may influence the sintering process and at which temperature sinteringstarts. Hence, the results from the TPS measurements may represent a larger uncertainty,depending on the insulation batch.
The estimated value for the apparent thermal conductivity was, for the sake of sim-plicity, presented as three equations. Considering Equation (6) for the 700 ◦C to 1000 ◦Cregion, the equations fit quite well for all the involved measurements points, except for theextrapolated value at 900 ◦C, where it misses by approximately 10%. However, it does givea conservative estimate. The same deviation can be seen in one of the measurement pointsin Equation (7), regarding the region from 1100 ◦C to 1200 ◦C. However, the equations givea good estimate of the overall thermal conductivity.
At temperatures above 1100 ◦C, heat radiation through cracks will likely dominatethe heat transfer through the degraded thermal insulation. The shrinkage of the insulation,that results in cracks, may be more difficult, but highly necessary, to model properly. Thecracks may be quite random and may not necessarily penetrate the insulation, i.e., thecracks may exhibit some tortuosity along the main direction of heat radiation from thefire-exposed cladding to the object to be protected. In the present study, an estimate ofthe open fraction has been made based upon the shrinkage in the two principal directions,i.e., along the thermal insulation mat width and length. This was done as a function oftemperature based upon the results from the muffle furnace tests. However, a way tomodel the cracks and heat transfer through the cracks must be developed. Alternatively,a general tortuosity correction reducing the effective open area could potentially be applied.Introducing random locations of the estimated open fraction in each layer of thickness ∆xand using Monte Carlo simulations to model the probability of different outcomes mayalso be considered.
The specific heat was calculated from the chemical composition of the thermal in-sulation and with knowledge of the density, the corresponding volumetric heat capacitywas obtained. The volumetric heat capacity was also estimated based on the TPS mea-surements, i.e., based on the recorded thermal conductivity and thermal diffusivity [32].The TPS method is not as accurate for measuring thermal diffusivity as for measuringthermal conductivity. Thus, there is a higher degree of uncertainty in the volumetric heatcapacity obtained by the TPS method. When performing TPS measurements at 700 ◦Cfor the sample previously heat treated at 700 ◦C, further sintering of the insulation mayhave resulted in poor contact between the thermal insulation and the sensor, influencingthe measurement results. This may be an explanation for the differences between the twomethods for assessing volumetric heat capacity, as seen in Figure 18. Hence, calculatingspecific heat from literature data is recommended as the most reliable method.
During the muffle furnace heat treatment, there was air access to the interior of thetest specimens. Thus, dust binder and Bakelite pyrolysis, and subsequent oxidation, clearlyresulted in a net heating of the test specimens. However, during fire testing, as shownin Figure 1, it is more unclear as to whether there is a net gain or drain of heat from themuch more sealed thermal insulation. During high-intensity fire tests (Figure 1), it wasobserved that upon fire exposure, the thermal insulation released vapors that ignited,and burned, on the outside of the cladding, i.e., in contact with air. This indicates thatduring fire testing, and possibly also real fire exposure, there is very limited air accessinto the thermal insulation which is completely covered by stainless steel cladding. Theglass transition represents a minor heat gain, which may partly or fully cancel out theheat required for binder material and Bakelite pyrolysis. Further TGA/DSC tests may benecessary to answer this question.

Materials 2021, 14, 4721 19 of 23
There are some differences in the results obtained for test specimens heat treated to1200 ◦C compared to similar tests [32]. However, due to the different compositions andnon-homogeneities in the thermal insulation, the breakdown temperature of the thermalinsulation will not be absolute. It is therefore recommended to test several different insula-tion mats, from different production batches, to check whether there are large differencesbetween the batches or not. In the first place, this may be done by, e.g., muffle furnace heattreatment as in the present study and/or TGA/DSC, to verify any differences in meltingtemperature between the batches. It is also recommended to study the influence of theholding time on the thermal conductivity and geometric dimensions of the heat-treated testspecimens. It should be mentioned that thermal insulation and fire protection may result incorrosion. Hence, fire protection should therefore only be used where strictly required [9].
When pipes and equipment are already thermally insulated with the product studiedin the present work, adding a thin layer of passive fire protection could for an extendedperiod prevent the thermal insulation from reaching temperatures above 1100 ◦C. Thiscould prevent significant dimensional changes, cracks, etc. in the thermal insulation underfire exposure. Testing this in the future would be very beneficial. Such studies may revealthat the thermal insulation under such circumstances may survive quite extended periodsof fire exposure.
5. Conclusions
By heat treating thermal insulation test specimens and recording the thermal conduc-tivity up to 700 ◦C, and extrapolating to heat treatment temperatures above this value,it was possible to obtain an estimate of the thermal conductivity during fire exposure.This is expressed by empirical equations. However, as the temperature passes 1100 ◦C,the data will become less reliable, especially when approaching 1200 ◦C, i.e., where thethermal insulation disintegrates. For future numerical modeling of the heat flow throughthe thermal insulation to a steel member, shrinkage must also be considered, as this resultsin an open area fraction and more direct heat transfer. The promising behavior up to1100 ◦C is, however, great news, as it may be possible to apply a layer of thermally robustfire insulation preventing the thermal insulation to reach temperatures above 1100 ◦C. Thiswould extend the fire resistance of the thermal insulation considerably and could reducethe demand for blowdown and flare system capacity in aging O&G industry sites. Thedata obtained in the present study may allow for future numerical modeling of such fireexposure scenarios.
Author Contributions: T.L. conceived the project idea. M.-M.M. guided A.G. when performing theheat treatment tests and preparing samples for TPS measurements and determining density andthermal conductivity. A.G. did all data preparation; all authors were involved in analyzing the data.A.G. prepared the artwork and wrote the first draft paper. All authors were involved in writing thefinal paper. All authors have read and agreed to the published version of the manuscript.
Funding: A.G. was supported by Gassco Inc., Norway, and the Norwegian Research Council, GrantNo. 305336. The project as such was funded by Gassco.
Institutional Review Board Statement: Not applicable.
Informed Consent Statement: Not applicable.
Data Availability Statement: Data available on request.
Acknowledgments: The authors would like to acknowledge Leif Inge Larsen for supplying testmaterials and Hot Disk AB for performing TPS measurements. Technical data for the thermalinsulation, supplied by Søren Nyborg Rasmussen, Rockwool, is also much appreciated.
Conflicts of Interest: None of the participants in the study have any connections to specific equip-ment or materials being mentioned in the paper.
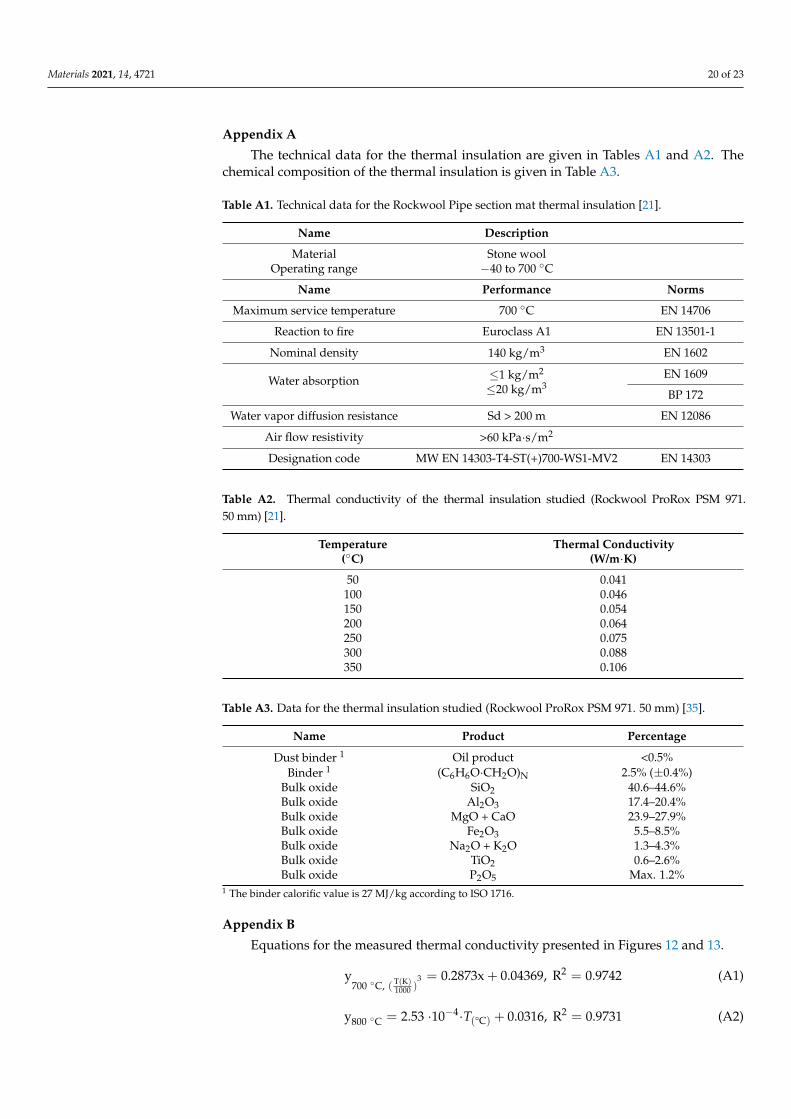
Materials 2021, 14, 4721 20 of 23
Appendix A
The technical data for the thermal insulation are given in Tables A1 and A2. Thechemical composition of the thermal insulation is given in Table A3.
Table A1. Technical data for the Rockwool Pipe section mat thermal insulation [21].
Name Description
Material Stone woolOperating range −40 to 700 ◦C
Name Performance Norms
Maximum service temperature 700 ◦C EN 14706
Reaction to fire Euroclass A1 EN 13501-1
Nominal density 140 kg/m3 EN 1602
Water absorption ≤1 kg/m2
≤20 kg/m3EN 1609
BP 172
Water vapor diffusion resistance Sd > 200 m EN 12086
Air flow resistivity >60 kPa·s/m2
Designation code MW EN 14303-T4-ST(+)700-WS1-MV2 EN 14303
Table A2. Thermal conductivity of the thermal insulation studied (Rockwool ProRox PSM 971.50 mm) [21].
Temperature(◦C)
Thermal Conductivity(W/m·K)
50 0.041100 0.046150 0.054200 0.064250 0.075300 0.088350 0.106
Table A3. Data for the thermal insulation studied (Rockwool ProRox PSM 971. 50 mm) [35].
Name Product Percentage
Dust binder 1 Oil product <0.5%Binder 1 (C6H6O·CH2O)N 2.5% (±0.4%)
Bulk oxide SiO2 40.6–44.6%Bulk oxide Al2O3 17.4–20.4%Bulk oxide MgO + CaO 23.9–27.9%Bulk oxide Fe2O3 5.5–8.5%Bulk oxide Na2O + K2O 1.3–4.3%Bulk oxide TiO2 0.6–2.6%Bulk oxide P2O5 Max. 1.2%
1 The binder calorific value is 27 MJ/kg according to ISO 1716.
Appendix B
Equations for the measured thermal conductivity presented in Figures 12 and 13.
y700 ◦C, ( T(K)
1000 )3 = 0.2873x + 0.04369, R2 = 0.9742 (A1)
y800 ◦C = 2.53 ·10−4·T(°C) + 0.0316, R2 = 0.9731 (A2)

Materials 2021, 14, 4721 21 of 23
y900 ◦C = 2.50·10−4·T(°C) + 0.0352, R2 = 0.9722 (A3)
y1000 ◦C = 2.11·10−4·T(°C) + 0.0356, R2 = 0.9512 (A4)
y1100 ◦C = 1.98·10−4·T(°C) + 0.0498, R2 = 0.9665 (A5)
y1140 ◦C = 1.97·10−4·T(°C) + 0.0573, R2 = 0.9633 (A6)
y1180 ◦C = 2.57·10−4·T(°C) + 0.0773, R2 = 0.9639 (A7)
y1190 ◦C = 2.83·10−4·T(°C) + 0.157, R2 = 0.9227 (A8)
y1200 ◦C = 2.11·10−4·T(°C) + 0.355, R2 = 0.8851 (A9)
Appendix C
The heat capacity of the insulation mixture is calculated from Equation (A10), basedon data given in Table A4.
Cp = A + B·T + C·T2 + D·T3 +ET2 (A10)
Table A4. Data for the components in the thermal insulation given in Table A3 [36–43].
Percentage(%) 42.54 19.33 1.64 7.16 13.24 13.24 1.43 1.43
Product SiO2 Al2O3 TiO2 Fe2O3 MgO CaO Na2O K2OMw
(g/mol) 60.0843 101.9613 79.866 159.688 40.3044 56.077 61.9789 94.196
Mw(kg/mol) 0.0600843 0.1019613 0.079866 0.159688 0.0403044 0.056077 0.0619789 0.094196
T (◦C) 298–847 298–2327 298–2000 298–950 298–3105 298–3200 298–1023 298–700A −6.076591 106.918 67.2983 93.43834 47.25995 49.95403 25.5754 245.0104B 251.6755 36.6219 18.7094 108.3577 5.681621 4.887916 177.71 −567.0492C −324.7964 −13.9759 −11.579 −50.86447 −0.872665 −0.352056 −166.335 778.7219D 168.5604 2.15799 2.449561 25.58683 0.1043 0.046187 57.6116 −346.2641E 0.002548 −3.157761 −1.485471 −1.61133 −1.053955 −0.825097 0.338149 −4.653361
T (◦C) 847–1996 - - 950–1050 - - 1023–1243 700–2000A 58.7534 150.624 −125.773 72.55098B 10.27925 0 302.074 41.39097C −0.131384 0 −140.642 −0.728497D 0.02521 0 21.324 0.218564E 0.025601 0 38.2831 0.066026
T (◦C) - - - 1050–2500 - - 1243–1405 -A 110.9362 2240.95B 32.04714 −3209.97C −9.192333 1803.69D 0.901506 −359.073E 5.433677 −386.248
References1. Bakka, M.S.; Eriksen, B.; Johansen, O.J.; Oltedal, H.L.; Log, T.; Rogde, S. Brann i Luftinntak på Gassturbin GTG4, Hammerfest
LNG 20.09.2020 (Fire in Air Gas Turbine GTG4 Air Intake, Hammerfest LNG, 20.09.2020), Equinor Corporate Investigation Report,A MMP L2 2020-18, 131p. Available online: https://www.equinor.com/content/dam/statoil/documents/newsroom-additional-documents/news-attachments/endelig-rapport-coa-gransking-hlng-brann.pdf (accessed on 12 May 2021). (In Norwegian).
2. Hallan, B.; Rundell, L.-R.; Thorsen, A.J.; Steinbakk, A.-H.; Sundby, T. Report of the Investigation of a Fire in the Air Intake ofGTG4 at Hammerfest LNG, Melkøya, Activity 001901043, 45p. Available online: www.ptil.no/contentassets/3391c6686b2b4265abe8585294151335/2020_1862_rapport-equinor-hammerfest-lng-gransking-eng.pdf (accessed on 12 May 2021).
Materials 2021, 14, 4721 22 of 23
3. Handal, E.; Sandvik, O.-I.; de Jong, H.; Bondevik, T.B.; Ovesen, R.V. Brann i Kompressorhus på Tjeldbergodden (Fire inCompressor House at Tjeldbergodden), Equinor Corporate Investigation report, A MMP L2 2020-18, 103p. Available online:https://www.equinor.com/content/dam/statoil/documents/newsroom-additional-documents/news-attachments/endelig-rapport-coa-gransking-tbo-brann.pdf (accessed on 12 May 2021). (In Norwegian).
4. Landro, E.; Haug, B.A.; Mihajlovic, D.; Sande, E.; Steinbakk, A.H. Report Following the Investigation of a Turbine Breakdownwith Subsequent Fire at Tjeldbergodden on 2 December 2020, Activity 001904026, 39p. Available online: https://www.ptil.no/contentassets/d7cb364377b741a597c8b85dd06c8ce9/2020_2201-rapport-eng-gransking-equinor-tjeldbergodden.pdf (accessed on24 June 2021). (In Norwegian)
5. Scandpower. Guidelines for the Protection of Pressurised Systems Exposed to Fire; Report No. 27.207.291/R1, Version 2; Scandpower:Kjeller, Norway, 2004.
6. Norsk Standard. S-001 Technical Safety. NORSOK Standard, 5th ed.; Norwegian Technology Standards Institution: Oslo, Norway,2018; Available online: http://www.standard.no (accessed on 13 June 2020).
7. Bahadori, A. Thermal Insulation Handbook for the Oil, Gas, and Petrochemical Industries; Elsevier BV: Amsterdam, The Netherlands, 2014.8. API. API RP 583: Recommended Practice 583: Corrosion under Insulation and Fireproofing, 1st ed.; American Petroleum Institute:
Washington, DC, USA, 2014.9. Choi, J.-Y.; Beyeon, S.-H. Overview of the Legal Design Basis for Passive Fire Protection in Korea and the Direction of Further
Development. Sustainability 2021, 13, 1674. [CrossRef]10. API. API RP 2218: Recommended Practice 2218: Fireproofing Practices in Petroleum and Petrochemical Processing Plants, 3rd ed.;
American Petroleum Institute: Washington, DC, USA, 2013.11. ASTM. ASTM E1725:19: Standard Test Methods for Fire Tests of Fire-Resistive Barrier Systems for Electrical System Components; ASTM
International: West Conshohocken, PA, USA, 2019. [CrossRef]12. Equinor. Performance Standards for Safety Systems and Barriers—Onshore; TR2237; Equinor: Tysværvåg, Norway, 2020; Volume 4,
p. 15.13. Lovdata. Forskrift om Tekniske og Operasjonelle Forhold på Landanlegg i Petroleumsvirksomheten med mer (Teknisk og
operasjonell forskrift). §35. Available online: https://lovdata.no/dokument/SF/forskrift/2010-04-29-612 (accessed on 18June 2021).
14. Sjöström, J.; Jansson, R. Measuring thermal material properties for structural fire engineering. In Proceedings of the 15thInternational Conference on Experimental Mechanics, ICEM15, Porto, Portugal, 22–27 July 2012.
15. Olsen, H.; Sjöström, J.; Jansson, R.; Anderson, J. Thermal Properties of Heated Insulation Materials. In Proceedings of the 13thInternational Fire and Engineer Conference, INTERFLAM, London, UK, 24–26 June 2013.
16. Livkiss, K.; Andres, B.; Bhargava, A.; Van Hees, P. Characterization of stone wool properties for fire safety engineering calculations.J. Fire Sci. 2018, 36, 202–223. [CrossRef]
17. Moesgaard, M.; Pedersen, H.; Yue, Y.; Nielsen, E. Crystallization in stone wool fibres. J. Non-Cryst. Solids. 2007, 353, 1101–1108.[CrossRef]
18. Liu, K.-S.; Zheng, X.-F.; Hsieh, C.-H.; Lee, S.-K. The Application of Silica-Based Aerogel Board on the Fire Resistance and ThermalInsulation Performance Enhancement of Existing External Wall System Retrofit. Energies 2021, 14, 4518. [CrossRef]
19. Bjørge, J.S.; Metallinou, M.-M.; Kraaijeveld, A.; Log, T. Small Scale Hydrocarbon Fire Test Concept. Technologies 2017, 5, 72.[CrossRef]
20. Bjørge, J.S.; Gunnarshaug, A.; Log, T.; Metallinou, M.-M. Study of Industrial Grade Thermal Insulation as Passive Fire Protectionup to 1200 ◦C. Safety. 2018, 4, 41. [CrossRef]
21. Rockwool. Available online: https://www.rockwool.co.uk/product-overview/hvac/pipe-section-mat-psm-en-gb/?selectedCat=downloads (accessed on 15 January 2021).
22. Gunnarshaug, A.; Metallinou, M.-M.; Log, T. Study of industrial grade thermal insulation at elevated temperatures. Materials2020, 13, 4613. [CrossRef] [PubMed]
23. Keerthan, P.; Mahendran, M. Thermal Performance of Composite Panels under Fire Conditions Using Numerical Studies:Plasterboards, Rockwool, Glass Fibre and Cellulose Insulations. Fire Technol. 2012, 49, 329–356. [CrossRef]
24. Thomas, G.C. Fire Resistance of Light Timber Framed Walls and Floors. Ph.D. Thesis, University of Canterbury, Christchurch,New Zeeland, 1996.
25. Schleifer, V. Zum Verhalten von Raumabschliessenden Mehrschichtigen Holzbauteilen im Brandfall. Ph.D. Thesis, ETH ZurichUniversity, Zurich, Switzerland, 2009.
26. Equinor. The Insulation Handbook; TR1660; Equinor: Tysværvåg, Norway, 2019; Volume 6.02, Appendix A, Item 3.27. Rockwool. Available online: https://www.rockwool.com/west-virginia/factory-operations-and-production (accessed on 1
October 2020).28. Solyman, W.S.; Nagiub, H.M.; Alian, N.A.; Shaker, N.O.; Kandil, U.F. Synthesis and characterization of phenol/formaldehyde
nanocomposites: Studying the effect of incorporating reactive rubber nanoparticles or Cloisite-30B nanoclay on the mechanicalproperties, morphology and thermal stability. J. Radiat. Res. Appl. Sci. 2017, 10, 72–79. [CrossRef]
29. Log, T. Thermal Conductivity of Carbon Materials. Ph.D. Thesis, Institute of Inorganic Chemistry, National Institute of Technologyand Science, Trondheim, Norway, 1989.
Materials 2021, 14, 4721 23 of 23
30. Kingery, W.D. Thermal Conductivity: XII, Temperature Dependence of Conductivity for Single-Phase Ceramics. J. Am. Ceram.Soc. 1955, 38, 251–255. [CrossRef]
31. Log, T.; Gustafsson, S.E. Transient plane source (TPS) technique for measuring thermal transport properties of building materials.Fire Mater. 1995, 19, 43–49. [CrossRef]
32. International Organization for Standardization. Plastics—Determination of Thermal Conductivity and Thermal Diffusivity—Part2: Transient Plane Heat Source (Hot Disc) Method; ISO 22007:2; International Organization for Standardization: Geneva,Switzerland, 2015.
33. Chou, Y.-S.; Singh, B.; Chen, Y.-S.; Yen, S.-C. Study on Volume Reduction of Radioactive Perlite Thermal Insulation Wastes byHeat Treatment with Potassium Carbonate. Nuclear Eng. Technol. 2021, in press. [CrossRef]
34. Seltveit, A. Ildfaste Materialer (Refractory materials), 1st ed.; Tapir: Trondheim, Norway, 1980.35. Rasmussen, S.N.; ROCKWOOL Inc., Hedehusene, Denmark. Personal communication, 2018.36. National Institute of Standards and Technology. Available online: http://webbook.nist.gov/cgi/cbook.cgi?ID=C14808607&
Type=JANAFS&Table=on (accessed on 20 June 2021).37. National Institute of Standards and Technology. Available online: http://webbook.nist.gov/cgi/cbook.cgi?ID=C1344281&Units=
SI&Mask=2#Thermo-Condensed (accessed on 20 June 2021).38. National Institute of Standards and Technology. Available online: http://webbook.nist.gov/cgi/cbook.cgi?ID=C1317802&Units=
SI&Mask=2&Type=JANAFS&Plot=on#JANAFS (accessed on 20 June 2021).39. National Institute of Standards and Technology. Available online: http://webbook.nist.gov/cgi/cbook.cgi?ID=C1317608&Units=
SI&Mask=2#Thermo-Condensed (accessed on 20 June 2021).40. National Institute of Standards and Technology. Available online: http://webbook.nist.gov/cgi/cbook.cgi?ID=C1309484&Units=
SI&Mask=2#Thermo-Condensed (accessed on 20 June 2021).41. National Institute of Standards and Technology. Available online: http://webbook.nist.gov/cgi/cbook.cgi?ID=C1305788&Units=
SI&Mask=2#Thermo-Condensed (accessed on 20 June 2021).42. National Institute of Standards and Technology. Available online: http://webbook.nist.gov/cgi/cbook.cgi?ID=C1313593&Units=
SI&Mask=2#Thermo-Condensed (accessed on 20 June 2021).43. National Institute of Standards and Technology. Available online: http://webbook.nist.gov/cgi/cbook.cgi?ID=C12136457&
Units=SI&Mask=2#Thermo-Condensed (accessed on 20 June 2021).


