
12 April 2018 - gwagroup.com.au · and brand innovation in B2B and B2C environments ... Unique...
132
12 April 2018 ASX On-Line Manager Company Announcements Australian Securities Exchange Dear Sir Investor Market Briefing Strategy Presentation Attached is a copy of the Investor Market Briefing Strategy Presentation hosted by Tim Salt, Managing Director of GWA Group Limited to be held in Sydney at 10:00am (AEST) today. The presentation will be webcast and accessible via the GWA website at www.gwagroup.com.au. Yours faithfully R J Thornton Executive Director
Transcript of 12 April 2018 - gwagroup.com.au · and brand innovation in B2B and B2C environments ... Unique...

12 April 2018
ASX On-Line
Manager Company Announcements
Australian Securities Exchange
Dear Sir
Investor Market Briefing Strategy Presentation
Attached is a copy of the Investor Market Briefing Strategy Presentation hosted
by Tim Salt, Managing Director of GWA Group Limited to be held in Sydney at
10:00am (AEST) today.
The presentation will be webcast and accessible via the GWA website at
www.gwagroup.com.au.
Yours faithfully
R J Thornton
Executive Director

12th April, 2018
© GWA Group Ltd 2018

2
Disclaimer
This presentation contains non-IFRS measures to assist users to assess theunderlying financial performance of the Group.
The non-IFRS financial measures in this presentation were not the subject ofa review or audit by KPMG.

3
Safety briefing

12th April, 2018
© GWA Group Ltd 2018

5
Agenda
Tim SaltGWA transformation - strong progress made
A business with significant growth opportunities
Consumer driven growth
Leveraging our advantaged supply chain
Our financial strength
Tim Salt
Craig Norwell
SeméeDickerson
Customer focus delivering growth
Anthony Mortimer
Patrick Gibson
GWA well positioned for growth Tim Salt
6
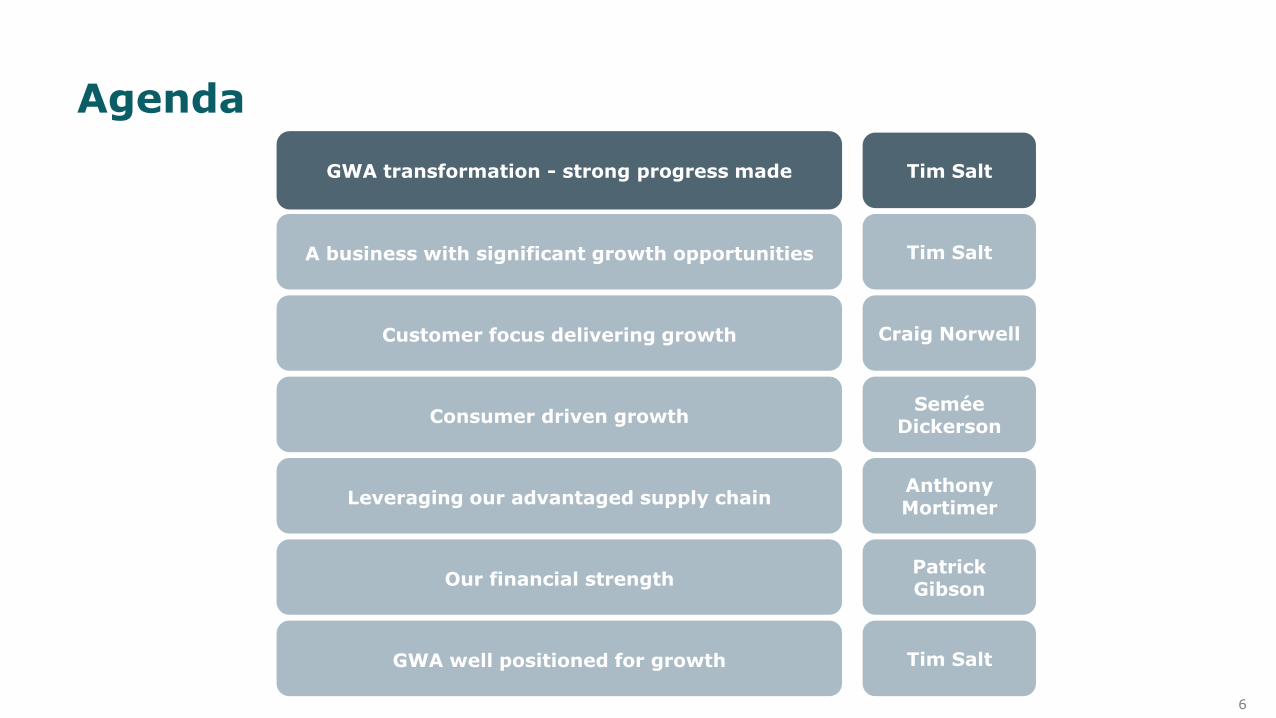
Agenda
GWA transformation - strong progress made
A business with significant growth opportunities
Consumer driven growth
Leveraging our advantaged supply chain
Our financial strength
Tim Salt
Tim Salt
Craig Norwell
SeméeDickerson
Customer focus delivering growth
Anthony Mortimer
Patrick Gibson
GWA well positioned for growth Tim Salt

7
GWA – making life better through superiorsolutions for water
1. Demonstrating ability to drive growth and improve shareholder returns
2. A more focused business with strong brands and leading market positions
3. Pursuing significant growth opportunities focused on superior solutions for water
4. Increased use of advanced technology to deliver innovative solutions for customers and consumers
5. Financial strength to fund investment in organic and inorganic opportunities
6. Making Life Better for all our stakeholders

8
Significant restructuring enables focus on water solutions’ business
Exit of local sanitaryware manufacturing and source from overseas suppliers
Sale of Dux Hot Water
Sale of Brivis Climate Systems
Sale of Gliderol Garage Doors
$88m capital return/special dividend to shareholders
Sale of Wetherill Park manufacturing facility
Tim Salt appointed Managing Director and CEO
$30mon-market share buyback completed
Strategic proposed divestment of Door & Access Systems business
2018
Investor MarketBriefing
2016 20172015
Years refer to 30th June of each year
Caroma Innovation and Distribution Centre opens in Sydney
Caroma Flagship stores open in Adelaide and Sydney
Investor MarketBriefing
Launch of Caroma Cleanflush rimless toilets

9
GWA 2014 GWA 2018 (today)
Operational Focus Diverse Building Products business spread across numerous segments
Clear focus on B&K segment - $1.4bn category
Manufacturing Focus on local product manufacturing Collaborative relationships with exclusive supply partners with global scale
Cost base High fixed cost base to support manufacturing Reduced cost base and lower fixed cost base
Customers Transactional relationship with major customers Improved customer engagement and more collaborative business planning
Market share History of declining market share in Bathrooms & Kitchens (B&K)
Winning share in key segments in B&K
Financial strength High debt, low growth Low debt with financial flexibility to pursue accretive growth opportunities
Which has repositioned the business for growth

10
Strengthened leadership team
Tim SaltCEO
Extensive global experience in managing market leading branded portfolios - strong focus on product and brand innovation in B2B and B2C environments
Patrick GibsonGroup CFO
Extensive multi-country experience managing Finance and IT functions in: global B2B and FMCG companies; and listed companies in Australia
Craig NorwellGM Sales – B&K
Experience across blue chip consumer goods companies, running large field sales forces and managing business development and key customers
Semée DickersonGM Marketing – B&K
Senior marketing professional with experience in the financial services, retail, arts and medical device industries
Anthony MortimerGM Supply Chain – B&K
Globally experienced executive who has worked across various blue chip organisations with market leading brands - wide ranging background in Supply Chain and Sales
Cara ReilGM People & Performance
International experience leading Human Resource functions in global B2B and B2C organisations and listed companies in Australia
Malcolm DaggCommercial Manager – B&K
Extensive experience managing Finance, IT, Manufacturing and Logistics with Australian / New Zealand listed companies in the Building Materials, FMCG and Logistics sectors
Gary WoodheadGM - Door & Access Systems
Experienced general manager with over twenty years of industrial manufacturing / trade experience in global public and private equity organisations across the Asia /Pacific region
Richard ThorntonCompany Secretary
Chartered accountant with extensive management experience in finance, corporate compliance, governance and risk

11
Unique operating model meets local needs with global scale
Consumer insights
Innovation and product
designManufacturing Distribution
Solution expertise
Customer service
Local research drives consumer and market insights
Also builds further insights into plumbers and secondary customers needs
Local R&D and design teams create and deliver contemporary Australian design solutions and ensure products excel and exceed Australian standards
Collaborative, exclusive relationships with superior scale manufacturers
B&K partner with expertise in R&D, quality assurance, process improvement and innovation
Extensive coverage of merchant channel from national network of distribution centres
Add value to primary and secondary customers throughservice solutions and product and category knowledge
Market leading product support with un-matched commitment to after sales service
Broad reach into all key market segments
Collaborating with industry experts and universities: UNSW and UTS
~91 patents and 317 registered designs support IP protection
17 B&K people in China to maintain standards
~1,895 invoiced deliveries per day
113 people sell or help sell in B&K
59 FTEs in team fielding ~2,200 calls per day
B&K data only

12
Significant progress on strategic goals¹
Area of focus Status Specific initiatives
Leverage and build on core assets and brands to drive revenue and market share growth
Growing share consistently across core segments
Add value to customers through improved insights, analytics and processes
Joint business plans with major merchants driving agreed targets / initiatives
Build “fit for future” culture, engagement and capability
Building employee engagement and internal capability focused on sales and marketing
Build an advantaged Supply Chain to deliver superior NPD, Quality and Service at best cost
Enhanced supply continuity from dual sourcing and direct to port shipping
Drive cost out in SG&A and Supply Chain to improve profitability and allow selective reinvestment
Ahead of target to reduce costs by $13-15M by FY19
¹ As outlined at April 2016 Investor Briefing day
13
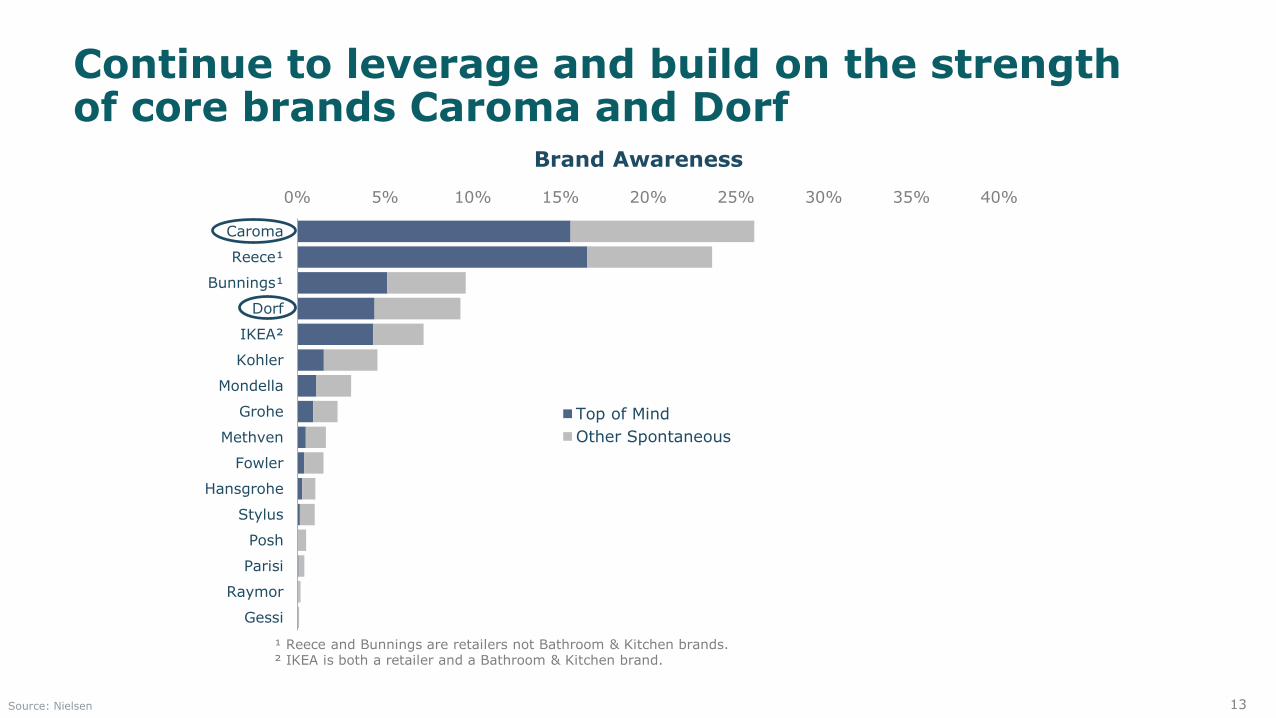
¹ Reece and Bunnings are retailers not Bathroom & Kitchen brands. ² IKEA is both a retailer and a Bathroom & Kitchen brand.
Continue to leverage and build on the strength of core brands Caroma and Dorf
Source: Nielsen
Brand Awareness
0% 5% 10% 15% 20% 25% 30% 35% 40%
Caroma
Reece¹
Bunnings¹
Dorf
IKEA²
Kohler
Mondella
Grohe
Methven
Fowler
Hansgrohe
Stylus
Posh
Parisi
Raymor
Gessi
Top of Mind
Other Spontaneous

14
Consistent market share growth
Source: GWA estimates – Australia market only, excludes NZ and Spares. Data is MAT to December each year
B&K Market Share (%)
18.9
18.7
19.1
19.6
20.3
20.7
Dec 12 Dec 13 Dec 14 Dec 15 Dec 16 Dec 17

15
202 212 220 223 227
197214 220 223
FY14 FY15 FY16 FY17 1HFY18
H1 H2
33 35 37 39 42
3238
42 41
FY14 FY15 FY16 FY17 1HFY18
H1 H2
Improved operating results
Source: GWA
Group EBIT (A$m)Group Revenue (A$m)

16
12.2
14.5
19.320.2 20.9
FY14 FY15 FY16 FY17 1HFY18
ROFE %
16.117.1 17.8 18.1 18.4
FY14 FY15 FY16 FY17 1HFY18
EBIT % Margin
Source: GWA
Group EBIT Margin (%)Group Return on Funds Employed (%)
Strengthening returns

17
-40%
-30%
-20%
-10%
0%
10%
20%
30%
40%
50%
60%
30-Jun-15 30-Sep-15 31-Dec-15 31-Mar-16 30-Jun-16 30-Sep-16 31-Dec-16 31-Mar-17 30-Jun-17 30-Sep-17 31-Dec-17 31-Mar-18
GWA ASX 200 Acc Index
Leading to improved shareholder returns
Total Shareholder Return (TSR) GWA vs ASX 200 Acc Index
Source:

18
Agenda
Customer focus delivering growth
GWA transformation - strong progress made
A business with significant growth opportunities
Consumer driven growth
Leveraging our advantaged supply chain
Our financial strength
Tim Salt
Tim Salt
Craig Norwell
SeméeDickerson
Anthony Mortimer
Patrick Gibson
GWA well positioned for growth Tim Salt

19
GWA, a business with purpose
We make life better through the design and delivery of products, services and technologies that
create superior solutions for people to enjoy and sustain water,
our planet’s most precious resource.

20
Purpose that builds on GWA’s history of delivering innovative solutions for water
Source: GWA

21
Growth agenda focused on our understanding and passion for water

22
2018 World Economic Forum report highlights water as one of the most significant global risks
Source: The Global Risks Report 2018, World Economic Forum, Switzerland, 2018
Water crises identified as
the most impactful societal risk in 2018 by WEF

23
Water crises already playing out globally

24
Increasingly impacting Australia, the planet’s driest continent

25
❖ Focus on superior solutions for water
❖ Play to our strengths
❖ Target where we can win
How are we thinking about growth?

26
GWA Superior Solutions for Water Growth Model G
eo
grap
hy
Exis
ting
New
Segment / Category
Existing
➢ Priority. Strengthen core offering through organic and inorganic expansion
Adjacent
Priority is to leverage strengths in existing geographies, segments and categories

27
$324m
22%
$138m
10%
GWA operates in a large local market with significant growth opportunities
A$1.4 billion addressable market
Source: GWA estimates – Australia market only, excludes NZ and Spares.
$191m
13%
$123m
9%
$673m
46%
Multi-Res
Residential Comm Residential R&RCommercial R&R
28
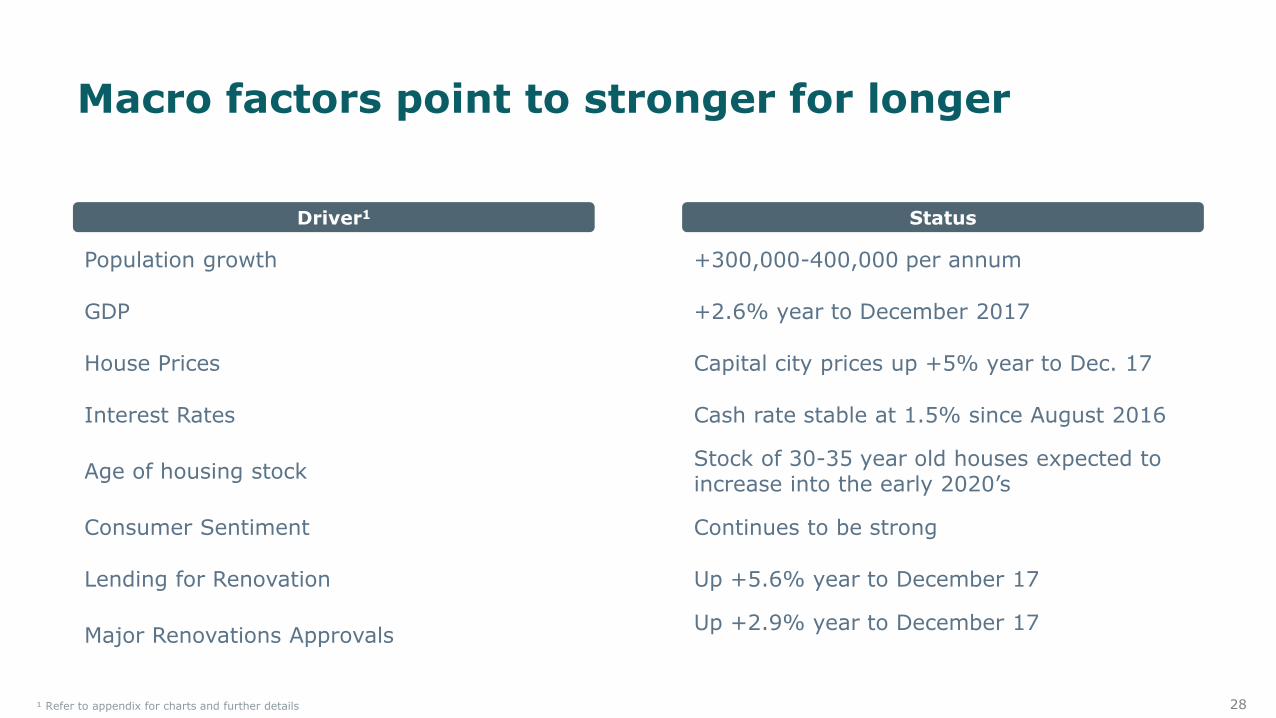
Macro factors point to stronger for longer
Population growth +300,000-400,000 per annum
GDP +2.6% year to December 2017
House Prices Capital city prices up +5% year to Dec. 17
Interest Rates Cash rate stable at 1.5% since August 2016
Age of housing stockStock of 30-35 year old houses expected to increase into the early 2020’s
Consumer Sentiment Continues to be strong
Lending for Renovation Up +5.6% year to December 17
Major Renovations ApprovalsUp +2.9% year to December 17
¹ Refer to appendix for charts and further details
StatusDriver1

29Source: GWA estimates – Australia market only, excludes NZ and Spares
Market by segment (NSV – A$1.4bn)
~ 35%share
~ 25%
share ~ 16% share ~ 16% share
GW
AR
est-
of-
market
$324m$191m $138m$123m $673m
Multi-Res
Residential Comm Residential R&RCommercial R&R
~ 35%
share
Significant segment growth opportunities

30Source: GWA estimates – Australia market only, excludes NZ and Spares
Significant category growth opportunities
Market by category (NSV – A$1.4bn)
Taps and Showers
$574m $76m
Sanitaryware
$654m
Baths
$145m
Sinks &Tubs
GW
AR
est-
of-
market
~ 35% share~ 12% share
~ 20% share
~ 20%
share

31
And capability to extend into large water solutions adjacencies
Geo
grap
hy
Exis
ting
New
Segment / Category
Existing
➢ Priority. Strengthen core offering through organic and inorganic expansion
➢ Local partnerships inCommercial segments inwater scarce geographies
➢ Cannot win, will not play
➢ Grow via broader segment penetration and category adjacencies
Adjacent
GWA Superior Solutions for Water Growth Model

32
Opportunities that play to our strengths in superior water solutions
❖ Reinforce GWA’s core business in ANZ
❖ Build scale in the near term and upside growth potential
❖ Investment in known market
Access IP that gives a
“right to play” globally
❖ Opens up new large opportunities for expansion
❖ Very modest investment required
❖ Upside potential over the medium term
❖ Enables new foundations for long-term growth
❖ Access to IP and capability that enhances core
business
❖ Modest investment
❖ Upside potential
Overseas Commercial water and bathrooms
Distribution partnerships
Expand into water based
category adjacencies
Strengthen existing B&K core offering
Establish entry points into larger markets
Australia and NZ growth opportunities

33
Strategy positions GWA for growth
We make life better with superior solutions for water
CATEGORIES
Leverage sanitary to win all of
bathrooms and kitchens
SEGMENTS
Build on Commercial
leadership and grow in R&R
Gro
wth
Driv
ers SOLUTIONS
Lead “smart water
management”
BRANDS
Deliver the best water
experiences
GWA Operational Measures Market share, NSV, EBIT, ROFE, DIFOT, NPS, Safety, Engagement
Co
rp
orate
Prio
rit
ies
Build GWA as the most trusted and respected water solutions company Maximise shareholder value creation – NPAT growth , ROFE, TSR
BUSINESS EFFICIENCY : Simple, effective processes and plans delight consumers and customers
BEST COST : Continuous improvement to support profitability and fund selective reinvestment
GREAT PEOPLE : Continue to build “fit for future” culture, engagement and capability
CUSTOMER FOCUSEDAdd value to customers through superior
insights, analytics and processes
CONSUMER DRIVENDeliver experiences to excite consumers and drive revenue
and market share growth

34
From push to pull
SecondaryCustomer
End UserSecondaryCustomer
End UserPrimary
CustomerSecondary Customer End User
Consumer
CommercialPlumber
Merchant Independent Plumber
Renovator/Small builder
CommercialBuilder/Developer
Residential Builder

35
Transformation continues shift from push to pull
To
ToFrom…
Consumer first
Contributing to society
Lifestyle brand business
Business first
Making products
Industrial business

36
We are well positioned for growth through strategic focus on superior solutions for water
❖ GWA is the leader in a large and robust local market
❖ Strong growth opportunities across segments and categories
❖ Own significant technical expertise in sanitaryware and water sustainability solutions
❖ Capability can be leveraged in local and overseas markets to step change growth
❖ Ambition to take leadership position in “superior solutions for water”

37
Agenda
GWA transformation - strong progress made
A business with significant growth opportunities
Consumer driven growth
Leveraging our advantaged supply chain
Our financial strength
Tim Salt
Tim Salt
Craig Norwell
SeméeDickerson
Customer focus delivering growth
Anthony Mortimer
Patrick Gibson
GWA well positioned for growth Tim Salt

38
Customer focused strategy to drive growth
We make life better with superior solutions for water
CATEGORIES
Leverage sanitary to win all of
bathrooms and kitchens
SEGMENTS
Build on Commercial
leadership and grow in R&R
Gro
wth
Driv
ers SOLUTIONS
Lead “smart water
management”
BRANDS
Deliver the best water
experiences
GWA Operational Measures Market share, NSV, EBIT, ROFE, DIFOT, NPS, Safety, Engagement
Co
rp
orate
Prio
rit
ies
Build GWA as the most trusted and respected water solutions company Maximise shareholder value creation – NPAT growth , ROFE, TSR
BUSINESS EFFICIENCY : Simple, effective processes and plans delight consumers and customers
BEST COST : Continuous improvement to support profitability and fund selective reinvestment
GREAT PEOPLE : Continue to build “fit for future” culture, engagement and capability
CUSTOMER FOCUSEDAdd value to customers through superior
insights, analytics and processes
CONSUMER DRIVENDeliver experiences to excite consumers and drive revenue
and market share growth

39
Area of focus Progress Specific initiatives
Increased understanding of key customers creating tailored plans and programs
Customer planning embeddedbusiness plans and review In store availability commitment
Clear value proposition for primary and secondary customers
Builders segmentation and value proposition Commercial value propositions Customer contact matrix / frequency
Use of technology to drive business growth and customer experience
Improved Salesforce.com utilisationRefinement of Specify / Revit / Plumbers App’E enabled bathrooms
Gain share via NPD and differentiated customer initiatives
Differentiated NPD, e.g. CleanflushTailored programs by customerInstallation innovation
Build sales capability Call efficiency and effectiveness Analytical skills development Competency assessment and development
Significant progress in customer engagement
40
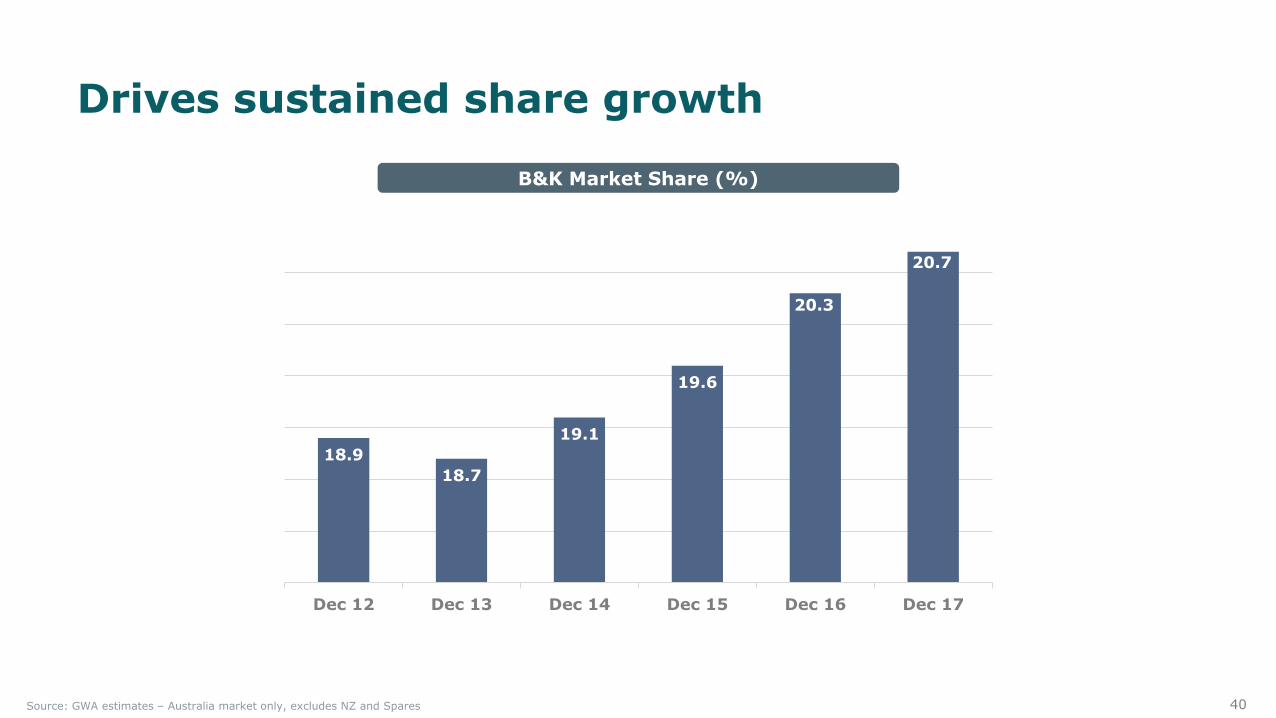
Drives sustained share growth
Source: GWA estimates – Australia market only, excludes NZ and Spares
B&K Market Share (%)
18.9
18.7
19.1
19.6
20.3
20.7
Dec 12 Dec 13 Dec 14 Dec 15 Dec 16 Dec 17

41
~ 35%share
~ 25%
share ~ 16% share ~ 16% share
GW
AR
est-
of-
market
$324m$191m $138m$123m $673m
Multi-Res
Residential Comm Residential R&RCommercial R&R
~ 35%
share
Source: GWA estimates – Australia market only, excludes NZ and Spares
Opportunities to grow in a A$1.4bn market
Market by segment (NSV – A$1.4bn)
Focused opportunities to grow

42
Critical to understand and engage with primary and secondary customers
SecondaryCustomer
End UserPrimary
CustomerSecondary Customer End User
ConsumerMerchant Renovator/Small builder
CommercialBuilder/Developer
Residential Builder
CommercialPlumber
Independent Plumber

43
Create demand through direct engagement with builders and developers to secure specification for GWA
Create demand through brand marketing and merchant activation to generate sales
GWA has scale to create demand for our brands across both large and small secondary customers
Renovator/Small builder
CommercialBuilder/Developer
Residential Builder
Secondary Customer

44
Residential and Multi-Residential housing
Source: GWA estimates – Australia market only, excludes NZ and Spares
Market by segment (NSV – A$1.4bn)
$324m
22%
$138m
10%
$191m
13%
$123m
9%
$673m
46%
Multi-Res
Residential Comm Residential R&RCommercial R&R

45
0
20,000
40,000
60,000
80,000
100,000
120,000
FY-1
975
FY-1
976
FY-1
977
FY-1
978
FY-1
979
FY-1
980
FY-1
981
FY-1
982
FY-1
983
FY-1
984
FY-1
985
FY-1
986
FY-1
987
FY-1
988
FY-1
989
FY-1
990
FY-1
991
FY-1
992
FY-1
993
FY-1
994
FY-1
995
FY-1
996
FY-1
997
FY-1
998
FY-1
999
FY-2
000
FY-2
001
FY-2
002
FY-2
003
FY-2
004
FY-2
005
FY-2
006
FY-2
007
FY-2
008
FY-2
009
FY-2
010
FY-2
011
FY-2
012
FY-2
013
FY-2
014
FY-2
015
FY-2
016
FY-2
017
FY-2
018
FY-2
019
FY-2
020
FY-2
021
FY-2
022
Actual Forecast
Detached residential new build remains resilient
Source: BIS Oxford Economics: MAT, Actuals to September 2017, Forecast December 2017 – June 2022
Qu
an
tity
Co
mp
lete
d A
nn
ually
Housing Completions Australia (#)

46
Multi-residential declining from peak but presents opportunities for selective growth
Housing Completions Australia (#)
Qu
an
tity
Co
mp
lete
d A
nn
ually
Source: BIS Oxford Economics: MAT, Actuals to September 2017, Forecast December 2017 – June 2022
0
20,000
40,000
60,000
80,000
100,000
120,000
FY-1
975
FY-1
976
FY-1
977
FY-1
978
FY-1
979
FY-1
980
FY-1
981
FY-1
982
FY-1
983
FY-1
984
FY-1
985
FY-1
986
FY-1
987
FY-1
988
FY-1
989
FY-1
990
FY-1
991
FY-1
992
FY-1
993
FY-1
994
FY-1
995
FY-1
996
FY-1
997
FY-1
998
FY-1
999
FY-2
000
FY-2
001
FY-2
002
FY-2
003
FY-2
004
FY-2
005
FY-2
006
FY-2
007
FY-2
008
FY-2
009
FY-2
010
FY-2
011
FY-2
012
FY-2
013
FY-2
014
FY-2
015
FY-2
016
FY-2
017
FY-2
018
FY-2
019
FY-2
020
FY-2
021
FY-2
022
Actual Forecast

47
~ 35%share
~ 25%
share ~ 16% share ~ 16% share
GW
AR
est-
of-
market
$324m$191m $138m$123m $673m
Multi-Res
Residential Comm Residential R&RCommercial R&R
~ 35%
share
Ability to create demand evident in strength across the residential home segment
Source: GWA estimates – Australia market only, excludes NZ and Spares
Market by segment (NSV – A$1.4bn)

48
Maintain strong position in Detached residential and compete selectively in Multi-residential
Top 25 home Builders account
for 1 in 3 new homes built
21 of these top 25
builders use GWA brands
Top 100 builders
account for 70% of
homes built
75% of these
builders use GWA brands
❖ Established deep knowledge of Builders, their strategies and needs
❖ Leverage trusted brands and quality to enhance the home-buyer experience
❖ Differentiate through broad brand portfolio and innovation capability
❖ Re-organised sales team into dedicated segment resource
Market leading penetration of Australia’s top 25 builders
Growth Strategy

49
Commercial new build sustaining long term growth trajectory
Non Residential – Value of Work Done (A$m)
Source: BIS Oxford Economics: MAT, Actuals to June 2017, Forecast September 2017 – June 2022
0
5,000
10,000
15,000
20,000
25,000
30,000
35,000
40,000
45,000
50,000
Actual Forecast

50
~ 35%share
~ 25%
share ~ 16% share ~ 16% share
GW
AR
est-
of-
market
$324m$191m $138m$123m $673m
Multi-Res
Residential Comm Residential R&RCommercial R&R
~ 35%
share
Ability to create demand in Commercial new build drives strong share position
Source: GWA estimates – Australia market only, excludes NZ and Spares
Market by segment (NSV – A$1.4bn)
51
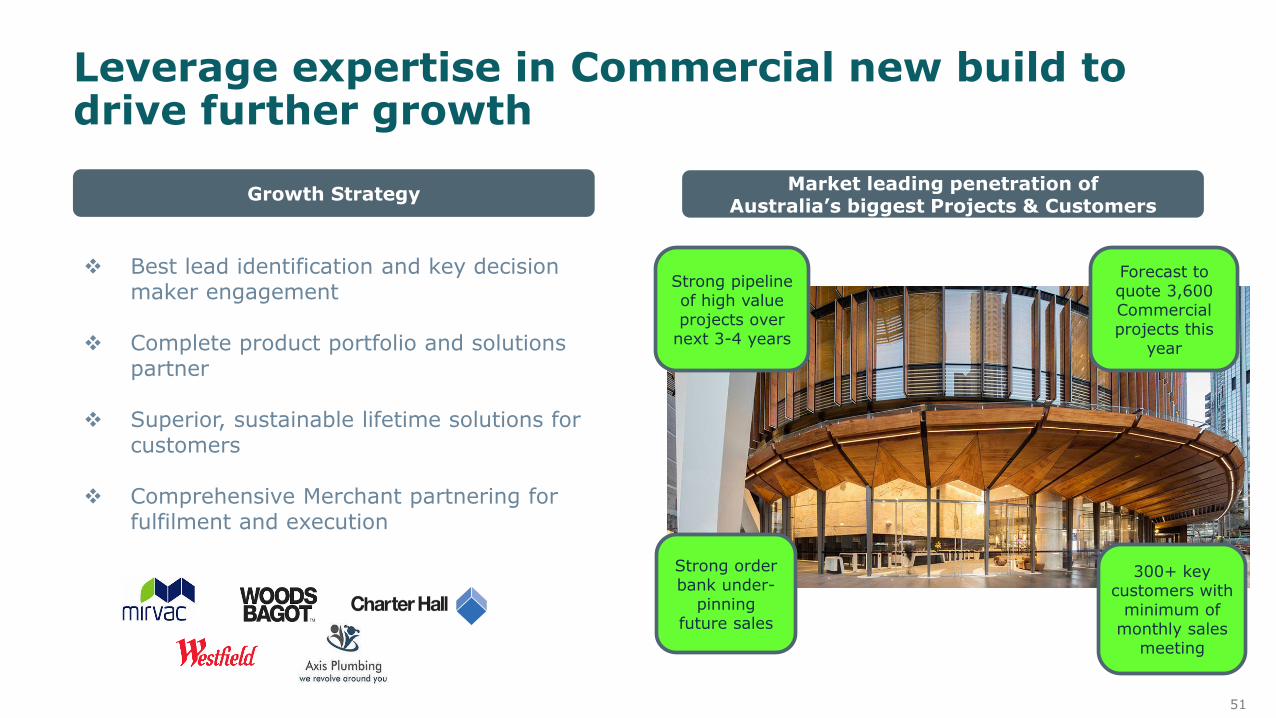
Strong pipeline of high value projects over
next 3-4 years
Forecast to quote 3,600 Commercial projects this
year
Strong order bank under-
pinning future sales
300+ key customers with
minimum of monthly sales
meeting
Leverage expertise in Commercial new build to drive further growth
Market leading penetration of Australia’s biggest Projects & Customers
Growth Strategy
❖ Best lead identification and key decision maker engagement
❖ Complete product portfolio and solutions partner
❖ Superior, sustainable lifetime solutions for customers
❖ Comprehensive Merchant partnering for fulfilment and execution

52
~ 35%share
~ 25%
share ~ 16% share ~ 16% share
GW
AR
est-
of-
market
$324m$191m $138m$123m $673m
Multi-Res
Residential Comm Residential R&RCommercial R&R
~ 35%
share
Source: GWA estimates – Australia market only, excludes NZ and Spares
R&R is the largest segment opportunity across both Commercial and Residential
Market by segment (NSV – A$1.4bn)

53
GWA supplies 1 in 2 toilets in
Commercial new build.
Future R&R opportunity
Only 15% of jobs require a
DA. 85% below the
radar
New sales model to hunt
opportunities with new
customers, different needs
Leverage GWA IP in customer collaborations to create R&R
solutions
New build drives future R&R, large less visible market
Growth Strategy
❖ Focused resource now targeting sizeable opportunity
❖ Leverage strong Commercial new build footprint and expertise into Commercial R&R
❖ Utilise Merchant partnerships to provide coverage and availability
❖ Innovate to reduce cost, improve efficiency and sustainability
Deeper market understanding has identified untapped opportunity in Commercial R&R

54
Deeper market understanding has identified untapped opportunity in Commercial R&R

55
Residential R&R segment stability provides resilience through the cycle
Alterations and Additions – Completions ($m)
Source: BIS Oxford Economics: MAT, Actuals to December 2017, Forecast March 2018 – June 2022
0
1,000
2,000
3,000
4,000
5,000
6,000
7,000
8,000
9,000
Actual Forecast

56
Residential R&R segment is large and remains stable
Renovation Activity (A$bn) Housing sales (‘000s)
Source: ABS, ANZ
$b
np
er q
uarte
r,
real
00
0s p
er m
on
th
0
10
20
30
40
50
60
95 97 99 01 03 05 07 09 11 13 15 17
Number of dwelling sales, Australia
0.0
0.5
1.0
1.5
2.0
2.5
80 82 84 86 88 90 92 94 96 98 00 02 04 06 08 10 12 14 16 18
Alterations & additions work done, real Approvals for alts and adds

57
~ 35%share
~ 25%
share ~ 16% share ~ 16% share
GW
AR
est-
of-
market
$324m$191m $138m$123m $673m
Multi-Res
Residential Comm Residential R&RCommercial R&R
~ 35%
share
Source: GWA estimates – Australia market only, excludes NZ and Spares
Significant growth opportunity in Residential R&R
Market by segment (NSV – A$1.4bn)

58
Caroma displayed in excess of
1,300 showrooms
Foot traffic in Adelaide store +80% in first six months
Market leading visibility and availabilityGrowth Strategy
❖ Extend merchant partnerships to drive ranging, availability and coverage
❖ Create inspirational experiences in customers’ showrooms
❖ Utilise Caroma Flagships to inspire architects, designers and consumer renovators
❖ Increased investment in digital tools to enhance ease of specifying and installing Caroma
Residential R&R – customer strategies for growth
10,000 specs via CaromaSpecify last
year
5,000 downloads of Caroma plumbers’
app last year

59
~ 35%share
~ 25%
share ~ 16% share ~ 16% share
GW
AR
est-
of-
market
$324m$191m $138m$123m $673m
Multi-Res
Residential Comm Residential R&RCommercial R&R
~ 35%
share
Source: GWA estimates – Australia market only, excludes NZ and Spares
Aged Care is a large and growing sector relatively untapped by GWA
Market by segment (NSV – A$1.4bn)
Aged Care ~$170m segmentacross Commercial and Residential

60
Market leading visibility and availability
Growth Strategy
❖ Built deep understanding of products, customers and consumers’ needs
❖ Developed ‘Care’ range tailored to unique needs of users and decision makers
❖ Scale, coverage and technology to access large fragmented market
❖ Aged care initiatives with key merchant partners to penetrate all 3 aged care segments
Driving our focus on Aged Care opportunity
‘Care’ range increased to 150 SKUs.
Expanding to 200+ in the next year
250 key projects identified
across ANZ
Caroma Care SKUs available
in 1,100 outlets
across ANZ
Partnerships with top 10 Aged Care
providers and 25 key Commercial customers

61
Engagement with merchant partners remains key
Specialist sales teams. 113 FTEs on the road supported by 57 FTEs in After Sales and Customer
Service
80% of Merchant customer stores called on at least monthly with call centre managing 2,200 calls a day
Business plans and trading terms with
all major customers
Key customer partnerships resulting in
significant mutual share gains
Market leading visibility, demand creation, availability and coverage
Growth Strategy
❖ Established clarity of each Merchant’s differing business needs, strategies, priorities and processes
❖ Joint plans create growth and profitability that’s win-win
❖ Leverage significant GWA demand creation with secondary customers
❖ Drive foot traffic in Merchants through R&R marketing initiatives
62
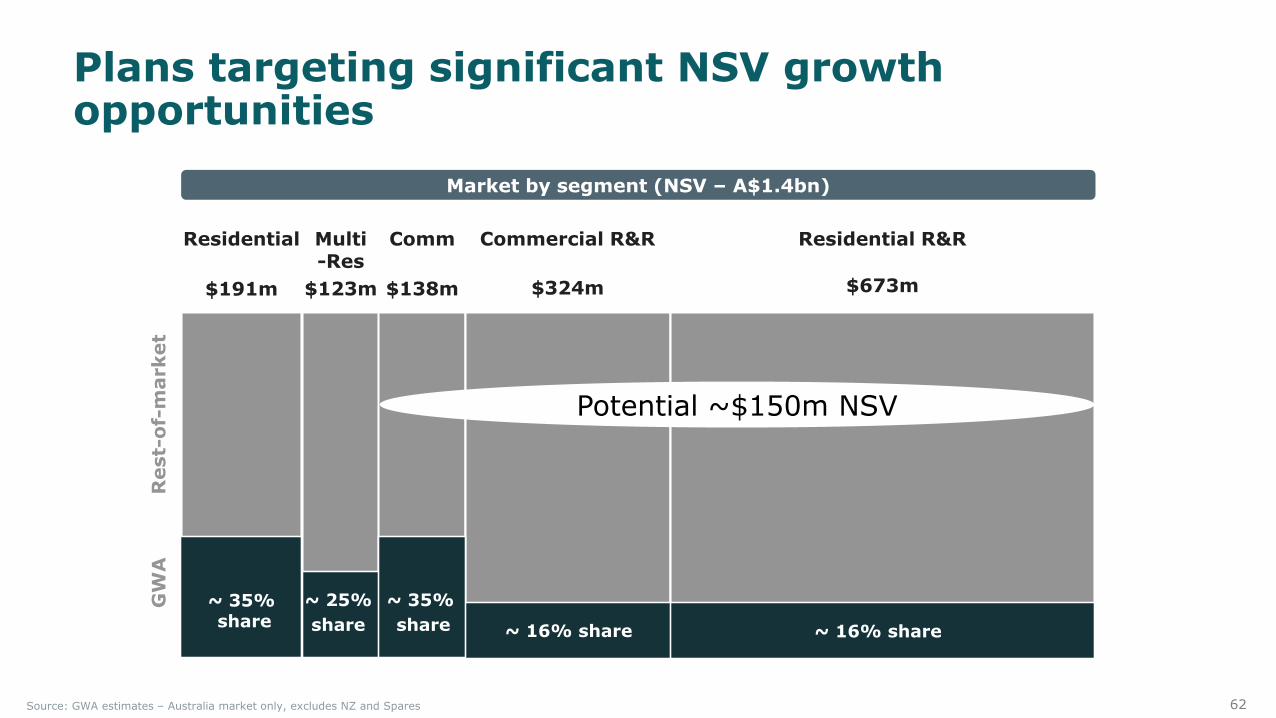
~ 35%share
~ 25%
share ~ 16% share ~ 16% share
GW
AR
est-
of-
market
$324m$191m $138m$123m $673m
Multi-Res
Residential Comm Residential R&RCommercial R&R
~ 35%
share
Plans targeting significant NSV growth opportunities
Source: GWA estimates – Australia market only, excludes NZ and Spares
Market by segment (NSV – A$1.4bn)
Potential ~$150m NSV

63
Break

64
Agenda
Consumer driven growth
GWA transformation - strong progress made
A business with significant growth opportunities
Leveraging our advantaged supply chain
Our financial strength
Tim Salt
Tim Salt
Craig Norwell
SeméeDickerson
Customer focus delivering growth
Anthony Mortimer
Patrick Gibson
GWA well positioned for growth Tim Salt

65
Consumer driven strategy to drive growth
We make life better with superior solutions for water
CATEGORIES
Leverage sanitary to win all of
bathrooms and kitchens
SEGMENTS
Build on Commercial
leadership and grow in R&R
Gro
wth
Driv
ers SOLUTIONS
Lead “smart water
management”
BRANDS
Deliver the best water
experiences
GWA Operational Measures Market share, NSV, EBIT, ROFE, DIFOT, NPS, Safety, Engagement
Co
rp
orate
Prio
rit
ies
Build GWA as the most trusted and respected water solutions company Maximise shareholder value creation – NPAT growth , ROFE, TSR
BUSINESS EFFICIENCY : Simple, effective processes and plans delight consumers and customers
BEST COST : Continuous improvement to support profitability and fund selective reinvestment
GREAT PEOPLE : Continue to build “fit for future” culture, engagement and capability
CUSTOMER FOCUSEDAdd value to customers through superior
insights, analytics and processes
CONSUMER DRIVENDeliver experiences to excite consumers and drive revenue
and market share growth

66
Why consumer driven? The age of the empowered consumer
GlobalLoyal(if you are honest)
Smart & Expectant
“Hands On”
Digitally mobile

67
Ongoing commitment to build consumer insight
Deeper consumer insight and understanding
Brands with purpose create stronger consumer relationships
Superior omni-channel brand experiences
Becoming consumer driven
Consumer first
Contributing to society
Lifestyle brand business

68
Worked with the empowered consumer to build a deeper understanding of R&R journey
From Push
TRIGGER/ IDEATION
STAGES RESEARCHPROJECT
PLANNINGCOMPLETION
RENOVATION JOURNEY
CONSTRUCTION

69
Identified five distinct consumer groups and insights into their approach to renovating
Form over Function¹
THE INSPIRED
(28%)
THE CHEERFUL
UPGRADER
(13%)
THE DREAMER
(25%)
THE NOVICE
(22%)
Expert
Novice
Functionover Form
1 Function – Consumer attitude toward bathrooms is such that bathrooms must be primarily functional, durable, liveable, comfortable and aesthetically pleasingForm – Consumer attitude toward bathrooms is such that bathroom renovations are an opportunity to express personal style. Bathrooms should be a personal oasis, follow latest trends, and be impressive to family and friends
THE CAPITALIST
(12%)

70
Each group occupies a different place on the price ladder
THE CAPITALIST
(12%)THE CHEERFUL
UPGRADER
(13%)
THE NOVICE
(22%)
THE INSPIRED
(28%)
THE DREAMER
(25%)
Low
Pri
ce P
ositio
n
Hig
h
Entry Good BestBetter
Source: GWA
71
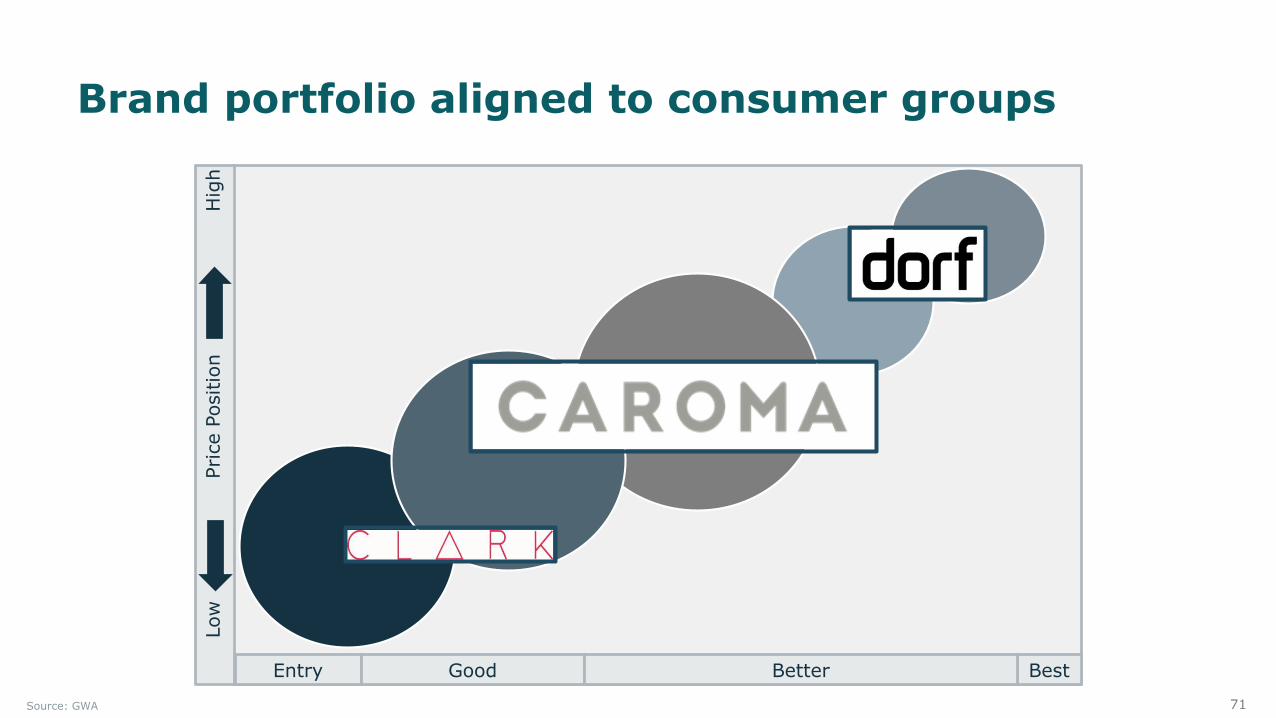
Brand portfolio aligned to consumer groups
Low
Pri
ce P
ositio
n
Hig
h
Entry Good BestBetter
Source: GWA

72
Strength of Caroma and supporting brands creates growth platform
¹ Reece and Bunnings are retailers not Bathroom & Kitchen brands. ² IKEA is both a retailer and a Bathroom & Kitchen brand.
Brand Awareness
0% 5% 10% 15% 20% 25% 30% 35% 40%
Caroma
Reece¹
Bunnings¹
Dorf
IKEA²
Kohler
Mondella
Grohe
Methven
Fowler
Hansgrohe
Stylus
Posh
Parisi
Raymor
Gessi
Top of Mind
Other Spontaneous
Source: Nielsen
73
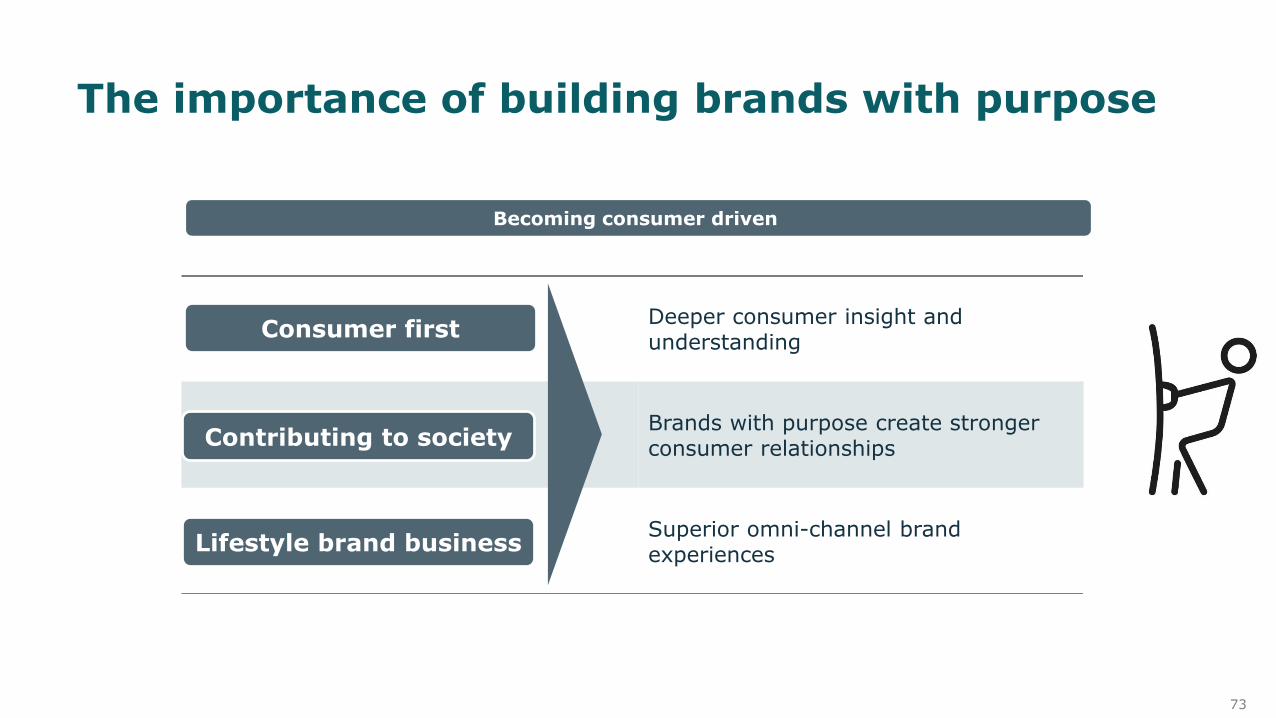
The importance of building brands with purpose
Deeper consumer insight and understanding
Brands with purpose create stronger consumer relationships
Superior omni-channel brand experiences
Becoming consumer driven
Consumer first
Contributing to society
Lifestyle brand business

74
Reposition Dorf to delight “the capitalists”

75
Unique styles for premium, style conscious consumers

76
Re-invent Clark to offer a full bathroom solution
77
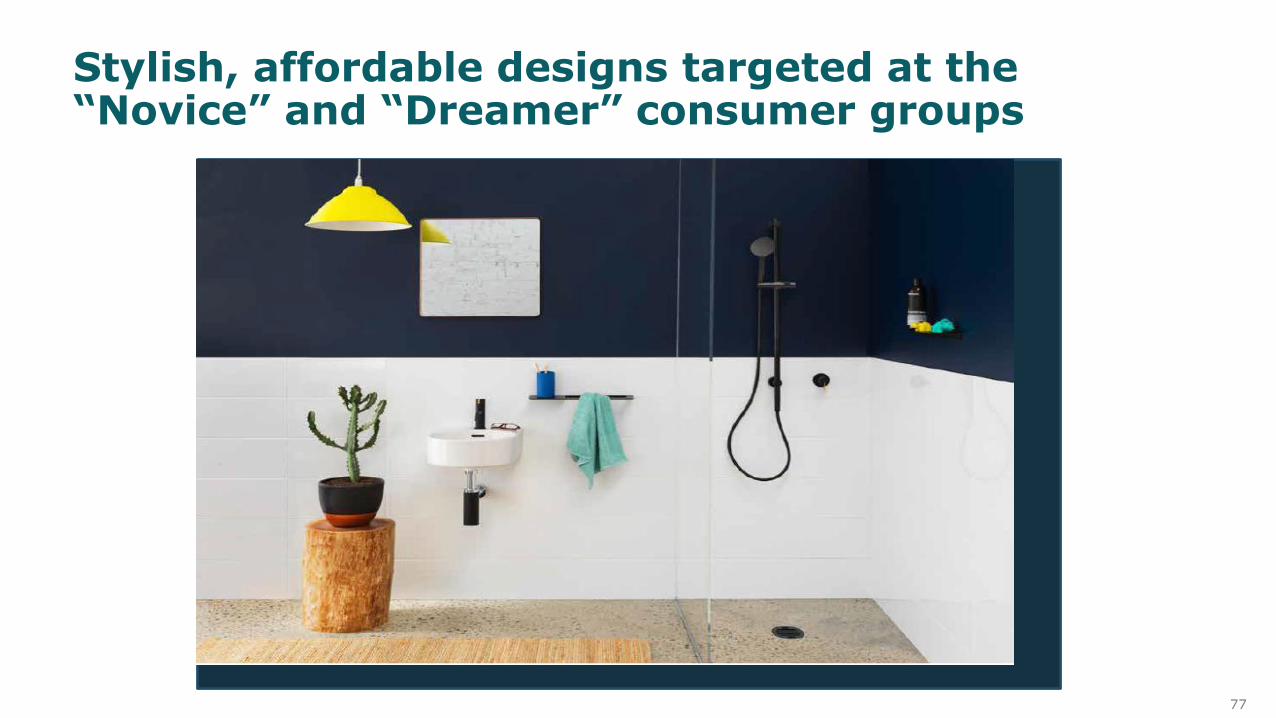
Stylish, affordable designs targeted at the “Novice” and “Dreamer” consumer groups

78
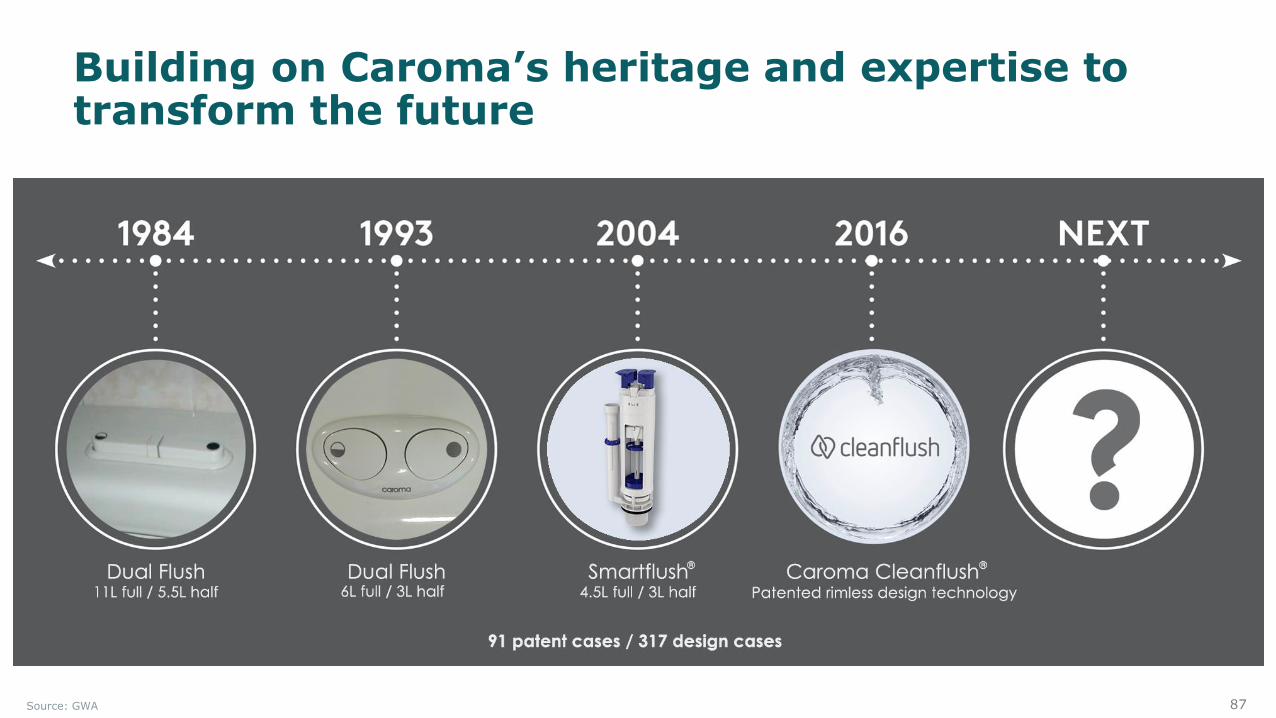
Building on Caroma’s heritage and expertise to transform the future
Source: GWA

79
CAROMA VALUES WATER
A culturally iconic and meaningful brand purpose
80
A visual identity that marks a new era for Caroma

81
Each and every consumer touch point must build a consistent and rewarding brand experience
Deeper consumer insight and understanding
Brands with purpose create stronger consumer relationships
Superior omni-channel brand experiences
Becoming consumer driven
Consumer first
Contributing to society
Lifestyle brand business

82
Continuing to extend and leverage Cleanflush®
innovation to strong effect
Caroma Cleanflush Sales % of GWA suites ($NSV)
20 new Cleanflush variants across sub categories by 2020
Source: GWA
6
10
14
17
20
0%
10%
20%
30%
40%
50%
60%
70%
0
5
10
15
20
25
FY16 FY17 FY18F FY19F FY20F
# of SKUs % Sanitary NSV
# o
f S
KU
s
% o
f GW
A s
uite
s $
NS
V

83
Creating inspirational premium solutions for “upgraders” and “capitalists”

84
Leading the thinking and development of solutions for the distinct needs of ageing consumers

85
Leading the thinking and development of solutions for the distinct needs of ageing consumers

86
Empathetic design solutions that are flexible and create scale opportunities
87
Building on Caroma’s heritage and expertise to transform the future
Source: GWA

88
World class innovation that changes the industry’s practice and expectation of water management

89
❖ Touchless bathroom products
❖ Remote BMS² connectivity to all bathrooms
❖ Remotely monitor and manage water usage including leaks
❖ Needs based real time bathroom cleaning schedule
Hygenic user experience
Key benefits of SmartCommand¹Key features of SmartCommand¹
¹ Patent pending² Bathroom Management System
Caroma Smart Command® – changing standards in building water management
Increased bathroom up time and better user experience
Reduced water usage and rental benefit from Green Star rating
Reduced costs via increased preventative maintenance
Cost efficient remote monitoring and management
Remote commissioning on install saves plumbertime and money
Reduced cleaning costs

90
A robust system that is connected and flexible

91
A robust system that is connected and flexible

92
✓ Technology platform testing completed
✓ Key customer engagement undertaken
✓ 12 months testing completed in-situ – commercial officeand shopping centre
✓ Patent applications in progress
✓ Full commercial installation at one site
✓ Further commercial roll out underway
Evaluated and endorsed by key commercial customers

93
GlobalLoyal(if you are honest)
Smart & Expectant
“Hands On”
Digitally mobile
Seamless omni-channel brand experiences that delight and deliver value
94
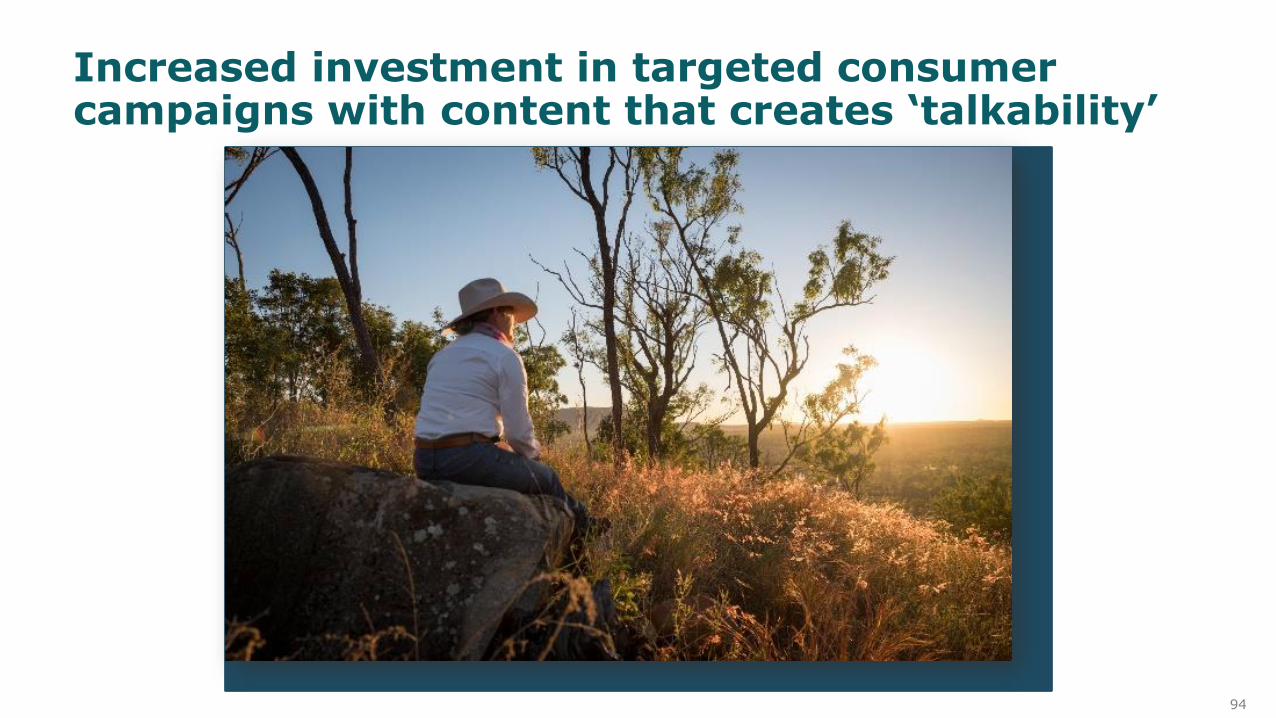
Increased investment in targeted consumer campaigns with content that creates ‘talkability’

95
The new Caroma website understands and facilitates the renovation journey
42m page views in last 3 years
+66% over this period
140,000 unique visitations monthly

96¹ All industry average
Leverage and grow best in-category social engagement
+76% in Facebook followers (last 3 years)
Engagement >3%(Industry average¹ 0.17%)
+1,000% in Instagram followers (last 2 years)
Engagement >3%(Industry average¹ 1.66%)

97
Importance of engaging and immersive physical brand experiences

98
Our new flagship store – Caroma on Collins, Sydney

99
Agenda
GWA transformation - strong progress made
A business with significant growth opportunities
Consumer driven growth
Leveraging our advantaged supply chain
Our financial strength
Tim Salt
Tim Salt
Craig Norwell
SeméeDickerson
Customer focus delivering growth
Anthony Mortimer
Patrick Gibson
GWA well positioned for growth Tim Salt

100
Supply chain strategy to delight consumers and customers at best cost
We make life better with superior solutions for water
CATEGORIES
Leverage sanitary to win all of
bathrooms and kitchens
SEGMENTS
Build on Commercial
leadership and grow in R&R
Gro
wth
Driv
ers SOLUTIONS
Lead “smart water
management”
BRANDS
Deliver the best water
experiences
GWA Operational Measures Market share, NSV, EBIT, ROFE, DIFOT, NPS, Safety, Engagement
Co
rp
orate
Prio
rit
ies
Build GWA as the most trusted and respected water solutions company Maximise shareholder value creation – NPAT growth , ROFE, TSR
BUSINESS EFFICIENCY : Simple, effective processes and plans delight consumers and customers
BEST COST : Continuous improvement to support profitability and fund selective reinvestment
GREAT PEOPLE : Continue to build “fit for future” culture, engagement and capability
CUSTOMER FOCUSEDAdd value to customers through superior
insights, analytics and processes
CONSUMER DRIVENDeliver experiences to excite consumers and drive revenue
and market share growth
101
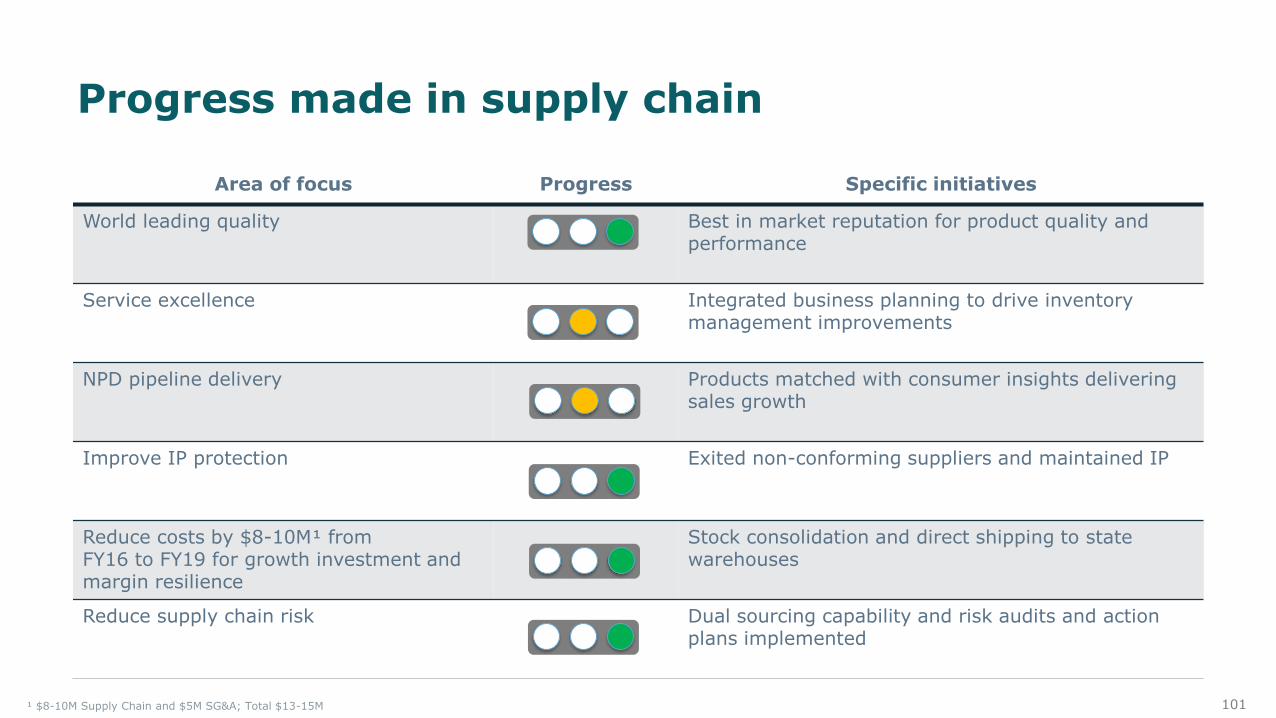
Progress made in supply chain
Area of focus Progress Specific initiatives
World leading quality Best in market reputation for product quality and performance
Service excellence Integrated business planning to drive inventory management improvements
NPD pipeline delivery Products matched with consumer insights delivering sales growth
Improve IP protection Exited non-conforming suppliers and maintained IP
Reduce costs by $8-10M¹ fromFY16 to FY19 for growth investment and margin resilience
Stock consolidation and direct shipping to state warehouses
Reduce supply chain risk Dual sourcing capability and risk audits and action plans implemented
¹ $8-10M Supply Chain and $5M SG&A; Total $13-15M

102
Supply chain creating competitive advantage
Joined Up Business Planning
Innovation and product
design
Supply solutions
Network alignment
Best cost

103
Growth enabler – JUBP¹
❖ Customer focused - the right supply chain exceeding service and quality expectations
❖ Joint value creation – supply chain contributing to win / win with customers
❖ Consumer insight - creating and manufacturing products and solutions that consistently deliver and delight
❖ Continuous improvement approach -culture, attitude, capability and processes
Creating a supply chain synchronised with the front end of our business
Sales / Customer
Marketing
Finance / ITHR
Supply Chain
¹ Joined Up Business Planning
Continued inventory investment to deliver
customer service
Supply chain attends customer
top to top meetings
Co-creation and delivery of NPD
Business partnering and best cost outcomes

104
Growth enabler – innovation and product design
❖ Consumer expertise - continued investment in local design teams
❖ Support brand growth - new world class R&D facility
❖ Portfolio management - NPD mirrored with efficient SKU rationalisation
❖ Superior solutions - global strategic suppliers partnering with our local experts
Australian innovation - products designed for local market conditions and consumers
Ground up designs and technical solutions suited to Australian
conditions
Extensive in-house technical expertise
across multiple categories
Rigorous quality assurance programs at
supply origin
Dedicated quality control team in
Australia
PatentedUni-orbitalconnector

105
Growth enabler – supply solutions
❖ Exclusive supply partnerships – long term commitment to quality, service, best cost and innovation
❖ Enhancing supply partner capability – 17 GWA staff in Asia building supply partner expertise
❖ Three year volume signals - enabling supply partners to focus on long term service, yield and waste elimination opportunities
Creating sustainable supply solutions in partnership with our strategic suppliers
+10 point improvement in
Forecast accuracy
Supply partnersin Switzerland,
Germany and Italy
Supply partners in China,
Thailand, Malaysia, and Vietnam
Annual Shanghai Strategic review with nominated
partners
Future focused competitive tender process for product
development

106
Growth enabler – network alignment
❖ Business efficiency - optimising service at best cost across our end to end network
❖ Increased use of technology solutions -integrating systems and processes with suppliers and customers
❖ Service policy - continuously evolving to meet changing customer expectations
Designing a global distribution network that delights customers and supports growth
5* Green Rating
30,000m² streamlined purpose built
warehousing facility
Warehouse Management System driving
service and efficiency1,895 invoiced
deliveries per day

107
Continuous commitment to drive further cost efficiencies
Growth enabler – best cost
❖ Driving continued business efficiency -focused on Waste, Yield and COGS
❖ Distribution network alignment - cost to serve project initiated February 2018 for cost out and customer satisfaction
❖ Evolving sourcing structures – establish the next geographic supply source with current partners
❖ $8-10m Supply Chain cost savingsFY19-FY21

108
Agenda
GWA transformation - strong progress made
A business with significant growth opportunities
Consumer driven growth
Leveraging our advantaged supply chain
Our financial strength
Tim Salt
Tim Salt
Craig Norwell
SeméeDickerson
Customer focus delivering growth
Anthony Mortimer
Patrick Gibson
GWA well positioned for growth Tim Salt

109
Consistently strengthening returns
Group EBIT Margin (%)Group Return on Funds Employed (%)
Source: GWA
12.2
14.5
19.320.2 20.9
FY14 FY15 FY16 FY17 1HFY18
ROFE %
16.117.1 17.8 18.1 18.4
FY14 FY15 FY16 FY17 1HFY18
EBIT % Margin
110
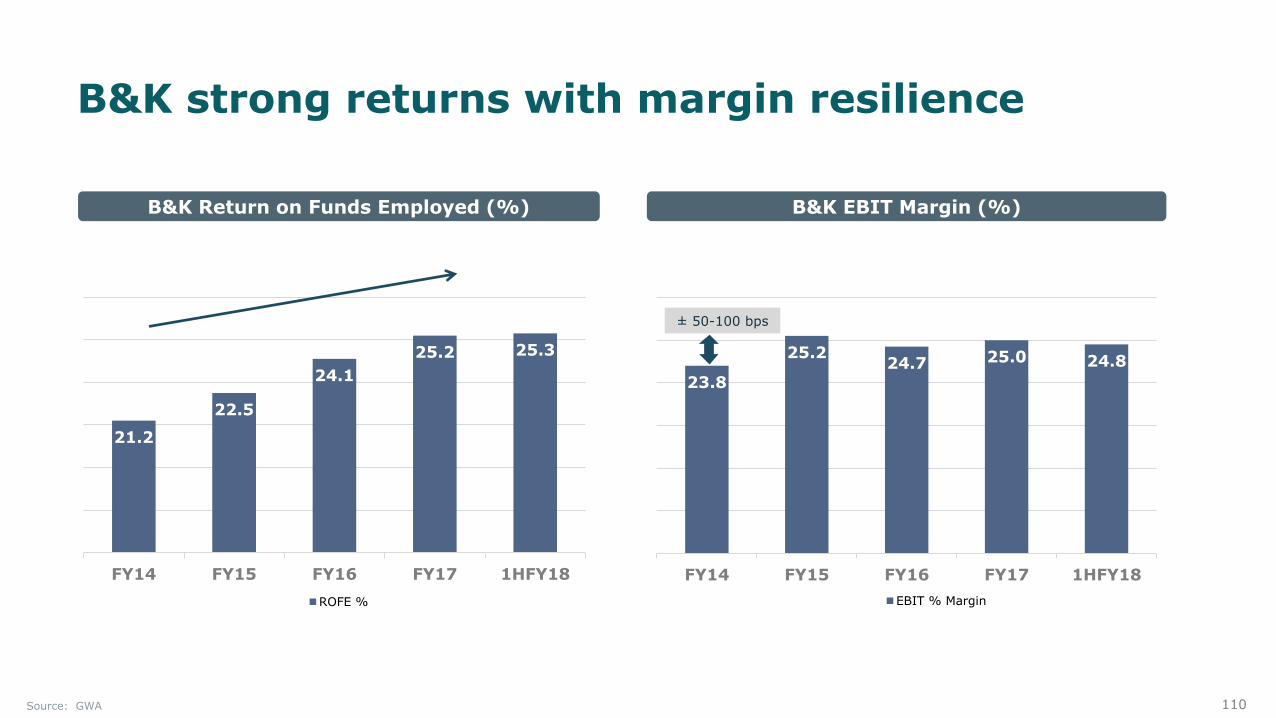
23.8
25.224.7 25.0 24.8
FY14 FY15 FY16 FY17 1HFY18
EBIT % Margin
B&K strong returns with margin resilience
± 50-100 bps
B&K EBIT Margin (%)B&K Return on Funds Employed (%)
Source: GWA
21.2
22.5
24.1
25.2 25.3
FY14 FY15 FY16 FY17 1HFY18
ROFE %

111
Automation and efficiency
improvements in back office, IT
systems
End to end approach to supply
chain cost out
Growth enabler – cost savings
❖ Total cost savings of $9-$12M FY19-FY21 (3 year target)
❖ Operational efficiency – continue to reduce cost base through back office and execution efficiency improvements
❖ Supply Chain – targeting supply chain efficiencies with strategic partners: COGS; sourcing; NPD etc.
❖ Cost savings:‒ Re-invested to fund growth initiatives‒ Provide margin resilience through the
cycle‒ Offset inflation
Implement next phase of cost savings
Procurement expertise
recruited to lift capability
Stock consolidation and direct shipping state warehouses

112
Growth enabler – strong credit metrics
❖ Credit metrics continue to be consistent with investment grade
❖ Syndicated banking facility extended in October 2017 – single 3-year revolving facility maturing October 2020
❖ GWA remains in strong financial position
‒ provides enhanced financial flexibility for investment in both organic and inorganic growth opportunities and potential capital management
Strong financial position to fund growth
165
149
9588
80
0
2
4
6
8
10
12
14
16
18
0
20
40
60
80
100
120
140
160
180
FY13 FY14 FY15 FY16 FY17
Net Debt Net Debt/EBITDA Interest Cover
Continued low debt
Source: GWA
A$m Times

113
Growth enabler – disciplined capital expenditure
❖ Continued disciplined approach to Capital Expenditure
❖ Exit of manufacturing reduced capital requirements and increased more flexible cost structure
❖ Now enables higher capex focused on growth initiatives in key areas:
‒ Consumer engagement (flagship stores)
‒ NPD and R&D
‒ Customer service (distribution and warehouse management)
❖ Higher capex in FY18 reflects focus on growth initiatives, timing, and under-investment in prior years
Disciplined capital expenditure focused on growth initiatives
Source: GWA
Capital expenditure profile (A$m)
9.9
3.0 3.4 3.6
5.3
3.8
14.1
12.3
9.0
6.0
5.6
2.5
FY13 FY14 FY15 FY16 FY17 1HFY18
Capex Depreciation

114
Growth enabler – strong operating cash flow
❖ GWA continues to generate strong operating cash through the cycle
❖ Operating cash conversion at high levels
❖ Continued focus on working capital management to drive operating cash
Strong cash generation through the cycle
50.5
81.7
91.788.8
FY14 FY15 FY16 FY17Cashflow from Operations EBITDA
Cashflow from operations (A$m)
Source: GWA

115
Strong sustainable shareholder returns
❖ Board focus on providing strong returns to shareholders
❖ Dividend policy: 65-85% of NPAT, subject to prevailing market conditions
❖ Dividend Policy balances shareholder value creation with continuing strong financial position
Strong focus on shareholder returns
Dividends and returns to shareholders
-40%
-30%
-20%
-10%
0%
10%
20%
30%
40%
50%
60%
30-Jun-15 30-Sep-15 31-Dec-15 31-Mar-16 30-Jun-16 30-Sep-16 31-Dec-16 31-Mar-17 30-Jun-17 30-Sep-17 31-Dec-17 31-Mar-18
GWA ASX 200 Acc Index
Source:

116
Agenda
GWA transformation - strong progress made
A business with significant growth opportunities
Consumer driven growth
Leveraging our advantaged supply chain
Our financial strength
Tim Salt
Tim Salt
Craig Norwell
SeméeDickerson
Customer focus delivering growth
Anthony Mortimer
Patrick Gibson
GWA well positioned for growth Tim Salt

117
Strategy creates focus and positions GWA for growth
We make life better with superior solutions for water
CATEGORIES
Leverage sanitary to win all of
bathrooms and kitchens
SEGMENTS
Build on Commercial
leadership and grow in R&R
Gro
wth
Driv
ers SOLUTIONS
Lead “smart water
management”
BRANDS
Deliver the best water
experiences
GWA Operational Measures Market share, NSV, EBIT, ROFE, DIFOT, NPS, Safety, Engagement
Co
rp
orate
Prio
rit
ies
Build GWA as the most trusted and respected water solutions company Maximise shareholder value creation – NPAT growth , ROFE, TSR
BUSINESS EFFICIENCY : Simple, effective processes and plans delight consumers and customers
BEST COST : Continuous improvement to support profitability and fund selective reinvestment
GREAT PEOPLE : Continue to build “fit for future” culture, engagement and capability
CUSTOMER FOCUSEDAdd value to customers through superior
insights, analytics and processes
CONSUMER DRIVENDeliver experiences to excite consumers and drive revenue
and market share growth
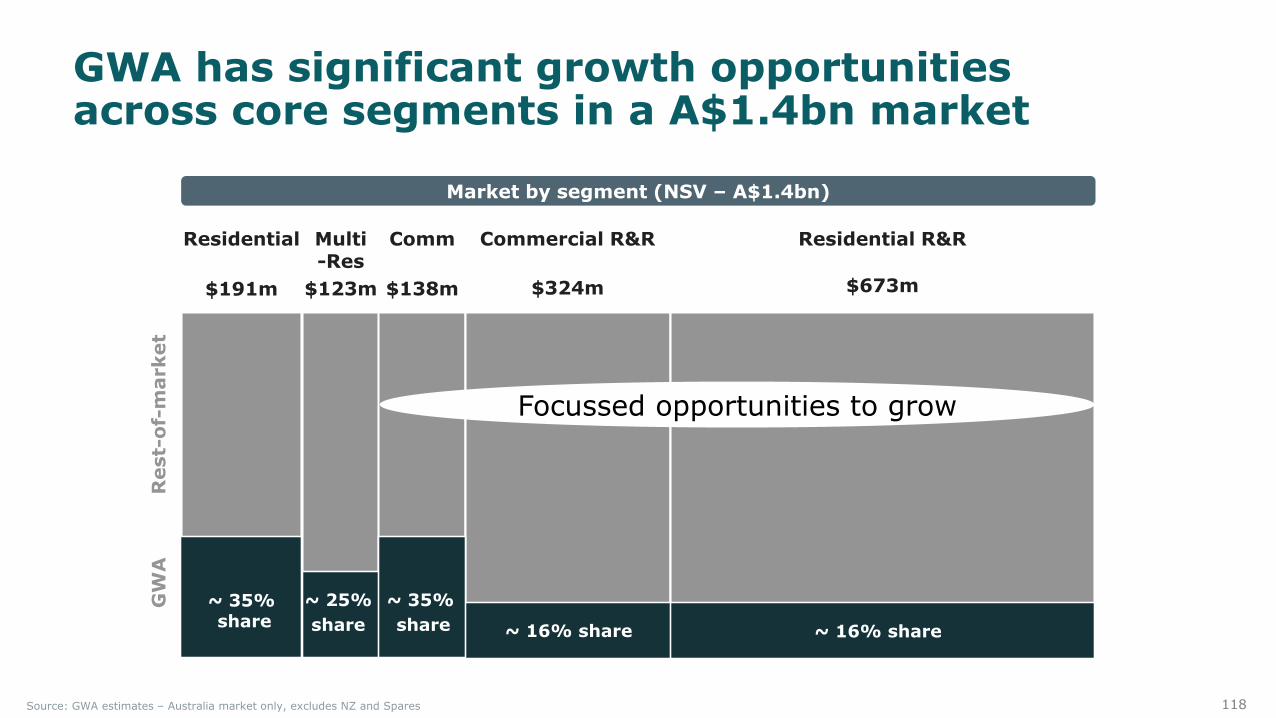
118
~ 35%share
~ 25%
share ~ 16% share ~ 16% share
GW
AR
est-
of-
market
$324m$191m $138m$123m $673m
Multi-Res
Residential Comm Residential R&RCommercial R&R
~ 35%
share
Source: GWA estimates – Australia market only, excludes NZ and Spares
GWA has significant growth opportunities across core segments in a A$1.4bn market
Market by segment (NSV – A$1.4bn)
Focussed opportunities to grow

119
GWA Superior Solutions for Water Growth Model G
eo
grap
hy
Exis
ting
New
Segment / Category
Existing
➢ Priority. Strengthen core offering through organic and inorganic expansion
➢ Local partnerships inCommercial segments inwater scarce geographies
➢ Cannot win, will not play
➢ Grow via broader segment penetration and category adjacencies
And opportunities to extend into large water solutions adjacencies
Adjacent

120
GWA Making life better through superior solutions for water
❖ Demonstrating ability to drive growth and improve shareholder returns
❖ A more focused business with strong brands and leading market positions
❖ Pursuing significant growth opportunities focused on superior solutions for water
❖ Increased use of technology to create solutions for customers and consumers
❖ Financial strength to fund investment in organic and inorganic opportunities

121
GWA, Making Life Better for all stakeholders
We make life better through the design and delivery of products, services and technologies that
create superior solutions for people to enjoy and sustain water,
our planet’s most precious resource.

12th April, 2018
© GWA Group Ltd 2018
123
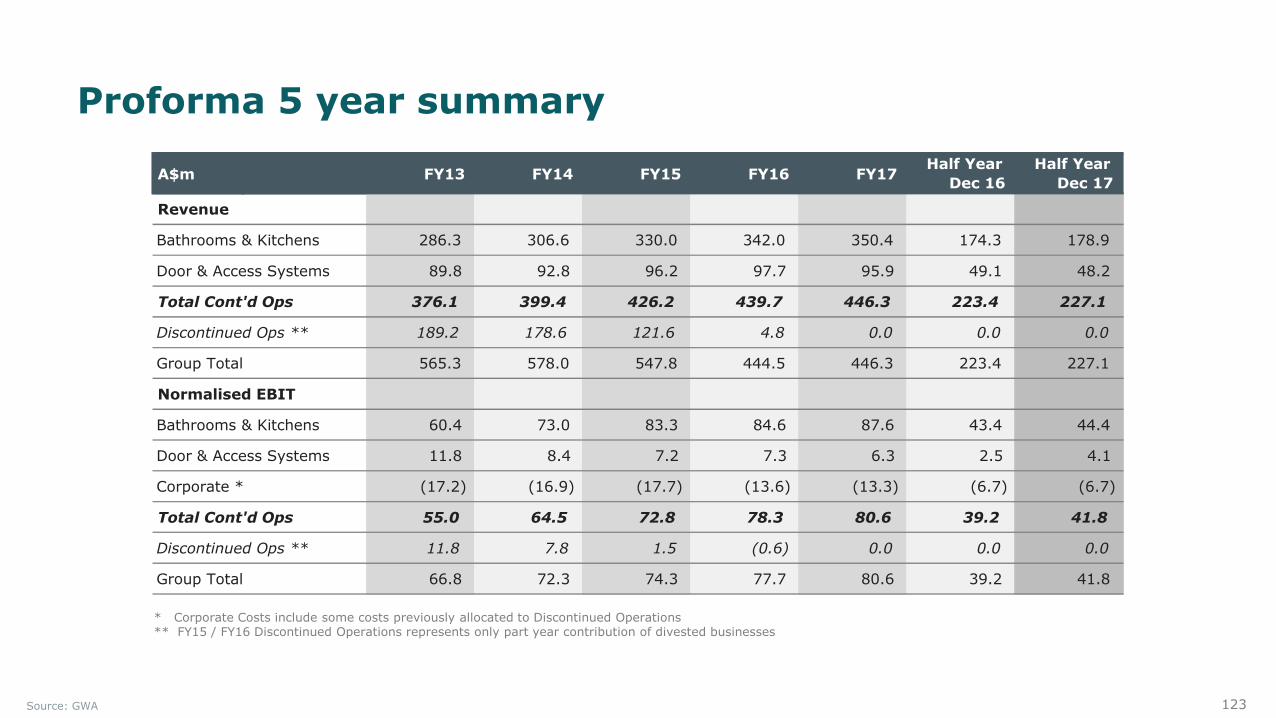
Proforma 5 year summary
* Corporate Costs include some costs previously allocated to Discontinued Operations** FY15 / FY16 Discontinued Operations represents only part year contribution of divested businesses
Source: GWA
A$m FY13 FY14 FY15 FY16 FY17Half Year
Dec 16
Half Year
Dec 17
Revenue
Bathrooms & Kitchens 286.3 306.6 330.0 342.0 350.4 174.3 178.9
Door & Access Systems 89.8 92.8 96.2 97.7 95.9 49.1 48.2
Total Cont'd Ops 376.1 399.4 426.2 439.7 446.3 223.4 227.1
Discontinued Ops ** 189.2 178.6 121.6 4.8 0.0 0.0 0.0
Group Total 565.3 578.0 547.8 444.5 446.3 223.4 227.1
Normalised EBIT
Bathrooms & Kitchens 60.4 73.0 83.3 84.6 87.6 43.4 44.4
Door & Access Systems 11.8 8.4 7.2 7.3 6.3 2.5 4.1
Corporate * (17.2) (16.9) (17.7) (13.6) (13.3) (6.7) (6.7)
Total Cont'd Ops 55.0 64.5 72.8 78.3 80.6 39.2 41.8
Discontinued Ops ** 11.8 7.8 1.5 (0.6) 0.0 0.0 0.0
Group Total 66.8 72.3 74.3 77.7 80.6 39.2 41.8

124
Australian population growth
0.0
0.5
1.0
1.5
2.0
2.5Ju
n-1
98
2
Ju
n-1
98
3
Ju
n-1
98
4
Ju
n-1
98
5
Ju
n-1
98
6
Ju
n-1
98
7
Ju
n-1
98
8
Ju
n-1
98
9
Ju
n-1
99
0
Ju
n-1
99
1
Ju
n-1
99
2
Ju
n-1
99
3
Ju
n-1
99
4
Ju
n-1
99
5
Ju
n-1
99
6
Ju
n-1
99
7
Ju
n-1
99
8
Ju
n-1
99
9
Ju
n-2
00
0
Ju
n-2
00
1
Ju
n-2
00
2
Ju
n-2
00
3
Ju
n-2
00
4
Ju
n-2
00
5
Ju
n-2
00
6
Ju
n-2
00
7
Ju
n-2
00
8
Ju
n-2
00
9
Ju
n-2
01
0
Ju
n-2
01
1
Ju
n-2
01
2
Ju
n-2
01
3
Ju
n-2
01
4
Ju
n-2
01
5
Ju
n-2
01
6
Ju
n-2
01
7
Australian population growth (%)
Source: ABS

125
Annual net overseas migration
0
50
100
150
200
250
300
350
Ju
n-8
2
Ju
n-8
3
Ju
n-8
4
Ju
n-8
5
Ju
n-8
6
Ju
n-8
7
Ju
n-8
8
Ju
n-8
9
Ju
n-9
0
Ju
n-9
1
Ju
n-9
2
Ju
n-9
3
Ju
n-9
4
Ju
n-9
5
Ju
n-9
6
Ju
n-9
7
Ju
n-9
8
Ju
n-9
9
Ju
n-0
0
Ju
n-0
1
Ju
n-0
2
Ju
n-0
3
Ju
n-0
4
Ju
n-0
5
Ju
n-0
6
Ju
n-0
7
Ju
n-0
8
Ju
n-0
9
Ju
n-1
0
Ju
n-1
1
Ju
n-1
2
Ju
n-1
3
Ju
n-1
4
Ju
n-1
5
Ju
n-1
6
Ju
n-1
7
Annual Net Overseas Migration ('000’s)
Source: ABS

126
Population growing faster than dwelling stock - increases demand for housing

127
Strong consumer sentiment
128
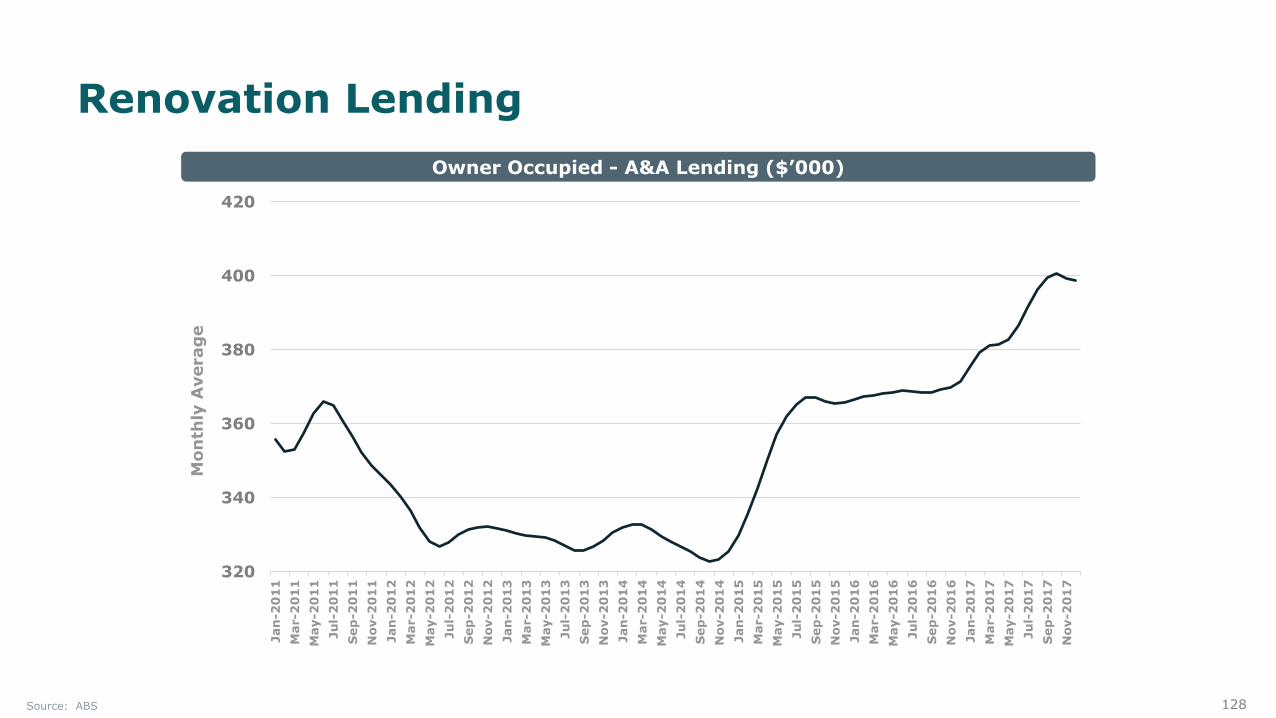
Renovation Lending
320
340
360
380
400
420
Jan
-20
11
Mar-2
01
1
May-2
01
1
Ju
l-2
01
1
Sep
-20
11
Nov-2
01
1
Jan
-20
12
Mar-2
01
2
May-2
01
2
Ju
l-2
01
2
Sep
-20
12
Nov-2
01
2
Jan
-20
13
Mar-2
01
3
May-2
01
3
Ju
l-2
01
3
Sep
-20
13
Nov-2
01
3
Jan
-20
14
Mar-2
01
4
May-2
01
4
Ju
l-2
01
4
Sep
-20
14
Nov-2
01
4
Jan
-20
15
Mar-2
01
5
May-2
01
5
Ju
l-2
01
5
Sep
-20
15
Nov-2
01
5
Jan
-20
16
Mar-2
01
6
May-2
01
6
Ju
l-2
01
6
Sep
-20
16
Nov-2
01
6
Jan
-20
17
Mar-2
01
7
May-2
01
7
Ju
l-2
01
7
Sep
-20
17
Nov-2
01
7
Mo
nth
ly A
verag
e
Owner Occupied - A&A Lending ($’000)
Source: ABS

129
30-35 year old detached house stock closely correlated with renovations activity and expected to grow into the early 2020s
10
15
20
25
30
35
40
350
400
450
500
550
600
650
Vo
lum
e o
f Ren
ovatio
ns A
ctiv
ity (
$b
n)
Th
ou
san
ds o
f H
ou
ses
30-35 year (inc) Houses Completed State Final Demand - MAT
Source: ABS, HIA Economics

130
Non Residential by sector
Non Residential – Value of Work Done $m
0
2,000
4,000
6,000
8,000
10,000
12,000
14,000
Retail Offices Accommodation Transport
Factory Warehouses Other C&I Education
Aged Care Health Entertainment & Recreation Other S&I
Source: BIS Oxford Economics: MAT, Actuals to June 2017, Forecast September 2017 – June 2022
Forecast

12th April, 2018
© GWA Group Ltd 2018