12 ALADIN WS Medulin 2002 · 20 Amela Jeričević [email protected] 21 Jure Jerman...
54
Transcript of 12 ALADIN WS Medulin 2002 · 20 Amela Jeričević [email protected] 21 Jure Jerman...


2
12th ALADIN Workshop
FOREWORD Dear Colleagues,
It is a great pleasure to welcome you in Medulin, Croatia for the Twelfth ALADIN Workshop on Scientific Development and Operational Exploitation of the ALADIN model. Over the past few years, it is become traditional to organise two ALADIN Workshops each year, one being concentrated on scientific matters and the other welcoming forecasters and other users of the model's products. This year two workshops are merged into one to allow the presentation of results and encourage discussion and exchange of ideas between ALADIN scientific developers and users. The workshop encompasses a series of oral and poster presentations, group discussions on selected topics and plenary discussions. Topics to be discussed: operational applications, dynamics, coupling, physics-dynamics interface, physics, model evaluation and verification, variational data assimilation. These proceedings contain the workshop schedule, the list of participants and all the abstracts of the presentations submitted at the workshop, provided that the abstracts arrived at least one week prior to the meeting. We hope that this written material will help participants to prepare for the discussions. The proceedings will included the all papers presented and the reports of all the working groups and will be issued after the workshop. Finally, we wish you a nice time in Medulin and a very successful workshop. Organising Committee

3
12th ALADIN Workshop
PROGRAMME Sunday, 2nd June 16:00 - 18:00 Registration
Monday, 3rd June 8:00–9:00 Registration
9:00–9:45 Opening
9:00–9:15 Welcome by Director NMS Croatia
9:15–9:25 Practical details (Organizing Committee)
9:25–9:50 D. Giard A new research plan and scientific networking
9:50–11:00 Session 1: Operational applications (Chair: Branka Ivančan Picek))
9:50–10:10 M. Sandev Operational use of ALADIN model, forecast applications
10:10–10:30 I. Bonta Usage of ALADIN products at HMS
10:30–11:10 Poster session and coffee break
11:10–12:10 Session 1: Operational applications (Chair: Branka Ivančan Picek) continued
11:10–11:30 Z. Huthova Precipitation forecast through statistical adaptation
11:30–11:50 M. Tudor MAP IOP 15 Case Study
11:50–12:10 M. Mokorić ALADIN products in “Taming the Dragon-Dalmatia 21 to 24 May 2002”
12:10–14:00 Lunch
14:00–16:00 Session 2: Dynamics and coupling (Chair: P. Smolikova)
14:00–14:20 J. Vivoda Present status of NH dynamics
14:20–14:40 C. Smith Flow over orography in NH ALADIN
14:40–15:00 J. Vivoda Predictor/corrector scheme for NH ALADIN
15:00–15:20 C. Moussy Coupling in ALADIN
15:20–15:40 P. Termonia Interpolation of the coupling data; a perturbation approach
15:40–16:00 I. Gospodinov Physics-dynamics interface
16:00–16:30 Coffee break
16:30–18:30 Parallel sessions Working group: Skill of operational models (Chair: S. Ivatek Šahdan)
Working group: Dynamics and coupling (Chair: F. Vana)
19:00 Welcome party

4
12th ALADIN Workshop PROGRAMME
Tuesday 4th June
9:00–10:10 Session 1: Operational applications (Chair: Branka Ivančan Picek) continued
9:00– 9:20 P.Termonia Using ALADIN for the dispersion of pollution
9:20– 9:40 K. Stadlbacher Aircraft icing forecasts with the ALADIN model
9:40– 9:55 J. D. Gril System collaboration - conclusions of SRNWP workshop
9:55–10:10 J. D. Gril Portability of ALADIN applications
10:10–10:40 Coffee break
10:40–12:40 Session 3: Physics (Chair: N. Pristov)
10:40–11:00 J. M. Piriou Clouds and turbulence: present developments and perspective
11:00–11:20 M. Gera Turbulent kinetic energy
11:20–11:40 A. Simon Turbulent fluxes and cyclogenesis - case study of the 20 December 1998 storm
11:40–12:00 H. Seidl Investigation of nocturnal boundary layer structure in ALADIN 3D and 1D version
12:00–12:20C. Soci Moist physical parameterization in the mesoscale gradient computation
12:20–14:00 Lunch
14:00–15:00 Session 3: Physics (Chair: N. Pristov) continued 14:00–14:20 E. Bazile An overview of the weaknesses of the Convection scheme and
the link with the prognostic liquid water
14:20–14:40 L. Gérard Coherent treatment of deep convection, prognostic cloud water and cloud fractions at high resolution ALADIN
14:40–15:00 T. Haiden Experiments with a prognostic convection scheme
15:00–15:30 Coffee break
15:30–17:30 Parallel sessions Working group: Applications (Chair: K. Stadlbacher)
Working group: Physics / convection (Chair: L. Gérard)

5
12th ALADIN Workshop PROGRAMME
Wednesday 5th June
9:00–10:40 Session 4: Verification (Chair: D. Klarić)
9:00– 9:20 P. Pottier The objective verification project for synoptic scale
9:20– 9:40 Z. Huthova Objective verifications at the CHMI in the last two years
9:40–10:00 Z. Vakula Adriatic storm cases
10:00–10:20 J. M. Piriou Computing brightness temperatures in ARPEGE/ALADIN
10:20–10:40 J. Merše Improving ALADIN 2m temperature forecast with machine learning
10:40–11:10 Coffee break
11:10–13:10 Working group: Verification (Chair: P. Pottier)
13:10–14:30 Lunch
14:30 Brijuni excursion with dinner
Thursday 6th June
9:00–11:00 Session 5: Variational data assimilation (Chair: D. Giard)
9:00– 9:20 C. Fischer Variational algorithms in ALADIN: state of the art, future plans and hints
9:20– 9:40 G. Balsamo A mesoscale variational assimilation for land surface variables
9:40–10:00 S. Ivatek-Šahdan Analysis of surface variables
10:00–10:20 M. Szczech Matrix B for surface parameters in assimilation of IASI/AIRS data over land
10:20–10:40 A. Deckmyn DFI blending in ALADIN Belgium
10:40–11:00 M. Belo Pereira Background error statistics estimated using an Analysis Ensemble Method
11:00–11:30 Coffee break
11:30–12:30 Parallel sessions Working group: Physics /turbulence, PBL (Chair: M. Gera)
Working group: Data assimilation (Chair C. Fischer)
12:30–13:30 Lunch
13:30–14:30 Parallel sessions (continued) Working group: Physics / turbulence, PBL (Chair: M. Gera)
Working group: Data assimilation (Chair: C. Fischer)
14:30–14:45 Small break
14:45–16:45 Working groups conclusions and discussion (Chair: Y. Bouteloup)
16:45 Closing

6
12th ALADIN Workshop
LIST OF PARTICIPANTS
Name e-mail
1 Alica Bajić [email protected]
2 Gianpaolo Balsamo [email protected]
3 Eric Bazile [email protected]
4 Margarida Belo Pereira [email protected]
5 Imre Bonta [email protected]
6 Yves Bouteloup Yves. [email protected]
7 Alex Deckmyn [email protected]
8 Dunja Drvar [email protected]
9 Claude Fischer [email protected]
10 Branko Gelo [email protected]
11 Martin Gera [email protected]
12 Luc Gérard [email protected]
13 Dominique Giard Dominique. Giard @meteo.fr
14 Ilian Gospodinov [email protected]
15 Jean-Daniel Gril [email protected]
16 Thomas Haiden [email protected]
17 Zuzana Huthova [email protected]
18 Branka Ivančan-Picek [email protected]
19 Stjepan Ivatek-Šahdan [email protected]
20 Amela Jeričević [email protected]
21 Jure Jerman [email protected]
22 Lovro Kalin [email protected]
23 Dijana Klarić [email protected]
24 Igor Kos [email protected]
25 Janko Merše [email protected]
26 Marija Mokorić [email protected]

7
12th ALADIN Workshop
LIST OF PARTICIPANTS
Name e-mail
27 Chantal Moussy [email protected]
28 Jean-Marcel Piriou [email protected]
29 Dunja Plačko-Vršnak [email protected]
30 Patricia Pottier [email protected]
31 Neva Pristov [email protected]
32 Raluca Radu [email protected]
33 Marjan Sandev [email protected]
34 Harald Seidl [email protected]
35 André Simon [email protected]
36 Christopher Smith [email protected]
37 Petra Smolikova [email protected]
38 Cornel Soci [email protected]
39 Klaus Stadlbacher [email protected]
40 Margorzata Szczech [email protected]
41 Zvonimir Škarić [email protected]
42 Marijan Tadin [email protected]
43 Piet Termonia [email protected]
44 Martina Tudor [email protected]
45 Vesna Tusić [email protected]
46 Zoran Vakula [email protected]
47 Filip Vana [email protected]
48 Jozef Vivoda [email protected]
49 Višnja Vučetić [email protected]
50 Vlatko Vukičević [email protected]
51 Višnja Zdelarec

12 th ALADIN WORKSHOP Medulin, Croatia, 3–6 June 2002
8
Session 1 OPERATIONAL APPLICATION
1. Imre Bonta: Use of ALADIN Products at Hungarian Meteorological Service 2. Zuzana Huthova, Serge Farges and Frédéric Atger: Precipitation Forecast
through Statistical Adaptation 3. Martina Tudor: MAP IOP 15 Case Study 4. Marija Mokorić : ALADIN Products in Field Exercise “Taming the Dragon -
Dalmatia 2002” 5. Piet Termonia and Alfred Quinet: Using ALADIN to Forecast
Meteorological Conditions that are Extremely Unfavorable for the Dispersion of Pollution
6. Reinhard Stepanek, Klaus Stadlbacher and Thomas Haiden: Aircraft Icing
Forecasts with the ALADIN Model 7. Otilia Diaconu and Serge Farges: MOS–Precipitation Forecasting Using
ALADIN Model 8. Tomislav Kovačić: CAPE from ALADIN and Radio Sounding Data 9. Martina Tudor and Stjepan Ivatek-Šahdan: The Croatian Operational
ALADIN Suite

12 th ALADIN WORKSHOP Medulin, Croatia, 3–6 June 2002
9
Use of ALADIN Products at Hungarian Meteorological Service
Imre Bonta Hungarian Meteorological Service, Kitabel Pal U. 1, H-1525 Budapest, POB 38
Different products, which are based on ALADIN model are used in more and more areas of meteorology. My lecture shows a summary about these products helping general, aviation and media forecasters at Hungarian Meteorological Service (HMS). In the first part of my lecture I report about the different basic fields which can be displayed with the help HAWK (Hungarian Advanced Workstation). HAWK is the operational meteorological workstation system used by the HMS. It is a classical UNIX based workstation system – fully developed by HMS – to visualize all kind of meteorological information like numerical weather prediction model results (isolines with isoline-shading, vector-fields, weather symbols, spaghetti diagrams, emagrams), synop, temp observations (on map and on emagram), radar (PPI, RHI, VAD) satellite and, lightning measurement.. An important feature of the system is that users can save their configurations into menus, thus all the visualizations are menu driven (in HAWK they are called macros). The usage of the macros can save a lot of time in the forecasters’ work. In the next Figure a popular macros can be seen showing different predicted ALADIN fields. In the second part of my lecture I report about some special products based on Hungarian version of ALADIN model for a domain centred over Hungary, which is running two times a day. Having own models there is a big advantage with compared to those models where only the basic results are available. So we are producing a lot of special post processed products based on ALADIN/HU model like pseudo satellite movie, meteograms, pseudotemps, vertical cross section distribution of different instability indices or distribution of the predicted wind gust etc. The next Figure shows a vertical cross section based on ALADIN model. This product is very useful not only regarding aviation forecasters point of view, but form the general forecasts point of view as well. In case of aviation forecasts we are using a lot of other products based on ALADIN model like regional area forecasts, for VFR flights lee-wave forecasts for gliders, weather forecasts for hot air balloonists, thermal forecast for gliders low level SIGWS charts. The ALADIN model is used by the Hungarian now casting system (MEANDER) too. The first guess data comes from ALADIN model. The analysed temperature, humidity wind values in the pressure vertical coordinate system are interpolated from the CANARI grid to the to the MEANDER 3D basic grid. In the end of my lecture some words about automation and in connection with this about verification. It’s well known that the increasing number of tasks, the income-oriented approach and the continuous improvement of technical possibilities have forced the automation in more and more areas. For 3 years, the weather forecasts have been prepared for our customers using a special computer program. Based on the forecast codes for each region of the country prepared by the main forecaster, the program automatically produces the basic forecasts for our clients, which only have to be modified by hand to satisfy some special demands of our customers. We also create the above mentioned coded forecasts automatically using direct the outputs of different numerical models such as ECMWF and ALADIN. At the last stage during their daily work forecasters strongly use these coded forecast files in addition to the original model fields. Because these model End Products are generated automatically and have identical form to the forecasters’ predictions, it was easy to verify them with the same procedure, by calculating the

12 th ALADIN WORKSHOP Medulin, Croatia, 3–6 June 2002
10
same structure of statistical scores just as we do it for the forecasters’. So it is easy to compare the forecasters’ and the models’ predictions with this verification procedure. At the same time it is possible to measure the improvement of the daily operational forecasting quality at HMS over the numerical model End Product files available for the forecasters. In the same way it is also possible to compare the ECMWF and ALADIN forecasts themselves. Our very new verification tables are published every day on the notice board, containing the forecast values, the verifying observations as well as the errors from region to region, for the first two forecast periods of the daily forecast issued two days before. Furthermore we can also do verification distinguishing many different weather situations. The forecasters are particularly interested in the behaviour of the models in case of extreme weather events, as it is probably everywhere else in the world. After evaluating a whole year period, the forecasters are able to decide which model in which specific weather situation is significantly worse or better than the average. Furthermore these examinations may also highlight the systematic, unexpected forecast errors of the forecasters.
Figure 1 Popular macros showing different predicted ALADIN fields like the mean Sea Level Pressure, 10 m wind, precipitation, total cloudiness, relative humidity at 700 hPa, 2m temperature
Figure 2 Vertical cross section based on ALADIN/HU model

12 th ALADIN WORKSHOP Medulin, Croatia, 3–6 June 2002
11
Precipitation Forecast through Statistical Adaptation
Zuzana Huthova
Czech Hydrometeorological Institute, Na Sabatce 17, 143 06 Prague, Czech Republic [email protected]
Serge Farges
Météo-France - Dprevi/COMPAS/ASD, 42 av Coriolis, 31057 Toulouse Cedex, France [email protected]
Frédéric Atger
European Centre for Medium-Range Weather Forecasts, Shinfield Park, Reading, RG2 9AX, UK [email protected]
A statistical adaptation of precipitation forecasts is not simple because precipitation is spatially and temporally discontinuous. One method frequently used to cope with this problem is multivariate discriminant analysis. Discriminant analysis is a statistical technique in which predictor values are used to distinguish between categories of the predictand. In our case, the predictand is binary, it is either the occurrence (non-occurrence) of precipitation, or the fact that precipitation is above (below) a certain threshold. ALADIN model outputs were used as predictors for the period from February 2000 to February 2002 for the territory of the Czech Republic. The precipitation observations were taken from 31 Czech synoptic stations. A control quality was applied to the observations; the precipitation was summed to 6, 12 and 24 hour amounts. The quality of the prediction scheme was tested on an independent sample of observations from October 1999 to January 2000. A comparison was performed with direct model outputs and has shown that statistical adaptation would be useful for improving prediction and suitable for an operational use.

12 th ALADIN WORKSHOP Medulin, Croatia, 3–6 June 2002
12
MAP IOP 15 Case Study
Martina Tudor Meteorological and Hydrological Service, Grič 3, 10000 Zagreb, Croatia
The ability of forecasting severe bura events on the Adriatic coast using the ALADIN model operationally used in Croatian meteorological service is presented. Both versions that are currently in use, the LACE and Croatian, and the dynamical adaptation of the surface wind field from the latter are tested on a MAP IOP 15 case. The MAP IOP 15 took place between 5th and 10th of November 1999. The strongest bura was recorded around 12 UTC on 7th of November. The different versions of the same numerical model are used on different domains and resolutions. The output surface wind field from the 8-km resolution Croatian domain is dynamically adapted to orography with 2-km resolution, the both results are compared to the measured data. The later method proved to be very useful for locations where the bura is the most severe, like the Maslenica bridge. The impact of better representation of orography on the forecasted wind field in the mountainous parts of the coast is visible in the increased spatial variability of the field.
Figure 1 Surface wind fields (10 m agl) from ALADIN/LACE (top, left), ALADIN/HR (top, right)
and Dynamical adaptation (bottom, left) and meridional cross-section from ALADIN/HR (bottom, right) on vertical pressure levels from 975 to 600 hPa, for longitude 15.5 east latitude
from 43.8 to 44.8, with terrain height along that profile for 7th November 1999 00 UTC run 12 hr forecast is shown in as wind velocity (vector) and as wind speed (shaded).

12 th ALADIN WORKSHOP Medulin, Croatia, 3–6 June 2002
13
ALADIN Products in Field Exercise “Taming the Dragon - Dalmatia 2002”
Marija Mokorić
Meteorological and Hydrological Service, Grič 3, 1000 Zagreb, Croatia [email protected]
Field exercise “Taming the Dragon-Dalmatia 2002” will be held on Dalmatian coast from 21st to 24th of May 2002 and will be the greatest military-civil exercise in the world this year. The aim of the Exercise is to practice Euro-Atlantic Disaster Response Coordination Centre procedures and Euro-Atlantic Disaster Response Unit capabilities in order to improve the Euro-Atlantic Partnership Council and other southeast European countries ability to respond to a disaster. Many other existing networks and organizations will participate in the Exercise and among them Meteorological and Hydrological Service of Croatia for meteorological support. The scenario for the field exercise is developed on “wild fires” which is one of the risks common to all countries of southeast Europe. The scenario also anticipates the rescue from mountain and sea and the accident, which causes chemical contamination. For making plans and carry out all of these activities it is necessary to have precise and reliable local weather forecast which could provide only the mesoscale numerical weather prediction model. The products of ALADIN mesoscale model are of great importance for making local forecasts in our country, particularly the wind field forecast for forest fires protection service. In the Exercise “Taming the Dragon-Dalmatia 2002” all available products of ALADIN will be used - the temperature forecast, the amount and the type of precipitation, the relative humidity forecast. But the most important is the wind and atmospheric stability forecast due to the influence this meteorological parameters have on the intensity and spread of forest fires. The forecast of wind field will be based on ALADIN/LACE and ALADIN/CROATIA numerical model. The local forecast (MAKARSKA) of the temporal and vertical change of wind velocity and direction will be issued on the basis of ALADIN/LACE pseudotemps for every three hour 48 hours in advance by applying the Croatian diagnostic model HRID (High Resolution Isentropic Diagnosis). The dynamical adaptation of surface wind field for domain SPLIT will be used for more detailed wind forecast in the Exercise area. ALADIN/LACE and ALADIN/CROATIA vertical velocity at AT 925 and AT 850 hPa, the vorticity and temperature advection at AT 925 hPa of ALADIN/LACE for estimation the atmospheric stability. It is possible to have forecasted vertical profile of the wind for the various grid- points of the model for that part of Dalmatia.
The calculated trajectories for the air particle from ALADIN model can be done.
The actual weather situation and the forecast for the period of the Exercise will be more detailed analysed later. The figures 1 and 2 are examples of ALADIN prognostic charts, which are accessible to forecasters.

12 th ALADIN WORKSHOP Medulin, Croatia, 3–6 June 2002
14
FFiigguurree 11 DDyynnaammiicc aaddaappttaattiioonn ooff AALLAADDIINN//CCRROOAATTIIAA wwiinndd aatt 1100 mm ffoorr mmiidd--DDaallmmaattiiaa..
Figure 2 Vertical velocity at 925 hPa of ALADIN/LACE model.
12 th ALADIN WORKSHOP Medulin, Croatia, 3–6 June 2002
15
Using ALADIN to Forecast Meteorological Conditions that are Extremely Unfavorable for the Dispersion of Pollution
Piet Termonia
Royal Meteorological Institute of Belgium, Ringlaan 3, 1180 Brussels, Belgium [email protected]
Alfred Quinet Royal Meteorological Institute of Belgium, Ringlaan 3, 1180 Brussels, Belgium
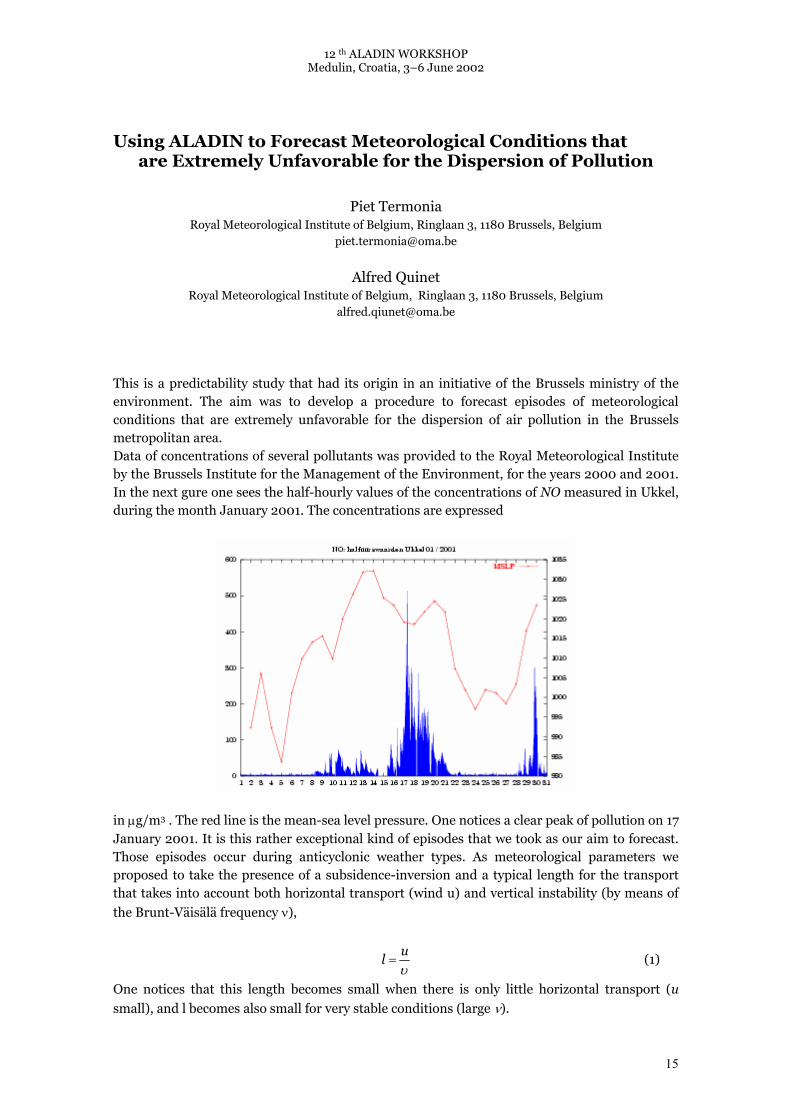
This is a predictability study that had its origin in an initiative of the Brussels ministry of the environment. The aim was to develop a procedure to forecast episodes of meteorological conditions that are extremely unfavorable for the dispersion of air pollution in the Brussels metropolitan area. Data of concentrations of several pollutants was provided to the Royal Meteorological Institute by the Brussels Institute for the Management of the Environment, for the years 2000 and 2001. In the next gure one sees the half-hourly values of the concentrations of NO measured in Ukkel, during the month January 2001. The concentrations are expressed
in µg/m3 . The red line is the mean-sea level pressure. One notices a clear peak of pollution on 17 January 2001. It is this rather exceptional kind of episodes that we took as our aim to forecast. Those episodes occur during anticyclonic weather types. As meteorological parameters we proposed to take the presence of a subsidence-inversion and a typical length for the transport that takes into account both horizontal transport (wind u) and vertical instability (by means of
the Brunt-Väisälä frequency ν),
υu
l = (1)
One notices that this length becomes small when there is only little horizontal transport (u
small), and l becomes also small for very stable conditions (large ν).

12 th ALADIN WORKSHOP Medulin, Croatia, 3–6 June 2002
16
We consider the following situation as critical: ● subsidence inversion is present ● the thickness of the layer where l ≤ 100m reaches the inversion level. This situation is illustrated in the forecast for the peak on 17 January. We have done a
data analysis of the model output of ALADIN 12 and 15 for the years 2000 and 2001, and concluded that indeed based on this, the peaks were well forecast and more importantly that ALADIN did not give false alarms. These experiments show that the parameterization of the boundary-layer processes is good enough to get a clear signal. At the RMI this is considered to be a good application and certainly adds a great deal to the confidence to the ALADIN project.

12 th ALADIN WORKSHOP Medulin, Croatia, 3–6 June 2002
17
Aircraft Icing Forecasts with the ALADIN Model
Reinhard Stepanek Central Institute for Meteorology and Geodynamics, Hohe Warte 38, 1190Vienna, Austria
Klaus Stadlbacher Central Institute for Meteorology and Geodynamics, Hohe Warte 38, 1190 Vienna, Austria
Thomas Haiden Central Institute for Meteorology and Geodynamics, Hohe Warte 38, 1190 Vienna, Austria
Icing of aircrafts can lead to serious problems for civil and military aviation. Therefore it seems useful to have a forecasting procedure which allows to identify critical regions to prevent aircrafts from entering them. The ALADIN-model which is operationally running at ZAMG in Vienna is used as basic model for these forecasts. The model has a horizontal resolution of 9.6 km and covers whole central Europe although in this specific case icing forecasts are provided only for the Austrian region. The icing forecast itself is based on the so called icing-index, which was developed in Sweden some years ago. There the HIRLAM-model with a resolution of 22 km is used for calculating the index (Olofsson, 2000). The parameters which are needed from the ALADIN model are the following:
Temperature [K] Cloud liquid water (=CLW) [g/kg] Vertical velocity [cm/s] Total cloud cover [1] Geopotential [gpm]
These parameters are taken from the lowest 14 model levels (which reach a maximum height of about 6000 m over the Alps). This choice was made because it was assumed that one can expect most of the pilot reports, which are necessary for the evaluation, from this height-range. The general icing index is calculated in several steps which take the individual relevant meteorological parameters into account. First a basic index is calculated which purely depends on the LCW
)LCWln(AInd += 5 (1)
This results in values from 1 to 5 for indA . This index is modified using vertical velocity:
w[cm/s] <0 0-10 11-20 21-30 >30
indB A-1 A+1 A+2 A+3 A+4

12 th ALADIN WORKSHOP Medulin, Croatia, 3–6 June 2002
18
indB is set in relation to the icing intensities after the ICAO:
icing intensity no icing light light/moderate moderate moderate/severe severe Bi 0-1 2-3 4 5-6 7 8-9 Some adjustments to the cloud liquid water are made to improve the forecast quality:
25
40+=
TCLWCLWnew (2)
T is the temperature in C, and this linear reduction of CLW is carried out for layers in which the Temperature is between –15C and –40C. Observations showed that icing was forecasted to often in such areas due to the overestimated contribution of the CLW. A further modification is given by
TCCCLWCLW ∗=cov (3)
where TCC is total cloud cover, in order to yield reduced icing potential at grid point which are only partially field by clouds. We also need to take into account the higher resolution of ALADIN as compared to the HIRLAM model, for which the icing index was originally developed and calibrated. In a model which has higher horizontal resolution, stronger vertical velocities usually occur, and this relationship is approximately linear (Nordeng, 1994). Thus we multiply the ALADIN vertical velocity by the ratio 0.44=9.6/22 of the horizontal resolutions of the two models before entering the icing formula. Both versions of the index (with original and reduced vertical velocity) are compared with observations. The validation period is from Nov. 2001 to Jan. 2002. For the verification PIREPS (pilot reports) are used. First a rough check was done, if the model forecast in general is close to observations (comparison with soundings). It is not easy to give a decisive assessment based on the verification but some tendencies are apparent. Both models have a tendency to overestimate the icing. The model with the reduced vertical velocity is shows equal or better performance in all cases and the layer affected by icing is almost always correctly forecast. The biggest problems occur in low stratus situations which are not well forecast by the model in general. Icing is the strongly underestimated. The system is operationally implemented at ZAMG, and currently used by the military weather service and by the civil aviation forecasters in Austria. References Nordeng, T.E., 1994: Extended versions of the convective parametrization scheme at Ecmwf and their impact on the mean and transient activity of the model in the tropics Technical memorandum No. 26, Research Department ECMWF, 1 - 37 Olofsson, B., 2000: A new algorithm to estimate aircraft icing applied to the Hirlam-model Annex K to Record MCMG/WG-BMSS+CP-1, 1-7

12 th ALADIN WORKSHOP Medulin, Croatia, 3–6 June 2002
19
MOS–Precipitation Forecasting Using ALADIN Model
Otilia Diaconu National Institute of Meteorology and Hydrology, Ploiesti nr 97, 71552 Bucharest, Romania
Serge Farges
Météo France - Dprevi/COMPAS/ASD, 42 av Coriolis, 31057 Toulouse Cedex, France [email protected]
Abstracts The production of interpretative weather element forecasts from dynamical model output variables is now an integral part of the centralized guidance systems of weather services throughout the world. In Romania, statistical guidance system has evolved throughout the past 10 years. The statistical models developed used ALADIN dynamical model for 140 meteorological stations are operationally starting 2001. The MOS approach correlates predictand data (local weather observations) to combinations of predictor data (output from numerical models, surface data, etc). For the precipitation forecast, the linear discriminant analyses have been used instead of linear regression. In the MOS development, predictors included forecasts of temperature, thickness, temperature advection, relative humidity, vertical velocity, horizontal wind components, wind speed, stability, etc. Using the base predictors, derived predictors have calculated: stability indexes, thickness, temperature advection, etc. For each forecast projection and for each station we developed individual equation. In the single-station approach, equations for a given station are developed by using data from that station only: consequently, forecasts generated by such equations include the effects of local topography and climate.
Introduction Objective interpretation of the output of Numerical Weather Prediction (NWP) models started at the National Institute of Meteorology and Hydrology, in 1989 with a PP approach, for the Bucharest station, for the extremes temperatures, using ECMWF output models. The developmental sample used – 30 years, and the equations was seasonally stratified. In 1998 MOS and PP techniques were developed using ARPEGE model for the extremes temperatures, six hours temperatures, wind, cloudiness and precipitation, for 130 meteorological stations in Romania. These models are in use since then. Considerable effort has been devoted to developing an objective means of forecasting precipitation at specific locations. Dynamic numerical weather prediction (NWP) models such as the limited-area fine mesh (LFM) model provide useful forecasts of many variables such as pressure, humidity, vertical velocity and precipitation amount. However, deterministic forecasts of precipitation may contain severe biases as a result of inadequate parameterization or poor resolution of local effects. As results, one most uses a statistical interface that correlates observations of precipitation with meteorological quantities a dynamic NWP model can predict.

12 th ALADIN WORKSHOP Medulin, Croatia, 3–6 June 2002
20
General information The MOS approach correlates predictand data (local weather observations) to combinations of predictor data (output from numerical models, surface data, etc). A discriminant analysis is used to determine statistical relationships between each predictand - precipitation and the predictors. The methods used include:
• canonical regression – for each predictor, using the values of the 4 points around the station, 1 canonical predictor has calculated.
• the selection procedures – stepwise methods – have been applied using canonical predictors.
• the optimum number of predictors selected has been established empirically, using the graphical procedures. In the MOS development, predictors included forecasts of temperature, thickness,
temperature advection, relative humidity, vertical velocity, horizontal wind components, wind speed, stability, etc. For each forecast projection and for each station we developed individual equation. In the single-station approach, equations for a given station are developed by using data from that station only: consequently, forecasts generated by such equations include the effects of local topography and climate.
The lists of predictors used:
Variables Atmospheric level (mb)
Temperature (T) 2m,1000, 950, 925, 850, 700, 500
Geopotential(Z) 1000, 950, 925, 850, 700, 500
Pressure (P) Surface
Relative humidity (R) 1000, 950, 925, 850, 700, 500
Vertical velocity(W) 850,700,500
Wind (FF, U, V) 10m, 1000, 950, 925, 850, 700,5 00
We have developed one statistical model statistical model to predict the occurrence of precipitation for 6 hours period. List of potential predictors used:
PRECIP, NT, HU1000, HU0950, HU0925, HU0850, HU0700, HU0500, FF1000, FF0950, FF0925, FF0850, FF0700, FF0500, TW1000, TW0950, TW0925, TW0850, TW0700, TW0500, Z1070, Z1050, Z8570, T1070, T1050, T8570, TA0700, TA0500, PMER
• The graphics shows the predictors selected for the MOS model and the Percent Correct for the developmental sample and for the direct model.
• The Percent Correct skill shown that MOS is superior to Direct Model Output, for all the time ranges and for all the stations. MOS provide a good guidance for the short range forecasting.

12 th ALADIN WORKSHOP Medulin, Croatia, 3–6 June 2002
21
Frequence of the predictors selected for the precipitations model
Percent correct for Direct Model Output and MOS
Percent Correct for the Direct ALADIN Model
Percent Correct for the MOS Model
Acknowledgements This work was supported by the research fund for science promotion from Météo France. The author is grateful to the Météo France/DPrevi/Compas/AS, especially to Serge Farges and Frederic Atger for giving practical support and for helpful discussion. References Arrit, R. W. and Frank W. M. , 1985: Experiments in Probability of Precipitation Amount Forecasting Using Model Output Statistics Mon. Wea. Rev, Vol. 113, 1837 - 1851 Bermowitz, R. J., 1974: An Application of Model Output Statistics to Forecasting Quantitative Precipitation Mon. Wea. Rev.Vol. 103, 149 - 153 Bocchieri, J. R. 1979: A New Operational System for Forecasting Precipitation Type Mon. Wea. Rev Vol. 107, 637 – 649 Colley, W., Lohnes, P., 1988: Multivariate Data Analysis, JohnWiley &Sons, Inc.

12 th ALADIN WORKSHOP Medulin, Croatia, 3–6 June 2002
22
CAPE from ALADIN and Radio Sounding Data
Tomislav Kovačić Meteorological and Hydrological Service, Grič 3, 10000 Zagreb, Croatia
Comparisons of convective potential energy (CAPE) calculated from radio sounding data from Zagreb-Maksimir with CAPE calculated from initial and prognostic pseudotemps, artificial soundings derived from ALADIN’s fields, for Zagreb (Fig 1) give correlation coefficients within 0.48 and 0.57. Explained variance, R2, by linear regression equation with CAPE from soundings as dependent variable and CAPE from pseudotemps as independent variable is less or equal to 34%. When surface values of pressure, temperature and specific humidity of pseudotemps were replaced with measured values for the same term, a very good agreement between CAPE calculated from pseudotemps and that from radio soundings is achieved (Fig. 2). Explained variance by regression equation is between 95%, at the initial moment of the model’s run, and 80%, for 48 hour forecast. This means that from pseudotemps very good prognostic values for CAPE can be achieved, even 48 hours in advance, provided that we get better prediction of surface data.
Regression95% confid.
CAPE001 vs. CAPECAPE = 498,45 + ,20173 * CAPE001
Correlation: r = ,53361
CAPE001
CAP
E
0
400
800
1200
1600
2000
2400
2800
3200
-1000 0 1000 2000 3000 4000 5000 6000 7000
Figure 1 Scatterplot for CAPE from radiosoundings in Zagreb-Maksimir and CAPE from pseudotemps from initial fields of ALADIN.

12 th ALADIN WORKSHOP Medulin, Croatia, 3–6 June 2002
23
Regression95% confid.
CAPE001 vs. CAPECAPE = 125,82 + ,99047 * CAPE001
Correlation: r = ,97737
CAPE001
CA
PE
0
400
800
1200
1600
2000
2400
2800
3200
-200 400 1000 1600 2200 2800 3400
Figure 2 Same as Figure 1, only surface values in pseudotemps replaced with measured values.

12 th ALADIN WORKSHOP Medulin, Croatia, 3–6 June 2002
24
The Croatian Operational ALADIN Suite
Martina Tudor Meteorological and Hydrological Service , Grič 3, 10000 Zagreb, Croatia
Stjepan Ivatek-Šahdan Meteorological and Hydrological Service , Grič 3, 10000 Zagreb, Croatia
In the Croatian meteorological service ALADIN is operationally run twice per day, for 00 and 12 UTC. Coupling files are retrieved from Vienna to the lahor machine. The lancelot and the integration are done on the new SGI machine. The post-processing is done in-line. After the integration is done on 10 processors the dynamical adaptation of the surface wind field is done on the 5 domains, 1 processor for each domain. The historical output files are retrieved from the new SGI to one linux PC where the visualisation of numerous meteorological fields is done and the pseudo-temps are produced on the other linux PC that is also used for the temporary storage of the coupling files. The products are available on the Intranet.
5 5,5 6 6,5 7UTC
coupling file downloadedend of ee927e001 integrationoutput historical filesDADA e001 integrationoutput DADA files
Figure 1 The time schedule of the Croatian operational ALADIN suite for the 00 UTC run.

12 th ALADIN WORKSHOP Medulin, Croatia, 3–6 June 2002
25
Figure 2 The mean sea level pressure (red isolines) and surface wind speed (shaded) and direction (vector).

12 th ALADIN WORKSHOP Medulin, Croatia, 3–6 June 2002
26
Session 2 DYNAMICS AND COUPLING
1. Jozef Vivoda: Present Status of NH Dynamics 2. Christopher Smith: Improving the Accuracy of Nonhydrostatic ALADIN
over Orography 3. Jozef Vivoda: Predictor/Corrector scheme for NH ALADIN 4. Piet Termonia: Interpolation of Coupling Data: a Perturbative Approach

12 th ALADIN WORKSHOP Medulin, Croatia, 3–6 June 2002
27
Present Status of NH Dynamics
Jozef Vivoda Slovak Hydrometeorological Institute, Jeseninova 17, 80000 Bratislava, Slovakia
NH dynamics has been significantly reformulated during last year. Main reason of development is need to prepare model dynamics for operational exploitation in the near future as model resolution will become 10 km and less. The final scheme shall be stable, robust, efficient and accurate. In my presentation, I will briefly summarize dynamics of non-hydrostatic model ALADIN first. Then I'll give overview about the main directions of NH ALADIN development and current status of their solution. Development has been (and is) carried out in three general areas: 1. change of model vertical discretization. Pressure gradient force discretization was reviewed and significant improvements were implemented (so called happy cancellation and removal of detrimental vertical interpolation of pressure departure). Three-dimensional divergence discretization was changed. New discretization is mass conserving, while old discretization was volume conserving. 2. development of stable time marching scheme with semi-lagrangian advection treatment. Three time level (leap-frog) scheme and also two-time level predictor-corrector scheme are in parallel development. Strong sensitivity of scheme stability to the choice of prognostic variable has been found and a set of new prognostic variables was proposed. Stability of model dynamics has been significantly improved and model can be run with Courant number bigger than one. 3. testing and validation of NH dynamics in high resolution. Idealized tests over real mountains were performed (for example SCANIA test and many others).

12 th ALADIN WORKSHOP Medulin, Croatia, 3–6 June 2002
28
Improving the Accuracy of Nonhydrostatic ALADIN over Orography
Christopher Smith
Czech Hydrometeorological Institute, Na Sabatze 17, 143 06 Prague 4, Czech Republic Christopher [email protected]
Recent research and development work on the nonhydrostatic version of ALADIN has, broadly speaking, addressed two concerns with the numerics: stability and accuracy. Other presentations at this workshop address the issue of stability, while here we shall consider accuracy. Problems with accuracy are most noticeable over orography. In this presentation we shall discuss two sources for this inaccuracy. The first concerns the finite difference discretisation of vertical derivative terms. A volume conserving discretisation has been used for such terms. However, volume is not a conserved quantity of compressible flow. Consequently we may expect such a discretisation to have a detrimental impact in a fully compressible model, such as nonhydrostatic ALADIN. An alternative discretisation is presented, which provides improved results in idealised tests with low amplitude orography. Unfortunately, even after the above changes to the vertical discretisation, nonhydrostatic ALADIN suffers from significant errors in idealised tests with larger amplitude orography. These errors are strongly associated with the adaptation of the vertical coordinate to the orography. This second, and perhaps more serious source of inaccuracy is related to the choice of prognostic variable for vertical motion. Currently, vertical divergence is used as this prognostic variable, rather than vertical wind. Our claim is that this choice for prognostic variable creates a severe problem for the accurate representation of a free-slip lower boundary condition. It would seem that, in order for the free-slip boundary condition to be satisfied, an integral constraint on vertical divergence must be satisfied by the model discretisation. By using vertical wind as prognostic variable the problem is very much simplified. Simple over-writing of vertical wind data on the lower boundary is sufficient, in this case, to allow much improved accuracy in idealised tests with moderate amplitude orography. We do not claim that the boundary condition problem for vertical divergence is insurmountable. It is certainly not trivial but there are additional reasons why vertical divergence is an unsuitable choice as prognostic variable. The final part of this presentation is a short discussion of a further theoretical reason why vertical divergence ought to be abandoned as a prognostic variable. This is due to the fact that vertical summations are present in the discretised prognostic equation for vertical divergence. This results in a numerical scheme, whose stencil may potentially have a significant downwind bias. Downwind finite difference stencils are well known as a source of instability, when applied to advection-dominated processes. A simple numerical test demonstrates instability in this numerical scheme, when it is applied to linear advection in a rotating two-dimensional flow. It is argued that a numerical scheme, which is unstable when applied to linear advection, ought not to be applied to a nonlinear advection equation. An upwinded advection scheme could be used to avoid this problem. Numerical experiments with candidate schemes, in the context of linear advection, have not proved promising. A simpler solution to the problem is to avoid the use of vertical divergence as a prognostic quantity.

12 th ALADIN WORKSHOP Medulin, Croatia, 3–6 June 2002
29
Predictor/Corrector scheme for NH ALADIN
Jozef Vivoda Slovak Hydrometeorological Institute, Jeseninova 17, 80000 Bratislava, Slovakia
Stable, accurate and efficient time marching scheme is of prime interest when atmospheric model is being developed. Two-time level semi-implicit semi-lagrangian scheme appeared to be a good candidate for NH version of spectral model ALADIN, since it is the most efficient scheme for hydrostatic models used nowadays. Unfortunately, the scheme was very unstable. The acoustic modes were not controlled by semi-implicit algorithm. Additional iterative implicit treatment of three-dimensional divergence does not pacify all sources of instability. Therefore, iterative predictor/corrector method was implemented to treat all model terms implicitly. In my presentation I will give short introduction into problematic of two-time level scheme and semi-implicit control of fast model modes with particular attention to spectral model ALADIN. Predictor/Corrector scheme will be shortly described. The scheme appeared not to be effective since three iterations (three correctors) have to be performed to be stable and robust. Advantages and disadvantages of the scheme will be discussed. Methods how to improve scheme efficiency will be shown.

12 th ALADIN WORKSHOP Medulin, Croatia, 3–6 June 2002
30
Interpolation of Coupling Data: a Perturbative Approach
Piet Termonia Royal Meteorological Institute of Belgium, Ringlaan 3, 1180 Brussels, Belgium
[email protected] We address the following problem. From a given time evolution of a dynamical field F(x,t), depending on space x and time t, we only have the field F(x,t1) at time t1 and the field F(x,t2) at time t2 with t1 < t2. We derive a general formula for the interpolation of such a field F for each time t in the interval [t1, t2] while only using the fields and their time derivatives in t1 and t2. We only consider formulae that are spatially local, i.e. interpolated fields will only depend on the values of the fields in the same space coordinate.
Interpolation is commonly done linearly (we don’ţ consider quadratic interpolation):
).()()( 2
12
11
12
2 tFtt
tttF
tt
tttF
−−
+−−
= (1)
This can be generalized to an expansion in the following way:
[ ])t('F)t('Ftt
)tt)(tt()t(Ftttt)t(F
tttt)t(F 12
12
212
12
11
12
2 −−
−−+
−−
+−−
=
+ [ ] ...)t("F)tt()t("F)tt(tt
)tt)(tt(+−−−
−−−
112212
21
21
(2)
This series can be truncated as follows: Let us denote the nth-order time derivative of the field
F(t) as )()( tF n . The expansion is truncated if we put )()( tF n =0 for all t and for all n ≥ N for a
chosen N > 1. In fact, this implies that )()1( tF N − is constant in the interval [ ]21 ,tt . This constant
can actually be computed, )/())()(( 121)2(
2)2()1( tttFtFF NNN −−= −−− In particular for N = 3 one
gets,
[ ],)t('F)t('Ftt
)tt)(tt()t(Ftttt)t(F
tttt)t(F 12
12
212
12
11
12
2
21
−−
−−+
−−
+−−
= (3)
where the last term contains a sort of acceleration 2
21
at .
The advantage of the expansion (2) is that it allows making estimates of the truncation error, e.g.
)t(F)t(F
)tt))(t('F)t('F(eT21
1212
41
+−−
= , (4)
when truncating from accelerated correction to linear interpolation. This error Te should be
large for meteorological situations where the linear interpolation turns out to be deficient (e.g.

12 th ALADIN WORKSHOP Medulin, Croatia, 3–6 June 2002
31
rapidly propagating storms). This method can be interpreted as modifying the behaviour of the
fields by applying little perturbations at 1t and 2t . We performed tests with ALADIN Belgium,
using the coupling data for ALADIN Belgium only. The tendencies were computed by a one-time-step integration of the model. Improvements were found with the acceleration correction for the Xmas storm. The result of the linear interpolation is on the left and the acceleration is on the right.
We have also calculated the maximum of Te for the mean-sea-level pressure over the domain
ALADIN Belgium for December 1999: One notices a clear peak during the passage
of the storm. If this peak had been computed from the ARPEGE output one could have decided to send coupling data each hour instead of each three hours for the time interval when the storm passed.

12 th ALADIN WORKSHOP Medulin, Croatia, 3–6 June 2002
32
Session 3 PHYSICS
1. Jean-Marcel Piriou: Clouds and Turbulence: Present Developments and
Perspectives 2. Martin Gera: Turbulent Kinetic Energy 3. André Simon: Relationships between the Parametrization of Turbulent
Fluxes and Numerical Prediction of Rapid Cyclogenesis Event of 20 December 1998
4. Alexander Kann and Harald Seidl: Investigation of Nocturnal Boundary
Layer Structure in ALADIN 3D and 1D versions 5. Cornel Soci, Claude Fischer and Andros Horanyi: Moist Physical
Parameterization in the Mesoscale Gradient Computation
6. Erice Bazile: An Overview of the Weaknesses of the Convection Scheme and the Link with the Prognostic Cloud Water
7. Luc Gérard: Coherent Treatment of Deep Convection, Prognostic Cloud Water and Cloud Fractions at High Resolutions in ALADIN
8. Thomas Haiden and Stefan Greilberger: Experiments with a prognostic
convection scheme

12 th ALADIN WORKSHOP Medulin, Croatia, 3–6 June 2002
33
Clouds and Turbulence: Present Developments and Perspectives
Jean-Marcel Piriou
CNRM/Météo-France, 42 av Coriolis, 31057 Toulouse Cedex, France [email protected]
Convective clouds: The resolution of both global numerical weather prediction models and limited area models is today between 7 and 50 km. With the increase of our computing power this resolution will become finer and finer in the next years. In this context the quasi-equilibrium hypothesis underlying many sub-grid scale convection schemes becomes questionable. This presentation with thus raise some questions about designing convection schemes, e.g.: the correlation between convection intensity and moisture convergence depends on space and time scale considered, and does not give any information about causality; may some of the triggering functions or closure assumptions, based on wave CISK, WHISHE or CAPE become more questionable as going to finer and finer meshs? What may be the relative importance of (i) closure assumptions (ii) triggering functions (iii) cloud scheme (iv) convective drag with respect to large scale convective feedbacks? To which extent active and passive convective regimes might be a new interesting paradigm to investigate observed fields and develop convection schemes? Special attention may be paid to hysteresis due to conversion between potential and kinetic energies, i.e. to the role of a prognostic equation for cloudy turbulent kinetic energy. Stratocumulus clouds: Stratocumulus clouds are both thin and turbulent. Many operational NWP models have considerable difficulty in predicting stratocumulus clouds even in steady state mode, since this state depends on a fine representation of the feedbacks between radiative cooling and top of PBL entrainment. Some results in the EUROCS FIRE I Single Column Modelling context will be presented, as well as some 3D first results.

12 th ALADIN WORKSHOP Medulin, Croatia, 3–6 June 2002
34
Turbulent Kinetic Energy
Martin Gera
Royal Meteorological Institute of Belgium, Circulaire 3, 1180 Bruxelles, Belgium [email protected]
The resolution of forecast models cannot describe directly eddies smaller than grid size. Horizontal resolution is too small to represent correctly turbulent motions, but vertical resolution can resolve these processes with help of parameterizations. Some kinds of processes must be parameterized for describing interactions beyond the model "visibility" at this case. From experiences is apparent that the resolution of the model and atmospheric stability are factors, which gain the form of parameterizations. The goal is to find a self-determinating turbulence scheme. The energy spectrum of turbulence is not homogeneous at reality. Nevertheless, we often accept that turbulence is a random process with independence on position, what is a definition of homogeneous turbulent process. Away from boundaries and from a stable stratified atmosphere this assumptions work correctly. Resolved eddies are isotropic and small energetic eddies can cascade until viscosity dissipation. In other cases anisotropy is assumed. Near the wall, the size of energetic eddies becomes proportional to the distance from this barrier. Increasing the resolution, mainly in the vertical direction, creates a problem with grid anisotropy and does not describe the situation correctly. The showed difficulties can be partly prevented by choosing the right variables at convenient equations in numerical model. Explicit use of the turbulent kinetic energy (TKE) into equations can touch problems with energy transfer and interrelation between subgrid and resolved scale. This improve the knowledge of developing processes and enables us to put new features and relationships among diagnostic and prognostic variables. Understanding the energy transfer's relationships at spectral space can yields new formulation of parameterization schemes. It allows us to examine this equation as a function of wave numbers or eddy size. It helps us determine a physical process, which generate turbulence and it allows us to find expressions for parameterized variables. For economy and computer ability of computation we retain at full form equation for energy only. TKE remains a prognostic variable, while for other statistical moments (covariances) simplications are used. The main idea is expressed in these formulas by dependence on TKE. In this manner the properties of turbulence for these moments are retain. This feature allows us dispose exchange coefficients with "history" of turbulence evolution. TKE equation employs virtual potential temperature. If we use potential temperature as thermodynamic variable, it allows us degrade the number of equations. However model ALADIN works with potential temperature and humidity fluxes. These fluxes can be expressed by conversion terms. It is apparent, that we need initial value of TKE for starting a computation of TKE equation. We have no possibility without additional assumption to compute subgrid values in the model. Negotiable is used similar algorithms for initialization as for a next computation.
The eddy length parameters Lk, L∈ are unknown in our case. Spectral characteristic for their determination is used. We respect, that spectra of energy is changed rapidly nearest the wall. These assumptions are sufficient for initialization of our statistical moments. There is nothing to inhibit us to compute nonlinear TKE equation. Numerically stable scheme is desirable at this time.

12 th ALADIN WORKSHOP Medulin, Croatia, 3–6 June 2002
35
Relationships between the Parametrization of Turbulent Fluxes and Numerical Prediction of Rapid Cyclogenesis Event of
20 December 1998
André Simon Slovak Hydrometeorological Institute, Jeseniova 17, 833 15 Bratislava, Slovakia
The case of rapid cyclogenesis, which occurred in northern Atlantic in December 1998, has initiated a series of studies and improvements in parametrization of turbulent fluxes in the ARPEGE / ALADIN models. In the present time (March 2002), the tests were redone on ARPEGE model with the CYCORA-ter modifications (Geleyn, 2001). The study of the 20 December 1998 case is concentrated on the role of the Richardson number limitation for heat transport in forecasting cyclogenesis. This limitation is in the present code controlled by the parameter USURID (smaller values enable more turbulent transport of heat in stable PBL and should support cyclogenesis, higher values of this parameter allow higher values of Richardson number and keep better the inversions). Experiments continued in the way of research done by Bellus (2000) to find the most sensitive areas and the period of biggest influence of the currently used scheme of vertical diffusion. Comparisons between the runs with USURID values 0.042 (proposed to be operational by J.F.Geleyn in February 2002) and 0.14 (which destroys the cyclone in the 84 hour forecast valid to 20 December 1998) indicated, that the main impact can be observed within the first 21 hours of integration, after that is the effect of Richardson number limitation almost negligible. On the time evolution of the cyclone (Fig.1) we can see, that the forecasts of mean sea level pressure in the two runs using USURID 0.042 and 0.14 are during the time of impact still close and the differences between them increase later (after 39 hours of integration). It means that the influence of vertical transport of heat is indirect – it appears, when the cyclone arrives to the area of highest sensibility on vertical diffusion. Differences in static stability between 700 and 925 hPa levels for the two runs are considerable in the area eastward from Newfoundland (Fig. 2). Decrease of the (usually very high) static stability in this region via increasing the vertical exchange of heat in PBL supports the vertical movements connected with the cyclone. This support seems to be very important in the decaying period of the low (up to66 hours of computation), keeping the low level baroclinic zone. The reinforcement of the cyclone during the last 18 hours of computation is most probably a consequence of baroclinic instability created by interaction of the shallow low at the surface with the upper air field represented by significant potential vorticity anomaly. This development is not possible in the run with USURID = 0.14, where the cyclonic structure at the surface is missing before the drop of the pressure began (though the difference between the two runs in mean sea level pressure after 66 hour of computation is only about 2.5 hPa !). Results of the 20 December 1998 case study show that further investigation in the parametrization should concentrate on more realistic description of PBL processes in the areas with unstable conditions near surface and very high static stability aloft. Improvements of the present scheme of vertical diffusion can be done also by using adjusted shallow convection parametrization in the Richardson number computation. It seems, that successful forecast of rapid cyclogenesis requires very high precision both in data assimilation and physical parametrization. Nevertheless the role of the forecaster remains in the diagnostics and correct interpretation of the NWP results (with help of parameters like potential vorticity, potential temperature etc. and their vertical profiles).

12 th ALADIN WORKSHOP Medulin, Croatia, 3–6 June 2002
36
Figure 1 Variation of the mean sea level pressure in the center of the predicted cyclone with parameter USURID = 0.042 (solid line) and USURID = 0.14 (dashed line). The 84 hour forecasts were based on ECMWF analysis from 16 December 1998 12 UTC and converted to T298 configuration with 37 levels.
Figure 2 Differences in the index of static stability between the two runs using USURID = 0.14 and USURID = 0.042 after 24 hours of integration. The index is here computed simply as a difference in potential temperature between the 700 and 925 hPa level (in °K). The region of the highest sensibility on turbulent transport of heat is situated in the northwestern part of Atlantic ocean (contours of the continent are marked with thick green line).
The values of the index are mostly higher for USURID = 0.14, which means increased mean static stability between the 700 and 925 hPa level. The “core” is marked by red, dashed isolines.
References Bellus, M., 2000: Vertical turbulent transport parametrization (the vertical profile for USURID parameter), Report on stay, Météo-France, Toulouse Geleyn J.-F., 2001: A summary of the latest changes in the parametrization of turbulent fluxes and PBL processes, ALADIN Newsletter nr.20, Météo-France/CNRM/GMAP

12 th ALADIN WORKSHOP Medulin, Croatia, 3–6 June 2002
37
Investigation of Nocturnal Boundary Layer Structure in ALADIN 3D and 1D versions
Alexander Kann
Central Institute for Meteorology and Geodynamics (ZAMG), Hohe Warte 38, 1190 Vienna, Austria [email protected]
Harald Seidl Central Institute for Meteorology and Geodynamics (ZAMG), Hohe Warte 38, 1190 Vienna, Austria
The planetary boundary layer still belongs to the most erroneous regions of many limited area models like ALADIN. Using ALADIN/VIENNA and SCM (the single column version of ALADIN) we focus in our work on night-time boundary layer (NBL) evolution in Northeastern Austria. The model is able to simulate phenomena like the low-level jet reasonably well, even for forecast ranges up to 48 hours. On the other hand we present weak gradient cases with NBL inversions too much confined to the ground and too dry. Turbulent fluxes of momentum, latent and sensible heat are simulated insufficiently by the model. Simple efforts for improvements include the incorporation of an additional model level near the surface. We intend to make use of a laminary layer on top of the ground in order to improve the turbulent fluxes of heat and moisture. A more sophisticated approach involving turbulent kinetic energy (TKE) will be shortly discussed, as far as preliminary experiences are available at the time.

12 th ALADIN WORKSHOP Medulin, Croatia, 3–6 June 2002
38
Moist Physical Parameterization in the Mesoscale Gradient Computation
Cornel Soci
National Institute of Meteorology and Hydrology, 97 sos Bucuresti-Ploiesti, 71552 Bucharest, Romania [email protected]
Claude Fischer Météo-France/CNRM, 42 av Coriolis, 31057 Toulouse Cedex, France
Andros Horanyi Hungarian Meteorological Service, Kitaibel Pal u 1, 1024 Budapest, Hungary
The development of the adjoint model is primarily oriented through data assimilation and predictability applications. However, since it is able to relate the origin of a numerical forecast failure to the errors in the initial data, it has been used for sensitivity experiments. The latter approach was proven to be successful when using a low resolution model for studying phenomena linked to baroclinic instability. For a high resolution limited-area model, the moist processes which are strongly non-linear start playing a crucial role. This may create instability into a linear model. Hence the need of improving the physical description of the atmospheric processes in the adjoint model. In this paper, the gradients of a forecast error cost function with respect to the initial conditions are investigated. The norm utilized in this study is the so-called 'dry' and 'moist' total energy. The norm is called 'dry' when there is no term in it involving specific humidity. The gradients were computed using a package of simplified and regularized physical parameterization including vertical diffusion, gravity wave drag, large scale precipitation, deep convection and radiation. This package was developed for the global model ARPEGE with the aim of being used in four-dimensional variational data assimilation. The results have shown that the adjoint of a high resolution model including a description of the moist processes became instable. This instability was triggered especially by the large scale precipitation scheme. After investigations the problem was cured by modifying the shape and shift of the regularization function. It is also shown that the solution of the adjoint model is very sensitive to the trajectory. Starting from the modified initial conditions sensitivity experiments for selected cases were performed. The modifications were performed for all initial model state fields by adding a fraction of the gradients. The goal of using such a diagnostic method experiments was to investigate the failure of 6 hours precipitation forecast. The results have shown that the precipitation forecast can be improved if the failure is dominated by the fastest growing structures in the initial data. Also, there were results with neutral impact. For these the misforecast may come not only from initial conditions but from the lateral boundary conditions.

12 th ALADIN WORKSHOP Medulin, Croatia, 3–6 June 2002
39
An Overview of the Weaknesses of the Convection Scheme and the Link with the Prognostic Cloud Water
Erice Bazile
Météo-France, 42 av Coriolis, 31057 Toulouse Cedex, France [email protected]
The convection parameterization used in ARPEGE/ALADIN is based on the Bougeault proposal (1985). Nevertheless, several improvements in the scheme have been introduced over the past few years: rainfall evaporation, introduction of a horizontal pressure gradient between clouds and environment, downdraft...However, some reasonable hypothesis for a large grid scale and long time step becomes doubtful for a fine mesh size: convective cloud has a small size in the grid box and the precipitation falls in one time step. In addition, the scheme has no memory on the convective activity, no prognostic cloud water and a trigger mechanism based on the moisture convergence. For all that, the scheme works correctly in general for the current horizontal resolution, but for 4-5 km? The presentation will address first: a short description of some strange physical response of the scheme. Secondly, the last results with the prognostic cloud water will be presented and the connection with the convection scheme will be pointed out.

12 th ALADIN WORKSHOP Medulin, Croatia, 3–6 June 2002
40
Coherent Treatment of Deep Convection, Prognostic Cloud Water and Cloud Fractions at High Resolutions in ALADIN
Luc Gérard
Royal Meteorological Institute of Belgium, Circulaire 3, 1180 Bruxelles, Belgium [email protected]
The crude diagnostic microphysics is one of the saddening weaknesses of the present implementation of ALADIN. But introducing a prognostic representation of cloud water requires revisiting a series of hypotheses about the behaviour of the condensates, which are deeply anchored at several places in the current parameterisations. A pertinent choice of characteristics has to be done when building a more elaborate micro-physical package, in the specific context of the high resolution local area modelling. This includes:
• The choice of the prognostic variables: at least separate cloud ice and cloud liquid water, as their mechanical, hydrological and radiative behaviour are quite different. Precipitation water has also to be addressed.
• Realistic micro-physics treatment: taking into account most important processes (auto-conversion of condensate to precipitation, different kinds of aggregation processes, evaporation, sublimation, melting/freezing of precipitation, Bergeron effect...) and the effects of large scale as well as subgrid sources and sinks of condensate. Also, let's avoid building complex formulations based on mean profiles and sacrificing the richness and beauty of the subgrid variety to concrete unrealistic mathematical rigour.
• Openness to more specific parameterisations as stratiform clouds, BL clouds and diurnal cycles.
• Energetic consistency: the previous treatment through equivalent latent heats was explicitly based on the immediate transfer of all condensate to the surface. A completely new treatment is required.
• Transport of condensates: the problem of the advection of discontinuous variables as condensates by the mean wind still represents a big challenge.
• Interaction with the turbulent and convection schemes: the possible transport of condensates by both schemes, but also the impact of the condensate on them, e.g. the estimation of the Richardson number in the turbulent scheme, the explicit treatment of the condensate within the deep convection scheme.
• Taking into account specific processes as moist downdraughts and Cloud Top Evaporative Instability. A neat treatment of the condensate associated to deep convection is of particular importance in high resolution models, where the convective updraughts may occupy a significant fraction of the grid mesh; though we did not see up to now any satisfying proposition for this case. We propose here an integrated approach which emerged from our reflection about the necessary adaptations that would be required in the deep convection scheme before envisaging seriously any increase in resolution. Our scheme uses some benefits of our previous work on prognostic updraught velocity and mesh fraction, and separates completely the updraught from a new downdraught/CTEI approach. If a cloud water package is present, the updraught routine should have access to a grid-box mean cloud ice qi , cloud water qw and cloudy fraction a. Intensive cloud water contents is then la = (qi + qw)/a
• Mixed phase partition for cloud condensate can be approached by a linear interpolation between two extreme temperatures, for instance T00=-40°C and T0=-10°C. This partition is used for computing local latent heats.

12 th ALADIN WORKSHOP Medulin, Croatia, 3–6 June 2002
41
• The construction of the updraught profile: - Condensate production follows from the condensation along the saturated adiabat. The water
budget is now balanced, and the Newton loops produce qu, Tu and lu. - Mixing of environmental air also brings a share of la. The updraught environment should be
distinguished from the large scale mean, and we discuss some ways to address this.
• The updraught vertical velocity follows a vertical motion equation, where the inertial absolute acceleration balances the buoyancy force, and the dissipative terms which are proportional to the
square of the relative velocity with respect to the draught environment (ωu - ωe)2. The hypothesis that
ωe ~ 0 simplifies the treatment.
• The updraught mesh fraction profile 1uσ is obtained by writing local mass flux continuity. The
detrainment process is parted into two contributions:
- A constant detrainment rate δ over most of the equivalent draught ascent: the budget equation
yields the tendency of luσ .
- Organized detrainment starts at the level where the fluid begins to decelerate. We diagnose this
level by the conjunction of a decrease of the absolute value of ωu and of the buoyancy force. From
there, luσ is kept constant up to the top of the updraught, and the detrainment calculated
accordingly. Effective detrainment rates can be the estimated, for the final budgets, as well as to feed the micro-physical scheme.
• Some could argue that this system does not seem to use the large scale closure: this is not true, because the absolute draught velocity is the sum of the grid box mean vertical velocity - resulting
from large scale convergence - and a departure from it ω’u
The conventional idea - mentioned in Kuo [1965]'s paper - that all the moisture convergence would be funnelled into the updraught and pass like a ghost through the air present within the grid-box could advantageously undergo some facelift.
• The layer budget can now provide pseudo-subsidence diffusion fluxes for both moisture and enthalpy, as we no longer consider precipitation fluxes at this stage.
• The detrained condensate acts as a direct source in the micro-physical scheme. On the other hand the rest of the updraught condensate deserves a separate passing through the micro-physical scheme, as it represents more localised moisture and condensate, which could pass over the thresholds of the auto-conversion to precipitation well before the mean grid-box value. Also the updraught mesh fraction is necessarily completely overcast. The separately treated convective and resolved precipitation can be recombined afterwards, as well as the cloudiness and the remaining cloud water - the latter forming the prognostic condensate fields advected by the mean large scale wind.
• The downdraught calculation also deserves wide revisiting, a good occasion to widen its scope to processes like Cloud Top Evaporative Instability. For this, it becomes important to consider that the downdraught is not completely saturated, and contains a core of air entrained from above. The source of moisture for the downdraught is now both precipitation fluxes and the cloud water. Some preliminary results might also be presented.

12 th ALADIN WORKSHOP Medulin, Croatia, 3–6 June 2002
42
Experiments with a prognostic convection scheme
Thomas Haiden Central Institute for Meteorology and Geodynamics, Hohe Warte 38, A-1190, Vienna, Austria
Stefan Greilberger Central Institute for Meteorology and Geodynamics, Hohe Warte 38, A-1190, Vienna, Austria
A well-known problem in many NWP models is the timing of convective rainfall related to the diurnal cycle over land. Part of the problem comes from the diagnostic character of most convective parameterization schemes which do not explicitly take into account the build-up stage of convective clouds prior to precipitation formation. Earlier case studies of locally triggered convection over the Eastern Alps have shown that the simulated convective rainfall in ALADIN preceded the observed one by up to several hours. Based on an approach proposed by Chen and Bougeault, a prognostic version of the ALADIN convection scheme was developed by Luc Gerard. Additional prognostic variables used in his scheme, both for up- and downdrafts, are the convective vertical velocity profile, and the convectively active mesh fraction which is assumed constant in the vertical. Here we report on experiments on a case of locally triggered Alpine convection in which the performance of the new scheme is compared to the existing one, and to radar observations. Specifically, it is investigated how much of the timing problem can be solved b y using the prognostic approach.

12 th ALADIN WORKSHOP Medulin, Croatia, 3–6 June 2002
43
Session 4 VERIFICATION
1. Zuzana Huthova, Martin Janoušek and Richard Mladek: Objective
Verifications at CHMI in the Last Two Years 2. Siham Sbii: Computing Brightness Temperatures in ARPEGE/ALADIN 3. Zoran Vakula: Adriatic Storm Cases 4. Jure Žabkar, Andrej Indihar, Blaž Vrabec, Matic Petek, Dorian Šuc, Ivan
Bratko and Janko Merše: Improving ALADIN’s 2 m Temperature Forecast with Machine Learning

12 th ALADIN WORKSHOP Medulin, Croatia, 3–6 June 2002
44
Objective Verifications at CHMI in the Last Two Years
Zuzana Huthova Czech Hydrometeorological Institute, Na Sabatce 17, 143 06 Prague, Czech Republic
Martin Janoušek Czech Hydrometeorological Institute, Na Sabatce 17, 143 06 Prague, Czech Republic
Richard Mladek Czech Hydrometeorological Institute, Na Sabatce 17, 143 06 Prague, Czech Republic
Most of work at a further development of objective verifications, performed in Prague in the last two years, was aimed at the extension of the VERAL verification program (Janoušek 1999). VERAL consists of three main parts. The inputs to VERAL are Cmafoc files with flags of quality control according to Canari. The first part of VERAL is a preprocessing application of Canari , which calculates departures of the model forecast from the actual observations at the observation point. The second part includes the calculation of biases and scores from results from Canari according to Mandalay. The third part of VERAL is a visualization of results. Recently, the second part of VERAL (Mandalay) was extended in order to compute scores of precipitation (Klarić, Huthova) and to compute verifications in accordance with the Ewglam recommendations (interval quality control, list of stations...). The third part of VERAL (visualisation) starts to be extended to adopt new possibilities allowed by the second part of VERAL (Mladek). A short example from January 2002 shows a comparison of some new and old possibilities of calculating verifications by VERAL for the LACE and Czech territories.

12 th ALADIN WORKSHOP Medulin, Croatia, 3–6 June 2002
45
Computing Brightness Temperatures in ARPEGE/ALADIN:
Siham Sbii Météo-France, 42 av Coriolis, 31057 Toulouse Cedex, France
The vertical sounding observations coming from meteorological satellites contain radiances or brightness temperatures measured over the globe. So using them in numerical weather prediction as a validation tool would be useful especially in physics parametrisation. For this topic, the observations are very few. However, the data coming from satellites contain radiances and/or brightness temperatures which, are not model's parameters. Now, in ARPEGE/ALADIN physics, we can simulate those radiances from thermodynamical and cloudiness parameters predicted by the model, and using the MORCRETTE's scheme of the Radiatif Transfer. Thus, the purpose of this presentation is to explain how to evaluate those parameters, and then to produce simulated images which can be directly compared with observed ones. The observed images are decoded from GRIB data coming from satellite observations.

12 th ALADIN WORKSHOP Medulin, Croatia, 3–6 June 2002
46
Adriatic Storm Cases
Zoran Vakula Meteorological and Hydrological Service, Grič 3, 1000 Zagreb, Croatia
Cases of three very strong ALADIN-overestimated cyclones on the Adriatic Sea were examined. Cyclones were happened last summer, 16-18 June, 19-21 July (Fig. 2) and 4-6 September. Diagnosis of the mechanism of cyclogenesis confirms a theory of lee cyclones. In these cases two cyclones appear on the lee of the Alps, one in Genoa bay and over northern Italy and another on the northern Adriatic. Sometimes these cyclones are connected in one, which travels across southern Adriatic. Behaviour of these cyclogenesis is very similar in different physical packages which are used in ALADIN: pre cycora, cycora, cycora-bis and cycora-ter. Deep cyclones (Fig. 1, left) occurred in all physical packages and differences in MSLP and 10m winds are small. Differences in other parameters also exist, for example in accumulated precipitation forecast, but it can not be concluded that any cycora always gives the most or the least amount. Tests with cutting surface latent heat flux (Fig. 1, right) give a more realistic cyclogenesis, but in these cases problem with underestimated precipitation can occur. Figure 1 Forecasted MSLP fields and 10m winds from 2001-07-20 00UTC run for +18h: with surface latent heat flux (left) and without surface latent heat flux (right)
Figure 2 NOAA satellite
images for 2001-07-20 16:34 UTC:
infra-red, 11.5-12.5 µm (left) and
visible, 0.725-1.1 µm (right)

12 th ALADIN WORKSHOP Medulin, Croatia, 3–6 June 2002
47
Improving ALADIN’s 2 m Temperature Forecast with Machine Learning
Jure Žabkar Faculty of Computer and Information Science, Tržaška cesta 25, 1001 Ljubljana, Slovenia
Andrej Indihar Faculty of Computer and Information Science, Tržaška cesta 25, 1001 Ljubljana, Slovenia
Blaž Vrabec Faculty of Computer and Information Science, Tržaška cesta 25, 1001 Ljubljana, Slovenia
Matic Petek Faculty of Computer and Information Science, Tržaška cesta 25, 1001 Ljubljana, Slovenia
Dorian Šuc Faculty of Computer and Information Science, Tržaška cesta 25, 1001 Ljubljana, Slovenia
Ivan Bratko Faculty of Computer and Information Science, Tržaška cesta 25, 1001 Ljubljana, Slovenia
Janko Merše Environmental Agency of Slovenia, Meteo Office, Vojkova 1b, 1000 Ljubljana, Slovenia
A method of using machine learning for improving ALADIN's 2 m temperature forecasts is described. Regression tree learning is used to build a predictor from learning data. In our study the predicted variable is the 2 m temperature at a given time and place. Our training set that is imported to the learning algorithm is based on data collected over two years (1999, 2000). The data for 2001 was used as a test set. The dataset table consists of examples (1 day = 1 example) and attributes (columns) – one of them being a class value (synop measurement of the 2 m temperature). Several attribute selection algorithms were used, as well as expert opinion. The initial attribute set consists of ALADIN’s predictions (ALADIN LACE pseudotemps for 5 different locations in Slovenia: Portorož, Ljubljana, Maribor, Rateče and Krško), for various meteorological variables at different places, height levels and time, and measured data (several synop station measurements in Slovenia and radiosounding measurements in Ljubljana, Udine and Zagreb) – altogether a few thousand of attributes per day. For purpose of machine learning data had to be reduced by carefully choosing the most informative attributes only. So the initial set was reduced to typically between 5 to 20 attributes. The presented results show a statistically significant improvement of ALADIN’s predictions. The improved predictions are of special interest in cases when ALADIN’s error is large. The results

12 th ALADIN WORKSHOP Medulin, Croatia, 3–6 June 2002
48
are also compared to Kalman-filtered predictions where an improvement is noticed as well. An example of the prediction model (regression tree with concrete values) is also presented.
Table 1: Comparison of accuracy of 2m temperature forecast for noon of the following day at Ljubljana airport (Brnik) – data from year 2001. (Abbreviations used: ME=mean error, MAE=mean absolute error, RMSE=root mean square error)
ALADIN’s forecast
Kalman correction
Decision tree correction
Bagging method correction
ME 1.566 0.121 0.240 0.226 MAE 2.199 1.988 1.767 1.718
RMSE 2.939 2.531 2.335 2.251
0
5
10
15
20
25
30
<-4
-4..-
3
-3..-
2
-2..-
1
-1..0
0..1
1..2
2..3
3..4
4..5
5..6
6..7 >7
Error [°C]
Day
s [%
]
ALADINKalmanDecision treeBagging
Figure 1 Distribution of error of temperature forecast for noon of the following day at Ljubljana airport (Brnik) – data from year 2001

12 th ALADIN WORKSHOP Medulin, Croatia, 3–6 June 2002
49
Session 5 VARIATIONAL DATA ASSIMILATION
1. Claude Ficher, Steluta Alexandru, Loik Berre, Gergely Boloni, Vincet
Guidard, Marian Jurašek, Sándor Kertesz, Wafaa Sadiki and Maria Široka: Variational Algorithms in ALADIN: State of the Art, Future Plans and Hints
2. Gianpaolo Balsamo: A Mesoscale Variational Assimilation for Land Surface
Variables 3. Stjepan Ivatek-Šahdan: Estimation of 2 m Error Statistics 4. Margarida Belo Pereira: Background Error Statistics Estimated Using an
Ensemble Analysis Method

12 th ALADIN WORKSHOP Medulin, Croatia, 3–6 June 2002
50
Variational Algorithms in ALADIN: State of the Art, Future Plans and Hints
Claude Ficher
Météo-France, 42 av Coriolis, 31057 Toulouse Cedex, France [email protected]
Steluta Alexandru
National Institute of Meteorology and Hydrology97 sos Bucuresti-Ploiesti, 71552 Bucharest, Romania [email protected]
Loik Berre
Météo-France, 42 av Coriolis, 31057 Toulouse Cedex, France [email protected]
Gergely Boloni
Hungarian Meteorological Service, Kitabel Pal U. 1, H-1525 Budapest, POB 38 [email protected]
Vincet Guidard
Météo-France, 42 av Coriolis, 31057 Toulouse Cedex, France [email protected]
Marian Jurašek
Slovak Hydrometeorological Institute, Jaseniova 17, 833 15 Bratislava, Slovakia [email protected]
Sándor Kertesz
Hungarian Meteorological Service, Kitabel Pal U. 1, H-1525 Budapest, POB 38 [email protected]
Wafaa Sadiki
Maroc-Météo, CNCRM, Aéroport Casa-Anfa, Casa-Oasis BP 8106, 20200,Casablanca, Maroco [email protected]
Maria Široka
Slovak Hydrometeorological Institute, Jeseniova 17, 833 15 Bratislava, Slovakia [email protected]
The talk will deal with the present and future work on variational tools. An emphasis will be put on 3D-VAR type of applications, trying to give an overview of the scientific knowledge and local implementations so far: the scientific work on 3D-VAR has evolved in the past 3 years from a concentrated study of the background error statistics for a limited area model (W. Sadiki, M. Široka, L. Berre), towards some more intensive construction of a complete assimilation cycle (M. Siroka, G. Boloni). Thus, we do have now a fairly stabilized formulation of the Jb matrix, known as the "lagged-NMC" error statistics, which allow concentrating the analysis on mesoscale features, without analyzing the large scales, imposed by ARPEGE. The choices for the assimilation cycle are not yet fully well understood: for large ALADIN domains, which are directly coupled with ARPEGE, the so-called BlendVar technique (where digital filter blending is performed before the 3D-VAR analysis, the latter followed by a 6 hour forecast) appears now quite stabilized, and was recently used with success for an intensive MAP case study (V. Guidard). However, other solutions are possible, especially the so-called "Moroccan solution"

12 th ALADIN WORKSHOP Medulin, Croatia, 3–6 June 2002
51
where digital blending is basically replaced by a gridpoint relaxation of the analysis towards the ARPEGE data in the coupling zone. For nested ALADIN domains, the possibility of a simple blending by interpolation in spectral space is presently studied by our Hungarian colleagues, and might also be an alternative. We expect that by end of 2002, early 2003, more stable results will show whether a quite general and common solution can be chosen, or whether the cycling will be a matter of local development. No activity so far was really started on the aspects of use of new observations (in the sense of new observation operators). Some tests are performed with new sources of data, that enter the analysis in a conventional format (RH2m - M. Jurašek, pseudo-Temp profiles - V. Guidard), and should be continued in 2002/2003. A potential for using denser aircraft data was also recognized, though more work on the time window of these data is needed (S. Kertesz). From a more organisational point of view, one should recall that thorough discussions took place in Gourdon and in Toulouse to set up the topics and the general frame for assimilation in ALADIN. we will not go in detail through these lists, but a few points can already be stressed: - the "steering groups" defined in Gourdon did not become active so far - some topics which were discussed in Gourdon were re-discussed in Toulouse in December, and the final scientific program for 2002-2004 is probably less ambitious than what Gourdon suggested (only a 4D-VAR in a nutshell with rather 3D-FGAT as an intermediate goal, no developments in the area of VarPack, no precize plans in the area of minimizes, pre-conditioning, no strong weight on gradient or singular vector developments, except "to have it work"). For the future, it is expected that the 4 driving centres (Toulouse, Prague, Budapest, Casablanca) will be able to collaborate equally on the 3 pillars for variational assimilation: the scientific goals, the stabilization of a local 3D-VAR, the maintenance of the code. The time required by a proper installation and for the training of a local team should never be underestimated for those centres who would like to start a home implementation (along with the computational price of the assimilation part). >From the technical point of view, some more serious concern is raised about the maintenance of some of the "exotic" tools: gradient computations, singular vectors, non-hydrostatic TL/AD code. With more and more weight given to the proper validation of the purely assimilation-related tools (screening, minimization, scripts), less and less manpower will be available for these aspects. Additionally, the non-hydrostatic dynamics being presently deeply revisited in the non-linear model, the TL/AD will quickly become obsolete.

12 th ALADIN WORKSHOP Medulin, Croatia, 3–6 June 2002
52
A Mesoscale Variational Assimilation for Land Surface Variables
Gianpaolo Balsamo
Météo-France, 42 av Coriolis, 31057 Toulouse Cedex, France [email protected]
A variational assimilation technique is considered to analyse the soil variables by assimilating 2 m data of temperature and relative humidity. It is consider 2-D (z and t) variational approach, under the assumption of horizontal decoupling of surface processes between grid points. This hypothesis is tested and the influence of neighbour grid points is evaluated. The variational technique keeps count of the full physics of the model and therefore the corrections applied on the control variable are adapted to the current meteorological conditions and the grid point characteristics (texture, vegetation fraction, LAI, ... and the previous soil state). A linearised approach and an application to soil moisture will be presented together with results and perspectives of the work.

12 th ALADIN WORKSHOP Medulin, Croatia, 3–6 June 2002
53
Estimation of 2 m Error Statistics
Stjepan Ivatek-Šahdan Meteorological and Hydrological Service, Grič 3, 10000 Zagreb, Croatia
Results of the work with Francois Bouyssel in the last 2 stays in Meteo-France will be presented. The estimation of background error statistics for 2 m Analyses for CANARI in global model ARPEGE was made. New correlation function was used for background error correlations.
Figure 1 Coefficients of correlation for 2 m temperature: dependency to distance between points for different domains for June 2001 (dashed line) and for different correlation functions (full lines) Impact of new statistic on 2 m Temperature and Relative Humidity will be present.

12 th ALADIN WORKSHOP Medulin, Croatia, 3–6 June 2002
54
Background Error Statistics Estimated Using an Ensemble Analysis Method
Margarida Belo Pereira
Portugal Meteorological Institute, Rua C ao Aeroporto, 1749-077 Lisbon, Portugal [email protected]
The background error covariance of the background (or first guess) errors is on of the most important aspects of any meteorological data assimilation system. In the present work the background error statistics are estimated by the Analysis Ensemble Method. In this method an ensemble of independent analysis experiments is performed. For each experiment (member) and for each analysis cycle all observations are perturbed adding an independent random number, which has a Gaussian distribution with mean zero and variance equal to the prescribed variance of observation error. These perturbations will create a perturbed analysis for each member. The differences between the perturbed analyses of different members are a measure of the uncertainties in the analysis. Afterwards, a 6h integration of the numerical model is performed, using the perturbed analysis. So, in this way the uncertainties in the analysis fields are propagated to the 6h forecast and consequently to the next analysis cycle, in the form of uncertainties in the background. After a few days of assimilation, the statistics of the differences between background fields for pairs of members of the ensemble equilibrate and it is assumed that the differences between the 6h forecasts of independent members of the ensemble represent the background errors. The ensemble consists of 10 31-level 3D-var analysis experiments for the period of 1-30 May 2001. A study was carried out in order to compare the analysis and the forecast error statistics, as well as the impact of the analysis on the next short range forecasts. The results show that, on average, most of the variance of the background errors for mean sea level pressure (mslp) comes from planetary and synoptic scales (for wavenumbers smaller than 14). Moreover, the analysis at 12UTC is able to reduce significantly the background errors of mslp, mainly in the planetary scales. The errors of mslp and temperature in the 6h forecast valid at 18UTC are smaller than the errors in the 12h forecast valid at same hour. This result is probably due to the reduction of the uncertainties in mslp caused by the 12UTC analysis. In the middle and upper troposphere the analysis of temperature contributes also for this result. However, for specific humidity, in low troposphere, the uncertainties in the 12h forecast valid at 18UTC are larger than in the 6h forecast valid at same time. This result means that contrarily to the case of temperature, the reduction on the mslp uncertainties produced by the analysis is insufficient to create a positive impact in the 6h forecast valid at 18UTC for specific humidity. Possibly, this can be explained by the more complex coupling between specific humidity and mslp, comparing with the coupling between temperature and mslp. Moreover, some connections between the background error structures and the synoptic situations in the background will be illustrated.