12% 10% 14% 9% ECCP Exercises - vscht.cztresen.vscht.cz/kot/english/files/2016/12/Exercises.pdf ·...
10
ECCP Exercises 1. Properties of Particulate Solid 1.1. Size of irregular particle Determine equivalent volume diameter, equivalent surface diameter and equivalent volume/surface diameter of the disc-shaped particle of 100 um diameter and 20 um thickness. 1.2. Particle size distribution The histogram represents experimental results of PSD measurement by sieve analysis. 12% 25% 25% 18% 9% 7% 3% 1% 0 100 200 300 400 500 600 700 800 900 1000 d (metoda B), um 0% 2% 4% 6% 8% 10% 12% 14% 16% 18% 20% 22% 24% 26% 28% w, % 12% 25% 25% 18% 9% 7% 3% 1% Estimate d10, d50, and d90 values of the PSD Compare the number of particles in 200-300 and 300-400 um fractions. 1.3. Laser diffraction results Use the laser diffraction results above to respond following questions: ‒ Can you determine particle shape from the data? ‒ What can you tell about the equivalent volume diameter of 50 % of material by volume
Transcript of 12% 10% 14% 9% ECCP Exercises - vscht.cztresen.vscht.cz/kot/english/files/2016/12/Exercises.pdf ·...
ECCP Exercises
1. Properties of Particulate Solid
1.1. Size of irregular particle Determine equivalent volume diameter, equivalent surface diameter and equivalent volume/surface
diameter of the disc-shaped particle of 100 um diameter and 20 um thickness.
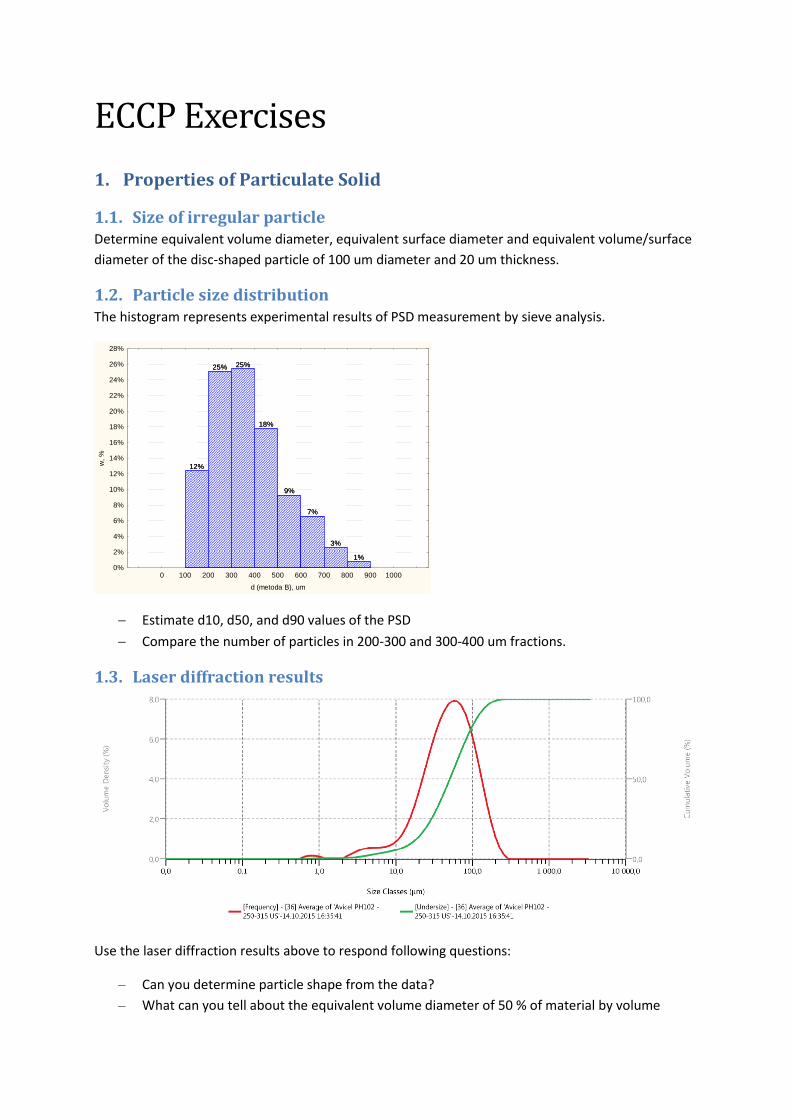
1.2. Particle size distribution The histogram represents experimental results of PSD measurement by sieve analysis.
12%
25% 25%
18%
9%
7%
3%
1%
0 100 200 300 400 500 600 700 800 900 1000
d (metoda B), um
0%
2%
4%
6%
8%
10%
12%
14%
16%
18%
20%
22%
24%
26%
28%
w,
%
12%
25% 25%
18%
9%
7%
3%
1%
Estimate d10, d50, and d90 values of the PSD
Compare the number of particles in 200-300 and 300-400 um fractions.
1.3. Laser diffraction results
Use the laser diffraction results above to respond following questions:
‒ Can you determine particle shape from the data?
‒ What can you tell about the equivalent volume diameter of 50 % of material by volume

2. Flow of Particulate Solid
2.1. State of stress in particulate solid Bulk solid element is exposed to stress according to the following scheme (σV > σH)
- Draw the Mohr circle representation of the state of stress in the element
- Identify principal stresses
- Draw (arbitrary) example of the yield locus and discuss the relationship between yield locus
and the state of stress
2.2. State of stress in particulate solid A cylindrical element of particulate solid is exposed to stress 2 MPa from above and 1 MPa from
sides. There are no shear stresses associated with the horizontal and vertical direction
Determine the first and the second principal stress.
Use Mohr circle to analyze 2-axis state of stress above in approximate scale. Mark axes by
apropriate symbols.
Determine the shear stress acting on a plane inclined by 45° from horizontal using the Mohr
circle (draw it).
2.3. Silo design Mass/funnel flow worked examples are to be found in Rhodes M: Introduction to Particle
technology, from p. 285 on
2.4. Flow condition Powder, having the flow function σY = 2 + 0,25 σC [kPa] is stored in hopper of flow factor = 2.
Determine critical stress condition to enable flow.
2.5. Powder flow function What is the powder flow function? Is the powder flow function dependent on (a) the powder
properties, (b) the hopper geometry, (c) both the powder properties and the hopper geometry?
σH
σV
τH
τV

3. Comminution Processes
3.1. Using comminution laws Compacted material is milled using a hammer mill. The particle size of input material is d80 = 3.6 mm.
The manufacturer specifies the approximately constant performance for obtaining the product of d80
> 50 μm and maximum size of input material particles 5 mm.
The mill performance was tested using the 250 μm screen providing the product size d80 = 225 μm.
The maximum available throughput of the milled material was 5 kg/hr.
Which particle size of the product is to be expected, if the desired production capacity is at least 10
kg/hr.
3.2. PSD of Comminution – specific rate Tables below summarize the specific comminution rate and product distribution among 4 size classes
of the material for 3 different milling machines A, B, C
j dp, mm SA(j) SB(j) SC(j) b(1,j) b(2,j) b(3,j) b(4,j)
1 0.1 - 1 1 1 0,01 - 1 0 0
2 0.01 – 0.1 1 0,1 0,1 - - 1 0
3 0.001 – 0.01 1 0,01 1 - - - 1
4 < 0.001 - - - - - - - Estimate, which machine will be the most efficient in obtaining 0.01 – 0.1 mm fraction.
3.3. PSD of Comminution – product distribution coefficients Table below summarizes the specific comminution rate and product distribution coefficients among
4 size classes of the material.
j dp, mm S(j) b(1,j) b(2,j) b(3,j) b(4,j)
1 0.1 - 1 1 - 0. 9 0 0.1
2 0.01 – 0.1 1 - - 0.9 0.1
3 0.001 – 0.01 1 - - - 1
4 < 0.001 - - - - -
Estimate, if the dominating comminution mechanism is fragmentation or abrasion.
3.4. Griffith theory
Discuss the susceptibility of above particles to brittle fracture
A B C D
4. Granulation Processes
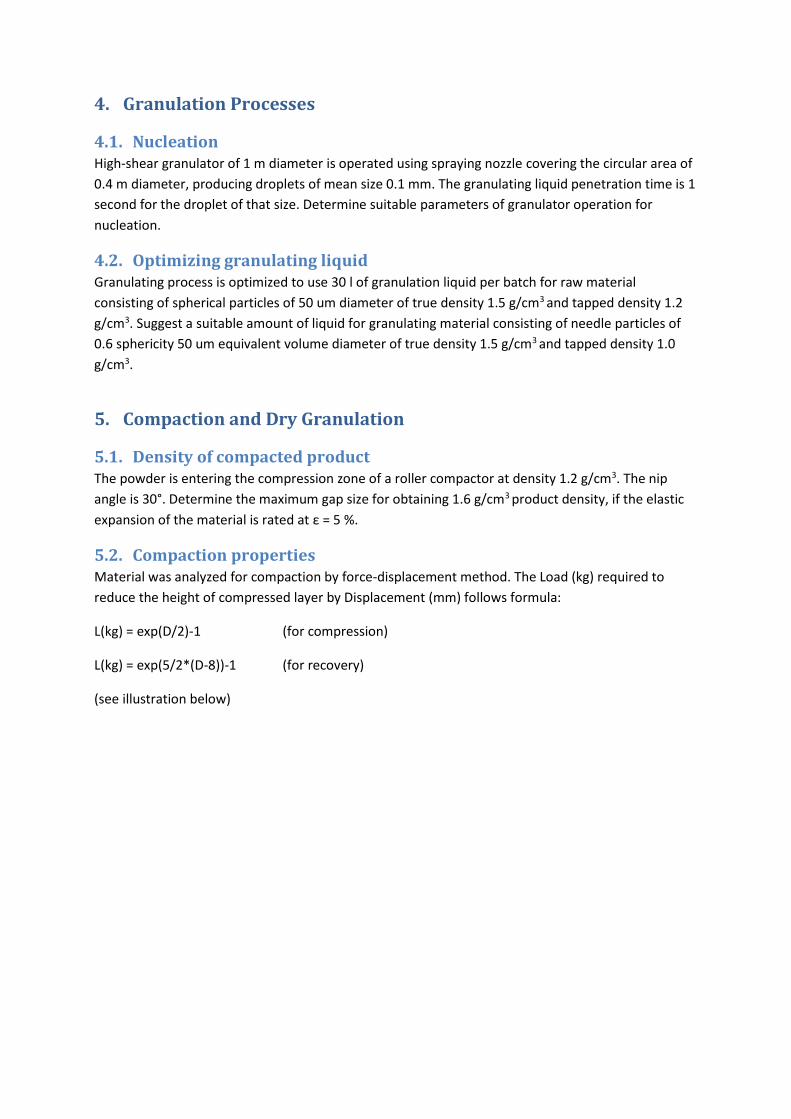
4.1. Nucleation High-shear granulator of 1 m diameter is operated using spraying nozzle covering the circular area of
0.4 m diameter, producing droplets of mean size 0.1 mm. The granulating liquid penetration time is 1
second for the droplet of that size. Determine suitable parameters of granulator operation for
nucleation.
4.2. Optimizing granulating liquid Granulating process is optimized to use 30 l of granulation liquid per batch for raw material
consisting of spherical particles of 50 um diameter of true density 1.5 g/cm3 and tapped density 1.2
g/cm3. Suggest a suitable amount of liquid for granulating material consisting of needle particles of
0.6 sphericity 50 um equivalent volume diameter of true density 1.5 g/cm3 and tapped density 1.0
g/cm3.
5. Compaction and Dry Granulation
5.1. Density of compacted product The powder is entering the compression zone of a roller compactor at density 1.2 g/cm3. The nip
angle is 30°. Determine the maximum gap size for obtaining 1.6 g/cm3 product density, if the elastic
expansion of the material is rated at ε = 5 %.
5.2. Compaction properties Material was analyzed for compaction by force-displacement method. The Load (kg) required to
reduce the height of compressed layer by Displacement (mm) follows formula:
L(kg) = exp(D/2)-1 (for compression)
L(kg) = exp(5/2*(D-8))-1 (for recovery)
(see illustration below)

Calculate the factor of elasticity (elastic recovery/original height)
Calculate the energy accumulated in compact after compression/relaxation
6. Tablet Compression
6.1. Force balance at compression The wall friction angle of a mixture for tablet compression is 1°. Lateral stress ratio is 0.6. Estimate
the lubrication ratio for main compression force 10 kN.
6.2. Bonding Explain the three possible mechanisms of bond development in compressed solids.
7. Mixing Particulate Solids
7.1. Theoretical mixture homogeneity Consider a powder mixture for compressing 100 mg tablets containing 1 mg of API. Determine
maximum particle size required to allow homogeneity of 0,5 % RSD.
7.2. Segregation API of true density 1.2 g/cm3 and mean particle size 20 um is blended with an excipient of density
1.1 g/cm3 and particle size of 50 um. After mixing, there is a significant concentration gradient in the
blender – API concentration decreases in top-to-bottom direction. Which mechanism of segregation
is probably responsible? Suggest a suitable change of operating parameters to alleviate the problem.
8. Answers/Solutions [Answer 1.1: dV is 67 um; other values can be calculated in an analogic way ]
0
20
40
60
80
100
120
140
160
0 2 4 6 8 10 12
Load
, kg
D, mm

[Answer 1.2: d10 = 100 um, d50 = 300 um , and d90 = 600 um approximately]
[Answer 1.3: NO; equivalent volume diameter may be obtained directly from the data dV50 = 50 um approximately]

[Answer 2.1]
[Answer 2.2: σ45 = 1.5 MPa; τ45 = 0.5 MPa]
[Answer 2.4:]

[Answer 2.5: Flow function is relationship between consolidating stress and unconfined yield strength; it is not dependent
on the hopper geometry, thus (a) ]
[Answer 3.1: d80 = 576 μm]
[Answer 3.2: Machine B, since there is largest ratio between Class 2 particles formation rate and disintegration rate]
[Answer 3.3: abrasion – product distribution of each class comminution comprise only the particles one class smaller and
the particles of the smallest fraction; if it was fragmentation, the product would be distributed between all classes]
[Answer 3.4: the order from easiest to hardest particle to break is B – D – A – C; D breaks two times, before A does]
[Answer 4.1: Dimensionless penetration time and Spray-flow factor should not exceed 0.1 each (see nucleation “map” in
presentation). Those values determine maximum f and Q]
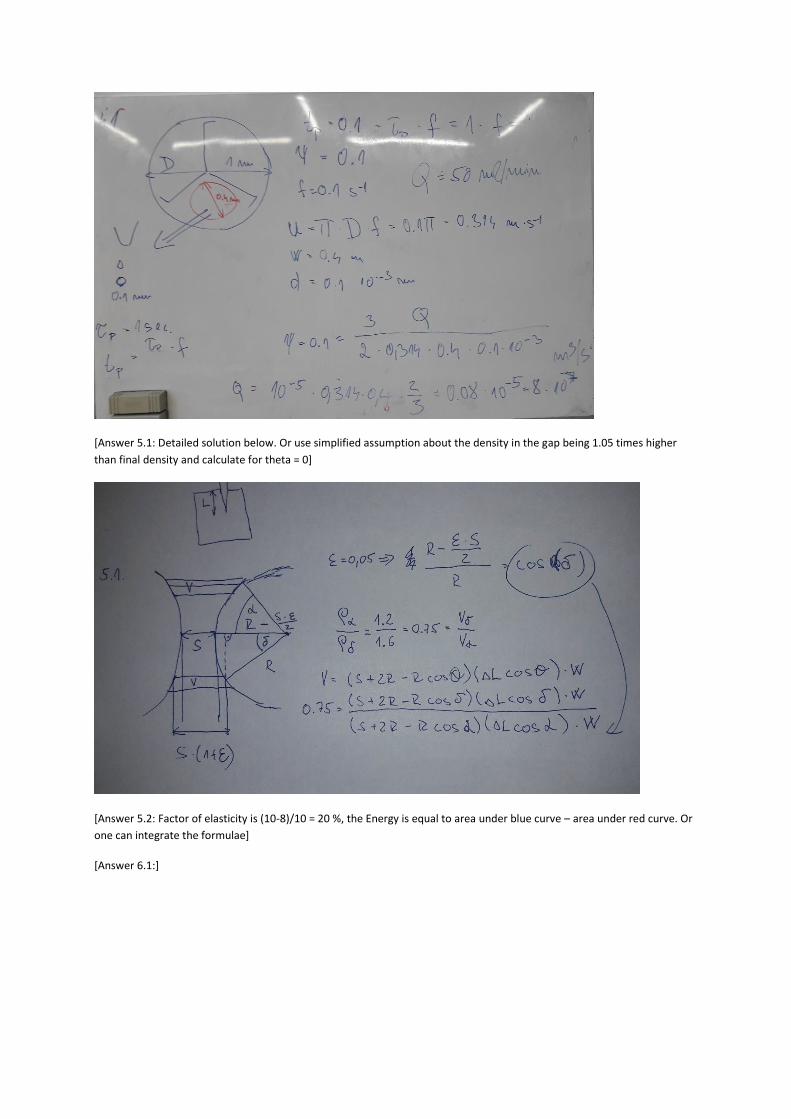
[Answer 5.1: Detailed solution below. Or use simplified assumption about the density in the gap being 1.05 times higher
than final density and calculate for theta = 0]
[Answer 5.2: Factor of elasticity is (10-8)/10 = 20 %, the Energy is equal to area under blue curve – area under red curve. Or
one can integrate the formulae]
[Answer 6.1:]

[Answer 6.2: mechanical interlocking; interparticle surface forces; local melting/dissolution at extreme pressures]
[Answer 7.1:]
m 100 100 100 100 100 100 100 mg
mAPI 1 1 1 1 1 1 1 mg
p 0,01 0,01 0,01 0,01 0,01 0,01 0,01 1% vs 99% binary mix
1-p 0,99 0,99 0,99 0,99 0,99 0,99 0,99 sigma0
2 0,0099 0,0099 0,0099 0,0099 0,0099 0,0099 0,0099 totally segregated mixture
RSD0 995% 995% 995% 995% 995% 995% 995% n 10 100 1000 10000 100000 1000000 10000000 number of paricles
sigmaR2 0,00099 0,000099 9,9E-06 9,9E-07 9,9E-08 9,9E-09 9,9E-10 Theoretical random mixture
RSDR 314,64% 99,50% 31,46% 9,95% 3,15% 0,99% 0,31% nAPI 0,1 1 10 100 1000 10000 100000
mAPI,P 10 1 0,1 0,01 0,001 0,0001 0,00001 mass of single particle of API, mg
V 10 1 0,1 0,01 0,001 0,0001 0,00001 particle volume in mm3 at density 1
d 2,154 1,000 0,464 0,215 0,100 0,046 0,022 particle size in mm
[Answer 7.2: The density difference is much less than the volume difference, thus the density difference can be neglected.
Smaller particles (API) are remaining more likely in top layers, thus fluidization is the cause of the problem observed.
Probably, the rotation is too fast causing cataracting flow. Reducing the velocity should help alleviate the problem. Also one
may try increase the filling to reduce the gas volume for fluidization, but it can bring dead-zone problem, so one must
proceed with caution.]