112 SSA’s FY 2001 Performance and Accountability Report · Summary of Achievement-FY 2001...
87
-
Upload
nguyennhan -
Category
Documents
-
view
215 -
download
1
Transcript of 112 SSA’s FY 2001 Performance and Accountability Report · Summary of Achievement-FY 2001...


112 SSA’s FY 2001 Performance and Accountability Report
GPRA Performance Results
Summary of Achievement-FY 2001 Performance Goals
The performance data presented in this report are fundamentally complete and reliable as outlined in the guidance available from the Office of Management and Budget. While we have identified no material inadequacies, the Data Quality discussion in the Performance Goals and Results section of Management’s Discussion and Analysis describes our continuing efforts to strengthen the quality and timeliness of SSA’s performance information to increase its value to SSA’s management, policymakers and others. The results achieved for each FY 2001 goal are either discussed in this report or will be included in a future annual report. SSA’s managers routinely use this performance data to improve the quality of program management and to demonstrate accountability in achieving program results.
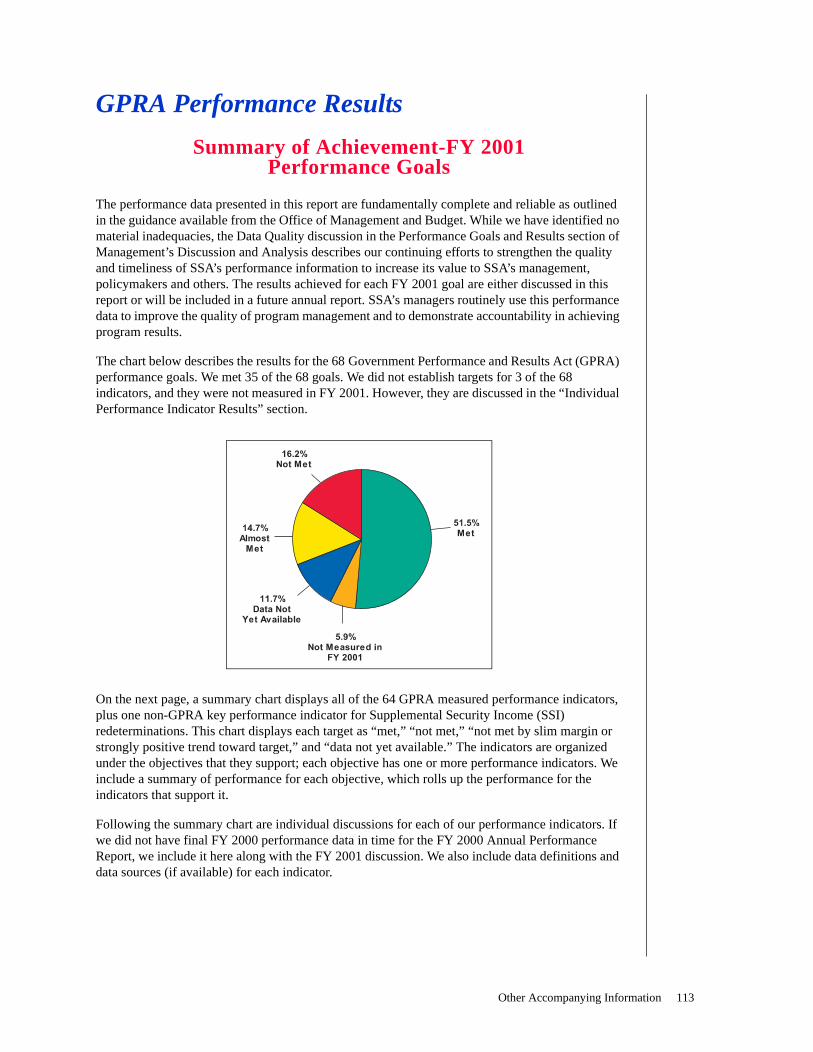
The chart below describes the results for the 68 Government Performance and Results Act (GPRA) performance goals. We met 35 of the 68 goals. We did not establish targets for 3 of the 68 indicators, and they were not measured in FY 2001. However, they are discussed in the “Individual Performance Indicator Results” section.
On the next page, a summary chart displays all of the 64 GPRA measured performance indicators, plus one non-GPRA key performance indicator for Supplemental Security Income (SSI) redeterminations. This chart displays each target as “met,” “not met,” “not met by slim margin or strongly positive trend toward target,” and “data not yet available.” The indicators are organized under the objectives that they support; each objective has one or more performance indicators. We include a summary of performance for each objective, which rolls up the performance for the indicators that support it.
Following the summary chart are individual discussions for each of our performance indicators. If we did not have final FY 2000 performance data in time for the FY 2000 Annual Performance Report, we include it here along with the FY 2001 discussion. We also include data definitions and data sources (if available) for each indicator.
Other Accompanying Information 113

OUR ACHIEVEMENT OF FY 2001 PERFORMANCE TARGETS BY GOAL AND OBJECTIVE
Strategic Goal: Responsive Programs
Performance Indicators (PI):
Target Met or Exceeded
Target Not Met by Slim Margin or
Strong Positive Trend Toward Target
Target Not Met
Target Not Yet Available
Performance Summary
Objective: Promote policy changes that shape the OASI and DI programs.
Key PI: Barometer measures for assessing the
effectiveness of the OASDI program.
Our results for this Objective were outstanding. We met all 4 performance targets and thus advanced our research and analysis of the OASI and DI programs, helping us develop appropriate policy proposals for the future.
Analyses and reports on the effect of OASDI
programs on different populations.
Analyses and reports on demographic,
economic and international trends and their
effects on OASDI programs.
Key PI: Research and policy analyses to assist
in the development of proposals to strengthen
and enhance the solvency of OASDI programs.
Objective: Promote policy changes that shape the SSI program.
Barometer measures for assessing the
effectiveness of the SSI program.
Our results for this Objective were positive. We met 3 out of 4 targets. We were unable to complete data collection for the SSI Childhood Disability Survey as scheduled, but will be on schedule to meet our FY 2002 and 2003 targets.
Completion of data collection and report
on the SSI Childhood Disability Survey.
Analysis on sources of support for the
SSI population.
Analysis of complex SSI policies.
Objective: Promote policy changes that shape the disability program.
Research design for validating medical listings. Our results for this Objective were positive. We met 2 out of the 3 targets. We did not initiate the NSHA main study data collection as scheduled in FY 2001; data collection will begin in late FY 2002 or early FY 2003.
Reports on results of the National Study of
Health and Activity (NSHA).
Alternative return-to-work strategies.
114 SSA’s FY 2001 Performance and Accountability Report

Objective: Provide information for decisionmakers and others on the SS and SSI programs.
Performance Indicators (PI):
Target Met or Exceeded
Target Not Met by Slim Margin or
Strong Positive Trend Toward Target
Target Not Met
Target Not Yet Available
Performance Summary
User rating of SSA’s research and
analysis products.
Our results for this Objective were outstanding. We met both targets. We established first measures for user satisfaction ratings and produced all major statistical products on time.
Timeliness of major statistical products.
Strategic Goal: Customer-responsive world-class service
Objective: By 2004 and beyond, have 9 out of 10 customers rate SSA’s overall service as “good,” “very good” or “excellent,” with most rating it “excellent”
Key PI: Customer service rating- “excellent,”
“very good” or “good.”
Our results for the Objective were positive. We met and exceeded 3 performance targets and missed 3 only by slim margins. The 800-number payment and service accuracy rates are not yet available and will be reported in the FY 2002 Performance and Accountability Report (PAR). Public satisfaction ratings remained stable but did not rise, since there were no significant service enhancements in FY 2001 and we had the impact of longer initial disability claims and hearing processing times. We are testing new technologies expected to make service improvements in all areas. Disability and hearings process improvements, as well as additional notice improvements, will also help us improve satisfaction.
Customer service rating - “excellent.”
800-number access within 5 minutes.
800-number access on first attempt.
800-number call payment accuracy.
800-number call service accuracy.
Appointment waiting time 10 minutes or less.
No appointment waiting time 30 minutes
or less.
Other Accompanying Information 115

Objective: By 2005, 60 percent of SSA’s customer-initiated services available to customers either electronically via the Internet or through automated telephone service.
Performance Indicators (PI):
Target Met or Exceeded
Target Not Met by Slim Margin or
Strong Positive Trend Toward Target
Target Not Met
Target Not Yet Available
Performance Summary
Key PI: Customer initiated services available to customers via the Internet or through automated telephone service.
Our results for this Objective were outstanding. We exceeded the target for FY 2001. In addition, we continue to expand the services available in this new service channel. In FY 2001, we added 6 new SSA online applications to bring the total number to 17, and we are currently analyzing 6 new proposals. We are testing/piloting technologies to authenticate identity online, and thus increase security and privacy of Internet transactions.
Objective: Increase electronic access to information needed to serve SSA customers.
Electronic access to States’ human
services (HS) and unemployment
information (UI).
Our results for this Objective were positive. We missed both these targets but only by very small margins. Electronic access to HS information is already available from 66 percent of States, and the combined trend for both HS and UI has been steadily upward from the 1999 level of 41 percent. FY 2001 was the first year we set a goal for access to VS data and we expect to meet our goal in FY 2002.
Electronic access to States’ vital
statistics (VS) and other material.
116 SSA’s FY 2001 Performance and Accountability Report

Objective: To raise the number of customers who receive service and payments on time.
Performance Indicators (PI):
Target Met or Exceeded
Target Not Met by Slim Margin or
Strong Positive Trend Toward Target
Target Not Met
Target Not Yet Available
Performance Summary
Key PI: Initial disability claims average
processing time.
Our results for this Objective were mixed. We met only 4 out of our 10 targets. We exceeded our targets for SSN cards, OASI claims processed and SSI aged claims processed, continuing our positive performance trends since FY 1998. We did not meet any of our six hearings and appeals goals primarily because we have recently implemented a hearings process and Appeals Council process improvements, and have not realized benefits. In addition, until recently, litigation has prevented us from hiring Administrative Law Judges (ALJ) to replace those lost through attrition. With the recent hiring of some replacement ALJs, we are committed to moving toward our long-range improvement targets.
Hearings decisions issued w/in 180 days.
Key PI: Hearings average processing time.
Hearings cases processed per workyear.
Appeals of hearings (Appeals Council)
decisions issued within 105 days.
Appeals of hearings (Appeals Council)
decisions average processing time.
Appeals of hearings (Appeals Council)
decisions issued per workyear.
Retirement and Survivors (OASI) claims
processed timely.
Supplemental Security Income (SSI) aged
claims processed timely.
Key PI: Original and replacement Social
Security Number (SSN) cards issued timely.
Other Accompanying Information 117

Objective: By 2005, increase by 100 percent from 1999 levels, the number of Social Security and SSI disability beneficiaries who achieve steady employment and no longer receive cash benefits.
Performance Indicators (PI):
Target Met or Exceeded
Target Not Met by Slim Margin or
Strong Positive Trend Toward Target
Target Not Met
Target Not Yet Available
Performance Summary
Increase in the number of Social Security disability adult beneficiaries (DI) who begin a
trial work period (TWP).
Our results for this Objective were mixed. We will not have the actual data for DIs who began a TWP until February 2002. We did not meet our targets for working SSI disabled beneficiaries or implementation of the TWSSP. However, our results for this Objective were adversely impacted by several factors. Our goal was to start distributing Tickets-to-Work in FY 2001; this will not happen until early FY 2002 because the required final regulation was delayed due to the time required to review 500 comments on the Notice of Proposed Rulemaking, and discussions with the Office of Management and Budget. The positive impact TWSSP will have on beneficiaries returning to work in greater numbers should begin in 2002. However, the path the economy takes will also be an important determinant of our success. If the economy does not recover in 2002, there will be a negative impact on employment opportunities for people with disabilities.
Increase in the number of SSI disabled
beneficiaries, aged 18-64, participating in 1619(a) status.
Activities to implement provisions of the
Ticket-to-Work and Self-Sufficiency Program
(TWSSP) and other employment strategies.
118 SSA’s FY 2001 Performance and Accountability Report

Strategic Goal: Program Integrity
Objective: To make benefit payments in the right amount.
Performance Indicators (PI):
Target Met or Exceeded
Target Not Met by Slim Margin or
Strong Positive Trend Toward Target
Target Not Met
Target Not Yet Available
Performance Summary
Retirement, survivors and disability (OASDI)
(non-medical) payment accuracy.
Our results for this Objective appear to be positive, although our assessment is incomplete because much of the data is not yet available. We met 2 of the 8 targets, did not meet 1, and are waiting for data on 5. We met the DDS (medical) allowance performance accuracy target because of continued focus on decision quality, including training on adjudication consistency. When the final numbers are in, we expect to meet our targets for OASDI accuracy and hearings decisional accuracy. We did not meet the target for DDS denial performance accuracy rate because denial documentation requirements are significantly more difficult and we had to address rising claims backlogs. The FY 2001 actual data for OASDI payment accuracy, DDS net decisional accuracy, hearings decisional accuracy, SSI payment accuracy and SSN issuance accuracy will be reported in the FY 2002 PAR.
Disability Determination Services (DDS)
net decisional accuracy rate.
DDS allowance performance
accuracy rate.
DDS denial performance
accuracy rate.
Hearings decisional accuracy rate.
SSI (non-medical) payment accuracy.
Key PI: SSI non-disability redeterminations
processed.
SSN issuance accuracy.
Objective: To become current with DI and SSI CDR requirements by 2002
Key PI: Percent of Continuing Disability
Review (CDR) plan completed.
Our results for this objective were outstanding. We met our goal and are on target to eliminate all CDR backlogs by FY 2002.
Other Accompanying Information 119

Objective: Maintain current levels of accuracy and timeliness in posting earnings data to individuals’ earnings records.
Performance Indicators (PI):
Target Met or Exceeded
Target Not Met by Slim Margin or
Strong Positive Trend Toward Target
Target Not Met
Target Not Yet Available
Performance Summary
Percent of wage items (worker’s earnings)
posted by September 30.
Our results for this Objective were outstanding. We exceeded all 3 targets. Our continuing efforts to get more employers to file W-2s electronically have paid off. Electronic filing contributes to the timeliness and accuracy of postings.
Key PI: Percent of earnings posted
correctly.
Percent of employee reports (W-2s) filed
electronically.
Objective: Aggressively deter, identify and resolve fraud.
Number of investigations conducted
(i.e., closed).
Our results for this Objective were outstanding. We exceeded all 4 targets largely because of expansion of national investigative efforts, including the Office of the Inspector General’s fugitive felon program and Cooperative Disability Investigative teams.
OASDI $ amounts reported from
investigative activities.
SSI $ amounts reported from
investigative activities.
Number of criminal convictions.
Objective: Increase debt collection by 7 percent annually through 2002.
OASDI debt collected. Our results for this Objective are positive. We did not meet the OASDI target because of external factors, i.e., the elimination of the retirement test and subsequent reduced debt available for collection.
SSI debt collected.
120 SSA’s FY 2001 Performance and Accountability Report

Strategic Goal: Valued Employees
Objective: Tools and training to achieve a highly skilled and high-performing workforce.
Performance Indicators (PI):
Target Met or Exceeded
Target Not Met by Slim Margin or
Strong Positive Trend Toward Target
Target Not Met
Target Not Yet Available
Performance Summary
Percent of offices with direct access to
Interactive Video Teletraining (IVT).
Our results for this Objective were mixed due to circumstances beyond our control. We did not meet the IVT goal because of problems with getting the satellite signals to certain sites and an increase in the size of the universe of total target sites. We were on target to meet our Management/ leadership training experiences but did not complete some because of the events of September 11.
Formal management development programs.
Management/leadership development
experiences.
Objective: Physical environment that promotes the health and well-being of every employee.
Percent of environmental air quality surveys
completed and percent of corrective actions
taken.
Our results for this Objective were positive. We met essentially all of our targets. We completed all targeted testing and surveys. Fewer offices actually relocated than projected, and we completed security surveys in all relocated offices. We implemented more than the target number of recommendations.
Number of facilities having water quality
testing and percent of corrective actions taken.
Number of relocated offices having security
surveys and percent security
recommendations implemented.
Objective: To promote an Agency culture that successfully incorporated our values.
Create Agency change strategy. Our results for this Objective were mixed. We conducted a culture survey, gap analysis and benchmarking study. The recommendations from the culture study are pending. Future activity is under consideration.
Other Accompanying Information 121

Objective: To create a workforce to serve SSA’s diverse customers in the twenty-first century.
Performance Indicators (PI):
Target Met or Exceeded
Target Not Met by Slim Margin or
Strong Positive Trend Toward Target
Target Not Met
Target Not Yet Available
Performance Summary
Key PI: Complete Agency Workforce
Transition Plan.
Our results for this Objective were outstanding. We met our goals to implement and update our Plan, and developed and implemented action items from our employee survey.
Strategic Goal: Strengthen Public Understanding
Objective: By 2005, 9 out of 10 Americans will be knowledgeable about Social Security programs.
Percent of public knowledgeable about
Social Security.
Our results for this Objective were outstanding. We exceeded our “public knowledgeable” target by 3 percent. We have begun to implement strategies to get us to our 2005 goal, including targeting segments of the population least knowledgeable about Social Security.
Key PI: Percent of individuals issued Social
Security Statements as required by law.
Individual Performance Indicator Results The following section reports and discusses our FY 2001 performance for each individual GPRAperformance indicator. In addition, for those performance indicators for which we did not havefinal data when the FY 2000 Performance and Accountability Report was issued inDecember 2000, we also report final FY 2000 performance. The full information for key performance indicators is not included here, but rather in the Performance Goals and Results/FY 2001 Performance by Strategic Goal section located in the Management’s Discussion andAnalysis (MD&A) portion of this report. For each GPRA performance indicator, we also show the definition and data source. Indicators are organized under the Strategic Goal and Strategic Objective that they support.
122 SSA’s FY 2001 Performance and Accountability Report

Strategic Goal: o promote valued, strong, and responsive social security programs and conduct effective policy development, research and program evaluation
Strategic Objective: To promote policy changes, based on research, evaluation and analysis that: shape the OASI and DI programs in a manner that takes account of future demographic and economic challenges, provides an adequate base of economic security for workers and their dependents, and protects vulnerable populations
T
Performance Indicator 1: Identification, development and utilization of appropriate barometermeasures for assessing the effectiveness of Old-Age, Survivors and Disability Insurance (OASDI)programs. We met our goal. This indicator is Key Performance Indicator 1 in the Performance Goals and Results section of the Management’s Discussion and Analysis (MD&A). Please see page 37 for a detailed discussion.
Performance Indicator 2: Preparation of analyses and reports on the effect of OASDI programs on different populations in order to identify areas for policy change and develop options as appropriate.
FY 2001 Goals: Prepare analyses and reports on the following topics:
(1)--The effect of OASDI programs on various subgroups of beneficiaries, including women, minorities and low-wage workers;
(2)--Study on characteristics of people receiving DI benefits; and
(3)--Analysis of the effect of changes in Social Security retirement benefits on the DI program.
FY 2001 Performance Discussion: We met our goals. In FY 2001, we met our goals to publish specific reports that show the effects of our programs on different populations and analyzed options for policy changes. These reports provide decisionmakers with a better understanding of the factors that influence the programs’ abilities to provide an adequate base of economic security to beneficiaries, the characteristics of specific beneficiary populations and the impact of changes in the retirement program on the disability program. Specifically:
(1)--We published two articles in the Social Security Bulletin (Volume 63, Number 3, 2000) focusing on women: “Divorced Baby Boomers in Retirement: Projections of Economic Well-Being in the Near Future,” and “A Benefit of One’s Own: Older Women’s Entitlement to Social Security Retirement.” In January 2001, we released three working papers: “Widows Waiting to Wed? (Re) Marriage and Economic Incentives in Social Security Widow Benefits;” “Analysis of Social Security Proposals Intended to Help Women: Preliminary Results;” and “Reducing Poverty Among Elderly Women: Preliminary Results.” We also produced fact sheets on women and minorities that are available on our website. We have also completed a paper on the special minimum benefit that is scheduled for publication shortly. The special minimum benefit was enacted to increase the benefits of certain low-wage beneficiaries, who disproportionately are women.
(2)--We have produced the first in an annual series of data books describing the population that receives benefits based on their own disability. This population includes disabled workers, disabled widow(er)s and disabled adult children. This data book will greatly expand the amount of statistical information available to Agency decision makers and outside users. The first issue, published in October 2001, is based on data for December 2000.
Other Accompanying Information 123

(3)--We have prepared a paper entitled “Potential Impact of Solvency Proposals on the Disability Insurance Program” that will be published as a working paper or in the Social Security Bulletin.
Data Definition: We will consider these goals to be achieved if we prepare reports on these topics. The reports should provide information for decisionmakers to use in developing policy proposals and should provide options for change when appropriate.
Performance Indicator 3: Preparation of analyses and reports on demographic, economic, and international trends and their effects on OASDI programs in order to anticipate the need for policy change and develop options as appropriate.
FY 2001 Goals: Prepare analyses and reports on the following topics:
(1)--Labor force transitions in the elderly population;
(2)--Implications for retirement income security of shifts from defined benefits to defined contribution plans through study of lump-sum payments from employer pensions;
(3)--Differences across subgroups in saving; and
(4)--International retirement policy reforms.
FY 2001 Performance Discussion: We met our goals. In FY 2001, we met our goal to prepare analyses of the effects of demographic, economic and international trends on our programs. The analyses were produced in cooperation with researchers whose work was funded by SSA’s Retirement Research Consortium. These analyses will help decisionmakers develop proposals to adapt the programs to the changing needs of wage earners and beneficiaries. Specifically:
(1)--We funded three projects that were completed in FY 2001 on labor force transitions in the elderly population: 1) A study of self-employment and labor market transitions at older ages; 2) a study of labor supply of the elderly; and 3) an analysis of earnings after age 50.
(2)--We funded two projects through a cooperative agreement with the Boston College Retirement Research Consortium. Two papers have been prepared: 1) “What Happens When You Show Them the Money?: Lump Sum Distributions, Retirement Income Security and Public Policy;” and 2) “The Effects of Public Policies Toward Pre-Retirement Pension Distributions: Evidence From the Health and Retirement Survey.”
(3)--SSA has prepared a paper, “Differences in Wealth by Race and Ethnicity,” which will be released as a working paper.
(4)-We completed a paper entitled, “Social Security Privatization in Latin America,” which was published in the Social Security Bulletin (Volume 63, Number 2, 2000). We also coauthored a paper with the Federal Reserve Bank of Atlanta on “Social Security in Latin America: Recent Reforms and Challenges,” which was published in the Federal Reserve Bank of Atlanta Economic Review.
Data Definition: We will consider these goals to be achieved if we prepare analyses reports as indicated under the goals.
Performance Indicator 4: Preparation of research and policy evaluation necessary to assist the administration and Congress in developing proposals to strengthen and enhance the solvency of OASDI programs. We met our goal. This indicator is Key Performance Indicator 2 in the Performance Goals and Results section of the MD&A. Please see page 38 for a detailed discussion.
124 SSA’s FY 2001 Performance and Accountability Report
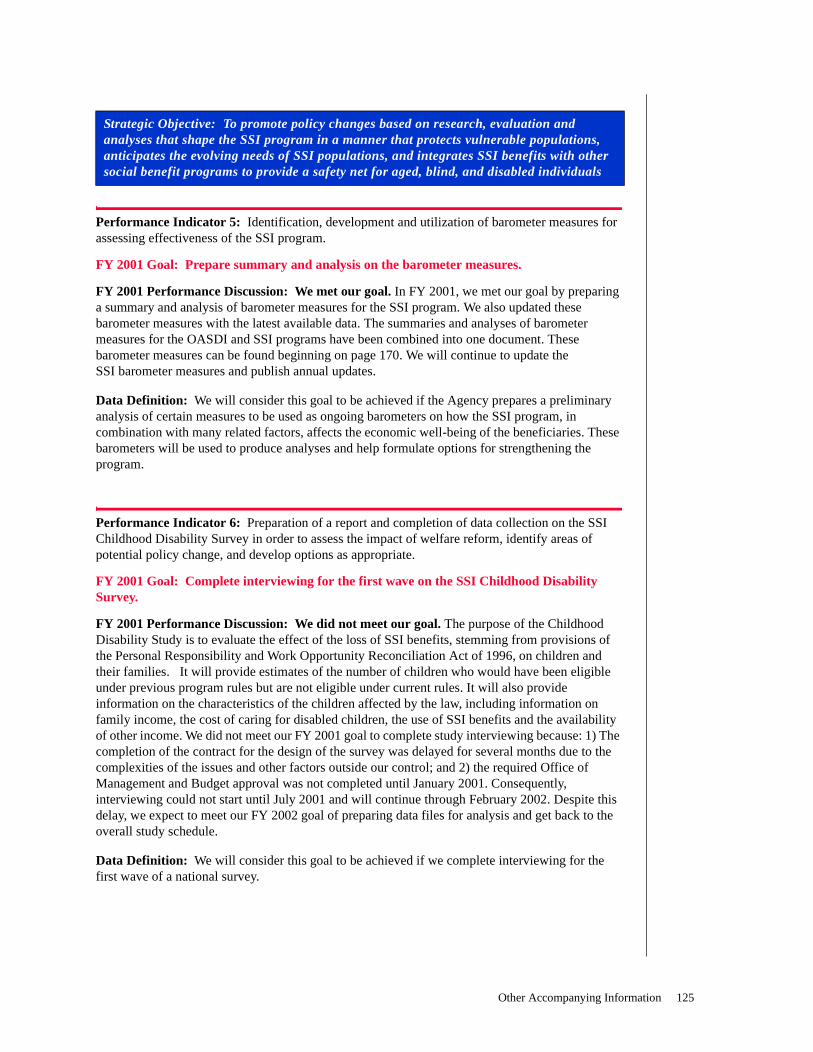
Strategic Objective: To promote policy changes based on research, evaluation and analyses that shape the SSI program in a manner that protects vulnerable populations, anticipates the evolving needs of SSI populations, and integrates SSI benefits with other social benefit programs to provide a safety net for aged, blind, and disabled individuals
Performance Indicator 5: Identification, development and utilization of barometer measures for assessing effectiveness of the SSI program.
FY 2001 Goal: Prepare summary and analysis on the barometer measures.
FY 2001 Performance Discussion: We met our goal. In FY 2001, we met our goal by preparing a summary and analysis of barometer measures for the SSI program. We also updated these barometer measures with the latest available data. The summaries and analyses of barometer measures for the OASDI and SSI programs have been combined into one document. These barometer measures can be found beginning on page 170. We will continue to update the SSI barometer measures and publish annual updates.
Data Definition: We will consider this goal to be achieved if the Agency prepares a preliminary analysis of certain measures to be used as ongoing barometers on how the SSI program, in combination with many related factors, affects the economic well-being of the beneficiaries. These barometers will be used to produce analyses and help formulate options for strengthening the program.
Performance Indicator 6: Preparation of a report and completion of data collection on the SSI Childhood Disability Survey in order to assess the impact of welfare reform, identify areas of potential policy change, and develop options as appropriate.
FY 2001 Goal: Complete interviewing for the first wave on the SSI Childhood Disability Survey.
FY 2001 Performance Discussion: We did not meet our goal. The purpose of the Childhood Disability Study is to evaluate the effect of the loss of SSI benefits, stemming from provisions of the Personal Responsibility and Work Opportunity Reconciliation Act of 1996, on children and their families. It will provide estimates of the number of children who would have been eligible under previous program rules but are not eligible under current rules. It will also provide information on the characteristics of the children affected by the law, including information on family income, the cost of caring for disabled children, the use of SSI benefits and the availability of other income. We did not meet our FY 2001 goal to complete study interviewing because: 1) The completion of the contract for the design of the survey was delayed for several months due to the complexities of the issues and other factors outside our control; and 2) the required Office of Management and Budget approval was not completed until January 2001. Consequently, interviewing could not start until July 2001 and will continue through February 2002. Despite this delay, we expect to meet our FY 2002 goal of preparing data files for analysis and get back to the overall study schedule.
Data Definition: We will consider this goal to be achieved if we complete interviewing for the first wave of a national survey.
Other Accompanying Information 125

Performance Indicator 7: Prepare analysis on the sources of support for the SSI population in order to identify areas for better coordination with other social benefits and develop options as appropriate.
FY 2001 Goal: Prepare analysis and report on child support enforcement.
FY 2001 Performance Discussion: We met our goal. This analysis will help us understand the sources of support available to SSI recipients and develop policies that enhance the safety net for these vulnerable populations. Fewer than half of all children who receive SSI benefits, and live in single-parent homes, receive child support services. Our report to be published in the Social Security Bulletin later in 2001 notes that, although filing for child support is a condition of eligibility for income assistance programs such as Temporary Assistance for Needy Families (TANF), it is not a condition of eligibility for SSI benefits. Such a requirement might result in more children on SSI receiving child support. Since SSI rules exclude one-third of child support when determining benefit amounts, receipt of child support improves the financial well-being of SSI children. This report also discusses ways of improving access to child support data and reducing SSI overpayments. The analysis of support for and economic status of SSI beneficiaries was completed and presented in SSA’s report on the SSI program, “The SSI Program at the Millennium,” which was issued in November 2000. The work of this indicator is now complete and it is discontinued effective FY 2002.
Data Definition: We will consider this goal to be achieved if the Agency prepares the subject report.
Performance Indicator 8: Prepare analysis of complex SSI policies.
FY 2001 Goal: Prepare analysis on SSI simplification opportunities.
FY 2001 Performance Discussion: We met our goal. SSA has been examining SSI policies determined to be complex based on data and feedback from various internal and external sources. The analyses take into account the tensions that can occur between simplification, benefit adequacy, equity, cost and program integrity.
We issued the report Simplifying the Supplemental Security Income Program: Challenges and Opportunities in December 2000. The report provides program and administrative cost estimates and discusses the impact on beneficiaries in three areas: wage estimation and verification, resource exclusions and in-kind support and maintenance. Options and analysis in the report pertaining to wage averaging and consolidating resource counting are key items currently being considered by SSA, with the dual goals of simplifying the SSI program and improving SSI payment accuracy. This report is the final deliverable for this indicator, which is discontinued effective FY 2002.
Data Definition: We will consider this goal to be achieved if the Agency prepares the subject report.
126 SSA’s FY 2001 Performance and Accountability Report

Strategic Objective: Promote policy changes based on research, evaluation and analyses that shape the disability program in a manner that increases self-sufficiency and takes account of changing needs, based on medical, technological, demographic, job market and societal trends
Performance Indicator 9: Preparation of a research design to develop techniques for validating medical listings.
FY 2001 Goal: Prepare a preliminary report on the development of the validation methodology.
FY 2001 Performance Discussion: We met our goal. Our current system for determining eligibility for disability benefits presumes that persons who meet medical listings are severely disabled and unable to work. We will develop a methodology to help us monitor and evaluate our medical listings. The framework for validating medical listings should establish appropriate criteria by which to assess an individual’s ability to work; identify and adopt appropriate research protocols and statistical methods; and propose clinical or other testing methods to gather data. Under a cooperative agreement with the Disability Research Institute (DRI), we have taken the first steps towards developing the methodology for validating our medical listings. In FY 2001, the DRI produced several preliminary reports: 1) Their review of the literature on validation; 2) the criteria by which our medical listings could be validated; and 3) the development of methods by which the criteria may be assessed. In FY 2002, we will complete development of the techniques for assessing the validity of our medical listings and continue to report on our progress in developing this methodology.
Data Definition: Self-explanatory.
Performance Indicator 10: Preparation of reports on results of the National Study on Health and Activity in order to identify potentially eligible disabled populations, interventions that enable continued work effort among the disabled, and guide changes to the disability decision process.
FY 2001 Goal: Initiate main study data collection.
FY 2001 Performance Discussion: We did not meet our goal. We undertook this study to provide information on: 1) The size of the population potentially eligible for disability now and in the near future; and 2) the accommodations and interventions that permit some persons meeting SSA’s definition of disability to continue to work. We will use this information to develop ways to assist individuals to remain in the labor force rather than seek benefits. In FY 2000, we completed a pilot study and intended to begin data collection for the main study in FY 2001. However, analysis of the pilot study showed that significant revisions were needed in the study instruments and in the medical examination component. To improve response rates, we needed to significantly shorten the survey instrument and move away from a telephone to a face-to-face survey. The simulated disability determination revealed a need for more targeted and precise medical evidence, requiring a revision of the study’s medical examination component. If tests of the revised instruments prove successful, we will initiate the main study data collection in late FY 2002 or early FY 2003. Beginning in FY 2002, we will report annually on the status of our main study data collection.
Data Definition: After completion of a pilot study, data collection for the main study will begin in 2001. This will include personal interviews, work assessments and collection of medical records.
Other Accompanying Information 127

Performance Indicator 11: Prepare analyses of alternative return-to-work strategies.
FY 2001 Goal: Design and initiate implementation of demonstration projects.
FY 2001 Performance Discussion: We met our goal. We are evaluating several strategies to encourage return-to-work among persons with disabilities, including a $1-for-$2 benefit offset demonstration, an early intervention demonstration, a State partnership initiative and the Ticket-to-Work program. In FY 2001, we conducted work in these areas as follows:
$1-for-$2 Benefit Offset Demonstration-SSA has developed a detailed statement of work for a contract to design this demonstration. We are awaiting comments from the Ticket-to-Work and Work Incentives Advisory Panel and expect to award the design contract in FY 2002.
Early Intervention Demonstration-We funded a cooperative agreement with the Disability Research Institute (DRI) to begin development of this demonstration. One task was to design a method to identify applicants with impairments, who may reasonably be presumed to be disabled, and who are likely to benefit from early interventions. A second task was to design three or four early interventions that may be tested in the demonstration project. The DRI has produced preliminary draft reports and expects to complete a final report by December 2001. We expect to award a design contract in FY 2002.
State Partnership Initiative-We awarded twelve 5-year grants to States in September 1998 to develop an integrated service delivery system that will increase employment of individuals with disabilities who receive SSDI or SSI. In FY 2001, the States finalized their intervention and evaluation plans, began recruiting participants and began providing services. The SSA evaluation contractor completed three reports which detail the evaluation plan, assess SSA administrative data for evaluation and assess the model for creating comparison groups for the evaluation.
Evaluation of the Ticket-to-Work Program-We awarded a design contract for the evaluation of the Ticket-to-Work Program. In FY 2001, the contractor produced three reports: 1) An initial evaluation design; 2) a discussion of how the evaluation will use SSA data to develop analysis files and identification of additional data that will be needed; and 3) a survey and sample design. We also wrote a paper on the design of an “adequacy of incentives” study to be completed as part of the Ticket-to-Work evaluation.
In FY 2002, we will continue these return-to-work projects and will report on continued progress in their design and implementation.
Data Definition: Self-explanatory.
Strategic Objective: Provide information for decisionmakers and others on the Social Security and Supplemental Security Income programs through objective and responsive research, evaluation, and policy development
Performance Indicator 12: Percent of customers assigning a high rating to the quality of SSA’s research and analysis products in terms of accuracy, reliability, comprehensiveness, and responsiveness.
FY 2001 Goal: Establish a baseline.
FY 2001 Performance Discussion: We met our goal. In FY 2001, we conducted our first satisfaction survey about our research and analysis products. We surveyed subscribers to our policy
128 SSA’s FY 2001 Performance and Accountability Report

publications, other persons with an active interest in social security issues, others interested in SSA’s statistical publications, and decisionmakers in high-level positions at SSA and related Federal agencies. The computation of a quality rating is based on answers to the question, “How satisfied were you with the overall quality of SSA’s research, statistical or policy information in the past 24 months?” The survey also asks questions on satisfaction with such things as accuracy, comprehensiveness and usefulness of these products. A 5-point scale was used ranging from “very satisfied” to “very dissatisfied.” The proportion that was satisfied (answered “very satisfied” or “somewhat satisfied”) was 86 percent. Those who answered “very satisfied” totaled 37 percent. In FY 2002, we will make improvements to our measurement system and conduct subsequent surveys periodically.
Data Definition: This goal will be considered achieved if SSA establishes a baseline for this measure in FY 2001 and begins developing a performance goal for FY 2002.
Performance Indicator 13: Percent of major statistical products that are timely.
FY 2001 Goal: Establish a baseline for percent of major statistical products that are produced on schedule.
FY 2001 Performance Discussion: We met our goal. Each year, we identify major statistical products and establish a production schedule, with the goal of producing all products on time. In 2001, we identified five products and issued a schedule for release of these publications both in print and on the Internet. Three of these publications are annual; two are biannual.
• The schedules for the printed versions of the SSI Annual Statistical Report and Fast Facts About Social Security have been met.
• The Annual Statistical Supplement, Income of the Population 55 or Older, and Income of the Aged Chartbook are expected to be in print on schedule in January, March and April 2002, respectively.
• Fast Facts and Figures About Social Security was posted on the Internet on time.
• Sections of the Annual Statistical Supplement are being posted on the Internet on a flow basis in 2001 prior to publication in January 2002.
A June 2001 directive requires that all material we put on our Internet site be accessible to the visually impaired. Converting Annual Supplement tables to the Internet has been slower than expected because of this requirement and the number and complexity of tables in this publication. We will incorporate the accessibility requirement in future production schedules to assure timely publication.
Data Definition: Self Explanatory.
Other Accompanying Information 129

Strategic Goal: To deliver customer-responsive world-class service
Strategic Objective: By 2002 and beyond, have 9 out of 10 customers rate SSA’s overall service as “good,” “very good” or “excellent,” with most rating it “excellent”
Performance Indicator 14: Percent of SSA’s core business customers rating SSA’s overall service as “excellent,” “very good” or “good.” We missed our goal but not to a significant degree. This indicator is Key Performance Indicator 3 in the Performance Goals and Results section of the MD&A. Please see page 40 for a detailed discussion.
Performance Indicator 15: Percent of SSA’s core business customers rating SSA’s overall service as “excellent.”
FY 2001 Performance Discussion: We did not meet our goal, but not to a significant degree. Our actual performance was two percent lower than the target, but the decrease from the prior year is not statistically significant and may only be the result of sampling variability. We continue numerous service improvement initiatives, but there have been no service enhancements significant enough during the past year to counterbalance the negative influences on overall satisfaction, including telephone access issues, no significant notice improvements and longer initial disability claims/hearings processing times. We are currently in a transition period as we test new technologies expected to make significant service improvements in the long term. We expect satisfaction levels to remain relatively constant through FY 2002 and 2003, even as the public’s expectations rise and we work within the current budget environment.
Data Definition: The number of core business customers surveyed by SSA’s Office of Quality Assurance and Performance Assessment who rate overall service as “excellent” on a 6-point scale ranging from “excellent” to “very poor,” divided by the total number of respondents to that question.
Data Source: For FY 1999 and earlier, the SSA Annual Customer Satisfaction Survey. For FY 2000 on, the Interaction Tracking Surveys that capture customer satisfaction shortly after service contacts (either by telephone or in-person) take place.
Year Goal Actual
1998 NA 30%
1999 NA 44%
2000 37% 29%
2001 30% 28%
130 SSA’s FY 2001 Performance and Accountability Report

Performance Indicator 16: Percent of employers rating SSA’s overall service during interactions with SSA as “excellent,” “very good” or “good.”
FY 2001 Performance Discussion: No actual performance was measured for FY 2001. Prior to FY 2001, we measured employer satisfaction using a sample of employers who responded to an annual SSA survey. Responses to that survey indicated that most employers do not regularly interact with SSA to any great extent, so the percentage of respondents using SSA services was low. This is because many employers use payroll providers and accountants to handle SSA wage-reporting requirements. Accordingly, effective FY 2001, we changed our survey methodology to select the survey sample from the universe of those who have had direct interactions with SSA. We also modified our employer satisfaction performance measures accordingly. Using our revised methodology, the employer satisfaction survey was initiated in November 2001 and results are expected in July 2002. The results will provide baseline data and will be used to develop FY 2002 targets for our two employer satisfaction measures.
Data Definition: This is the number of employers directly interacting with SSA who rate overall service as excellent, very good, or good on a 6-point scale ranging from excellent to very poor, divided by the total number of respondents to that question. For 2002, data will be based on results of a survey of employers who called SSA’s Employer Reporting Service Center. In FY 2003, additional types of employer interactions will be included.
Data Source: Annual Employer Interaction Survey conducted by the Office of Quality Assurance and Performance Assessment (first survey planned for November 2001).
Performance Indicator 17: Percent of employers rating SSA’s overall service during interactions with SSA as “excellent.”
FY 2001 Performance Discussion: No actual performance was measured for FY 2001. See the discussion of the item directly above.
Data Definition: This is the number of employers directly interacting with SSA who rate overall service as excellent on a 6-point scale ranging from excellent to very poor, divided by the total number of respondents to that question. For 2002, data will be based on results of a survey of employers who called SSA’s Employer Reporting Service Center. In FY 2003, additional types of employer interactions will be included.
Data Source: Annual Employer Interaction Survey conducted by the Office of Quality Assurance and Performance Assessment (first survey planned for November 2001).
Year Goal Actual
1999 NA NA
2000 NA 82%
2001 TBD NA
Year Goal Actual
1999 NA NA
2000 NA 6%
2001 TBD NA
Other Accompanying Information 131

Performance Indicator 18: Percent of callers who successfully access the 800-number within 5-minutes of their first call.
FY 2001 Performance Discussion: We met and exceeded our goal. A key predictor of overall public satisfaction with SSA’s service is how quickly and efficiently the public gets through to us by telephone. Our ability to provide prompt and hassle-free 800-number access is a challenge in these times of increasing workloads, evolving demands/preferences and limited staffing. Successful 800-number access is largely dependent upon the availability of sufficient staff, which requires a major portion of our annual administrative resources. As we continue to expand the number of our services available by telephone, we will make related automation and access improvements. We expect to maintain 800-number access rates in FY 2002. We are completing a benchmarking study of 800-number service to help us determine if we should use different measures for this aspect of our service delivery. If appropriate, we will move to improved performance measures beginning FY 2003.
Data Definition: This rate is the percentage of unique call attempts that successfully “connect” within 5 minutes of the first attempt within a 24-hour period. A successful “connection” occurs when a caller selects either an automated or live agent and is connected with that option within 5 minutes of the first dialing of the 800-number.
Data Source: Automatic Number ID records provided by WorldCom.
Performance Indicator 19: Percent of callers who get through to the 800-number on their first attempt.
FY 2001 Performance Discussion: We met and exceeded this goal. See discussion immediately above.
Data Definition: This rate reflects the number of individuals who reach the 800-number (either live or automated service) on their first attempt, divided by the number of unique telephone numbers dialed to the 800-number. An “attempt” is defined as the first attempted call of the day, or a subsequent attempt after a previously successful call.
Data Source: Automatic Number ID records provided by WorldCom.
Year Goal Actual
1998 95% 95.3%
1999 95% 95.8%
2000 92% 92.9%
2001 92% 92.7%
Year Goal Actual
1998 90% 91.1%
1999 90% 92.9%
2000 86% 88.4%
2001 86% 89.2%
132 SSA’s FY 2001 Performance and Accountability Report

Performance Indicator 20: Percent of 800-number calls handled accurately - Payment Accuracy.
FY 2000 Performance Discussion: We did not meet our goal. Payment accuracy is a measure of whether our 800-number representatives respond correctly to inquiries related to eligibility and payment of benefits. Payment accuracy declined in FY 2000 as compared to FY 1999.
FY 2001 Performance Discussion: Data not yet available. Actual FY 2001 performance for this indicator will be reported in the FY 2002 Performance and Accountability Report (PAR). Although we did not meet our FY 2000 goal, we do expect to meet our FY 2001 goal of 95 percent as a result of increased usage by our 800-number representatives of automated interviewing screens; these screens help them respond correctly to public inquiries. We continue, on an ongoing basis, to evaluate the causes of payment errors as identified in annual quality assurance reports, and to determine additional steps we can take to improve payment accuracy.
Data Definition: Payment accuracy is a measure of whether 800-number representatives respond correctly to inquiries related to eligibility and payment of benefits.
Data Source: 800-number Service Evaluation Findings.
Note: Generally, there is about a one year lag before quality data is available due to the review and validation of study data input into the database, allowing time for rebuttals of errors, obtaining universe counts and running/validating report tables.
Performance Indicator 21: Percent of 800-number calls handled accurately - Service Accuracy.
FY 2000 Performance Discussion: We did not meet our goal. However, we did improve service accuracy in FY 2000 and the trend since 1998 is positive. Service accuracy is a measure of whether our 800-number representatives respond correctly to inquiries related to issues other than eligibility and payment benefits.
FY 2001 Performance Discussion: FY 2001 data is not available at this time and will be reported in the FY 2002 PAR. We expect continued improvements in service accuracy in FY 2001 as a result of increased usage of the automated interviewing screens that help our representatives respond correctly to public inquiries. Given FY 2000 actual performance, however, we do not expect to attain the 90 percent goal in FY 2001. We will retain the 95 percent (payment accuracy) and 90 percent (service accuracy) goals because we believe it represents good service within the bounds of available resources. We will continue, on an ongoing basis, to evaluate the causes of service errors as identified in annual quality assurance reports, and to determine additional steps we can take to improve service accuracy.
Year Goal Actual
1998 95% 94.7%
1999 95% 95.4%
2000 95% 94.5%
2001 95% NA
Other Accompanying Information 133

Year Goal Actual
1998 90% 81.7%
1999 90% 81.8%
2000 90% 84.9%
2001 90% NA
Data Definition: Service accuracy is a measure of whether 800-number representatives respond correctly to inquiries related to issues other than payment and eligibility. Service errors include major service delivery failures that do not have a reasonable potential to improperly affect payment or eligibility.
Data Source: 800-number Service Evaluation Findings.
Note: Generally, there is about a one year lag before quality data is available due to the review and validation of study data input into the database, allowing time for rebuttals of errors, obtaining universe counts and running/validating report tables.
Performance Indicator 22: Percent of public with an appointment waiting 10 minutes or less.
FY 2001 Performance Discussion: We did not meet this goal, but our performance did improve as compared to last year. SSA tracks and manages the waiting times the public experiences in our field offices because waiting times are a key factor in overall satisfaction ratings. Our strategy to improve field office waiting times is part of our broader strategy to test and implement alternative service delivery options. These options can give the public more choices in how they access SSA’s services, and allow us to make maximum use of field office resources to provide face-to-face service to those with more complex service issues. Key strategies include:
• Recent improvements to our 800-number and local telephone services that provide more efficient routing of phone calls and encourage the completion of service by telephone;
• The implementation of an immediate claims-taking process that enables the filing of retirement and survivors’ claims by telephone in centralized telephone units;
• The expansion of services available on our Internet site (ssa.gov), including the ability to file Internet applications for retirement and spouse’s benefits;
• The testing of processes that will allow the public to complete more of their business with us in a single contact; and
• The addition of centralized field office support units in some of our regions to help alleviate field office workload imbalances.
As we face increasing workloads and the public’s demands, we will maintain our field office waiting time performance in FY 2002 and beyond through continued implementation of our strategy to provide them with alternate service delivery options.
134 SSA’s FY 2001 Performance and Accountability Report

Year Goal Actual
1998 85% 87.4%
1999 85% 84.6%
2000 85% 84.2%
2001 85% 84.4%
Data Definition: The number of visitors with an appointment who wait 10 minutes or less, divided by the total number of visitors with an appointment during the study time. Waiting time data are collected from a representative sample of field offices during a 1-hour window, once a quarter.
Data Source: SSA Waiting Time Study. The waiting time study is conducted quarterly in local field offices.
Performance Indicator 23: Percent of public without an appointment waiting 30 minutes or less.
FY 2001 Performance Discussion: We met our target. The strategy and all the planned improvements/enhancements discussed in the prior indicator apply to this indicator as well.
Data Definition: The number of visitors without an appointment who wait 30 minutes or less, divided by the total number of visitors without an appointment during the study time. Waiting time data are collected from a representative sample of field offices during a 1-hour window, once a quarter.
Data Source: SSA Waiting Time Study.
Year Goal Actual
1998 70% 71.9%
1999 70% 71.6%
2000 70% 73.2%
2001 70% 70%
Strategic Objective: By 2005, make 60 percent of SSA’s customer-initiated services available to customers either electronically via the Internet or through automated telephone service, and provide customers interacting with SSA on the Internet with the option of communicating with an SSA employee while online
Performance Indicator 24: Percent of SSA’s customer-initiated services available to customers either electronically via the Internet or through automated telephone service. We met this goal. This indicator is Key Performance Indicator 4 in the Performance Goals and Results section of the MD&A. Please see page 41 for a detailed discussion.
Other Accompanying Information 135

Strategic Objective: Increase electronic access to information needed to serve SSA customers. Specifically by 2005:
• Establish electronic access to human services and unemployment information with 90 percent of States;
• Establish electronic access to vital statistics and other material information with 50 percent of States; and
• Increase electronic access to information held by Federal Agencies, financial institutions and medical providers
Performance Indicator 25: Percent of States with which SSA has electronic access to human services and unemployment information.
FY 2001 Performance Discussion: We did not meet this goal but only by a very small margin.
• Ninety percent of the Human Service and Unemployment agencies have indicated an interest in providing SSA online access to their records if we reciprocate.
• Our FY 2001 goal was to have in place online access to human services (HS) data from 34 states; we obtained access to HS data from 33 states (66 percent). Discussions are planned with 16 States in FY 2002.
• Our FY 2001 goal was to have in place online access to Unemployment Insurance (UI) data from 25 States; we put in place online access to UI data from 23 States (46 percent). During FY 2001, we conducted a successful online access pilot with Unemployment Insurance agencies. However, two factors impeded our UI goal. First, the recent drop in State tax revenue has decreased State expenditures for information technology improvements. Secondly, we are still resolving issues around SSA approval to reciprocate with UI agencies. This reciprocation will enable UI agencies to verify Social Security numbers online and to obtain Social Security payments where needed to offset Unemployment Compensation payments. As UI agencies move entirely to teleclaims and web-based claims, online access to SSA becomes a critical part of their process. In FY 2002, we are increasing our activities with the Association of State UI Agencies to further promote online data exchanges. We are working with ten specific UI agencies at this time. We expect to meet our FY 2002 goals.
Data Definition: The percent of State Human Service (HS) and Unemployment Insurance (UI) agencies from which data are available online out of a total of 100 agencies (i.e., 50 HS and 50 UI agencies).
Data Source: Office of Automation Support website listing of State agency connections.
Year Goal Actual
1999 NA 41%
2000 NA 50%
2001 59% 55%
136 SSA’s FY 2001 Performance and Accountability Report

Performance Indicator 26: Percent of States with which SSA has electronic access to vital statistics and other material information.
FY 2001 Performance Discussion: We did not meet this goal but only by a small margin. We have had little prior experience in contracting with the States for this data and this had a negative impact on our FY 2001 performance. In addition, the contracting process has proven to take longer than anticipated. We were under contract with 12 percent of the States by September 30, 2001; however, we do not expect to have the data online from Rhode Island until late in FY 2002. We expect to make up for the FY 2001 delays and meet our 14 percent FY 2002 goal. We currently are in contract discussions with Indiana for a possible FY 2002 award and implementation of online access. In addition, we have awarded a contract to the Association of State Vital Statistics Agencies for up to eight pilots in FY 2002.
Data Definition: The percent of State Vital Statistics agencies from which data are available online out of a total of 50 agencies.
Data Source: Office of Automation Support website listing of State agency connections.
Performance Indicator 27: Milestones/deliverables demonstrating progress in increasing electronic access to information held by other Federal Agencies, financial institutions and medical providers.
FY 2001 Performance Discussion: No FY 2001 target was established. In FY 2001, we analyzed the need for and feasibility of increasing electronic access to information held by other Federal agencies, financial institutions and medical providers, and based on this analysis have developed performance targets for FY 2002. As a result of FY 2001 pilot activities, we will begin a project in FY 2002 that will use a third-party vendor to work with financial institutions nationwide to check records concerning applicants’ and recipients’ eligibility for social security benefits. In FY 2001, we also tested/piloted several methods for securely submitting medical information over the Internet. In FY 2002, we will complete this pilot, evaluate it and develop an implementation plan.
Year Goal Actual
1999 NA 10%
2000 NA 10%
2001 12% 10%
Strategic Objective: To raise the number of customers who receive service and payments on time
Performance Indicator 28: Initial disability claims average processing time. We met and exceeded this goal. This indicator is Key Performance Indicator 5 in the Performance Goals and Results section of the MD&A. Please see page 42 for a detailed discussion.
Other Accompanying Information 137

Performance Indicator 29: Percent of hearing decisions issued within 180 days from the date the request is filed.
FY 2001 Performance Discussion: We did not meet goal. In FY 2001, we achieved an actual performance of 19.4 percent of hearings dispositions issued within 180 days. Although our FY 2000 performance for this measure was 28.4 percent, we were not able to maintain that level, for a number of reasons, such as the implementation of our new hearing process, and the litigation (Azdell v. OPM) that prevented us from hiring new ALJs to replace those lost to attrition. A primary feature of the new hearing process is early screening and analysis of all cases to identify more quickly and efficiently possible on-the-record decisions and dismissals that can be disposed of within 180 days. The new process also includes enhanced management flexibility and takes advantage of technology which includes enhanced management information and processing tools. We are currently completing a review of the new hearing process to help us determine what changes are needed, as we continue to strive to reduce processing time, improve productivity and enhance the quality of service to claimants. We managed to come close to our FY 2001 goal of 20 percent. We anticipate that we will meet the FY 2002 goal of 20 percent dispositions within 180 days.
Data Definition: Beginning FY 2001, this new performance indicator represents the actual percent of Medicare and SSA case dispositions issued during the particular report period in which the elapsed time from the date of the request for hearing to the disposition date was 180 days or less. (This measure does not include the time required by field offices, program service centers, or the Office of Central Operations to process favorable decisions.)
Data Source: Actual performance is reported in the Office of Hearings and Appeals (OHA) Monthly Activity Report (MAR) derived from the Hearing Office Tracking System (HOTS).
Performance Indicator 30: Hearings average processing time (days). We did not meet this goal. This indicator is Key Performance Indicator 6 in the Performance Goals and Results section of the MD&A. Please see page 42 for a detailed discussion.
Year Goal Actual
1999 NA 26%
2000 NA 28.4%
2001 20% 19.4%
138 SSA’s FY 2001 Performance and Accountability Report

Performance Indicator 31: Number of hearings cases processed per workyear.
FY 2001 Performance Discussion: We did not meet our goal. This was due to two major factors that adversely impacted our hearings processing capacity:
• Implementation of a new hearing process. This new hearing process includes: a national workflow model that combines pre-hearing activities so that fewer handoffs occur; early case screening and analysis; early claimant contact through pre-hearing conferences; certification of cases as ready-for-hearing; processing time benchmarks for critical steps within the process; group-based accountability for case processing from start to finish; and improved automation and data collection.
• The impact of legislation (Azdell v. OPM) that prohibited us from hiring ALJs and the resulting increase in the number of hearings pending, which changed the entire environment in which productivity calculations are made.
In FY 2002, we expect hearings productivity to improve somewhat from FY 2001 levels, as we begin to benefit from our recent one-time hiring of ALJs. We will continue to look for additional ways to improve our hearings processing capacity and productivity. For example, we are implementing refinements to the new hearings process, and we recently renegotiated a Memorandum of Understanding (MOU) with one of our unions to afford more flexibility to local hearing offices in the performance of certain administrative activities.
Data Definition: This indicator was revised effective FY 2001 to represent the average number of hearings cases processed per “direct” workyear expended. A direct workyear represents actual time spent processing cases. It does not include time spent on training, ALJ travel, leave, holiday, etc.
Data Source: OHA Monthly Activity Reports and the HOTS.
Performance Indicator 32: Percent of decisions on appeals of hearings issued by the Appeals Council within 105 days of the appeals filing date.
FY 2001 Performance Discussion: We did not meet our goal. We have been working to reduce the time required by the Appeals Council to process requests for review of hearings decisions. Although we saw improvement in the overall processing time in FY 2001, we did not meet this goal due to several factors:
• In FY 2001, we focused on completing as many aged cases as possible. By definition, aged cases are already over the 105-day goal.
• It takes an average of 48 days for appeals on hearing decisions to reach the Appeals Council; this impacts the overall processing time goal as well as the percentage of appeals processed within 105 days. We are trying to determine the cause of this problem and a solution that will reduce that time.
Year Goal Actual
1999 NA 98
2000 NA 97
2001 103 87
Other Accompanying Information 139

• The expected benefits of a new case management process were not realized in FY 2001 due to lower than expected claims receipts.
Our near-term approach to achieving Appeals Council process improvement is three-fold:
• Increase productivity of current employees through differential case management and expedited decisionmaking initiatives;
• Increase workload capacity by adding resources, i.e., managers and new employees; and
• Where feasible, make adjustments to incoming workloads.
In the long term, we will put in place a more streamlined case processing system that takes full advantage of technology; improved operational planning; information analysis and management support; and investments in employee training and career development. We expect that both the Appeals Council average processing time and the percentage of claims processed within 105 days will improve in FY 2002, as additional benefits from our initiatives are realized. In FYs 2001-2004, we are obtaining and installing new information and technology systems. In addition, employees hired in FY 2001 will become more productive as they gain experience.
Data Definition: Effective FY 2001, this performance indicator represents the actual percentage of case dispositions issued during the report period in which the elapsed time from the date of the request for review to the disposition date was 105 days or less.
Data Source: Actual processing time for each case is maintained by the Appeals Council Automated Processing System (ACAPS). Percentages will be calculated from information extrapolated from ACAPS.
Performance Indicator 33: Average processing time for decisions on appeals of hearings issued (days).
FY 2001 Performance Discussion: We did not meet our goal. See discussion for the indicator directly above.
Data Definition: Effective FY 2001, this performance indicator represents the 12-month average processing time for dispositions issued during the report period. Processing time begins with the date of the request and ends with disposition date.
Data Source: Actual processing time for each case is maintained by the ACAPS. Percentages will be calculated from information extrapolated from ACAPS.
Year Goal Actual
1999 NA NA
2000 NA NA
2001 20% 12.2%
Year Goal Actual
1999 NA 458
2000 NA 505
2001 285 447
140 SSA’s FY 2001 Performance and Accountability Report

Performance Indicator 34: Number of decisions on appeals of hearings issued per workyear.
FY 2001 Performance Discussion: We did not meet our goal. However, we did implement new case processing procedures that will, in the long run, improve productivity. In FY 2001, we concentrated on processing a sizable number of aged cases, primarily those involving the most complex issues and requiring the longest processing times. Cases involving the most complex issues require more time for employees to review to ensure the highest level of quality. Clearing a significant volume of these older cases in FY 2001 resulted in reduced production from FY 2000 levels. We believe that our efforts to maintain and improve quality, and devote slightly more review time as we work through these aged and complex cases, is as important as our desire to increase productivity and will have long-term benefits. Our performance in FY 2001, especially clearing aged and complex cases, will provide a baseline for improvement and we are optimistic that we can improve. In addition to near term initiatives to improve productivity and reduce the time to process requests for review of hearing decisions, we are implementing a long-term plan to streamline the case processing system. This plan will take full advantage of technology; improve operational planning, information analysis and management support; and invest in employee training and career development.
Data Definition: Effective FY 2001, this indicator represents the average number of decisions on appeals of hearings processed per “direct” workyear expended. A direct workyear represents actual time spent processing cases. It does not include time spent on training, leave, holiday, etc. Decisions on appeals of hearings exclude decisions on new court cases, court remands, and quality assurance reviews.
Data Source: Appeals Council Case Control System and ACAPS.
Performance Indicator 35: Percent of OASI claims processed by the time the first regular payment is due or within 14 days from the effective filing date, if later.
FY 2001 Performance Discussion: We exceeded our goal. Our performance in adjudicating claims for OASI benefits improved again this year, building on the increases that occurred in the past three fiscal years. This performance reflects our continuing commitment to making timely and accurate payments to our OASI claims customers.
Year Goal Actual
1999 NA 231
2000 NA 284
2001 262 241
Year Goal Actual
1998 83% 82.6%
1999 83% 84.3%
2000 83% 86.9%
2001 83% 89.2%
Other Accompanying Information 141

Data Definition: This rate reflects the number of OASI applications completed through the SSA operational system (i.e., award or denial notices are triggered) before the first regular continuing payment is due or not more than 14 calendar days from the effective filing date, if later, divided by the total number of OASI applications processed. The first regular payment due date is based on the appropriate payment cycling date which may be the 3rd of the month, or the 2nd, 3rd or 4th Wednesday of the month.
Data Source: The MIICR System.
Performance Indicator 36: Percent of SSI Aged claims processed by the time the first payment is due or within 14 days of the effective filing date, if later.
FY 2001 Performance Discussion: We exceeded our goal. For a number of years, we have been steadily improving the timeliness of our SSI claims processing, and we met and exceeded our goal for the first time in FY 2000. We continued this progress again in FY 2001. This continuously improving performance demonstrates our commitment to paying our SSI Aged claimants in a timely manner.
Data Definition: (FY 2001 on) This rate reflects the number of SSI Aged applications completed through the SSA operational system (i.e., award or denial notices are triggered) before the first regular continuing payment is due or not more than 14 days from the effective filing date, if later, divided by the total number of SSI Aged applications processed. The first regular continuing payment due date is based on the first day of the month that all eligibility factors are met and payment is due.
Definition Before FY 2001: Percent of initial SSI Aged claims processed within 14 days of filing date. The rate reflected the number of SSI Aged applications completed through the SSA operational system (i.e., award or denial notices triggered) within 14 days of filing date, divided by the total number of SSI Aged applications processed.
Data Source: The Title XVI Operational Data Store System.
Performance Indicator 37: Percent of original and replacement SSN cards issued within 5 days of receiving all necessary documentation. We exceeded our goal. This indicator is Key Performance Indicator 7 in the Performance Goals and Results section of the MD&A. Please see page 43 for a detailed discussion.
Year Goal Actual
1998 66% 54.2%
1999 66% 63.5%
2000 66% 74.4%
2001 66% 79.9%
142 SSA’s FY 2001 Performance and Accountability Report
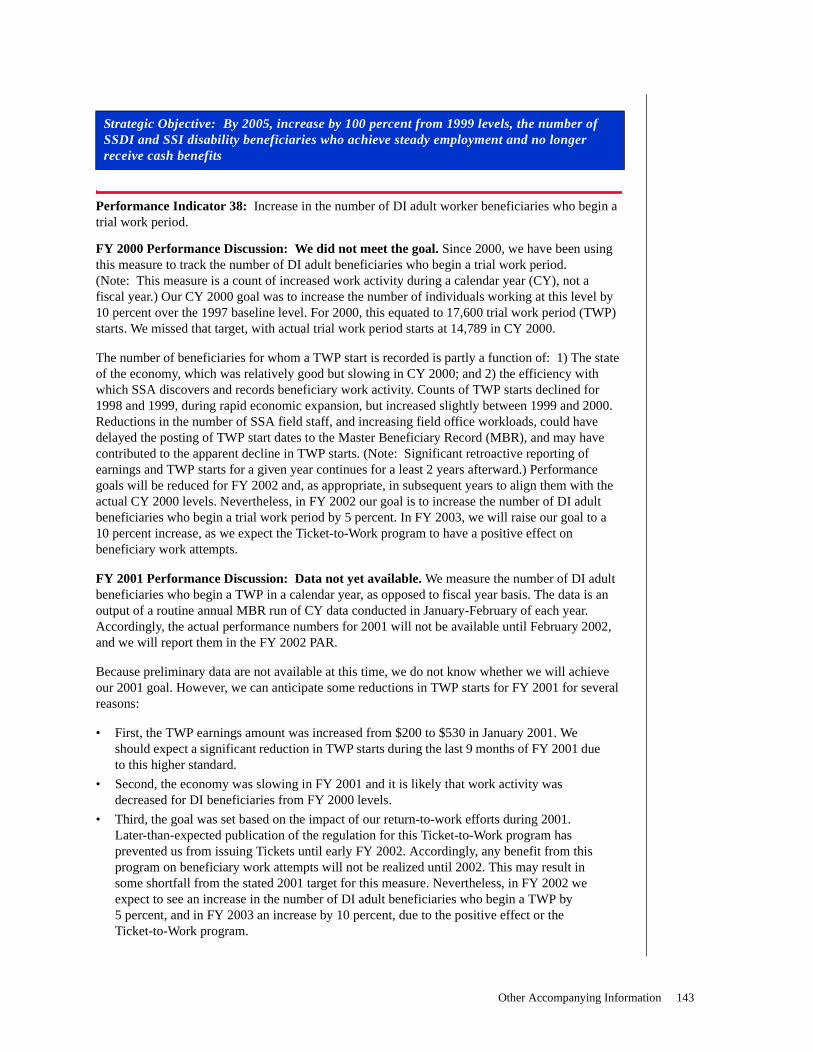
Strategic Objective: By 2005, increase by 100 percent from 1999 levels, the number of SSDI and SSI disability beneficiaries who achieve steady employment and no longer receive cash benefits
Performance Indicator 38: Increase in the number of DI adult worker beneficiaries who begin a trial work period.
FY 2000 Performance Discussion: We did not meet the goal. Since 2000, we have been using this measure to track the number of DI adult beneficiaries who begin a trial work period. (Note: This measure is a count of increased work activity during a calendar year (CY), not a fiscal year.) Our CY 2000 goal was to increase the number of individuals working at this level by 10 percent over the 1997 baseline level. For 2000, this equated to 17,600 trial work period (TWP) starts. We missed that target, with actual trial work period starts at 14,789 in CY 2000.
The number of beneficiaries for whom a TWP start is recorded is partly a function of: 1) The state of the economy, which was relatively good but slowing in CY 2000; and 2) the efficiency with which SSA discovers and records beneficiary work activity. Counts of TWP starts declined for 1998 and 1999, during rapid economic expansion, but increased slightly between 1999 and 2000. Reductions in the number of SSA field staff, and increasing field office workloads, could have delayed the posting of TWP start dates to the Master Beneficiary Record (MBR), and may have contributed to the apparent decline in TWP starts. (Note: Significant retroactive reporting of earnings and TWP starts for a given year continues for a least 2 years afterward.) Performance goals will be reduced for FY 2002 and, as appropriate, in subsequent years to align them with the actual CY 2000 levels. Nevertheless, in FY 2002 our goal is to increase the number of DI adult beneficiaries who begin a trial work period by 5 percent. In FY 2003, we will raise our goal to a 10 percent increase, as we expect the Ticket-to-Work program to have a positive effect on beneficiary work attempts.
FY 2001 Performance Discussion: Data not yet available. We measure the number of DI adult beneficiaries who begin a TWP in a calendar year, as opposed to fiscal year basis. The data is an output of a routine annual MBR run of CY data conducted in January-February of each year. Accordingly, the actual performance numbers for 2001 will not be available until February 2002, and we will report them in the FY 2002 PAR.
Because preliminary data are not available at this time, we do not know whether we will achieve our 2001 goal. However, we can anticipate some reductions in TWP starts for FY 2001 for several reasons:
• First, the TWP earnings amount was increased from $200 to $530 in January 2001. We should expect a significant reduction in TWP starts during the last 9 months of FY 2001 due to this higher standard.
• Second, the economy was slowing in FY 2001 and it is likely that work activity was decreased for DI beneficiaries from FY 2000 levels.
• Third, the goal was set based on the impact of our return-to-work efforts during 2001. Later-than-expected publication of the regulation for this Ticket-to-Work program has prevented us from issuing Tickets until early FY 2002. Accordingly, any benefit from this program on beneficiary work attempts will not be realized until 2002. This may result in some shortfall from the stated 2001 target for this measure. Nevertheless, in FY 2002 we expect to see an increase in the number of DI adult beneficiaries who begin a TWP by 5 percent, and in FY 2003 an increase by 10 percent, due to the positive effect or the Ticket-to-Work program.
Other Accompanying Information 143

Year Goal Actual
2000 10%
17,600 1.8%
14,789
2001 5%
15,528 NA
Data Definition: For FY 2000, this indicator represented the annual percentage increase in the number of DI adult worker beneficiaries who begin a TWP during CY 2000, as compared to the base year 1997, in which there were 16,000 TWP starts. Our CY 2000 goal was for a 10 percent increase over the base year performance. Effective FY 2001, this indicator represents the annual percentage increase over the prior calendar year’s actual level of 14,789, equivalent to 15,528 TWP starts. Our CY 2002 goal is a 5 percent increase over CY 2001 actual performance.
Data Source: Master Beneficiary Record.
Performance Indicator 39: Increase in the number of SSI disabled beneficiaries, aged 18-64, participating in 1619(a) status.
FY 2001 Performance Discussion: We did not meet our goal. This measure tracks the number of disabled individuals receiving SSI benefits who are working and earning at least $740 per month. Our FY 2001 goal was to increase the number of individuals working at this level by 5 percent. In FY 2001, the number of individuals working at this level fell from 25,772 to 24,816.
Several factors may have a role in causing the numbers to fall from FY 2000 to FY 2001. First, the economy has been in decline throughout FY 2001, and it is likely that jobs were harder for beneficiaries to find. Also, we had anticipated that the Ticket-to-Work program would be operational well before the end of the fiscal year, but its startup was delayed. While we hope that the Ticket program has an immediate impact on return-to-work among beneficiaries, it is not clear how long it will take for the Ticket program to catch on with beneficiaries and supporting service providers.
In FY 2002, we will continue to aim for a 5 percent increase over the actual number of beneficiaries in 1619(a) status in FY 2001. The FY 2002 target will be revised from 28,414 to 26,057 in our Revised Final FY 2002 Annual Performance Plan. If the economy improves over the next year, we could see a dramatic increase in the numbers of beneficiaries in 1619(a) status. If not, it is likely that the numbers will be fairly flat. In years beyond FY 2002, the impact of the Ticket-to-Work program should slowly emerge with corresponding increases in work activity reflected in more beneficiaries in 1619(a) status.
Year Goal Actual
2000 10%
21,744 25,772
2001 5%
27,061 24,816
144 SSA’s FY 2001 Performance and Accountability Report

Data Definition: Effective 2001, our goal is a 5 percent annual increase over the prior year’s performance in the number of SSI disabled beneficiaries aged 18-64 who are participating in 1619(a), i.e., working at the Substantial Gainful Activity level but still receiving benefits; for FY 2001 the equivalent of 27,061. Our FY 2002 goal is for a 5 percent increase over FY 2001, the equivalent of 26,057. Beginning FY 2003, our goal will be for 10 percent annual increases. In years prior to FY 2001, the indicator represented the annual percentage increase relative to the base year 1997. This Performance Indicator is an interim measure that will be replaced with the long-term Indicator: “Percent increase in the number of SSI disabled beneficiaries who no longer receive benefits due to work (1619(b) status) and have earnings of at least $740 per month.” This new long-term Indicator will be in our FY 2003 Final APP (issued in Spring 2002) and will be effective FY 2003.
Data Source: “SSI Disabled Recipients Who Work” report.
Performance Indicator 40: Activities to implement provisions of the Ticket-to-Work and Self-Sufficiency Program (TWSSP) and other employment strategies.
FY 2001 Goals: 1. Publish final regulations for Ticket-to-Work Program. 2. Distribute Tickets to beneficiaries in Phase 1 States.
FY 2001 Performance Discussion: We did not meet our goals. The TWSSP is a new program that began in FY 2001. It provides Tickets to pay for service providers who will help beneficiaries return to work. The service provider will be paid only if the beneficiary leaves the disability rolls due to work or meets certain milestone criteria. A grants program will help beneficiaries gain employment. During FY 2001, we made significant progress in building the infrastructure necessary to issue Tickets in the first round of States that will participate in the program. Our goal was to start distributing Tickets in a first round of States in FY 2001, with the second round of distribution to States in FY 2002, and the third round in FY 2003. In order to begin this Ticket distribution, final regulations must be published authorizing this activity and describing the rules for the program. When we set this goal in late 2000, we expected to have the final regulation published by mid-2001 at the latest. However, the process of responding to over 500 comments on the Notice of Proposed Rule Making (i.e., proposed regulation) for the Ticket program took much longer than anticipated. The draft final regulation went to the Office of Management and Budget (OMB) in mid-August 2001. We continue to work with OMB on finalizing the regulations, and we hope to be able to issue Tickets to beneficiaries in early FY 2002. The delay in meeting these two goals will not impact our ability to continue to rollout the Ticket program as originally planned. As per the original schedule, we will issue the second round of Tickets in FY 2002.
Data Definition: This indicator represents the milestones in implementing provisions of the TWSSP and other employment strategies.
Data Source: New data system being developed to allow SSA to administer the Ticket-to-Work program.
Other Accompanying Information 145

Strategic Goal: o ensure the integrity of Social Security programs, with zero tolerance for fraud and abuse
Strategic Objective: To make benefit payments in the right amount, specifically:
• Maintain through 2002 the accuracy of OASI payment outlays;
• Maintain or improve through 2002 the accuracy of DI payment outlays; and
• By 2002, raise to 96 percent the accuracy of SSI payment outlays
T
Performance Indicator 41: Dollar accuracy of OASDI payment outlays: Percent without overpayments and percent without underpayments.
FY 2000 Performance Discussion: We met and exceeded our goals for payment outlays without overpayments and without underpayments. For several years, we have continued to maintain this high level of dollar accuracy of OASI payment outlays.
FY 2001 Performance Discussion: FY 2001 data is not available at this time and will be reported in the FY 2002 PAR. In FY 2000 and FY 2001, we continued our progress in increasing automation and providing OASI training, as well as monitoring our processes to identify and correct any problem that might affect our payment accuracy. We believe that these initiatives will continue to provide the necessary support to maintain this high level of accuracy into FY 2002 and beyond. Beginning in FY 2001, we expanded our payment accuracy measure to include the accuracy of benefits paid to DI beneficiaries. We have in place an action plan to continuously improve DI payment accuracy and expect to meet our FY 2002 goals of 99.8 percent for OASDI payments without overpayments and underpayments.
Percent without overpayments
Percent without underpayments
Year Goal Actual
1998 99.8% 99.9%
1999 99.8% 99.8%
2000 99.8% 99.9%
2001 99.7% NA
Year Goal Actual
1998 99.8% 99.9%
1999 99.8% 99.9%
2000 99.8% 99.9%
2001 99.8% NA
146 SSA’s FY 2001 Performance and Accountability Report

Data Definition: Stewardship accuracy is divided into accuracy for payment dollars without overpayments and accuracy for payment dollars without underpayments. The overpayment accuracy is computed by subtracting the overpayment dollars paid for the FY from the dollars paid and dividing the remainder by the dollars paid ((dollars paid - o/p dollars)/dollars paid). This error rate is subtracted from 100 percent to attain the accuracy rate. Similarly, the underpayment accuracy is computed by subtracting the underpayment dollars paid for the FY from the dollars paid and dividing the remainder by the dollars paid ((dollars paid - u/p dollars)/dollars paid). This error rate is subtracted from 100 percent to attain the accuracy rate. Prior to FY 2001, the accuracy of only OASI outlays was included. Effective FY 2001, the non-medical accuracy of DI outlays was added to the measure. The General Accounting Office (GAO) raised a concern that combining payment accuracy data from the OASI and the DI programs may affect SSA’s ability to sufficiently monitor and manage performance. While the Annual Performance Report combines data from these two programs, stewardship reports continue to include the accuracy of OASI and DI payment outlays separately. We still have data available to discretely monitor and manage performance in both the OASI and the DI programs. For our monitoring and management purposes, there is no danger that the accuracy of each of these programs will be obscured by the GPRA reporting of the combined goal.
Data Source: OASDI Stewardship Report.
Performance Indicator 42: DDS net decisional accuracy rate.
FY 2000 Performance Discussion: We did not meet our goal even though SSA and the DDSs continue to focus on achieving a high level of quality of allowance decisions, through ongoing training initiatives that foster consistent application of laws, regulations and rulings at all stages of the disability adjudication process. FY 2000 marked the third successive year in which available resources were not sufficient to address all incoming disability claims, and backlogs continued to rise. The DDSs were under considerable pressure to keep cases moving, and this resulted in less than the desired level of development, which impacts accuracy rates. This pressure particularly affected denial accuracy because of the additional documentation requirements that must be met.
FY 2001 Performance Discussion: Data not yet available. This indicator measures the percentage of correct decisions issued by the State DDSs, both allowances and denials. Data will be available in January 2002 and the actual FY 2001 performance will be reported in the FY 2002 PAR. The performance goal was set at an approximate target level, and the deviation from that goal is expected to be slight. There will be no effect on overall program or activity performance. This indicator will be discontinued in FY 2002, leaving two more detailed performance accuracy indicators and goals: DDS allowance performance accuracy rate and DDS denial performance accuracy rate (see the following two indicators). The data will be more timely and in line with key recommendations made by the Office of the Inspector General, GAO and others.
Year Goal Actual
1998 NA 96.2%
1999 NA 96.7%
2000 97% 96.4%
2001 97% NA
Other Accompanying Information 147

Data Definition: This indicator measures the percentage of correct decisions issued by the State DDSs, both allowances and denials. The DDS net decisional accuracy of disability claims - both DI and SSI - reflects the percentage of correct initial determinations - both allowances and denials -issued by State DDSs.
Data Source: Annual Disability Quality Assurance Reports.
Performance Indicator 43: DDS allowance performance accuracy rate.
FY 2001 Performance Discussion: We met this goal. This measure reflects the percentage of initial disability allowances that do not have to be returned to the DDSs for development of additional documentation or correction of the disability determination. We met this goal because SSA and the DDSs continue to focus on achieving a high level of quality on allowance decisions. Ongoing training initiatives that foster consistent application of laws, regulations and rulings at all stages of the disability adjudication process have been particularly effective. We expect to maintain high levels of allowance quality in FY 2002.
Data Definition: The allowance accuracy rate reflects the estimated percentage of initial disability allowances that do not have to be returned to the DDSs for development of additional documentation or correction of the disability determination.
Data Source: Annual Disability Quality Assurance Reports.
Performance Indicator 44: DDS denial performance accuracy rate.
FY 2001 Performance Discussion: We did not meet this goal. This measure reflects the percentage of initial disability denials that do not have to be returned to the DDSs for development of additional documentation or correction of the disability determination. We did not meet this goal even though SSA and the DDSs continue to focus on achieving a high level of quality on allowance decisions, through ongoing training initiatives that foster consistent application of laws, regulations and rulings at all stages of the disability adjudication process. FY 2001 marked the fourth successive year in which available resources were not sufficient to address all incoming disability claims, and backlogs continued to rise. The DDSs were under considerable pressure to keep cases moving, and this resulted in less than the desired level of development which impacted accuracy rates. This pressure particularly affected denial accuracy because of the additional documentation requirements that must be met. In FY 2002, resource issues could impact our ability to meet our 93.5 percent goal for this indicator.
Year Goal Actual
1998 NA 96.1%
1999 NA 96.5%
2000 NA 97%
2001 96.5% 96.8%
148 SSA’s FY 2001 Performance and Accountability Report

Year Goal Actual
1998 NA 92.3%
1999 NA 93%
2000 NA 92.4%
2001 93.5% 92%
Data Definition: The denial accuracy rate reflects the estimated percentage of initial disability denials that do not have to be returned to the DDSs for development of additional documentation or correction of the disability determination.
Data Source: Annual Disability Quality Assurance Reports.
Performance Indicator 45: OHA decisional accuracy rate.
FY 2000 Performance Discussion: We met and exceeded this goal by taking a number of steps to enhance the quality of adjudication of hearings decisions, including ongoing training initiatives for decisionmakers and quality reviews of hearings decisions. The quality reviews are done at two points in the hearings decision adjudication process and involve: 1) ALJ participation in peer reviews of hearings decisions; and 2) ALJ quality reviews of allowance decisions before they are effectuated. These in-depth evaluations demonstrate our commitment to quality. By meeting our FY 2000 decisional accuracy goal and maintaining an 88 percent accuracy rate for two years in a row, we have demonstrated our progress in improving the quality of our ALJ decisions and the value of our training and evaluation initiatives. We have come a long way from the 81 percent accuracy rate seen in our first ALJ peer review in 1995.
FY 2001 Performance Discussion: Data not yet available. The data for this goal will be available in January 2002 and will be reported in the FY 2002 PAR. We believe we will meet this goal by continuing to take steps to enhance the quality of adjudication of hearings decisions, including ongoing training initiatives for decisionmakers and quality reviews of hearings decisions. By historically meeting our decisional accuracy goal, and maintaining an 88 percent accuracy rate since 1999, we demonstrated our progress in improving the quality of our ALJ decisions and the value of our training and evaluation initiatives. Accordingly, we expect to meet our FY 2001 goal and the planned quality rate increases to 89 percent and 90 percent for FY 2002 and FY 2003. In FY 2001, we continued to work toward improving our OHA decisional accuracy rate.
Year Goal Actual
1998 85% 87%
1999 85% 88%
2000 87% 88%
2001 88% NA
Other Accompanying Information 149
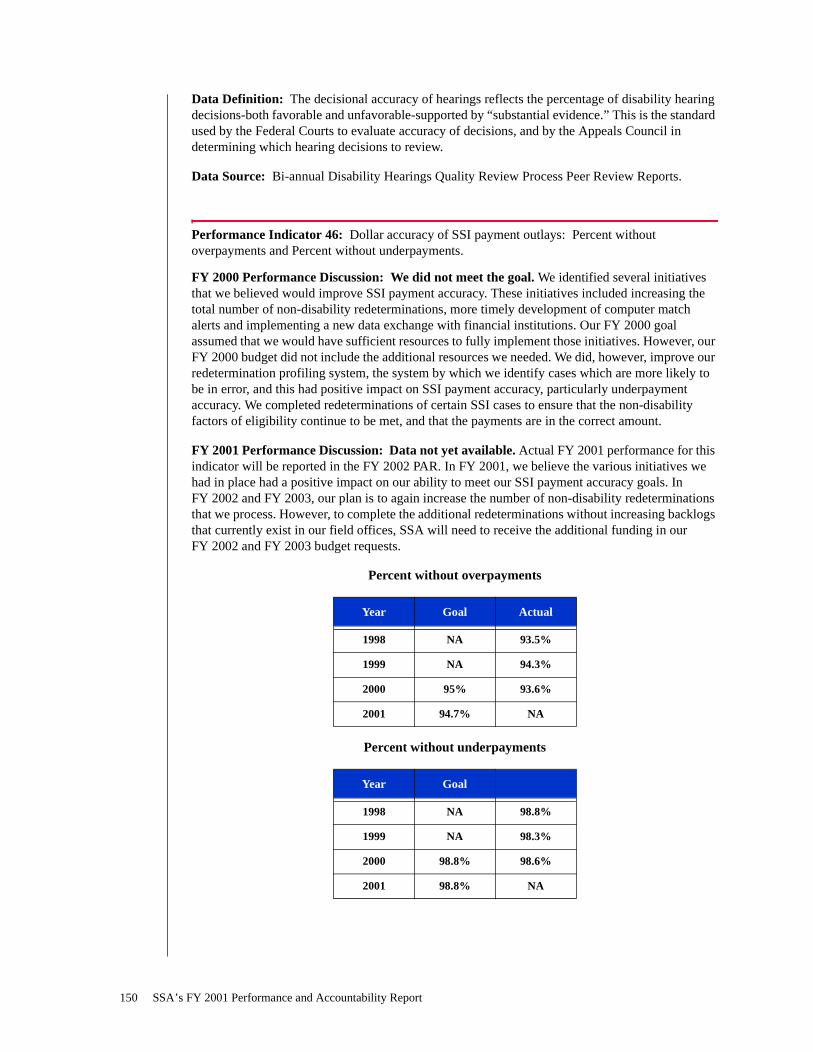
Data Definition: The decisional accuracy of hearings reflects the percentage of disability hearing decisions-both favorable and unfavorable-supported by “substantial evidence.” This is the standard used by the Federal Courts to evaluate accuracy of decisions, and by the Appeals Council in determining which hearing decisions to review.
Data Source: Bi-annual Disability Hearings Quality Review Process Peer Review Reports.
Performance Indicator 46: Dollar accuracy of SSI payment outlays: Percent without overpayments and Percent without underpayments.
FY 2000 Performance Discussion: We did not meet the goal. We identified several initiatives that we believed would improve SSI payment accuracy. These initiatives included increasing the total number of non-disability redeterminations, more timely development of computer match alerts and implementing a new data exchange with financial institutions. Our FY 2000 goal assumed that we would have sufficient resources to fully implement those initiatives. However, our FY 2000 budget did not include the additional resources we needed. We did, however, improve our redetermination profiling system, the system by which we identify cases which are more likely to be in error, and this had positive impact on SSI payment accuracy, particularly underpayment accuracy. We completed redeterminations of certain SSI cases to ensure that the non-disability factors of eligibility continue to be met, and that the payments are in the correct amount.
FY 2001 Performance Discussion: Data not yet available. Actual FY 2001 performance for this indicator will be reported in the FY 2002 PAR. In FY 2001, we believe the various initiatives we had in place had a positive impact on our ability to meet our SSI payment accuracy goals. In FY 2002 and FY 2003, our plan is to again increase the number of non-disability redeterminations that we process. However, to complete the additional redeterminations without increasing backlogs that currently exist in our field offices, SSA will need to receive the additional funding in our FY 2002 and FY 2003 budget requests.
Percent without overpayments
Percent without underpayments
Year Goal Actual
1998 NA 93.5%
1999 NA 94.3%
2000 95% 93.6%
2001 94.7% NA
Year Goal Actual
1998 NA 98.8%
1999 NA 98.3%
2000 98.8% 98.6%
2001 98.8% NA
150 SSA’s FY 2001 Performance and Accountability Report

Data Definition: The SSI payment accuracy rate is determined by an annual review of a statistically valid sample of the beneficiary rolls. Separate rates are determined for the accuracy of payments with overpayment dollars and the accuracy of payments with underpayment dollars. The rates are computed by dividing the dollars overpaid or dollars underpaid by the total dollars paid for the fiscal year. This percentage is subtracted from 100 percent to attain the accuracy rate. The current measurement system captures only the accuracy of the non-medical aspects of eligibility for SSI payment outlays.
Data Source: SSI Stewardship Report.
Performance Indicator 47: Percent of Social Security numbers issued accurately.
FY 2000 Performance Discussion: We did not meet our goal. We issued 99.7 percent of SSNs accurately. The difference in accuracy from prior years’ performance is not statistically significant. We are, however, continuing efforts to improve the quality of the enumeration process through continuing reminder items focused on deficiencies identified in quality reviews and enumeration studies, and through the activities of SSA’s enumeration task force that is identifying both short- and long-term changes to improve the accuracy and integrity of the enumeration process.
FY 2001 Performance Discussion: Data not yet available. Actual FY 2001 performance for this indicator will be reported in the FY 2002 PAR.
Data Definition: The percentage rate for SSNs issued accurately is based on an annual review of a sample of approximately 2,000 SSN applications to verify that the applicant has not been issued an SSN that belongs to someone else, or that multiple SSNs assigned to the same applicant have been cross-referred. The data excludes SSNs assigned via the Enumeration-at-Birth process and major errors identified by the Office of Quality Assurance that do not result in an SSN card being issued erroneously.
Data Source: Enumeration Process Quality Review Report.
Strategic Objective: To become current with DI and SSI CDR requirements by 2002
Performance Indicator 48: Percent of multi-year (FY 1996 - 2002) CDR plan completed. We met our goal. This indicator is Key Performance Indicator 9 in the Performance Goals and Results section of the MD&A. Please see page 45 for a detailed discussion.
Year Goal Actual
1998 99.8% 99.8%
1999 99.8% 99.8%
2000 99.8% 99.7%
2001 99.8% NA
Other Accompanying Information 151

Strategic Objective: To maintain through 2002, current levels of accuracy and timeliness in posting earnings data to individuals’ earnings records
Performance Indicator 49: Percent of wage items posted to individuals’ records bySeptember 30.
FY 2000 Performance Discussion: We met our goal. In the FY 2000 Performance and Accountability Report, we stated that we did not meet our FY 2000 goal of posting 98 percent ofwage items to individual records by September 30. We reported that the calculation of our FY 2000performance was based on an estimated number of items to be posted, and that the actual number ofitems would not be known until January 2001. Our Actuary estimated that 251 million wage itemswould be posted for tax year (TY) 1999. The actual number of wage items posted when the database closed in January was 248 million. We can now report that we did, in fact, meet andexceed our goal of 98 percent, with an actual posting of 98.9 percent of wage items bySeptember 30, 2000.
FY 2001 Performance Discussion: We met and exceeded our goal. SSA’s FY 2001 goal of 98 percent relates to the number of TY 2000 earnings items posted through September 30, 2001, divided by the estimated total earnings items to be posted for TY 2000. As of September 30, 2001,SSA had posted 99.3 percent of the estimated 253,900,000 wage items to be posted. The totalnumber of wage items posted for TY 2000 will not be known until the database closes inJanuary 2002. However, at this point in time, we believe final data will show that SSA has matched(if not exceeded) its FY 2000 accomplishment of posting nearly 99 percent by September 30.
Data Definition: The computation of this rate is the number of prior tax year wage items posted bythe end of September divided by the number of prior tax year wage items posted by the end of the processing year (mid-January). Wage items include W-2s, tips, earnings in excess of taxable maximum wages, etc.
Note: Tracking throughout the year is based on estimates of potential receipts, compared to actualitems processed by the posting system. The actual performance reported in the FY 1999 and 2000 Performance and Accountability Report is based on the updated estimates compared to the actual items processed. Each year, once all known earnings reports have been received, performance isrecalculated based on actual data. For this reason, the actual FY 2000 performance for this measure has now been updated based on the recalculation using actual data. Accordingly, beginning FY 2001, we will post performance under “Estimated” performance until all earnings reports are received and the recalculation is based on actual data.
Data Source: Earnings Posted Overall Cross Total/Year-to-Date System (EPOXY).
Year Goal Actual
1998 98% 98.5%
1999 98% 92.9%
2000 98% 98.9%
2001 98% 99.3%
152 SSA’s FY 2001 Performance and Accountability Report

Performance Indicator 50: Percent of earnings posted correctly. We met our goal. This indicator is Key Performance Indicator 10 in the Performance Goals and Results section of the MD&A. Please see page 46 for a detailed discussion.
Performance Indicator 51: Percent of employee reports (W-2s) filed electronically.
FY 2001 Performance Discussion: We exceeded our goal to a significant degree. In FY 2001, we received electronically more than 27 percent of the annual wage reports for TY 2000, amounting to 68.5 million W-2s, with over 24 million of those submitted over the Internet. Our continuing efforts to encourage more employers to convert to electronic wage reporting, and our offering of improved services and customer support, have contributed significantly to our success this year. In 2001, we introduced expanded web-based employer information services, an Integrated Registration for Employers and Submitters process, the ability to upload wage reports, and the ability to download from the Internet a self-test AccuWage software product to check the accuracy of the wage reporting format. We also piloted the use of Public Key Infrastructure to provide additional data security for employer wage reporting via the Internet. These efforts are expected to continue to improve so that SSA will meet the increasing goals set for this performance measure. This year’s performance is a good sign for achieving the goals set for electronic reporting over the next few years.
Data Definition: The computation of this rate is the number of W-2s filed electronically and processed to completion for a tax year divided by the total number of W-2s for that tax year processed to completion by the end of the processing year (mid-January).
Data Source: Earnings Management Information Operational Data Store (EMODS) reports.
Strategic Objective: Aggressively deter, identify, and resolve fraud
Performance Indicator 52: Number of investigations conducted (i.e., closed).
FY 2001 Performance Discussion: We met and substantially exceeded our goal. In FY 2001, we showed a significant increase in the number of Office of the Inspector General’s (OIG) investigations conducted and closed. This increase is largely due to the expansion of some national investigative efforts such as those associated with the OIG’s fugitive felon program and the Cooperative Disability Investigative (CDI) teams. The OIG continues to increase the number of CDI teams in operation each year. This annual increase has resulted in annual rises in productivity and results. The OIG continues to review productivity reports to determine if future performance goals are realistic. Based on past history, it appears that the goal set for FY 2002 continues to be appropriate.
Year Goal Actual
1999 NA 6.6%
2000 NA 18.4%
2001 20% 27%
Other Accompanying Information 153
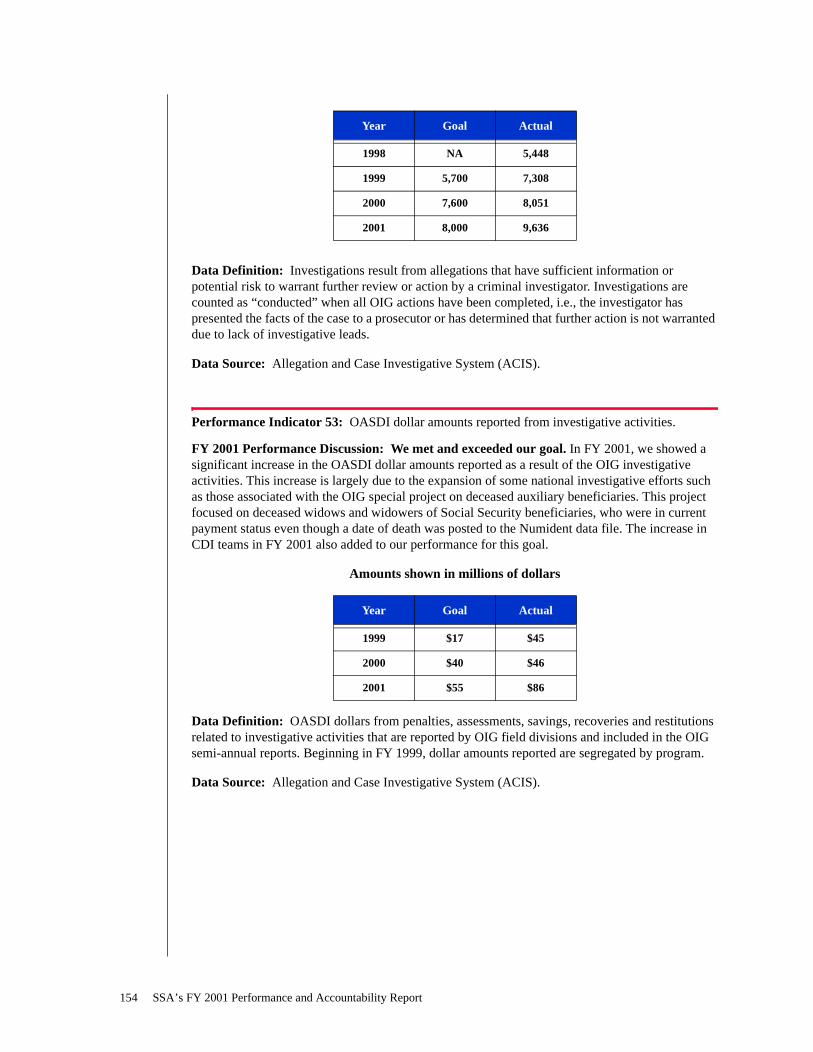
Year Goal Actual
1998 NA 5,448
1999 5,700 7,308
2000 7,600 8,051
2001 8,000 9,636
Data Definition: Investigations result from allegations that have sufficient information or potential risk to warrant further review or action by a criminal investigator. Investigations are counted as “conducted” when all OIG actions have been completed, i.e., the investigator has presented the facts of the case to a prosecutor or has determined that further action is not warranted due to lack of investigative leads.
Data Source: Allegation and Case Investigative System (ACIS).
Performance Indicator 53: OASDI dollar amounts reported from investigative activities.
FY 2001 Performance Discussion: We met and exceeded our goal. In FY 2001, we showed a significant increase in the OASDI dollar amounts reported as a result of the OIG investigative activities. This increase is largely due to the expansion of some national investigative efforts such as those associated with the OIG special project on deceased auxiliary beneficiaries. This project focused on deceased widows and widowers of Social Security beneficiaries, who were in current payment status even though a date of death was posted to the Numident data file. The increase in CDI teams in FY 2001 also added to our performance for this goal.
Amounts shown in millions of dollars
Data Definition: OASDI dollars from penalties, assessments, savings, recoveries and restitutions related to investigative activities that are reported by OIG field divisions and included in the OIG semi-annual reports. Beginning in FY 1999, dollar amounts reported are segregated by program.
Data Source: Allegation and Case Investigative System (ACIS).
Year Goal Actual
1999 $17 $45
2000 $40 $46
2001 $55 $86
154 SSA’s FY 2001 Performance and Accountability Report

Performance Indicator 54: SSI dollar amounts reported from investigative activities.
FY 2001 Performance Discussion: We met and substantially exceeded our goal. In FY 2001, we showed a significant increase in the SSI dollar amounts reported as a result of the OIG investigative activities. This increase is largely due to the expansion of some national investigative efforts such as those associated with the OIG’s fugitive felon program and the CDI teams. The OIG continues to increase the number of CDI teams in operation each year. These annual increases have contributed to annual rises in productivity and results. The OIG continues to review productivity reports to determine if future performance goals are realistic. Based on past history, it appears that the goal set for FY 2002 continues to be appropriate.
Amounts shown in millions of dollars
Data Definition: SSI dollars from penalties, assessments, savings, recoveries and restitutions related to investigative activities that are reported by OIG field divisions and included in the OIG semi-annual reports. Beginning FY 1999, dollar amounts reported are segregated by program.
Data Source: Allegation and Case Investigative System (ACIS).
Performance Indicator 55: Number of criminal convictions. We met and exceeded our goal. This indicator is Key Performance Indicator 11 in the Performance Goals and Results section of the MD&A. Please see page 47 for a detailed discussion.
Strategic Objective: To increase debt collections by 7 percent annually through 2002
Performance Indicator 56: OASDI debt collected.
FY 2001 Performance Discussion: We did not meet our goal. While SSA’s objective in managing the OASDI program is to achieve the highest accuracy rate possible, it is inevitable that some debt will be created because of the dynamics of the programs. Our stewardship responsibilities require that we recover as much of this debt as possible. Each year since FY 1998, our aim has been to increase OASDI debt collections by an average of 7 percent. Due to annual fluctuations in available debt and the impact of SSA’s efforts to prevent and detect debt, the year-to-year increase in the amount of debt collected will vary above and below the average of 7 percent. In FY 2001, we did not meet our goal; we recovered $1,121.1 million in OASDI debt. We did not meet our goal because the actual amount of OASDI debt available for collection was reduced in FY 2001. This reduction was due to the elimination of the retirement test and subsequent reduction in overpayments due to previously unreported beneficiary earnings from work. Our recovery of a substantial amount of OASDI debt was due, however, to our effective use of available debt recovery tools. Beginning in FY 2002, we will eliminate this indicator and replace it with a measure that better expresses our performance and is a better management tool. The new
Year Goal Actual
1999 $18 $140
2000 $80 $128
2001 $90 $129
Other Accompanying Information 155

debt collection measure will establish a targeted percentage of outstanding OASDI debt that is in a repayment agreement, under appeal, or newly detected, versus debt that is in pursuit. We are currently developing baseline data and will publish our new measure in Spring 2002 in our FY 2003 Annual Performance Plan.
Amounts shown in millions of dollars
Data Definition: Overpayment collections for the combined total of the OASI and DI programs.
Data Source: Data are extracted from the Recovery of Overpayment Accounting Reporting (ROAR) system.
Performance Indicator 57: SSI debt collected.
FY 2001 Performance Discussion: We met our goal. While SSA’s objective in managing the SSI program is to achieve the highest accuracy rate possible, it is inevitable that some debt will be created because of the dynamics of the programs. Our stewardship responsibilities require that we recover as much of this debt as possible. Each year since FY 1998, our aim has been to increase SSI debt collections by an average of 7 percent. Due to annual fluctuations in available debt and the impact of SSA’s efforts to prevent and detect debt, the year-to-year increase in the amount of debt collected will vary above and below the average of 7 percent. In FY 2001, we met our goal; we recovered $795.5 million in SSI debt. Our recovery of this substantial amount of SSI debt was due to our effective use of available debt recovery tools. Beginning in FY 2002, we will eliminate this indicator and replace it with a measure that better expresses our performance and is a better management tool. The new debt collection measure will establish a targeted percentage of outstanding SSI debt that is in a repayment agreement, under appeal, or newly detected, versus debt that is in pursuit. We are currently developing baseline data and will publish our new measure in Spring 2002 in our FY 2003 Annual Performance Plan.
Amounts shown in millions of dollars
Data Definition: Overpayment collections for the combined total of the SSI-Federal and SSI-State programs.
Data Source: Data are extracted from the Supplemental Security Record (SSR) and Overpayment/ Underpayment Processing System (OUPS).
Year Goal Actual
1998 NA $1,103.4
1999 NA $1,191.5
2000 $1,274.9 $1,343.5
2001 $1,364.1 $1,121.1
Year Goal Actual
1998 NA $539.2
1999 NA $640.0
2000 $684.8 $701.6
2001 $732.7 $795.5
156 SSA’s FY 2001 Performance and Accountability Report

Strategic Goal: To be an employer that values and invests in each employee
Strategic Objective: To provide the necessary tools and training to achieve a highly skilled and high-performing workforce
Performance Indicator 58: Percent of offices with direct access to Interactive Video Teletraining (IVT).
FY 2001 Performance Discussion: We did not meet the goal. Prior to FY 2001, our goal was to equip SSA offices with IVT so that employees would be within a 30-minute commuting distance. Beginning in FY 2001, we redefined our goal so that employees would have access to IVT in their home offices, and would be able to receive the training they need without having to travel to other locations. The net result will be the ability to address growing individual training needs while concurrently meeting increased workload demands. In FY 2001, we set our goal at 67 percent of all offices having direct IVT access. However, we fell short of that goal due to a number of factors outside of our direct control, including a delay in converting sites to frame relay, an inability to get the satellite signal to particular sites, blockage of the satellite signal, and non-cooperation of landlords. We must have permission to install a dish on the roof and run cabling through the building at leased locations. We were unable to obtain such approvals at a number of sites. We have increased the universe of sites that we will enable with IVT from 1,500 to 1,630 to include sites not originally scheduled due to size, and sites initially believed capable of sharing IVT access. Taking into account FY 2001 installations and the increase in the universe of sites, our FY 2002 goal is to have direct access to IVT at 76 percent of SSA offices.
Data Definition: This goal for equipping SSA’s offices with IVT has been redefined effective FY 2001. The prior goal was defined as access to IVT in offices within a 30-minute commute. The new Indicator is defined as direct access to IVT in each office. The total number of sites planned for installation number approximately 1,630. Employees will receive the training they need without having to travel to other locations. The net result will be the ability to address growing individual training needs while concurrently meeting increased workload demands.
Data Source: Office of Training records.
Year Goal Actual
1999 NA NA
2000 NA NA
2001 67% 57.7%
Other Accompanying Information 157

Performance Indicator 59: Formal management development programs implemented.
FY 2001 Goal: All leadership programs continued. Decisions on future Senior Executive Staff/Candidate Development Program & Advanced Leadership Program have yet to be made.
FY 2001 Performance Discussion: We met the goal. To maintain a highly skilled, high performing, and highly motivated workforce to achieve our mission, we are providing career development opportunities to our best employees to prepare them for management, leadership and other positions. During FY 2001, all leadership programs continued as stated in the goal.
• Employees continued to participate in the Leadership Development Program (LDP). Approximately 50 percent of all LDP participants have been promoted into leadership positions.
• The Advanced Leadership Program (ALP) was announced in Spring 2001 and approximately 70 people were selected for the program in September 2001.
The next Senior Executive Service Candidate Development Program will be announced by December 2001. The next LDP is expected to be announced by January 2002. As part of our comprehensive employee development agenda, new development programs will continue to be announced on a regular basis. These programs continue to receive the staff support and budget resources needed for assignments and training. We are on target with plans for the selection process for upcoming programs and also to provide staff support for those selected. Evaluations of the effectiveness of the programs are being done on an ongoing basis. Evaluations of the candidates’ performance are also completed regularly.
Data Definition: Goals for this indicator represent milestones, i.e., announcement selection and implementation for management development programs
Data Source: Office of Training Records
Performance Indicator 60: Percent of managerial staff participating in management/leadership development experiences.
FY 2001 Performance Discussion: We did not meet the goal, due to extraordinary circumstances outside our control. Actual performance achieved during FY 2001 was 28 percent. One-day seminars were scheduled for delivery to one-third of all SSA managers and supervisors nationwide, but were only delivered to 28 percent of managerial staff. Various highly rated vendors provided training on leadership competencies valued by SSA. The sessions were delivered beginning in April 2001 and were all scheduled to end by September 2001, in all 10 SSA regions and Headquarters. However, the training scheduled for September was deferred following the events of September 11 and the subsequent travel restrictions. As soon as funds become available, we will reschedule classes.
Pending the availability of travel and tuition funds, we expect to achieve the one-third goal for FY 2002. At the end of FY 2002, the 3-year cycle of training one-third of SSA managers/ supervisors per year, which began in FY 2000, will be completed. We are eliminating this indicator effective FY 2002 in favor of more challenging indicators focusing on developing employee competencies to support our long-range service vision.
158 SSA’s FY 2001 Performance and Accountability Report

Year Goal Actual
1999 NA 60%
2000 33 1/3% 33 1/3%
2001 33 1/3% 28%
Data Definition: Number of managerial employees, those with position descriptions designated as supervisory, who participate in at least one training experience during a fiscal year. Initially all managerial employees will receive an experience over a two-year period, with an ongoing goal of 1/3 annually beginning in FY 2000.
Data Source: Office of Training counts.
Strategic Objective: To provide a physical environment that promotes the health and well-being of every employee
Performance Indicator 61: Percent of employees reporting they are satisfied with the level of security in their facility.
FY 2000 Performance Discussion: We met our goal. A component of SSA’s comprehensive safety program is a biennial survey to determine employees’ perceptions of the level of security intheir workplaces. The first agencywide survey of randomly selected employees was conducted in FY 1996, with actual satisfaction reported at 64 percent. A second survey was conducted in FY 1998, after completion of the majority of security upgrades and changes identified in the security contractor’s reports, and actual satisfaction was reported at 74.4 percent. A third survey inFY 2000 was used to identify any areas where employee perceptions may have changed; actual satisfaction was reported at 78.5 percent. Compared to survey data collected in 1996 and 1998, a larger proportion of SSA employees now feel safe and secure in their work environment. Webelieve the goal was exceeded because of the cumulative effect of physical security enhancements.
FY 2001 Performance Discussion: No actual performance will be measured for FY 2001. Since this is a biennial survey, we have collected the levels of employee satisfaction with security for FY 1996, 1998 and 2000. We did not collect this data for FYs 1997, 1999, or 2001. Although no data was collected for those years, we continued in FY 2001 to make additional security enhancements based on data collected in the FY 2000 survey. This performance indicator is discontinued effective FY 2002 and will be incorporated in the more-comprehensive performance indicator “Percent of employees who are satisfied with their overall physical environment, i.e., it is professional, accessible, safe and secure.”
Year Goal Actual
1998 64% 74%
1999 70% NA
2000 75% 78.5%
2001 75% NA
Other Accompanying Information 159

Data Definition: Results of biennial employee surveys determined the perception employees have of physical and protective security. The computation of this rate is the number of employees who rate security as satisfactory or better, divided by the total number of employees responding to that question. Because this is a biennial survey, no actual results are collected and reportable for FY 1999 or FY 2001.
Data Source: SSA Employee Physical Security Survey
Performance Indicator 62: Percent of environmental air quality surveys completed and percent of corrective actions taken when called for.
FY 2001 Performance Discussion: We met our goals. We achieved the FY 2001 goals for surveying 20 percent of facilities and implementing 75 percent of corrective actions as called for in the indoor air quality reports filed on these sites. This activity involves collecting indoor air quality screening information at all SSA field and hearings offices. When baseline screening identifies potential air quality problems, a comprehensive indoor air quality survey is conducted and resolution/remediation of the condition is undertaken. We were successful in meeting our 75 percent corrective action goal with adequate FY 2001 funding levels. This performance indicator is discontinued effective FY 2002 and will be incorporated in the more-comprehensive performance indicator “Percent of employees who are satisfied with the overall physical environment, i.e., it is professional, accessible, safe and secure.” This new indicator better assesses employees’ satisfaction with their overall working environment.
Facilities Surveyed
Data Definition: Indoor air quality surveys are conducted in 20 percent of the non-headquarters facilities each year. The percent of surveys completed is based on 1,800 surveys: (1,500 facilities and an allowance for 300 potential additional surveys required for offices that relocate).
Data Source: Comprehensive Indoor Air Quality Surveys.
Percent Corrective Actions Taken
Data Definition: The percent of corrective actions taken is the result of dividing the number of required corrective actions taken and interim protective measures that have been implemented by the total number of required corrective actions identified by the surveys.
Data Source: Comprehensive Indoor Air Quality Surveys.
Year Goal Actual
1999 20% 37%
2000 20% 20.6%
2001 20% 20%
Year Goal Actual
1999 75% 76%
2000 75% 76.6%
2001 75% 76.3%
160 SSA’s FY 2001 Performance and Accountability Report

Performance Indicator 63: Number of facilities having water quality testing and percent of corrective action taken when called for.
FY 2001 Performance Discussion: We exceeded our goal. We exceeded our goal of testing water in 42 facilities and completing 100 percent of corrective actions when required. This activity involves testing field offices and hearings offices for lead, copper, and other contaminants in water, and then funding and undertaking remediation of potential or actual problems at individual sites. Prior to FY 2001, we completed testing in the majority of the offices in the SSA facility inventory. In FY 2001, we tested those offices not previously tested. We will continue conducting water testing in newly relocated offices and in offices that undergo plumbing renovations. This performance indicator will be discontinued in FY 2002 and will be incorporated into the more comprehensive performance indicator “Percent of employees who are satisfied with the overall physical environment, i.e., it is professional, accessible, safe and secure.” This new indicator better assesses employees’ satisfaction with their overall working environment.
Facilities Tested
Data Definition: A number of SSA field facilities will receive water sampling each year and remediation will be done in 100 percent of offices identified with contaminants. The computation of this rate is the number of offices requiring remediation divided by the number of offices identified to have drinking water with elevated contaminant levels.
Data Source: Water Sampling Survey Report.
Percent Corrective Actions Taken
Data Definition: See definition above.
Data Source: Water Sampling Survey Report.
Year Goal Actual
1999 600 662
2000 600 291
2001 42 65
Year Goal Actual
1999 100% 100%
2000 100% 100%
2001 100% 100%
Other Accompanying Information 161

Performance Indicator 64: Number of relocated offices having security surveys and percent of SSA-accepted security recommendations implemented.
FY 2000 Performance Discussion: We exceeded our goals. We completed the work to implement 90 percent of the recommendations that we accepted in FY 2000 as a result of physical security reviews conducted that year in our facilities. Most of the work was completed in FY 2000, with the balance completed in FY 2001 after contracts were put in place and fulfilled.
FY 2001 Performance Discussion: We did not meet our goals to survey 150 relocated offices because only 74 offices relocated and we surveyed them all. We exceeded our goal for implementing adopted security recommendations. In FY 2001, we conducted security surveys in all 74 offices that relocated, and we completed the work to implement 90 percent of recommendations that we accepted. In developing the FY 2001 goal, we initially estimated that 150 offices would relocate in FY 2001. Many factors can influence a relocation including but not limited to the availability of space, workload implications, renovation delays, longer leases and lease extensions, etc. As a result of these factors, only 74 offices actually relocated and we surveyed all 74 offices. For years, as part of SSA’s ongoing security program, security surveys had been conducted in a sampling of offices. Following the bombing of the Murrah Federal Building in Oklahoma City, Oklahoma, security contractors were hired to conduct surveys in all SSA facilities. In 1996, the larger regional and field facility buildings were surveyed to determine their security vulnerabilities. In subsequent years, Headquarters facilities and smaller field facilities were surveyed. Since this initial contract work was completed, we have been sampling offices to ensure completion of security upgrades and to maintain information on the Agency’s security posture. In addition, all newly relocated offices are being surveyed. We will continue these ongoing activities as well as upgrade security measures as warranted. This performance indicator will be discontinued in FY 2002 and will be incorporated in the more comprehensive performance indicator “Percent of employees who are satisfied with the overall physical environment, i.e., it is professional, accessible, safe and secure.” This new indicator better assesses employees’ satisfaction with their overall working environment.
Number of offices surveyed
Data Definition: A contractor will perform security surveys for all SSA field offices that relocate during a fiscal year. Recommendations from the contractor will be accepted for implementation if the Agency’s management deems them appropriate in context of other service delivery factors. For example, a recommendation that would create unnecessary barriers between SSA employees and customers may be considered unacceptable.
Data Source: Physical Survey reviews.
Year Goal Actual
2000 150 152
2001 150 74
162 SSA’s FY 2001 Performance and Accountability Report

Percent of accepted recommendations implemented
Year Goal Actual
2000 85% 90%
2001 87% 90%
Data Definition: See above for definition.
Data Source: Physical Security reviews.
Strategic Objective: To promote an Agency culture that successfully incorporated our values
Performance Indicator 65: Create Agency change strategy.
FY 2001 Performance Discussion: We did not meet our goal. To support our objective to promote an Agency culture that successfully incorporates our values, in FY 2000 we conducted an organizational culture survey, completed a gap analysis and conducted a benchmarking study, all geared to support the development of a culture change strategy. In November 2000, a final report of that initiative was presented to SSA leadership. At that time, it was decided that action would be deferred pending new Administration leadership coming on board at SSA. In recent months, we have been focusing on developing and refining SSA initiatives related to the President’s management agenda and our workforce restructuring plan. As part of that work, we will consider how the Agency culture factors into our priorities. In the interim, we are discontinuing use of this indicator effective FY 2002.
Data Definition: This goal will be met if we implement our strategy.
Strategic Objective: To create a workforce to serve SSA’s diverse customers in the twenty-first century
Performance Indicator 66: Complete Agency plan for transitioning to the workforce of the future. We met our goals. This is Key Performance Indicator 12 in the Performance Goals and Results section of the MD&A. Please see page 48 for a detailed discussion.
Other Accompanying Information 163
Strategic Goal: To strengthen public understanding of Social Security programs
Strategic Objective: By 2005, 9 out of 10 Americans (adults age 18 and over) will be knowledgeable about the Social Security programs in three important areas:
• Basic program facts;
• Value of Social Security programs; and
• Financing Social Security programs
Performance Indicator 67: Percent of public who are knowledgeable about Social Security programs.
FY 2000 Performance Discussion: We exceeded our goal to an exceptional degree. Several factors contributed to our attainment of a 75 percent knowledge level:
• First, the second year of performance measurement at the national and regional levels increased the level of attention being paid to attainment of the strategic objective;
• Second, the expansion in the number of public affairs professionals in SSA’s field structure and the increased public affairs activity by field office managers permitted more and better-targeted information to be directed to members of the public; and
• Third, the educational impact of the Social Security Statement was considerable. Exceeding our goal in FY 2000 positions us to maintain a reasonable level of public knowledge in the face of resource challenges and program issues. It also permits us to create new strategies to focus on raising the level of knowledge among various segments of the population who are more difficult to reach with our messages.
FY 2001 Performance Discussion: We exceeded our goal for FY 2001. The percent of the public considered “knowledgeable” about Social Security stands at 78 percent in FY 2001, up 3 percentage points from the FY 2000 level of 75 percent. While the survey will need to be reconfigured to provide more detailed information about the extent of the public’s knowledge of Social Security funding and other issues, this performance level shows a positive trend toward our FY 2005 goal of 90 percent.
We are pleased that our efforts helped the public retain its high level of knowledge this past year. A series of localized studies conducted in FY 2000 showed that additional attention and resources devoted to public affairs activities could have a measurable effect on public knowledge, and the results of the FY 2001 survey clearly indicate that this is so. There are several factors that may have had an effect on the level of knowledge achieved this year:
• The results suggest that the Statement remains an effective communications tool, and we expect to continue to use it as a tool for improving the public’s understanding of Social Security. We also will focus on other very important means of communications, such as broadcast messages and the news media.
• We developed and have begun a series of strategies that target the segments of the population who know the least about Social Security.
164 SSA’s FY 2001 Performance and Accountability Report
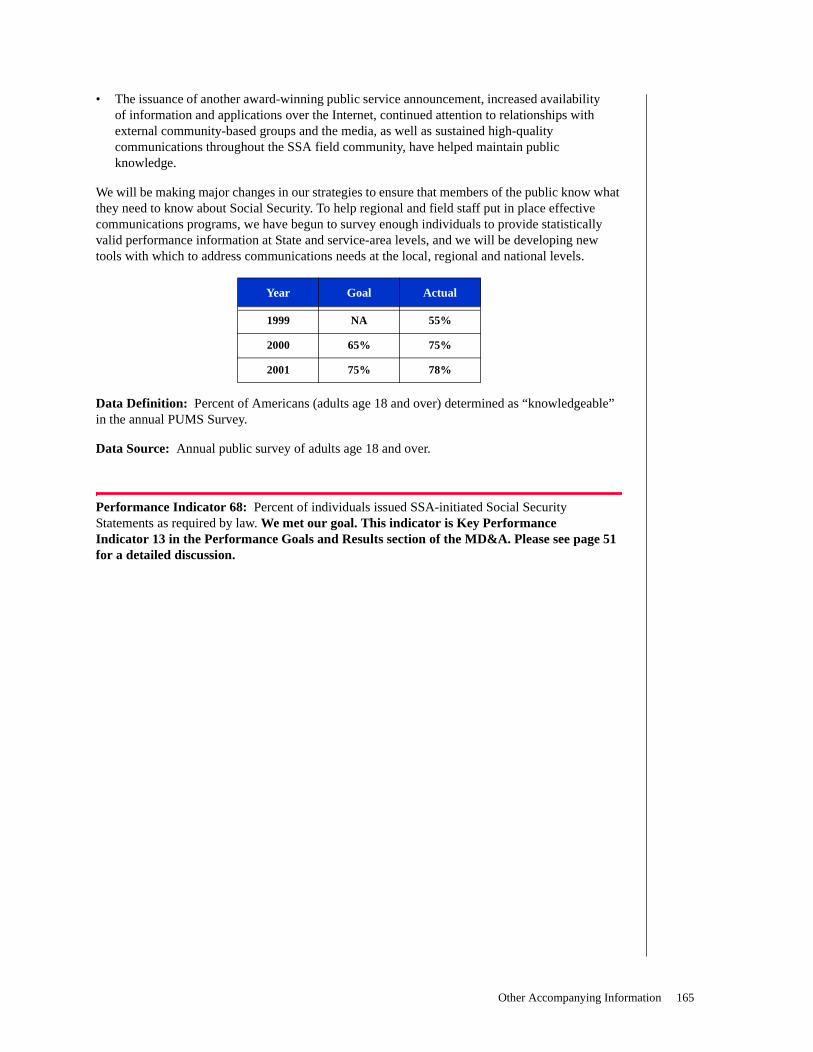
• The issuance of another award-winning public service announcement, increased availability of information and applications over the Internet, continued attention to relationships with external community-based groups and the media, as well as sustained high-quality communications throughout the SSA field community, have helped maintain public knowledge.
We will be making major changes in our strategies to ensure that members of the public know what they need to know about Social Security. To help regional and field staff put in place effective communications programs, we have begun to survey enough individuals to provide statistically valid performance information at State and service-area levels, and we will be developing new tools with which to address communications needs at the local, regional and national levels.
Data Definition: Percent of Americans (adults age 18 and over) determined as “knowledgeable” in the annual PUMS Survey.
Data Source: Annual public survey of adults age 18 and over.
Performance Indicator 68: Percent of individuals issued SSA-initiated Social SecurityStatements as required by law. We met our goal. This indicator is Key Performance Indicator 13 in the Performance Goals and Results section of the MD&A. Please see page 51 for a detailed discussion.
Year Goal Actual
1999 NA 55%
2000 65% 75%
2001 75% 78%
Other Accompanying Information 165

Selected Budgeted Workloads in Support of Strategic Goals
The selected budgeted workloads, shown below, are major categories of our work that provide service to the public and/or ensure the integrity of our programs. These substantial day-to-day base workloads are the largest factor driving overall SSA administrative resource needs. Displayed below are the workloads we expected to process in FY 2001, and what we actually processed in FY 2001.
Workload 1: RSI Claims Processed
FY 2001 Performance Plan: 3,125,000
FY 2001 Actual: We processed fewer than the projected workload of Retirement and Survivors Insurance (RSI) claims.
Discussion: One of SSA’s key ongoing operational responsibilities is to process the RSI claims it receives. Each year we estimate the RSI claims workload that we expect to receive based on actuarial estimates, prior years’ claims receipts, legislative or policy changes, and other factors. In FY 2001, the projected workload of 3,125,000 RSI claims did not materialize, so we did not process that number of claims.
This is unlike the FY 2000 goal, when we processed 3,404,938 RSI claims. This large number of claims was mostly due to the enactment of legislation that partially repealed the annual earnings test. This caused a surge in RSI applications in FY 2000 that was not matched in FY 2001. In FY 2001, we actually processed 3,092,743 RSI applications. We allocated sufficient administrative resources in FY 2001 to process the workload.
We are not likely to process more than that number in FY 2002. The number of RSI claims received and processed in FY 2002 and subsequent years will depend in large part on the number of people who are ready to retire and file, or the number of wages earners who die and leave eligible survivors. For FY 2002, we currently estimate our RSI claims workload at 3,137,000.
Workload 2: SSI Aged Claims Processed
FY 2001 Performance Plan: 150,000
FY 2001 Actual: We processed more than the projected number of Supplemental Security Income (SSI) aged claims
Discussion: One of SSA’s key ongoing operational responsibilities is to process the SSI claims it receives. Each year we estimate the SSI claims workload that we expect to receive based on actuarial estimates, prior years’ claims receipts, legislative or policy changes, and other factors.
In FY 2001, we processed 153,563 SSI aged claims, which was more than the 150,000 claims projected. We allocated sufficient administrative resources in FY 2001 to process the workload.
In the absence of new legislation, the number of SSI aged claims received in any year is entirely dependent on the number of people who meet citizenship, income and resource requirements, and who elect to file for benefits. The number cannot be predicted, but based on the experience of the past two fiscal years, we expect to receive and process approximately 155,400 SSI aged claims in FY 2002.
166 SSA’s FY 2001 Performance and Accountability Report

Workload 3: Initial Disability Claims Processed
FY 2001 Performance Plan: 2,097,000
FY 2001 Actual: We processed 2,166,623 initial disability claims, which is more than the targeted number.
Discussion: We were able to process more than the targeted number of initial disability claims because we reallocated over $30 million to the State DDS budget to enable the DDSs to increase case processing capacity. By exceeding our target through additional funding, the growth of backlogged disability claims has slowed and the DDSs are better positioned to meet future processing targets. Future disability claims processing targets are based on past performance and future actuarial projections and, with sufficient funding, should be met.
Workload 4: Hearings Processed
FY 2001 Performance Plan: 526,000
FY 2001 Actual: We processed 465,228 hearings, which is fewer than the targeted number of hearings.
Discussion: Several factors adversely impacted our ability to achieve the projected level of hearings processed in FY 2001. First, from April 1999 until September 24, 2001, SSA was prevented from hiring ALJs to fill existing vacancies. This was as a result of litigation involving the Office of Personnel Management (OPM) (Azdell v. OPM), which prohibited OPM from providing Federal agencies with an ALJ certificate from which to hire new ALJs. Accordingly, the ALJ corps continued to diminish in size during FY 2001, and from FY 1999 through June 2001, we lost 172 ALJs. On September 24, 2001, we were granted a one-time exception to hire 126 ALJs, pending a long-term resolution of the issue, and we took immediate action to hire. We also were unable to fill many new staff positions until late in the FY (due to the Continuing Resolution and a brief hiring freeze) and implemented a new hearing process.
We continue to look for ways to improve productivity. We are evaluating the new hearing process, and recently renegotiated a Memorandum of Understanding with one of our unions to afford more flexibility to local hearing offices in the performance of certain administrative activities. We believe we are positioned to meet our FY 2002 workload target. Also, we are hiring 126 new ALJs earlier in the FY than anticipated. This hiring will have some impact on total hearings processed in the second half of the new fiscal year.
Workload 5: SSN Requests Processed
FY 2001 Performance Plan: 16,460,000
FY 2001 Actual: We processed 18,179,115 SSN requests, which is more than the targeted workload.
Discussion: One of SSA’s key ongoing operational responsibilities is to process the requests it received for original or duplicate SSNs (i.e., original or replacement SSN cards). Each year we estimate the SSN request workload that we expect to receive. However, the number of requests processed in a given year is dependent upon the number of people who need a new or replacement
Other Accompanying Information 167

SSN, and who meet citizenship or residency requirements. This year, we received and processed 18,179,115 requests. We allocated sufficient administrative resources in FY 2001 to process the workload.
At this time, we expect to process approximately 17,000,000 requests for SSNs in FY 2002. The number of SSN requests could increase in FY 2002 if certain legislative proposals are enacted; e.g., affecting residency status of undocumented workers.
Workload 6: 800 Number Calls Handled
FY 2001 Performance Plan: 60,000,000
FY 2001 Actual: We processed 59.3 million 800-number calls, which is fewer than projected.
Discussion: In FY 2001, we received and processed 59.3 million 800-number calls. We believe there are two reasons for the smaller 800-number workload in FY 2001. First, an increased number of callers are taking advantage of the services available on SSA’s Internet site. Second, we received approximately 1.4 million fewer calls in September 2001 as compared to September 2000.
We know that the public is showing a continuing preference for dealing with SSA by telephone and that overall customer satisfaction with our service is significantly influenced by the quality and scope of our telephone service.
Our ability to handle the 800-number calls we receive each year is a key factor in our continued ability to process our work in these times of increasing workloads, evolving customer demands and preferences, and limited staffing. Processing this day-to-day workload requires a major portion of our annual administrative resources. As we continue to expand the number of services available by telephone, we will continue to make related improvements in automation and implement other initiatives to improve access for customers to our 800-number.
Workload 7: Periodic Continuing Disability Reviews
FY 2001 Performance Plan: 1,729,000
FY 2001 Actual: We processed 1,730,192 CDRs, which is more than the targeted number.
Discussion: SSA conducts very effective periodic reviews called continuing disability reviews to determine whether individuals receiving disability have medically improved and no longer meet the statutory definition of disability, and therefore should have their disability benefits terminated. SSA’s annual targets are set in accordance with our 7-year CDR plan, which covers FYs 1996 through 2002. The goal of our 7-year plan is for SSA to process its entire backlog of CDRs by FY 2002, and then to keep current with processing this critical workload. Congress provides special funding to SSA to process our 7-year plan workload.
In FY 2001 we processed the target number of CDRs with the special funding and by undertaking initiatives to enhance the efficiency and integrity of CDR processing. These initiatives included improving our ability to identify factors that may indicate that a beneficiary has medically improved. We use these factors in a profiling process to determine the type of CDR path a case should follow: either a full medical review or an abbreviated process using a CDR mailer questionnaire.
In FY 2002, we expect to process the targeted number of CDRs.
168 SSA’s FY 2001 Performance and Accountability Report

Workload 8: SSI Non-Disability Redeterminations
This is Key Performance Indicator 8 in the Performance Goals and Results section of the MD&A. Please see page 44 for a detailed discussion.
Workload 9: Annual Earnings Processed:
FY 2001 Performance Plan: 270,200,000
FY 2001 Actual: We processed 274,427,394 annual earnings items, which is more than the targeted workload.
Discussion: Annual earnings items reflect the total number of paper annual wage items processed through the balancing operation plus the total number of magnetic media and self-employment items posted for a given fiscal year. In FY 2001, we processed 274,427,394 annual earnings items. We attribute our achievement in FY 2001 to our continued pursuit of several effective initiatives, including: 1) Improved management information that tracked magnetic media submittals by processing location, provided processing time, and provided the number of wage items associated with each submittal; 2) targeting and tracking of large submitters to ensure their submittals were processed timely; 3) follow-up on magnetic media returns and corrections earlier in the TY process; and 4) improved communication internally within SSA and between SSA and the employer community. In FY 2002, we expect to process approximately 268,000,000 earnings items.
Workload 10: Representative Payee Actions:
FY 2001 Performance Plan: 6,858,000
FY 2001 Actual: We processed 7,135,770 representative payee actions, which is more than the target workload.
Discussion: The number of representative payee actions consists of two workloads: the number of representative payee applications processed and the number of representative payee accountings processed. SSA has little control over the number of applications received, and therefore needing to be processed, because we cannot accurately predict the number of beneficiaries that will need representative payees in any given year. This also impacts the number of payee accountings released for processing. SSA’s continued intention is to process all the applications received and accountings released for processing in a given year. In FY 2002, we expect to process approximately 7,000,000 representative payee actions.
Other Accompanying Information 169

Barometer Measures An agency’s strategic and performance plans are used to assess its performance in terms ofoutcomes achieved and outputs produced. SSA’s mission is to promote the economic security of the nation’s people, to issue benefit checks in the correct amount on a timely basis, and to ensure world-class service. SSA’s programs, however, are not the only factors that affect the economic status of the aged, disabled, and survivor populations. Personal choices, social attitudes, and the economic climate also play important roles. Thus, it is not feasible for the Agency to establishnumerical goals for such measures as levels of income or rates of poverty.
Although we cannot set goals for these measures, SSA has committed to identifying and definingquantitative indicators to assess the outcomes of the Agency’s programs. SSA uses the indicators, which are called barometer measures, to analyze the programs’ effects on the economic security of the nation’s people and to help formulate options for strengthening the programs. The barometermeasures will also guide future research and policy development.
The strategic goal “to promote valued, strong, and responsive social security programs and conduct effective policy development, research, and program evaluation” acknowledges SSA’sresponsibility to help shape the dialogue on critical long-term and short-term Social Security issues.SSA has made a commitment to provide information and policy options for the OASDI and SSI programs for use by decisionmakers. The barometer measures provide a measure of how Social Security benefits, in combination with many related factors, affect the economic well-beingof the public.
No single measure can capture the effectiveness of a social program. Therefore, SSA has developed a number of barometer measures for both the OASDI and SSI programs and other economic factors. Each barometer contains multiple data measures that reflect the different bases andobjectives of each program: earnings-based for OASDI and needs-based for SSI. Barometer measures should be considered both within the context of each other and in relation to external economic, social, and other factors.
Several changes have been made from last year’s presentation which established baselines for the barometer measures. We have reordered the measures, combined the discussions of OASDI and SSI barometers, and added new measures. For example, estimates of Social Security replacementrates in last year’s report were based only on hypothetical workers. This year we have added a complementary measure based on actual workers and their work records to provide an estimate ofreplacement rates. We have also developed additional barometer measures relating to private provision for retirement including pension coverage, financial assets and net worth.
Finally, we have added labor force participation as the very first barometer measure to recognize work and earnings as the key factors that lead to economic security. The five barometer categoriesare:
I. Program Coverage and Eligibility
II. Benefit Adequacy and Equity
III. Reliance on Social Security Programs
IV. Return-to-Work Among Persons with Disabilities
V. Private Provision for Retirement
This report provides a brief summary and analysis of the five areas followed by the measures related to each one.
170 SSA’s FY 2001 Performance and Accountability Report

I. Measures of Program Coverage and Eligibility
The fundamental factor in ensuring economic security for the vast number of people is a job or jobs that provide sustained and consistent income. Participation in the labor force, therefore, is the foundation on which to build financial security for retirement and for unexpected risks such as disability and death.
OASDI benefits are based on lifetime labor force participation. Participation rates vary greatly by age and sex and have been changing over time, especially for women. Labor force participation increases with age for men to well over 90 percent through about age 39 and then declines with age until only about 28 percent of men aged 65 to 69 are still in the workforce. Labor force participation for women, while still lower than that for men overall, has increased in recent years. Over 70 percent of women aged 25 to 29 are now in the workforce compared with less than 40 percent 40 years ago (Barometer IA).
In addition to labor force participation rates being lower for women than for men, newly retired male workers typically earn more quarters of credit for Social Security coverage than newly retired
female workers and experience fewer years with no earnings.1 Men, on average, earned 85 percent of the quarters of coverage they could have earned from age 22 to the year before first collecting retired-worker benefits, compared with 59 percent of women. And men had, on average, 5 years with no earnings from age 22 to retirement compared with 14 years for women (Barometer IB). Because of those extra years with no earnings, and their lower lifetime earnings generally, women who collect benefits as a retired or disabled worker have lower benefits on average, than men.
Approximately 95 percent of individuals aged 62 or older were eligible (either insured for benefits or could receive benefits based on the work record of an insured worker) for OASDI benefits in
2000 (Barometer IC). About 80 percent were insured for disability (Barometer ID).2 Fewer women were insured for disability benefits than men (74 percent compared with 85 percent). And fewer individuals between age 62 and the normal retirement age were eligible for disability benefits than younger persons (among women 60 percent aged 62 to the normal retirement age compared with 75 percent aged 20 - 49).
Social Security provides benefits not only to workers but also to spouses and survivors. More women receive OASDI benefits based on their own work record than as a spouse. In 2000, 36 percent of the 19 million female beneficiaries aged 65 or older were receiving “retired-worker only” benefits, 29 percent were dually entitled to their worker benefit and a higher spouse benefit and 35 percent were eligible for a wife or widow benefit only (Barometer IE). When considering changes to the program such as raising the early retirement age or modifying auxiliary benefits, the effects on women should be especially considered.
1. Forty quarters of coverage are required to establish eligibility for retirement benefits. 2. Among those not eligible for Social Security are those without enough work credits and those who work in
non-Social Security-covered employment, such as some state and local governments.
Other Accompanying Information 171

IA. Labor Force Participation Rates for Men, by Birth Year1 , in percent
Age 1930 1935 1940 1945 1950 1955 1960 1965 1970
20-24 86 84 84 86 85 85 84
25-29 97 96 95 94 94 94 93 93
30-34 98 98 97 96 95 95 94 93
35-39 98 97 96 96 95 94 93
40-44 96 95 95 94 93 92
45-49 93 93 93 92 91
50-54 89 89 88 87
55-59 79 79 78
60-64 54 54
65-69 28
Source: Office of the Chief Actuary, 2000 Social Security Trustees Report; and Bureau of Labor Statistics, Household Survey, 2000.
1. Each birth year represents a 5-year period, with the year shown being the middle year.
0
0.2
0.4
0.6
0.8
1.0
1.2
65-6960-6455-5950-5445-4940-4435-3930-3425-2920-24
Labor force participation rates, male
Age group
b1970
b1965
b1960
b1955
b1950
b1945
b1940
b1935
b1930
Percent
172 SSA’s FY 2001 Performance and Accountability Report

IA. Labor Force Participation Rates for Women, by Birth Year1, in percent
Age 1930 1935 1940 1945 1950 1955 1960 1965 1970
20-24 48 53 60 67 70 72 71
25-29 37 42 50 62 69 73 74 76
30-34 37 40 47 57 67 72 73 75
35-39 46 51 59 67 74 76 76
40-44 54 60 68 75 78 79
45-49 58 65 71 76 78
50-54 58 63 69 72
55-59 52 57 60
60-64 36 39
65-69 18
Source: Office of the Chief Actuary, 2000 Social Security Trustees Report; and Bureau of Labor Statistics, Household Survey, 2000.
1. Each birth year represents a 5-year period, with the year shown being the middle year.
0
0.2
0.4
0.6
0.8
1.0
1.2
65-6960-6455-5950-5445-4940-4435-3930-3425-2920-24
b1970
b1965
b1960
b1955
b1950
b1945
b1940
b1935
b1930
Labor force participation rates, female
Age group
Percent
Other Accompanying Information 173

IB. Quarters of Coverage (QC) and Number of Years with Zero Earnings of New Retired-Worker Beneficiaries, in 1996-1998
Average Percentage
of QC’s Earned1 Average Number of Years
with Zero Earnings2
Total 72 9.3
Men 85 4.7
Women 59 14.2
Source: SIPP and SSA program records, 1996-1998.
1. The average percentage of quarters of coverage earned is the number of quarters actually earned divided by the total number of quarters from age 22 to the year before first collecting retired-worker benefits.
2. Years of zero earnings are also measured from age 22 to retirement. This calculation does not subtract out the lowest 5 years as is done in the benefit calculation.
1. Insured for OASDI benefits or could receive benefits based on the work record of an insured worker.
IC. Population Aged 62 or Older Eligible1 for OASDI Benefits, in December 2000
Percent Number (millions)
Total 95 39.9
Men 93 16.8
Women 96 23.1
Source: Estimate of SSA Office of the Chief Actuary, December 2000.
ID. Percentage Who Meet Work Requirements to Be Insured for Disability Benefits in December 2000
Age Men Women
Total 85 74
20-49 85 75
50-61 85 72
62-NRA 78 60
NOTE: NRA = normal retirement age
Source: Estimate of the SSA Office of the Chief Actuary, December 2000.
174 SSA’s FY 2001 Performance and Accountability Report

IE. Women Aged 65 or Older Receiving OASDI Benefits, in percent, in December 2000
Retired Worker Only 36.4
Dually Entitled 28.9
Wife 12.6
Widow 17.3
Wife or Widow Only 34.7
Wife 12.6
Widow 22.0
Total 100.0
NOTE: Total number of women aged 65 or older receiving OASDI benefits is 19.2 million.
Source: Master Beneficiary Record (MBR), December 2000.
Other Accompanying Information 175

II. Measures of Adequacy and Equity
Because of Social Security’s progressive benefit formula, low-wage workers experience higher replacement rates than other workers. Replacement rates measure the adequacy of OASDI benefits in retirement relative to prior earnings. OASDI benefits replace 70 percent of earnings for hypothetical life-time low-wage workers, 39 percent for average-wage workers, and 24 percent for maximum-wage workers (Barometer IIA).
We have also calculated replacement rates based on actual earnings for newly retired-workers based on the worker’s own earnings. Average replacement rates range from 71 percent for those in the lowest earnings group to 31 percent for those in the highest group (Barometer IIB).
Measures of poverty provide a broader assessment of the adequacy of income of those who receive OASDI benefits and SSI benefits, including other sources of income of beneficiaries and other family members. In 1999, 8.1 percent of OASDI beneficiaries aged 65 or older (2.4 million individuals) were below poverty (Barometer IIC). Without their benefits, 48 percent of OASDI beneficiaries would be in poverty, assuming no other change in income. (Barometer IID). One measure of the effectiveness of SSI in providing adequate income is the extent to which it reduces the gap between incomes of SSI recipients and the poverty line. SSI reduces the annual poverty gap by 67 percent, on average (Barometer IIE). In 2000, an individual who had no countable income and was eligible to receive the maximum SSI Federal benefit amount of $513 per month would be at 70 percent of the poverty threshold. Some State supplements bring persons much closer to the poverty line (Barometer IIF).
One indicator of benefit equity is a measure of OASDI benefit amounts by varying levels of the Primary Insurance Amount, which is related to earnings levels. That measure shows that while low-income workers receive proportionately higher OASDI benefits relative to past earnings, high-earning workers receive higher OASDI benefits in absolute terms. Thus, the more one works and the more one earns, the higher benefits will be. On average, persons in the lowest earnings group received an annual benefit of $4,512 in 2000, those in the middle received $10,548, and those in the highest group received $15,984 (Barometer IIG). Similarly, while low-income beneficiaries rely on OASDI benefits for a much higher proportion of their total income, the highest-income beneficiaries received about twice as much in aggregate benefits as the lowest-income beneficiaries (Barometer IIH).
While historical data show that the poverty rate for the aged overall has declined greatly, poverty rates vary substantially for subgroups of beneficiaries. Younger beneficiaries, women, and minorities have much higher poverty rates. On the other hand, replacement rates are low at high incomes. Concerns about adequacy must be balanced with equity across subgroups.
176 SSA’s FY 2001 Performance and Accountability Report

IIA. Hypothetical Replacement Rates of Retirees at NRA, in percent, in 2000
Benefits at Normal Retirement Age as a Percent of Last Year’s Earnings Assuming Wages for All Years Were:
Minimum Wage1 Average Wages Maximum Taxable
Earnings
70 39 24
Source: Calculation by SSA Office of Research, Evaluation and Statistics, 2000.
1. Many retirees, particularly women, have years with no earnings or work part time and earn less than the minimum wage. Assuming that wages for all years were three-fourths of the minimum wage, the replacement rate would be 79 percent.
IIB. Actual Earnings Replacement Rates of Retirees at First Benefit Receipt, in percent, in 1996-1998
Total Male Female
40 36 49
AIME Quintiles
Lowest Second Third Fourth Highest
71 50 40 35 31
NOTE: The replacement rate is the median monthly benefit amount based on the worker’s own earnings, divided by the average indexed monthly earnings (AIME). The AIME, which is used in the calculation of Social Security benefits, is a worker’s highest 35 years of actual past earnings that have been adjusted by changes in the average wage index. AIME quintile limits are $711/$1,350/$2,170/$3,040.
Source: SIPP and SSA program records, 1996-1998.
Other Accompanying Information 177

IIC. OASDI Beneficiaries in Poverty in 1999
Age Percent of Group Below
Poverty Number of People in
Poverty (Millions)
65+ 8.1 2.4
18 - 64 16.6 1.4
Under 18 20.2 1.0
NOTE: Beneficiaries aged 65+ and 18 to 64 are individuals who report receiving Social Security. Beneficiaries under age 18 are children in families who report receiving Social Security. Poverty is based on family money income, not including non-money transfers such as food stamps.
Source: March 2000 Current Population Survey (CPS), for 1999.
IID. Percent of OASDI Beneficiaries in Poverty Without Social Security in 1999
Age Percent
65+ 48
18 - 64 45
Under 18 37
NOTE: Beneficiaries aged 65+ and 18 to 64 are individuals who report receiving Social Security. Beneficiaries under age 18 are children in families who report receiving Social Security. Poverty is based on family money income, not including non-money transfers such as food stamps.
Source: March 2000 CPS, for 1999.
178 SSA’s FY 2001 Performance and Accountability Report
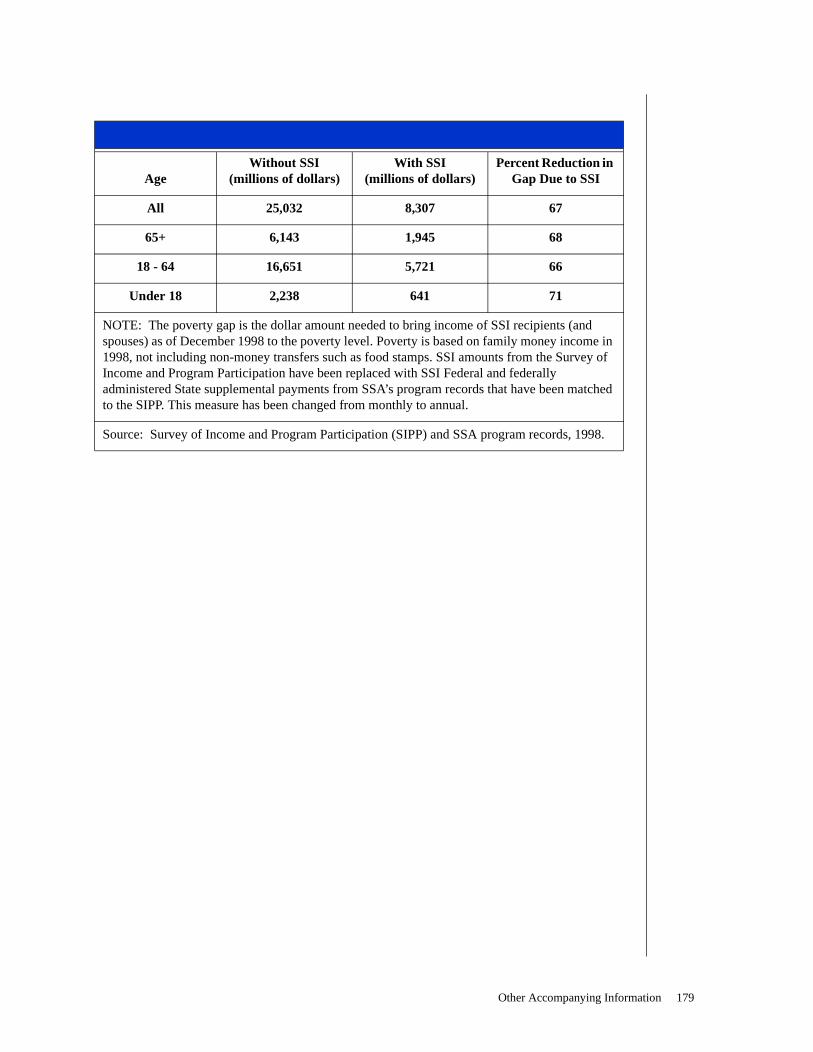
IIE. Annual Poverty Gap With and Without SSI, in 1998
Age Without SSI
(millions of dollars) With SSI
(millions of dollars) Percent Reduction in
Gap Due to SSI
All 25,032 8,307 67
65+ 6,143 1,945 68
18 - 64 16,651 5,721 66
Under 18 2,238 641 71
NOTE: The poverty gap is the dollar amount needed to bring income of SSI recipients (and spouses) as of December 1998 to the poverty level. Poverty is based on family money income in 1998, not including non-money transfers such as food stamps. SSI amounts from the Survey of Income and Program Participation have been replaced with SSI Federal and federally administered State supplemental payments from SSA’s program records that have been matched to the SIPP. This measure has been changed from monthly to annual.
Source: Survey of Income and Program Participation (SIPP) and SSA program records, 1998.
Other Accompanying Information 179

IIF. SSI as a Percent of the Poverty Threshold in States with “Broad Coverage” State Supplement Groups, in 2000
Number in a Broad SSI Coverage
Group (Thousands)
Percent of All State
Recipients
SSI Annual Income Level
(dollars)
SSI as Percent of Poverty
Threshold for One Person
Federal Benefit With State Supplement*
California 807 75 8,304 95
Massachusetts 81 48 7,692 88
Michigan 192 91 6,312 72
New Jersey 110 75 6,516 74
New York 313 51 7,188 82
Pennsylvania 248 89 6,468 74
Federal Benefit Only 6,608 NA 6,156 70
* Federal SSI plus federally administered State supplements in the above States for one person.
NOTES: A broad coverage group includes persons with the most common type of living arrangement within each State, which varies from State to State. Individuals in such living arrangements receive an SSI federally administered State supplement together with the Federal payment that moves them closer to the poverty threshold than the federal payment alone. NA = not applicable.
Source: SSR and data from States, 2000.
180 SSA’s FY 2001 Performance and Accountability Report
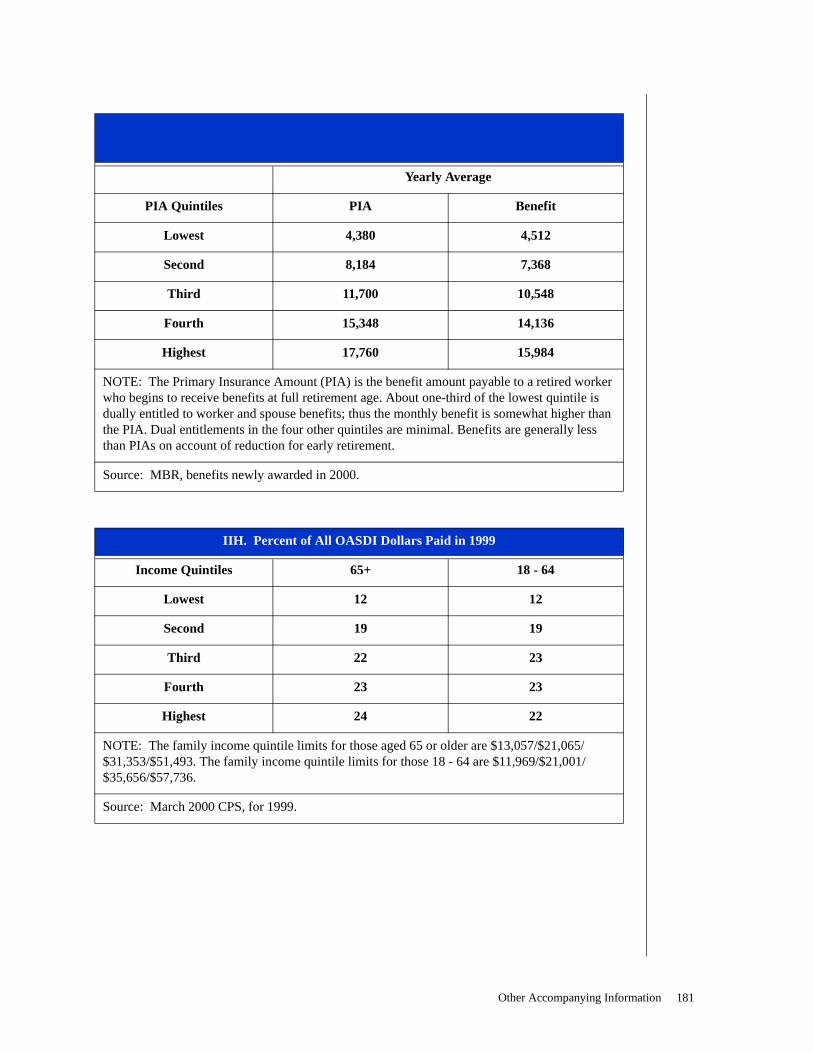
IIG. Average Primary Insurance Amounts (PIA) And Benefits Paid for Newly Retired Workers in 2000, by PIA Quintiles (in dollars)
Yearly Average
PIA Quintiles PIA Benefit
Lowest 4,380 4,512
Second 8,184 7,368
Third 11,700 10,548
Fourth 15,348 14,136
Highest 17,760 15,984
NOTE: The Primary Insurance Amount (PIA) is the benefit amount payable to a retired worker who begins to receive benefits at full retirement age. About one-third of the lowest quintile is dually entitled to worker and spouse benefits; thus the monthly benefit is somewhat higher than the PIA. Dual entitlements in the four other quintiles are minimal. Benefits are generally less than PIAs on account of reduction for early retirement.
Source: MBR, benefits newly awarded in 2000.
IIH. Percent of All OASDI Dollars Paid in 1999
Income Quintiles 65+ 18 - 64
Lowest 12 12
Second 19 19
Third 22 23
Fourth 23 23
Highest 24 22
NOTE: The family income quintile limits for those aged 65 or older are $13,057/$21,065/ $31,353/$51,493. The family income quintile limits for those 18 - 64 are $11,969/$21,001/ $35,656/$57,736.
Source: March 2000 CPS, for 1999.
Other Accompanying Information 181

III. Measures of Reliance on Social Security Programs
Over half of beneficiaries aged 65 or older and over two-fifths of beneficiaries aged 18 to 64 relied on OASDI for half or more of their family income in 1999, and 14 percent of both age groups relied on OASDI for all of their income (Barometer IIIA). Reliance was higher for women, racial
minorities, and low-income groups.3 For example, OASDI provided over 80 percent of the income of beneficiaries in the lowest income quintile compared with less than 20 percent for those in the highest income quintile (Barometer IIIB). Reliance on SSI is measured for individual beneficiaries rather than for families. On that basis, SSI constituted over half of total income for almost two-thirds of SSI recipients aged 18 to 64 in 1998 and was the only income for almost one-third of that group. (Barometer IIIC). Adult beneficiaries were less reliant on SSI than were children.
OASDI was designed to be a partial replacement of income lost because of retirement, disability or death of a worker. SSI was enacted as a means tested program for the aged and disabled poor. The barometer measures in this section show both the extent to which individuals have other sources of the income they need to ensure economic security and the comparative role that OASDI, SSI and other sources play in economic security. The measures also indicate which groups would be most affected, by virtue of their heavy reliance on these programs, by changes to the program.
IIIA. OASDI as a Percent of Total Family Income, in 1999
Percent Who Rely on OASDI for:
Age Half or More of Total
Income 90% or More of Total
Income 100% of Total
Income
65+ 56 22 14
18-64 43 20 14
NOTE: Counts the family OASDI income of persons aged 18 or older as a percent of the family’s total income. A regular SSA data series presents somewhat different figures for those 65 or older counting individuals and married couples based on their own benefits as a percentage of their own income. The numbers under that calculation are 64, 29 and 18 percent. We use a different method here so that age groups are measured similarly and because the method used for the aged is not appropriate for younger groups.
Source: March 2000 CPS, for 1999.
3. Current Population Survey (CPS), for 1999.
182 SSA’s FY 2001 Performance and Accountability Report

IIIB. Percent of Income from OASDI, in 1999
Income Quintiles 65+ 18 - 64
Lowest 88 83
Second 74 66
Third 58 45
Fourth 40 29
Highest 17 14
NOTE: Counts persons based on family money income quintiles and family reliance on OASDI. A regular SSA data series presents somewhat different figures for those 65 or older, counting individuals and married couples on the basis of their own income quintiles and their own reliance on benefits. The numbers under that calculation are 84, 80, 64, 45 and 18 percent. We use a different method here so that age groups are measured similarly and because the method used for the aged is not appropriate for younger groups. The family income quintile limits for those aged 65 or older are $13,057/$21,065/$31,353/$51,493; the family income quintile limits for those 18 to 64 are $11,969/$21,001/$35,656/$57,736.
Source: March 2000 CPS, for 1999.
IIIC. SSI as a Percent of Total Income, in 1998
Percent Who Rely on SSI for:
Age Half or More of Total
Income 90% or More of Total
Income 100% of Total
Income
65+ 42 19 14
18-64 63 38 30
Under 18 99 99 95
NOTE: Counts the person’s SSI as a percentage of the person’s total money income in 1998, not including non-money transfers such as food stamps. SSI amounts from SIPP have been replaced with SSI Federal and federally administered State supplementary payments from SSA’s program records that have been matched to the SIPP. This measure has been changed from monthly to annual.
Source: SIPP and SSA program records, 1998.
Other Accompanying Information 183

IV. Measures of Return-to-Work Among Persons with Disabilities
Since their inception, the Disability Insurance (DI) and SSI programs have emphasized the importance of beneficiaries returning to work when possible. However, moving DI and SSI beneficiaries into employment has proved to be a substantial challenge. In 2000, only 0.2 percent of all DI beneficiaries, after completing a trial work period, lost their benefits because they had earnings above the substantial gainful activity (SGA) level. However, in 1998 (the most recent year for which data are available) 16 percent of DI worker beneficiaries were working, earning an average of about $7,000 for the year. Note that the median earnings level - $3,167 for DI beneficiaries who worked - was less than half of average earnings; thus, the majority had relatively low earnings. (Barometer IVA). In December 2000, 7 percent, or almost 263,000, of
disabled SSI beneficiaries aged 18 to 64 were working, with 90 percent working at or below SGA.4
(Barometer IVB). Of those working in the last quarter of 2000, about 6 percent (16,200) stopped receiving cash SSI benefits because of their earnings. That group constituted less than 1 percent of all SSI beneficiaries (Barometer IVC).
SSA is implementing several projects to facilitate work among DI and SSI beneficiaries, including the Ticket to Work Program, which Congress passed in 1999. A demonstration is being designed that would modify the cliff currently faced by DI beneficiaries who earn above SGA. Under this demonstration, DI beneficiaries would lose one dollar of benefits for each two dollars earned. Also, in an Early Intervention Demonstration, SSA will identify program applicants with impairments that may reasonably be presumed to be disabling. Strategies to provide work payments, early Medicare, benefit offsets, and employment-related services to such applicants will be part of that demonstration.
Major efforts should continue to focus on implementing the Ticket to Work legislation which includes the provision of tickets, new grant programs, and demonstration projects.
4. Through section 1619(a) of the Social Security Act, SSI recipients who earn more than SGA can continue to receive cash benefits until their benefit amount, or the Federal benefit rate minus their countable income, reaches zero.
IVA. Work Among DI Beneficiaries
Number Percent of All
DI Beneficiaries
Working and Receiving Benefits in 1998 694,000 16.0
Benefits Suspended Because of Work Above
the SGA Level After TWP in 2000 10,700 0.2
NOTE: DI beneficiaries working and receiving benefits in SIPP are those who had any earnings in December 1998 and whose entitlement began in December 1996 or earlier. Average yearly earnings were $6,944; median yearly earnings were $3,167. SGA = Substantial Gainful Activity ($700 per month in 2000). TWP = Trial Work Period.
Source: Data for working and receiving benefits are from SIPP and SSA program records, 1998. Data for benefits suspended because of work above SGA after a TWP are from MBR, 2000.
184 SSA’s FY 2001 Performance and Accountability Report

IVB. Disabled SSI Beneficiaries Aged 18-64 Who Worked in December 2000
Working Above SGA
Working At or Below SGA
Total
Working1 All Disabled Beneficiaries
Number 27,000 235,000 263,000 3,660,000
Percent of All Disabled
Beneficiaries 0.7 6.4 7.1 NA
Average Gross Monthly Earnings (dollars) 946 244 316 NA
Source: Supplemental Security Record (SSR), December 2000.
1. Does not include 84,000 persons whose earnings preclude a cash payment. They remain SSI beneficiaries for Medicaid purposes. NA = not applicable.
IVC. Disabled SSI Beneficiaries Aged 18-64 Whose Benefits Ceased in October to December 2000 Because of Work
Number Percent of All SSI
Recipients Percent of All Workers
16,200 0.4 6.2
NOTE: Number of recipients whose benefits (cash, Medicaid or both) ceased during the quarter ending December 31, 2000. These data are reported quarterly. Quarterly numbers cannot be added together because doing so would produce an overcount of people who start and stop work multiple times during a year.
Source: SSR, December 2000.
Other Accompanying Information 185

V. Measures of Private Provision for Retirement
OASDI was intended to be a floor of protection in retirement that would be supplemented by employer pensions and individual savings. Adequacy of income in retirement is highly dependent on having sources of income other than OASDI, such as employer-sponsored pensions and income from one’s own savings. In 1995, slightly more than half (54 percent) of the working population had coverage in an employer-sponsored pension plan. Plan participation was highest among workers aged 40 to 54, with 60 percent reporting employer-provided pension coverage. The largest group had only a defined benefit plan (38 percent). However, a substantial proportion had only a
defined contribution plan (22 percent), and 10 percent had both types of plans5. Plan participation was substantially lower for the total population than for the working population (37 percent compared with 54 percent) (Barometer VA).
Assets can provide income, such as interest or dividends, and they can be spent. Income from assets comes largely from financial assets, but the most important component of most people’s assets is the value of their home. Measures of both financial assets and net worth, which includes the value of the principal residence and other property and businesses, are shown here. In 1998, median family financial assets were $63,300 and median net worth was $217,600 for married individuals aged 65 or older, and nonmarried individuals aged 65 or older had median financial assets of $15,800 and a median net worth of $87,600. (Barometer VB). As these figures indicate, asset amounts vary greatly by marital status. They also vary greatly by age, with persons aged 65 or older having the largest asset values.
Participation in employer pension plans is far from universal. Historical data show that pension coverage leveled off in the 1970s at roughly half the work force covered and has remained at that level since that time. Also, pension plan participation is shifting from largely defined benefit plans toward defined contribution plans, which add more personal choice but also add risk in accumulating a pension. The amounts of assets accumulated varies greatly with some groups having very little accumulated in old age.
5. In a defined benefit plan, an employer provides a guaranteed retirement benefit usually based on the employee’s salary and number of years of service. In a defined contribution plan, contributions are made into individual employee accounts and the amount of the retirement benefit depends on the balance in the account, which is the sum of all contributions plus interest, dividends and capital gains or losses.
VA. Percent Participating in an Employer-Sponsored Pension Plan in 1995
Age Total Population Working Population
Total 37 54
25 - 39 36 48
40 - 54 43 60
55 - 64 25 55
NOTE: Includes private pensions, Federal employee pensions, military retirement and State and local pensions. Does not include IRAs or Keoghs.
Source: Survey of Income and Program Participation, Pension Plan Coverage and Retirement Expectations Topical Module, 1995.
186 SSA’s FY 2001 Performance and Accountability Report

VB. Median Family Financial Assets and Total Net Worth in 1998 (in dollars)
Financial Assets Net Worth
Age Married Nonmarried Married Nonmarried
25 - 54 22,000 4,790 81,870 17,280
55 - 64 59,000 17,500 203,300 71,500
65 or older 63,300 15,800 217,600 87,600
Total 19,700 78,850
NOTE: Financial assets in the Survey of Consumer Finances include transaction accounts, certificates of deposit, bonds, stocks, mutual funds, tax-deferred retirement accounts (IRAs, Keoghs, and certain employer-sponsored accounts from which withdrawals can be made), the cash value of life insurance and other assets such as personal annuities, trusts and royalties. Net worth, in addition to financial assets, includes the equity in homes, nonresidential property, businesses, vehicles and other tangible items. Asset levels vary greatly, depending on the survey and the definition used. For example, SIPP does not include tax-deferred retirement accounts or the cash value of life insurance in assets. SSA will study these differences as it updates this barometer measure in future years.
Source: Survey of Consumer Finances, 1998.
In summary, the barometers help us understand the impact of SSA programs, individual work choices, and other factors on income security.
I. Program Coverage and Eligibility
• Labor force participation is the foundation of economic security for most.
• Coverage for disability is lower for women than men.
• One-third of women receive benefits only as wives or widows.
• Another 28 percent of women receive both worker and auxiliary benefits.
The effects on the well-being of subgroups should be assessed when changes to benefits are considered.
II. Adequacy and Equity of Benefits
• Poverty rates have been reduced but still vary greatly.
• The young, women, and minorities are more likely to be poor.
• The current benefit formula provides higher replacement rates to low earners.
• Higher lifetime earners receive higher benefits but lower replacement rates.
Although Social Security has helped to reduce poverty rates, both adequacy and equity issues are important to continuing public support.
Other Accompanying Information 187

III. Reliance on Social Security and SSI
• About half of beneficiary families receive 50 percent or more of their income from Social Security.
• Reliance on Social Security is higher for older and low-income beneficiaries.
• For two-thirds of SSI beneficiaries, SSI payments provide 50 percent or more of their income.
Too much reliance on OASDI and SSI benefits can result in inadequate income for beneficiaries; plans for diverse sources of income are critical.
IV. Return-to-Work Opportunities Among Persons with Disabilities
• About 16 percent of SSI beneficiaries and 7 percent of SSI disabled beneficiaries work.
• Less than 1 percent of SSDI and SSI disabled beneficiaries lost benefits due to work.
Implementing the Ticket to Work, national work incentive grants and demonstration projects should remain an important priority.
V. Private Provision for Retirement
• About half of today’s workers have pension coverage.
• Increasingly, these plans are defined contribution plans, increasing the potential of higher returns together with individual risk.
• Levels of financial assets and net worth indicate that many have little private savings to supplement Social Security.
Planning for retirement should be a priority to ensure greater economic security.
Program Evaluation
SSA has broadened the scope of its evaluation activities beyond studies of outputs and performance measures, to include evaluation of our program outcomes and their effects on the lives of Americans. We use multi-dimensional evaluations that combine quality, satisfaction, timeliness etc., to build models and create baseline information that helps us address our long-range issues.
We use various types of program evaluations to examine program performance and context. We prepare an annual Agency coordinated evaluation plan that covers our Agency's goals, objectives and business processes, and ensures that there are no overlaps, duplications or gaps. In addition to the ongoing, recurring periodic evaluations of accuracy, service, etc., the evaluation activities described below were completed in FY 2001. The findings from many of these activities are woven throughout this report. Copies of the evaluation results can be obtained by writing to:
The Office of Strategic ManagementSocial Security Administration
500 Altmeyer Building6401 Security Boulevard
Baltimore, MD 21235
188 SSA’s FY 2001 Performance and Accountability Report

We use four main types of program evaluation, along with other information, to study the benefits of a program or how to improve it. They are:
• process evaluation--to assess whether a program is operating as it was intended (i.e., conformance to statutory and regulatory requirements, program design, and professional standards or public expectations;
• outcome evaluation--to assess the extent to which a program achieves its outcome-oriented objectives. The focus is on outputs and outcomes (including unintended effects), but may also assess program processes;
• impact evaluation--to assess the net effect of a program by comparing program outcomes with an estimate of what would have happened in the absence of the program. This form of evaluation is used extensively to assess the Responsive Programs goal; and
• cost-benefit /cost-effectiveness analysis--to compare a program's outputs or outcomes with the costs (resources expended) to produce them. They determine the cost of meeting a single goal or objective and identify the least costly alternative to meet it.
Many of SSA's evaluations are combinations of the above. Following are brief summaries of those completed in FY 2001, with an annotation of how they link to key program outcomes:
• 800 Number Evaluation Findings for April 1999 through March 2000 is based on monitoring 3,916 calls during this 12-month period. Payment accuracy continued to be high and service accuracy increased significantly, perhaps in part due to the rollout of decision support software to all teleservice centers. Call length increased from 5 to 5.4 minutes, which should be balanced with accuracy improvements and an increase in issues processed to completion at the time of the first call. (Providing timely, accurate, and useful information and services to the public).
• 800 Number Evaluation Findings for FY 2000 provided a thorough assessment of national toll-free number customer service. Results presented a mixed picture of performance. There was a gradual upward trend in service accuracy although still short of the 90 percent goal. Failure to comply with the identity requirement continued to be a major source of error. Payment accuracy declined and fell below the 95 percent goal. The most common payment errors involved the failure to protect filing and/or inform callers when a delay in filing could result in a loss of benefits, and failure to act on a caller’s request to appeal a payment-affecting decision. Corrective action for these errors was initiated where recontact was possible. (Providing determinations that are more timely and accurate).
• Survey of 800 Number Callers for August 2000, the semi-annual interaction tracking survey under our Market Measurement Program measures caller satisfaction with service received during a discrete 800 number contact. Eighty percent of the survey respondents rated service as good, very good or excellent, which is identical to the February 2000 and August 1999 rates. Over half of those who rated the service as fair, poor or very poor were dissatisfied with having to wait too long, difficulty getting through, or not receiving answers to their questions. Access to service was rated at 75 percent, not a statistically significant difference from 77 percent for February 2000 and 76 percent for August 1999. (Providing timely, accurate, and useful information and services to the public).
• Report on the 800 Number Multiple Caller Survey is a targeted survey to address our concerns about people who call SSA’s 800 number multiple times on a given day. Forty-six percent of the repeat calls were caused by access difficulties, i.e., hanging up in queue or receiving a busy signal or message. Results represent the opinions of 1,842 callers who made 2 or more “completed” calls to SSA’s 800 number on a single day during a 3-week sample period in September 2000. Over one-third of the responders comments/ suggestions related to easier and faster access to live service. Recent revisions to the 800 number script may alleviate caller frustration at having to listen to a list of automated
Other Accompanying Information 189
services before reaching a representative. (Providing timely, accurate, and useful information and services to the public).
• Organizational Culture Project gathered baseline information about our current culture and conducted a gap analysis between the current and the desired culture. “Zero tolerance for fraud and abuse” and “knowing what is expected [of me] at work” were the two practices rated highest by employees. The two lowest rated practices were “the performance appraisal system” and “understanding the administrative budget.” This study revealed healthy beliefs, behaviors, practices, values, and attitudes on the part of SSA employees. (To promote an Agency culture that successfully incorporates our values).
• Hearing Process Improvement Process Analysis evaluated the hearing process for “bottlenecks” and suggested more efficient process/workflow modifications, evolving into the Hearing Process Improvement (HPI) plan. This plan outlines process changes that should reduce processing times without additional resources, and refinements to ensure high quality service from SSA’s Office of Hearings and Appeals (OHA). (Providing determinations that are more timely and accurate).
• Disability Claim Manager (DCM) Phase II Nonmedical Payment Accuracy Report provided findings regarding the accuracy of the DCM’s decisionmaking. Under the 1994 Disability Redesign Plan and DCM test, the DCM is the decisionmaker on both the medical and the nonmedical aspects of the claim. Accuracy rates for Social Security disability DCM awarded cases were statistically comparable to our ongoing disability accuracy review, the Index of Dollar Accuracy (IDA) review, for FY 2000. The DCM case accuracy rate for awarded SSI cases was significantly higher than the IDA review, with payment accuracy being comparable. The findings were based on about 650 Social Security disability cases and about 730 SSI cases. (Providing determinations that are more timely and accurate).
• Social Security Retirement and Survivors Insurance (RSI) Program Disallowances Report evaluates the accuracy results of 1,424 RSI cases disallowed from FY 1996 through FY 1999. Fifty-nine cases were found to have errors, or a weighted case accuracy rate of 97.1 percent, resulting in $179.9 million projected underpayments over the lives of these claims. A September 2000 Payment Accuracy Task Force used this report to develop recommendations for improvements. (Providing timely, accurate, and useful information and services to the public).
• Causes of SSI Overpayments-FY 1996-1999 examined four years of data to determine the causes of SSI overpayments. Consistent with SSI stewardship findings for FY 1999, wages and excess resources were the top causes of overpayments. Overpayments caused by prisoner status jumped to third place in FY 1998 and remains there, probably the result of the new prisoner eligibility rules and increased detection from prisoner computer matching. Overpayments caused by the recipient’s move to a nursing home decreased each year, perhaps due in part to the new nursing home computer match runs. (Providing timely, accurate, and useful information and services to the public).
• FY 1999 SSI Payment Accuracy (Stewardship) Report is based on a monthly sample of SSI cases reviewed for non-medical factors of eligibility, and provides the data for an SSI performance indicator and SSA reports to Congress and other authorities. At the end of FY 1999 there were 6.6 million SSI recipients receiving about $29.6 billion SSI benefits during the year. SSI payment accuracy (based on a projected $1.8 billion in overpayments) was 94.3 percent for FY 1999, compared to 93.5 percent for the previous year. This is the second time an increase in the accuracy rate has occurred in the past 10 years. Wages and financial accounts continue to be error-prone areas. To reduce payment errors due to wage deficiencies, we began in January 2001 to access the Office of Child Support Enforcement’s quarterly wage database. (Providing timely, accurate, and useful information and services to the public).
190 SSA’s FY 2001 Performance and Accountability Report

• FY 1999 Title II Payment Accuracy (Stewardship) Report is based on a monthly sample of Social Security (Title II) cases reviewed for non-medical factors of eligibility, and provides the data for a performance indicator and SSA reports to Congress and other authorities.
� In FY 1999 thirty-eight million beneficiaries received nearly $322.4 billion in Social Security retirement and survivors insurance payments. The FY 1999 payment accuracy rates (99.8 percent accuracy for overpayments and 99.9 percent accuracy for underpayments) are virtually the same as for FY 1997 and FY 1998.
� The review also includes non-medical aspects of Social Security disability (DI) payments reporting 99.2 percent overpayment accuracy and 99.1 percent underpayment accuracy. Improper imposition of workers’ compensation (WC) offset provisions are a major source of DI errors. We are giving high priority to preventing these errors, including planned systems enhancements to improve future WC accuracy. (Providing determinations that are more timely and accurate).
• FY 1998 and 1999 SSI Index of Dollar Accuracy Reports provides the Index of Dollar Accuracy (IDA) for SSI initial claims awards and field office processed redeterminations, based on a review of nonmedical factors of entitlement/eligibility. IDA data are included in SSA’s Performance and Accountability Report and provide a measure of the quality of SSI service delivery. After bottoming out at 93 percent in FY 1997, the SSI IDA rate inched upward to 93.9 percent for FY 1998 and 94.2 percent for FY 1999. Neither increase is statistically significant, but it may signal a reversal of the downward trend in accuracy since 1990. The two leading types of error were earned income and unearned income. Over half of the deficiencies were attributed to recipients not providing complete or accurate information at the time they were initially awarded benefits or during redeterminations, or not reporting information about changes in income. (Providing determinations that are more timely and accurate).
• Aged Disabled Noncitizen Nonmedical Denial Study provided findings on all “failure to cooperate” denial cases (about 1,100) from August 1997 through mid-February 1999 where no appeal had been filed. The purpose of this study was to identify how many claims had been processed incorrectly before additional instructions on the subject were issued in February 1999. The results were inconclusive because the cases were already 9 months to 2 years old when the review began and a tenth of the cases could not be reviewed because the folder, folder materials, or the claimant could not be located. (Providing determinations that are more timely and accurate).
• 15-Year Work-History Documentation Study provided an assessment of the impact of shortening the documentation requirement to either ten or five years and how such a change may affect the disability allowance rate. Over 2,100 cases were examined to see if a shortened work history would have resulted in the same decision. The study showed that the evidence in file would have supported the same decision in nearly 1,700 cases under either a 10-year or a 5-year documentation requirement. Any increase in the disability allowance rate would be virtually negligible, if either a 10-year or a 5-year work history documentation requirement were adopted. (Providing determinations that are more timely and accurate).
• FY 2000 Dismissal Report evaluated the results of 1,200 hearing dismissal decisions from late FY 1999 and early FY 2000 that were reviewed by Administrative Law Judges (ALJ) acting as reviewing judges. And for the first time, medical consultants and disability examiners reviewed some of these dismissals (240 cases). Problems were found with following pre- and post-hearing date contact and follow-up procedures. Some claimants improperly received dismissals even though they may have met the medical or medical/ vocational criteria for disability. We will revisit this subject in FY 2002 and evaluate the impact of the Hearings Process Improvement Plan (implemented after this study) on the frequency and quality of dismissal decisions. (Providing determinations that are more timely and accurate).
Other Accompanying Information 191

• Report on Prototype Rationale Review Findings for the Period December 1999 – December 2000 measured disability determination services (DDS) adherence to the rationale requirements and evaluated the quality of rationales prepared by the Prototype sites in the 10 Prototype States. Of the 7,531 cases reviewed, there were 921 cases that contained at least one rationale deficiency. Forty-eight percent of the deficiencies for which a reason was shown occurred because the explanation was incomplete, and not because the explanation was either missing or incorrect. For this reason, the overall rationale deficiency rate of 12.2 percent is not considered a cause for serious concern. (Providing determinations that are more timely and accurate).
• Field Office Caller Survey Report for November 2000 is our second survey of field office (FO) callers, conducted under our Market Measurement Program. This survey obtains callers’ perceptions of the service they received shortly after their contact with us. The FY 2001 survey was based on the responses of nearly 1,200 callers who called FOs during November 2000. Seventy-eight percent rated overall service satisfaction as good to excellent, including 25 percent who rated it excellent. These results were comparable to our first survey in November 1999. Beginning FY 2002, this survey will be conducted semiannually in November and May. (Providing timely, accurate, and useful information and services to the public).
• Report on the Quality of the Enumeration Process, FY 2000. The findings from our review of the enumeration process are used as the Agency’s measurement of performance accuracy for the process. In FY 2000, we reviewed a random sample of 2,695 records from all applications for original and replacement cards processed in the year, excluding enumeration at birth transactions. Fifteen percent were applications for an original SSN and 87 percent were applications for a replacement card. The review identifies errors that result in the misassignment of an SSN (a critical error), or incomplete/incorrect information on the Numident record (a major error). The rate of cases free of critical error in FY 2000 was 99.7 percent; the rate of cases free of major error was 92.5 percent. (Providing determinations that are more timely and accurate).
• The Visitor Information Service Analysis Evaluation Report provides a preliminary evaluation of our pilot to automate our FO reception area process. We purchased equipment to run the VISA system for offices with high walk-in traffic. This customer traffic management system uses ticket dispensers, personal computers and voice activated announcements to direct traffic and obtain management information on waiting and service times. The report concludes that the VISA system may eliminate the need to conduct waiting time studies and collect data manually, provides “real time” management information, and has significant customer service benefits, including reduction in stand-up waiting times and increased customer privacy. (Providing timely, accurate, and useful information and services to the public).
• Results from Three of the Initial Models of the SSA Medicare Part B Buy-in Demonstration evaluates efforts to increase participation in Medicare Buy-in programs. Low-income senior citizens and individuals with disabilities, enrolled in Medicare, may be eligible for Medicaid Buy-in assistance which pays Medicare Part B premiums and, in some instances, Medicare co-payments and deductibles. Since March 1999, we have been conducting demonstration projects to determine how best to increase participation in Medicaid Buy-in programs. This study looks at three initial models and concludes that they increased Buy-in enrollment by about 10 percent. The application model, which involved SSA staff to a greater extent than the other models, had the greatest impact on Buy-in enrollment. (Providing timely, accurate, and useful information and services to the public).
• Results from the SSA Buy-In Demonstration provides detailed information on the outcomes of three of the six models tested as part of a national demonstration to determine how to increase participation in “Buy-in” programs that pay for Part B Medicare premiums. This was the fourth and final report. The analyses focused on the impact of each model over a
192 SSA’s FY 2001 Performance and Accountability Report

nine-month period. Overall, the demonstration increased enrollment by approximately seven percent. The models that used SSA’s toll-free number, and appointments for potentially eligible callers, had a much greater positive impact on enrollment rates than models that required the beneficiary to take several steps with less assistance. (Providing timely, accurate, and useful information and services to the public).
• Enumeration Process Focus Groups were conducted in Florida, Washington, D.C., and Seattle with individuals who had recently applied for original or replacement Social Security Number (SSN) cards. The purpose was to hear about their expectations, experiences and recommendations for the enumeration process. We are studying the feasibility of implementing specific recommendations contained in a report of findings. (Providing determinations that are more timely and accurate).
• The Field Office (FO) Caller Survey Report evaluated caller satisfaction by interviewing over a thousand callers who had called a FO during November 1999. About 80 percent rated service as good or better, with 28 percent rating service as excellent. These are almost exactly the same ratings as found in the 800 Number customer survey, and are presented in a combined report with the “800 Number Caller Survey” and the “Office Visitor Survey.” (Providing timely, accurate, and useful information and services to the public).
• Evaluation of SSI Match with HCFA Nursing Home Data Final Report provided an assessment of computer database matching between SSA and HCFA, to identify SSI recipients ineligible during an extended stay in a nursing home. In FY 1999 the computer match runs generated about 72,000 nursing home alerts, which cost $6.8 million to process but led to the prevention or recovery of about $27 million in overpayments (a 4 to 1 benefit to cost ratio). As nursing homes become more familiar with the new reporting system, the quality of data received in the match is expected to improve to the point that FOs can take action in some situations without further development. We are planning a follow-up study. (Reducing fraud, waste and error in the SSI program).
• Office Visitor Survey Report for the Second Quarter, FY 2000 provided the service satisfaction survey results for visitors to our field and hearing offices. The survey sampled 2,157 visitors to 52 field and 13 hearing offices shortly after their visit, and asked about their satisfaction with service. Eighty-eight percent of responders rated service as excellent, very good or good, indicating a high degree of satisfaction. This rate does reflect a small statistically significant decline from the 91 percent rate reported in the survey for the July 1999 quarter. Since the January quarter is usually our busiest, this could account for the slightly lower satisfaction levels. Those who rated service as excellent most often attributed their satisfaction to the way they were treated by staff. (Providing timely, accurate, and useful information and services to the public).
• Employer Satisfaction Survey Report provided information on employers’ 1) satisfaction with our wage reporting services, 2) use of these services, and 3) opinions about our plans to improve these services. Of the 1,325 employers who responded (about a 40 percent response rate), 82 percent rated our wage reporting services as good, very good or excellent, indicating general satisfaction. However, we did not meet our 93 percent goal. The survey also told us that our wage reporting services are seldom used; about half of the employers were not aware the service exists. Recent publicity on SSA’s website and in other publications may help correct this. About 35 percent of employers use a third party, such as a payroll service, to complete their wage reports; we had little success getting responses from such proxies. Due to the low response rate, we are exploring a new methodology for measuring employer satisfaction. (Providing timely, accurate, and useful information and services to the public; providing determinations that are more timely and accurate; reducing long-term disability benefits because people return to the workplace; providing timely information to decisionmakers necessary to address program policy issues such as long-term trust fund solvency; and reducing fraud, waste and error in the SSI program).
Other Accompanying Information 193

• Social Security Online Customer Survey Report provided the results of our first interaction tracking survey of online website visitors, who viewed any of 13 designated pages from February 16 to March 6, 2000. Visitors to these pages were automatically linked to a survey questionnaire, and we received over 4,300 hits and 1,700 survey forms. We got a 79 percent good or better satisfaction rating. Some respondents reported difficulties with site navigation. We are aggressively pursuing enhancements to the website, as we continue to expand, provide more services, and improve functionality. (Providing timely, accurate, and useful information and services to the public).
• Analysis of Instances Where Multiple Social Security Numbers (SSNs) Are Assigned to One Individual studied whether an existing database, containing information regarding cross-referenced SSNs, could help us find issues of identity fraud. The study found no hint of fraud and recommended no further action be taken to investigate multiple SSNs on this particular database. (Reducing fraud, waste and error in the SSI program).
• Findings from the Office of Quality Assurance and Performance Assessment Talking and Listening to Customers (TLC) Customer Survey included all people who “registered” a compliant, compliment or suggestion using TLC between October 27 and December 1, 2001. TLC is an agencywide automated process enabling us to capture, analyze and address spontaneous public complaints, compliments and suggestions. Our goal is to resolve public concerns and identify/address larger systemic problems and trends. Ninety-one percent of respondents indicated that it is very important for SSA to have such a process. Only about half of the respondents realized that they had “registered” a complaint, compliment, or suggestion. Over 75 percent of respondents were satisfied with what we did to resolve the issue, but less than two-thirds were satisfied with the timeliness of the resolution. (Providing timely, accurate, and useful information and services to the public).
• Disability Claim Manager (DCM) Phase II Claimants Survey Report evaluated claimants’ experience filing for initial disability benefits through a DCM and measured satisfaction with the process. The survey, conducted in August and September 2000, included individuals who received a medical decision made from April 30 through June 30, 2000. The decisional outcome of the claim strongly affected the claimant’s opinion of service with 94 percent of awarded claimants rating overall service as good or better, and 68 percent of denied claimants rating overall service as good or better. The overall satisfaction level of awarded claimants was comparable to the current process; however, denied claimant satisfaction was significantly higher. The DCM process was rated higher in many areas of claimant satisfaction, as compared to the current process, for both awarded and denied claimants. This was particularly evident in ratings of employee attributes such as helpfulness, courtesy, job knowledge, and time spent with the claimant. (Providing timely, accurate, and useful information and services to the public).
• Follow-up Contacts with Internet Retirement Benefit (IRIB) Filers analyzed why over 4000 retirement applications (22 percent), filed online from October 2000 through January 2001, remained pending without a signed application. We interviewed 216 applicants who had not returned their applications. Almost 80 percent of the interviewees planned to submit a signed application, but more than half were uncertain what to do and needed some assistance. Most of this uncertainty could be minimized through routine follow-up. Also, our online screens need to reinforce the requirement to submit a signed application, and to do so before the 6-month protective filing period elapses. (Providing timely, accurate, and useful information and services to the public and providing determinations that are more timely and accurate).
• Cost Benefit Analysis (CBA) for the Computer Match between the Bureau of Public Debt, Department of the Treasury Savings Bond Registration Records and Supplemental Security Records analyzed if the match was cost effective. The analysis confirmed that the match operation is cost effective at a rate of 6.2 to 1. The match identified $2.52 million per year for both: 1) Incorrect payments that were avoided; and 2) overpayments that would have
194 SSA’s FY 2001 Performance and Accountability Report

otherwise gone undetected. The costs for performing the match totaled $402,000. (Reducing fraud, waste and error in the SSI program).
• Reports of Claimant Satisfaction Survey of the Disability Redesign Prototype measured satisfaction with the Prototype experience, as compared to claimant satisfaction with the current disability process per the FY 2000 Market Measurement Program. The survey was conducted during August and September 2000; 861 claimants were contacted whose decision was rendered during the period of June 1 through July 14, 2000. Overall satisfaction of claimants who were awarded benefits through the Prototype process was about the same as that of the current process (92 vs. 91 percent respectively). Denied Prototype claimants, who had a claimant conference, had higher levels of overall satisfaction than those denied under the current process (64 vs. 55 percent). The claimant conference interview seemed to have a positive effect on: 1) The number of contacts needed to complete the application; and 2) the clarity of the decision explanation. However, Prototype claimants, denied after a conference, were less satisfied with the caring/helpful attributes of employees and the amount of time spent with them, than claimants were under the current process. (Providing timely, accurate, and useful information and services to the public and providing determinations that are more timely and accurate).
• PIN (Personal Identification Number)/Password User Survey Report obtained public reaction to a PIN/password process that allows the public secure access to information and the ability to make changes in their SSA records via the Internet. The survey involved retirement applicants who filed claims via the Internet during the week of March 9, 2001. Nearly all (98 percent) who registered a PIN/password found the instructions very or somewhat easy to follow. Overall, these users rated SSA’s current Internet services as good to excellent. Those declining to request a PIN/password cited a variety of reasons for not doing so. Well over a third stated they didn’t see a need for one or didn’t have enough information regarding available Internet services. (Providing timely, accurate, and useful information and services to the public).
• Evaluation of Field Office (FO) Telephone Service Findings for October 1999 Through June 2000 evaluated the quality and courtesy of FO telephone service. About 100 FOs participated in the survey and handled about 6.4 million incoming calls during the survey period. Using this data, the annualized projected volume of incoming calls for all FOs was estimated to be 85 million for FY 2000. We monitored 1,806 calls. Telephone payment accuracy was 96.1 percent and service accuracy was 90.4 percent. FO employees were extremely courteous to callers with only one incidence of discourteous service noted. (Providing timely, accurate, and useful information and services to the public).
• Report on Customer Segment Surveys of Social Security and SSI Postentitlement Customers focused on the public’s experiences with SSA, their perceptions, expectations, and suggestions for improvement. From May through September 1999, opinions were obtained from about 900 Social Security respondents and 900 SSI respondents who rated service as good or better 85 and 89 percent of the time, respectively. Those who rated service as fair, poor, or very poor, most often cited poor employee performance. (Providing timely, accurate, and useful information and services to the public).
• Interaction Tracking Survey Results--Combined Satisfaction Rates for FY 2000 Performance Reporting measured the percentage of core business customers rating overall service as good or better, and the percentage that rated service as excellent (on SSA’s 6-point world-class service rating scale). Eighty-two percent rated overall service as good or better and 29 percent rated it as excellent, indicating a high degree of satisfaction with service. However, we fell short of our respective FY 2000 88 and 37 percent goals. (Providing timely, accurate, and useful information and services to the public).
Other Accompanying Information 195

• Internet Retirement Benefit (IRIB) Non-User Survey Report surveyed 593 claimants who did not use the Internet to file their Retirement claims. Fifteen percent said they preferred to complete the application with a field office employee, and 40 percent said they had no Internet or computer access. Only 3 percent cited privacy or security as a reason for not filing over the Internet, and 4 percent found the application too complicated or the questions too difficult. (Providing timely, accurate, and useful information and services to the public and providing determinations that are more timely and accurate).
• Fiscal Year (FY) 2000 Supplemental Security Income (SSI) Redeterminations Change Rate Study randomly sampled 12,000 high error-prone redetermination cases, and 4,000 redetermination cases of various types, including limited issue cases. Results projected an estimated $2.1 billion in overpayments and $933 million in underpayments. (Reducing fraud, waste and error in the SSI program).
• Report on the Social Security Replacement Card Fee Survey collected information on who requested replacement Social Security cards and whether/why they would pay for the cards. The survey was conducted in 50 field offices in January and February 2000. It costs SSA $17 to replace one Social Security card, resulting in a total expenditure of $187 million each year. Nearly 90 percent of the applicants were willing to pay a $5 fee for a replacement card, with a third willing to pay $20. If everyone paid $20 for a replacement card, SSA would save $197 million per year. If $5 was paid for a replacement card, and exceptions were made for SSI recipients, persons requesting name changes or corrections, and persons requesting a first or second replacement card, $22 million would be saved each year.
• Appeals Council (AC) Review Process Focus Groups were conducted with claimants and attorneys who have filed appeals disability denials through the AC process. The purpose was to discuss their expectations/experiences with the AC process, solicit their reactions to our AC Process Improvement Plan, and get their recommendations for process improvement. A report of findings/recommendations is under Agency consideration. (Providing timely, accurate, and useful information and services to the public and providing determinations that are more timely and accurate).
• SSA Management Association In-depth Interviews identified 1) key management concerns about technology and communication, and 2) recommendations about how we can improve service to external customers, stakeholder organizations, and the managers of SSA’s workforce. (Providing timely, accurate, and useful information and services to the public)
• AFGE Union Representatives In-depth Interviews with representatives of SSA’s labor organizations obtained their input about how well SSA is providing service to the public. They provided their views on these critical aspects of service: 1) The knowledge level of employees; 2) how helpful SSA is to the public, and 3) and how responsive we are as an Agency. Interview findings are under Agency consideration. (Providing timely, accurate, and useful information and services to the public).
• The Public Understanding Measurement System (PUMS) is the primary evaluation tool for measuring SSA’s progress toward achieving our Strategic Goal: “Strengthening public understanding of Social Security programs,” and meeting our Strategic Objective: “By 2005, 9 out of 10 American adults will be knowledgeable about these programs.” The PUMS is designed to measure public knowledge, the effectiveness of our public education programs, and the effectiveness of our communication activities, including the Social Security Statement. PUMS is a national phone survey of adult Americans (age 18 and over) conducted annually for SSA by the Gallup Organization. Based on FY 2000 PUMS data, we find that 75 percent of Americans (adults age 18 and over) are knowledgeable about Social Security programs. PUMS results also reveal that 80 percent of Americans who contact SSA for information, or who recalled receiving a Social Security Statement, were knowledgeable about Social Security. (Providing timely, accurate, and useful information and services to the public).
196 SSA’s FY 2001 Performance and Accountability Report

The Office of the Inspector General, Office of Audit (OIG/OA) also contributes to SSA's efforts to assure audit and evaluation coordination, and coverage of SSA goals, objectives, key initiatives and business processes. OIA/OA conducts the following types of audits and evaluations:
• Financial statement audits provide reasonable assurance about:
1. Whether the financial statements of an audited entity present fairly the financial position, results of operations, and cash flows in conformity with generally accepted accounting principles; and
2. whether the entity has complied with laws and regulations that may have a material effect on the financial statements.
• Financial-related audits determine whether:
1. Financial information is presented in accordance with established or stated criteria;
2. the entity has adhered to specific financial compliance requirements; or
3. the entity's internal control structure over financial reporting and/or safeguarding assets is suitably designed and implemented to achieve control objectives.
• Economy and efficiency audits/evaluations determine:
1. Whether the entity is acquiring, protecting, and using its resources economically and efficiently;
2. the causes of inefficiencies; and
3. whether the entity has complied with laws and regulations on matters of economy and efficiency.
• Program audits/evaluations determine:
1. The extent to which the desired results or benefits established by the legislature or other authorizing body are being achieved;
2. the effectiveness of organizations, programs, activities, or functions; and
3. whether the entity has complied with significant laws and regulations applicable to the program.
Further details on specific reports may be found in the Office of the Inspector General’s Semiannual Reports to Congress.
Other Accompanying Information 197