
1111tl)11111//111111111il - dtic.mil RECOATED F-16A MONOLITHIC POLYCARBONATE FLAT SHEET ... Dayton,...
60
AD-A239 984 WRDC-TR-90-3078 . AN EXPERIMENTAL EVALUATION OF THE IMPACT RESISTANCE OF RECOATED F-16A MONOLITHIC POLYCARBONATE FLAT SHEET Michael P. Bouchard University of Dayton Research Institute Dayton, Ohio 45469-0110 Interim Report for Period October 1984-March 1989 MAY 1991 Approved for public release; distribution unlimited 91-09302 FLGH DYNAM[ICS LABORATORY 1111tl)11111//1 WRIGHT RESEARCH DEVELOPMENT CENTER AIR FORCE SYSTEMS COMMAND WRIGHT-PATtERSON AIR FORCE BASE, OHIO 45433-6553 91 8 29 03 7
Transcript of 1111tl)11111//111111111il - dtic.mil RECOATED F-16A MONOLITHIC POLYCARBONATE FLAT SHEET ... Dayton,...

AD-A239 984
WRDC-TR-90-3078 .
AN EXPERIMENTAL EVALUATION OF THE IMPACT RESISTANCE OFRECOATED F-16A MONOLITHIC POLYCARBONATE FLAT SHEET
Michael P. BouchardUniversity of Dayton Research InstituteDayton, Ohio 45469-0110
Interim Report for Period October 1984-March 1989
MAY 1991
Approved for public release; distribution unlimited
91-09302
FLGH DYNAM[ICS LABORATORY 1111tl)11111//111111111ilWRIGHT RESEARCH DEVELOPMENT CENTERAIR FORCE SYSTEMS COMMANDWRIGHT-PATtERSON AIR FORCE BASE, OHIO 45433-6553
91 8 29 03 7

NOTICE
When Government drawings, specifications, or other data areused for any purpose other than in connection with a definitelyGovernment-related procurement, the United States Government incursno responsibility or any obligation whatsoever. The fact that thegovernment may have formulated or in any way supplied the saiddrawings, specifications, or other data, is not to be regarded byimplication, or otherwise in any manner construed, as licensing theholder, or any other person or corporation; or as conveying anyrights or permission to manufacture, use, or sell any patentedinvention that may in any way be related thereto.
This report is releasable to the National TechnicalInformation Service (NTIS). At NTIS, it will be available to thegeneral public, including foreign nations.
This technical report has been reviewed and is approved forpublication.
JOSEPH C DAVISSON Jr, 2Lt, USAF PAUL J KOLODZIEJSKI, Capt,USAFWindshield Systems Project Eng. Chief, Windshield SPOAircrew Protection Branch Aircrew Protection BranchFlight Dynamics Directorate Flight Dynamics Directorate
FOR THE COMMANDER
RICHARD E. COLOUHRChiefVehicle Subsystems Division
If your address has changed, if you wish to be removed fromour mailing list, or if the addressee is no longer employed by yourorganization please notify WL/FIVR, WPAFB, OH 45433-6523 to help usmaintain a current mailing list.
Copies of this report should not be returned unless return isrequired by security considerations, contractual obligations, ornotice on a specific dor-mant.

UNCLASSIFIED
SECURITY CLASSIFICATION OF THIS PAGEForm Approved
REPORT DOCUMENTATION PAGE OeNo. 0704-r1o
la. REPORT SECURITY CLASSIFICATION lb. RESTRICTIVE MARKINGS
UNCLASSIFIED2a. SECURITY CLASSIFICATION AUTHORITY 3. DISTRIBUTION/AVAILABILITY OF REPORT
N/A Approved for public release; distribution2b DECLASSIFICATION/DOWNGRADING SCHEDULE is unlimited.
N/A
4. PERFORMING ORGANIZATION REPORT NUMBER(S) S. MONITORING ORGANIZATION REPORT NUMBER(S)
UDR-TR-89-41 WRDC-TR-90-3078
6a. NAME OF PERFORMING ORGANIZATION 6b. OFFICE SYMBOL 7a. NAME OF MONITORING ORGANIZATIONUniversity of Dayton (If applicable) Flight Dynamics Laboratory (WRDC/FIVR)
Research Institute Wright Research and Development Center
6c. ADDRESS (City, State, and ZIP Code) 7b. ADDRESS (City, State, and ZIP Code)
300 College Park Dr.Dayton OH 45469-0110 Wright-Patterson AFB OH 45433-6553
8a. NAME OF FUNDING/SPONSORING 8b. OFFICE SYMBOL 9. PROCUREMENT INSTRUMENT IDENTIFICATION NUMBERORGANIZATION (If applicable)
Wright Research & Development F33615-84-C-3404
8'c. ADDRESS (City, State, and ZIP Code) 10. SOURCE OF FUNDING NUMBERSPROGRAM PROJECT TASK WORK UNIT
Wright-Patterson AFB OH 45433-6553 ELEMENT NO. NO. NO ACCESSION NO.
PE64212F 1926 01 12
11 TITLE (Include Security Classification)AN EXPERIMENTAL EVALUATION OF THE IMPACT RESISTANCE OF RECOATED F-16AMONOLITHIC POLYCARBONATE FLAT SHEET
12. PERSONAL AUTHOR(S)Michael P. Bouchard
13a. TYPE OF REPORT 13h TIME COVERED 14. DATE OF REPORT (Year, Month, Day) 15. PAGE COUNTInterimI FROM Oct 84 TO Mar 89 1991 May 59
16 SUPPLEMENTARY NOTATION
17. COSATI CODES 18. SUBJECT TERMS (Continue on reverse if nocessary and klentify bv block number)
FIELD GROUP SUB-GROUP F-16A Forward Canopy Polycarbonate Sheet
Coated Polycarbonate Strip and Recoat
Recoated Polycarbonate (continued)
19 ABSTRACT (Continue on reverse if necessary and identify by block number)F-16A coated monolithic polycarbonate forward canopies experiencing coating degradation arebeing reworked by the vendor by stripping the degraded coating and applying a new protectivecoating, thereby restoring the canopy for additional useful service life. The basicobjective of the current investigation was to determine whether or not the impact resistanceof monolithic polycarbonate flat sheet material for the F-16A forward canopy is degraded bythe stripping and recoating process. The effects of laboratory storage and QUV weatheringwere also evaluated. Coupons (beams) were fabricated and subjected to QUV weathering,
I laboratory storage, and/or stripping/recoating (which was performed by the vendor). Thecoupons were then impact tested :sing either the fallirng weight beam tesL technique (ASTIMF736-81) or a high rate (40,000 in/min center deflection rate) open loop servohydraulic (MTS)beam test technique. The primary conclusion of the investigation was that the strip and
recoat process did not degrade the impact resistance of the polycarbonate relative to the
impact resistance of new coated polycarbonate. In other words, the strip and recoat process
20 DISTRIBUTION/AVAILABILITY OF ABSTRACT 21. ABSTRACT SECURITY CLASSIFICATIONOUNCLASSIFIEDIUNLIMITED 0 SAME AS RPT KJ DTIC USERS Unclassified
)2 ?; NAME OF RESPONSIBLE INDIVIDUAL 22b. TELEPHONE (Include Area Code) I 22c. OFF'ICE vNIPL
Capt Paul J. Kolodziejski (513) 255-6524 1 WRDC/FIVR
D ,r-! I I- JN b Previous editions are obsolete SECURITY CLASSIFICATION OF THIS PAGE
UNCLASSIFIED

P)D FORM 1473 (cont'd)
Block 18: Laboratory storageImpact resistanceFalling weight beam test
MTS beam test
Liiock 19:
restored the impact resistance of the reworked polycarbonate to its originale~jlv-fabricated, newly-coated state, regardless of prior conditioning (QUV-atering or laboratory storage).

FOREWORD
The effort reported herein was performed by the University of Dayton Research
Institute, Dayton, Ohio, under Contract No. F33615-84-C-3404, "Birdstrike Resistant Crew
Enclosure Development Program." This work was administered by the Flight Dynamics
Laboratory, Wright Laboratories, Wright-Patterson Air Force Base, Ohio, with
administrative direction provided by Capt. Paul Kolodziejski and Lt. Duncan Dversdall,
WL/FIVR. The work was performed during the period October 1984-March 1989.
Project supervision and technical assistance were provided through the Aerospace
Mechanics Division of the University of Dayton Research Institute with Mr. Dale H.
Whitford, Supervisor, and Mr. Blaine S. West, Head, Structures Group and Project
Engineer. Mr. Michael P. Bouchard served as Principal Investigator. The author
gratefully acknowledges the efforts of the following individuals from UDRI: Mr. Fred
Pestian and Mr. Pete Muth for fabricating the test specimens, Mr. Tom Helmick and Mr.
Cris Williams for performing the MTS beam tests, Mr. Chuck Griffin for performing the
QUV weathering, and Mr. Kurt Ostdiek for helping perform the falling weight beam
tests. DTI,
COPYINSpf CTED
Pee4
5- ,/-.. ..~~ ~......._
±ii1

TABLE OF CONTENTS
SECTION PAGE
I INTRODUCTION 1
1.1 Background 1
1.2 Objectives 2
1.3 Scope 3
2 EXPERIMENTAL INVESTIGATION 4
2.1 Technical Approach 4
2.2 Specimen Fabrication 4
2.3 Specimen Conditioning 13
2.4 MTS Beam Tests 16
2.5 Falling Weight Beam Tests 18
3 RESULTS AND DISCUSSION 22
3.1 Baseline Results 28
3.2 Results for Laboratory Storage With and Without Stripping/Recoating 28
3.3 QUV Weathering Results 31
3.4 Results for QUV Weathering With Stripping/Recoating 33
3.5 Comparison With Recoated Canopy Specimen Results 35
4 CONCLUSIONS AND RECOMMENDATIONS 42
4.1 Conclusions 42
4.2 Recommendations 43
REFERENCES 45
APPENDIX A: MTS BEAM TEST RESULTS A-1
APPENDIX B: FALLING WEIGHT TEST RESULTS B-1
Iv

LIST OF ILLUSTRATIONS
FIGURE PAGE
2.1 Layout for Beam Groups H and I 7
242 Layout for Beam Groups A, B, and G
2.3 Layout f -r Beam Groups K. L, and M 9
24 Layout for beam Groups C, D, and F 10
2.5 Layout for Beam Groups E and J I1
2.6 Schedule for Specimens Stored in Laboratory 14
2.7 QUV Weathering Apparatus ;5
2.8 MTS Test Setup
2.9 Falling Weight Test Apparatus 19
2.10 Threshold of Failure Cracking 21
3.1 Typical MTS Load-Displacement Curves, 40,000 in/min Deflection Rate 23
3.2 (Re)Coated F-16A Monolithic Polycarbonate Flat Sheet Beam Test Results 27
3.3 Baseline Flat Sheet Beam Test Results 29
3.4 Flat Sheet Beam Test Results for Specimens Stored in Laboratoryand Stripped/Recoated 30
3.5 Flat Sheet Beam Test Results for Specimens Weathered in QUV 32
3.6 Flat Sheet Beam Test Results for Specimens Weathered in QUV andStripped/Recoated 34
3.7 Recoated F-16A Monolithic Canopy Beam Test Results 37
3.8 Typical Failure Modes for the Flat Sheet Beams 40
3.9 Typical Failure Modes for the Canopy Beams 41
vi

LIST OF TABLES
TABLE PAGE
2.1 Conditioning and Test Matrix for F-16A (Re)Coated Flat Sheet Specimens 5
2.2 Procedure for Sanding Off Inside Coating 12
3.1 Summary of MTS Beam Test Results 24
3.2 Summary of Falling Weight Test Data 26
3.3 History of Recoated F-16A Canopy Beams 36
vii

SECTION 1
INTRODUCTION
1.1 Background
The monolithic 0.75-inch-thick polycarbonate canopy of the F-16A fighter aircraft
is protected by a thin coating on the inside and outside surfaces which enhance the
canopy's resistance to moisture, ultraviolet radiation, and abrasion. In time, however, the
coatings on in-service canopies tend to degrade via crazing, abrasion, erosion, peeling, and
other phenomena. In the past, when the coating condition became intolerable, the
canopies were discarded and replaced with new ones. In 1980, however, a process was
developed by the vendor (Texstar, Inc.) to strip the degraded coating from a canopy so
that the canopy can be recoated and placed back in service, thus saving much of the cost
of manufactuting new replacement canopies.
In August 1984, the United States Air Force conducted birdstrike tests on recoated
F-16A canopy assemblies to characterize the bird impact resistance of recoated canopies.1
A subsequent investigation determined, in part, the effects of recoating on the impact
resistance of samples obtained from the same birdstrike-tested canopies. 2 The
chromatography tests conducted indicated no significant degradation of the polycarbonate
molecular weight (MW) and molecular weight distribution (MWD) at the surface relating
to the substrate due to the recoating process. Although MW and MWD directly affect
impact resistance, 3'4 it could not be categorically concluded that degradation of the impact
resistance had not occurred since such degradation could have occurred without affecting
MW and MWD (for example, by physical aging5). Unfortunately, it was not possible to
directly evaluate deoradation of the impact resistance because of recoating using a
mechani.al test since no baseline of comparison (that is, a newly-manufactured coaxedt
.anopy) was available.
The effort documented herein was therefore conducted as a separate and parallel task
to evaluate directly via mechanical testing the effect of the recoating proce s on e :i-
resistance of polycarbonate sheet used for fabricating F-16A monolithic forward canepies.
All specimen conditioning and testing was performed on flat sheet material in the
laboratory to obtain better control of all pretest and test parameters.
1.2 Objectives
The objectives of this effort were to:
1. Determine whether or not the impact resistance of coated monolithic
polycarbonate for F-16A forward canopies is degraded by the stripping and recoating
process (including multiple strips and recoats on a single sample of material) uscd by th
vendor.
2. Determine how artificial weathering using the QUV apparatus influences the
impact resistance of F-16 coated monolithic polycarbonate.
3. Correlate test results for this investigation with test results for a similar study
conducted using specimens fabricated from recoated F-16A canopies. 2
4. Correlate falling weight and MTS test results obtained from this investigation.
2

1.3 Scope
Beam specimens v.-I're fabricated from flat sheet material that had been coated or
recoated by the vendor. Prior to each recoating and/or test, the beams were subjected
either to QUV weathering or laboratory storage. Both MTS and falling weight three-point
beam tests were subszquenfly condu-ted.
3

SECTION 2
EXPERIMENTAL INVESTIGATION
2.1 Technical Approach
Table 2.1 presents the conditioning/test matrix for the investigation. Polycarbonate
in flat sheet form was obtained from the vendor, who applied surface coatings in
acccdance with current F-16A monolithic polycarbonate canopy procurement
specifications. Baseline impact resistance data. were establis!ietd bv perfcrrring three-point
MTS flexural beam tests on the material, both is-recrived and wilii the coating removed
(specimen groups B and A, respectively). The remaining material was conditioned, either
by storage in a controlled laboratory environ.nent (groups C-F) or by weathering in the
QUV apparatus (groups G-M), prior to testing. Some of this material (groups J-M) was
also sent back to the vendor after conditioning to have the coating stripped and reapplied
using the same tec;-niques employed in stripping and recoating the F-16A forward
canopies. Some material received multiple equivalent years of QUV weathenng and/or
strips and recoats prior to beam testing (groups H, I, K, L, and M). Falling weight three-
point beam tests were performed for comparison to the MrS results for groups B-E and
G-L.
2.2 Specimen Fabrication
Five flat sheets of press-polished polycarbonate, coated on both sides with C-254
coating (per current F-16A coated monolithic polycarbonate canopy practice) were
received from the vendor. The nominal sheet dimensions were 10.5 inches x 32 inches
x 0.75 inch thick. Arrows which pointed to the surface that was to be conditioned and
4
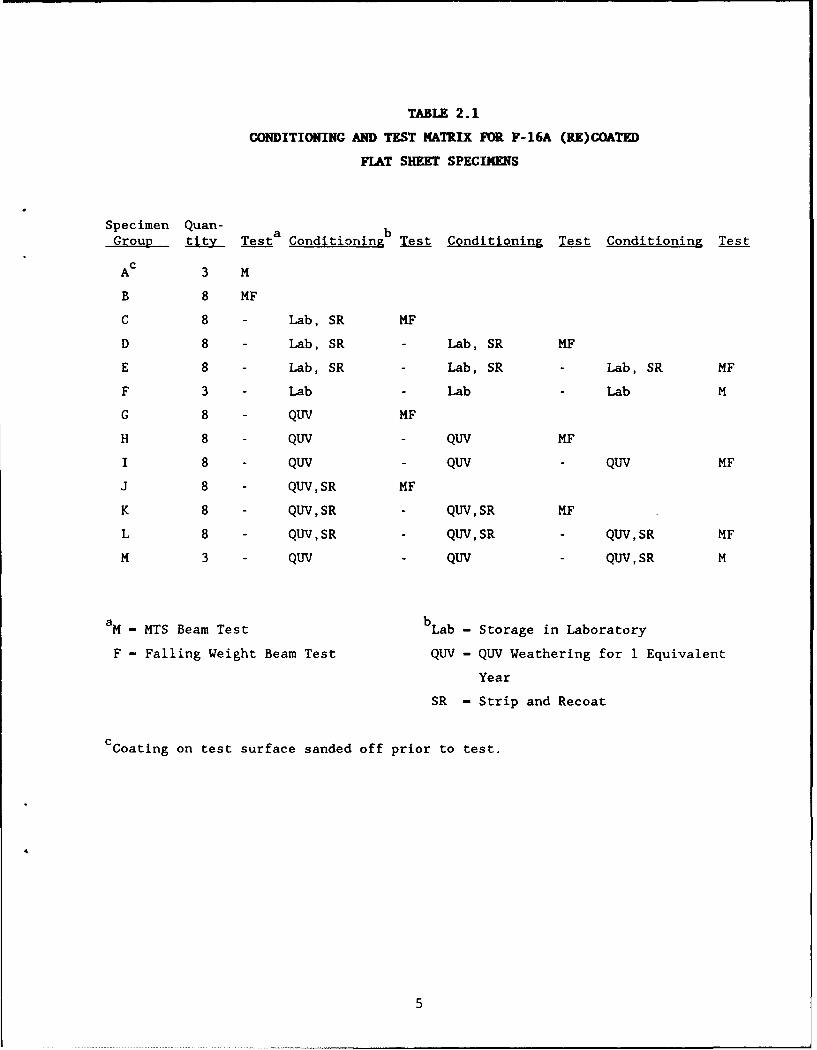
TABLE 2.1
CONDITIONING AND TEST MATRIX FOR F-16A (RE)COATED
FIAT SHEET SPECIMENS
Specimen Quan-Group tit Test Conditioning Test Conditioning Test Conditioning Test
Ac 3 M
B 8 MF
C 8 - Lab, SR MF
D 8 - Lab, SR Lab, SR MF
E 8 - Lab, SR Lab, SR Lab, SR MF
F 3 - Lab Lab Lab M
G 8 - QUV MF
H 8 - QUV QUV MF
I 8 - QUV QUV QUV MF
J 8 - QUV,SR MF
K 8 - QUV,SR QUV,SR MF
L 8 - QUV,SR QUV,SR QUV,SR MF
M 3 - QUV QUV QUV,SR M
aM - MTS Beam Test bLab - Storage in Laboratory
F - Falling Weight Beam Test QUV - QUV Weathering for 1 Equivalent
Year
SR - Strip and Recoat
Coating on test surface sanded off prior to test.
5

tested were engraved on the edges of the sheets. All conditioning, stripping, and recoating
,vas accomplished on the flat sheets prior to fabrication of the beam specimens.
The geometry of both MTS and falling weight beam specimens was chosen, in
conformance with ASTM Method F736-81 6, to be 10.5 inches long, 1.5 inchcs wide. and
0.75 inch thick (nominal flat sheet thickness). The width tolerance as ±0.010 inch while
the length tolerance was +0.125 inch, -0 inch (the length dimension was not critical except
that it had to be adequate to prevent the specimen from being pushed through the test
supports). Figures 2.1-2.5 show the layouts of all beams from the parent sheets.
Fabrication of the beams was accomplished by first masking the flat surfaces of the
sheets with Protex 8216-2L protective tape. The required beams were then band-sawed
from the appropriate parent sheet. Each beam was machined to its final dimensions in the
UDRI Machine Shop. The side of a sharp, eight-flute, 1.5-inch-diameter cutter was used
for machining. The spindle speed was 900 rpm while the table feed was 6.5 in/min. An
identifying code was then engraved at one end of each beam on the conditioned (test)
surface (the same surface to which the arrow engraved on the edges pointed). The code
was of the form "X-Y", where X was the specimen group designation (A, B, C, ..., M)
and Y was a single-digit identifier used to distinguish specimens from the same group.
The long edges of each beam were lightly sanded with 400-grit emery paper prior to
testing to minimize any edge stresses.
Past discussions with the canopy vendor had revealed that fine-grit sanding was an
acceptable method for removal of the test (tensile) surface coating of the group A
specimens (sanding is part of the manufacturer's surface preparation prior to canopy
recoating). The sanding procedure, which was developed under a previous test program, 2
is outlined in Table 2.2. The intent of the sanding was to remove the coating and leave
6

'-4
IY 0
I-4
Cl) 0
CD
I:J
7 54Ix
C?

C)
m
LLJ 0
m T .
U) -,
a0

cw,
(00
LL-J
LLJ 0
4-)
U) 0
00
0
r1

U-
U.
40
0
100

a))
0m
UU
LU U)-, 04
w 41
w 00
>4
LLA
i
:-I
CrJ4
w

TABLE 2.2
PROCEDURE FOR SANDING OFF INSIDE COATING
a c
Paper oE Wet SandingStev Solution Grit or Dry Direction Comments
dI Paper 280 Wet Longitudinal Sand until coating remrcvse d.
until appearance uniform
2 Paper 400 Wet Longitudinal Sand until uniform appearance
3 Paper 600 Wet Longitudinal Sand until uniform appearance
4 Paper 0000 Dry Longitudinal Sand until uniform appearance
5 Solution 1 micron Wet Swirl Sand until uniform appearance
Notes:
apaper - emery
bSolution - suspension of I micron A12 03 in H20 (25-30g to 300 ml) rubbed wit.h
soft pad
CWet = paper wetted before sanding
dcoating removal evident by following observations: when begin sanding,
surface will turn hazy white due to scratching of coating. When sand
completely through coating, surface will become more clear (transparent).
More sanding will again cloud surface as polycarbonate is scratched.
12

a surface free of adverse stress concentrations from scratching by the various sanding
mediums. The test surface was therefore not optical quality when sanding was complete,
but scratches were very shallow and oriented along the length of the beam (transverse
scratches could have caused high stress concentrations in the presence of bending stresses
during testing7).
2.3 Specimen Conditioning
Specimen pretest conditioning consisted of laboratory storage and QUV weathering.
For laboratory storage, the flat sheet material for specimen groups C-F was placed on edge
in a box with a thin layer of packaging foam separating adjacent sheets to prevent
scratching. The box was stored in a laboratory maintained at 73±4'F and 50±5% relative
humidity. Figure 2.6 summarizes the laboratory storage schedule for each specimen
group.
Artificial weathering of the specimens for groups G-M was accomplished using the
QUV apparatus shown in Figure 2.7. The apparatus, which was manufactured by the
Q-Panel Company of Cleveland, Ohio, consists of two banks of four fluorescent bulbs
each, aligned parallel to two specimen racks. Closing in the underside of the unit is a
shallow pan and water heater. The controls and air heater are located on top of the unit.
Specimens are mounted such that their clearance from the bulbs is 2 inches. The bulbs
are Q-Panel 48-inch fluorescent UVB-313, providing UV-B radiation with maximum
output at 313 nanometers and a minimum output at 280 nanometers (1% of peak output).
Functionally, the QUV tester provides continuous output of heat with alternating UV
radiation and condensation. A cycle timer adjusts the starting and ending times for the
condensation and ultraviolet conditionings. The timer was set for 7 hours of radiation
13

Months of Laboratory Storage
0 3 6 9 12 15 18 21 24 27
Group C R - T
Group D R R T
Group E R R - R T
Group F T
R - Strip and Recoat
T - Test
Note: Storage Started 25 July 1985
Figure 2.6. Schedule for Specimens Stored in Laboratory.
14

Controls andAir Heater
O Oa UV Lamps
O 0 Swing-up Door
W r fSpecimen RackWat-er for 0
Condensation
Water Heater
Base Cabinet
Schematic Cross Section
Figure 2.7. QUV Weathering Apparatus.
15

followed by 5 hours of condensation. This cycle was repeated as needed to fill tz-
required total exposure duration. One equivalent year of QUV weathering was 192 hours
of exposure (including both radiation and condensation hours). The cycle and exposure
times had been computed under previous test programs based on weather data for Phoenix,
Arizona.8'9' 10 The temperature during the entire exposure was 120±10'F.
All stripping and recoating was accomplished by the vendor. Both sides of the
sheets were stripped and recoated with identical formulations of C-254 coating. As
previously mentioned, the stripping process involves sanding of the coating, but the
particular details of this process (and the recoating process) are proprietary to the canopy
manufacturer.
2.4 MTS Beam Tests
All MTS beams were loaded in three-point bending with the conditioned surface in
tension using a nominal 4.5-inch span in accordance with ASTM Method F736-81 6 and
0.75-inch-diameter supports and loading nose. The relatively short span specified in the
falling weight method was chosen for the MTS tests to ensure that results could be
correlated with falling weight tests (Section 2.5) and because a long span allows the
highly ductile polycarbonate to push through the supports without failure (fracture). A
high performance, high rate, open loop test system that included an axial load frame, load
cell, displacement transducer, compressed nitrogen drive unit, and computer
controller/recorder, manufactured by MTS Systems Corporation, was used for all testing.
Figure 2.8 shows the test setup.
From Figure 2.8, it is apparent that the loading nose was not in contact with the
specimen at the beginning of each test. Instead, it was located approximately 7 inches
16

Jr 0
1%

from the specimen to allow it to attain the desired deflection rate (loading velocity) of
40,000 in/min. Note that since the system was operated in open loo1p (no feedback
control) configuration, this loading rate was not maintained during test, but decreased after
loading nose impact. The open loop configuration was used because the high strain rates
desired could not be obtained using the slower, closed loop configuration. The 40,000
in/min deflection rate "esulted in a calculated initial strain rate in the beam of nearly 150
in/in/sec, charactenstic of expected transparency strain rates during impact (UDRI has
computed strain rates of 100-450 in/in/sec from a limited number of high-speed films of
birdstrike tests on T-38 and F-Ill windshields). Appendix A of Reference 2 details the
strain rate calculation for beams subjected o three-point bending. The maximum
displacement of the loading nose after impact v ith the specimen was limited to 3.5 inches,
excluding any compression of the load nose pads and necking/compression of the
specimen. A computer stored load and displacement data generated by tr,',sducers
mounted in the loading nose assembly. Graphs of load versus displacement were obtained
subsequent to testing by sending the data from the computer to an X-Y pen plotter. Based
on earlier studies,2 strong transient vibrations caused by the shock of loading nose impact
were damped by wrapping Cabot Corporation's C1002-12 damping material around the
loading nose and the supports. The thicknesses were 0.25 inch for the loading nose wrap
and 0.125 inch for the support wrap.
2.5 Falling Weight Beam Tests
The falling weight beam specimens were tested in accordance with ASTM Method
F736-81. The span was 4.5 inches and the diameter of the loading nose aid supports was
0.25 inch. No damping material was required for these tests.
Figure 2.9 shows the UDRI Falling Weight Impact Test \pparatus used for the
testing. It consisted of a supporting frame and concrete base; adjustable-span reaction
18

Coated Cable Guides
Aluunumnabl
Support Plate
Hand
Rebound Catch Protective

supports; loading nose; detachable, interchangeable, and variable-mass drop weights; a
two-cable system to guide the falling weight to the center of the specimen at a velocity
approaching free fall; automatic release mechanism; and rebound catch mechanism.
The energy absorbed by the specimens was assumed to be the potential energy of
the drop weight assembly relative to the test specimen, and was computed from
E=Wh
where
E = absorbed energy, in inch-pounds;
W = weight of loading nose, release mechanism, and drop
weight, in pounds;
h = drop height, in inches.
Absorbed energies computed from the MTS load-displacement plots were used as a guide
in selecting W and h for the falling weight tests.
The desired failure mode was a visible open crack on the tension surface of the
specimen, as shown in Figure 2.10. The drop weight and height were varied from their
initial values until this failure mode was achieved. The remaining specimens were then
tested at the revised weight and height values to verify the threshold-of-failure energy.
20

Figure 2.10. Threshold of Failure Cracking.
21

SECTION 3
RESULTS AND DISCUSSION
A total of 39 MTS beam tests and 52 falling weight beam tests were performed, with
the results for each test being detailed in Appendices A and B. Figure 3.1 presents typical
MTS load-displacement curves from which the data was derived. The data were obtained
using the procedure documented in Appendix C of Reference 2. Tables 3.1 and 3.2
summarize the average values and standard deviations for each group of MTS and falling
weight specimens. Figure 3.2 contains the same data as Tables 3.1 and 3.2, but in bar
chart form for easier visualization and comparison of results. The height of the small "T"
on top of the bars represents one standard deviation.
From Figure 3.2, the absorbed energy and maximum displacement show significant
variation from one group to another, indicating that these quantities were sensitive to the
various means of pretest conditioning that were employed. On the other hand, the peak
load and flexural modulus show relatively little sensitivity to changes in pretest
conditioning. Because of these trends, absorbed energy and maximum displacement are
the data of primary interest in the evaluation of the recoated material which follows.
From Figure 3.2, it is also evident that the falling weight absorbed energies were
generally much less than the MTS absorbed energies. The difference was primarily due
to the fact that two different energies were being computed. For the falling weight test,
the energy being computed was the failure energy, which was the energy required to
produce a visible open crack in the specimen tension surface. For the MTS test, the
computed energy accounted for all energy absorbed, which included the failure energy and
22

I I Specimen A-i
-T I I
Di spl acement 0.5 in.
Specimen B-2
p II
*IILI
Figure 3.1. Typical MTS Load-Displacement Curves, 40,000 in/mmnDeflection Rate.
23

TABLE 3.1
SUNARY OF MTS BEAN TEST RESULTS
Peak Displacement Flexural Absorbed Maximum
Specimen Load at Peak Load Modulus Energy Displacement
Group_ (ib! __(in)___ (ksi) (in-lb tin)
A 3275 0.48 292. 7386 3.71
223 0. 24. 227 0.02
B 3723 0.5 293. 5158 1.94
91 0.01 27. 24 0.06
C 4375 0.57 384. 5643 2.74
49 0.01 25. 593 0.23
D 3772 0.52 317. 4787 2.76
73 0.01 26 412 0.21
E 4382 0.49 356 4951 1.78
137 0.05 2 176 0.08
F 4168 0.49 319 4236 1.55
125 0.02 11 465 0.16
G 4350 0.51 412 7073 2.88
265 0.01 25 17 0.4
H 3912 0.51 306 7346 3.89
122 0.01 27 174 0.13
24

TABLE 3.1 (continued)
Peak Displacement Flexural Absorbed Maximum
Specimen Load at Peak Load Modulus Energy Displacement
Group- (lb) (in) (ksi)__ (in-lb). (in)
I 4353 0.54 329 7522 3.69
71 0.01 23 296 0.27
3 4478 0.56 346 5741 2.47
38 0.01 21 958 0.69
K 3653 0.47 337 3678 2.09
237 0.06 35 0 0.
L 4500 0.54 352 4168 1.51
28 0.03 19 100 0.04
M 4487 0.55 327 4276 1.60
28 0.02 20 569 0.20
Note: Computed strain rate for all tests was approximately
150 in./in./sec.
25

TABLE 3.2
StMNARY OF FALLING WRIGHT TEST DATA
Failurea
Specimen Strain Rate Energy
Group (in./in./sec.) (in-lbs)
B 76 1560
C 92 <2420b
D 71 2510
E 56 1560
G 91 >2360C
H 84 6860
I 69 5710
J 84 2040
K 61 1820
L 59 1720
aStrain rate computed per Appendix A of Reference 2.bFailure energy is less than the reported value.
c Failure energy is greater than the reported value.
26

r4
44
Q)
-OOO xI sq-POJODm
0~0E4
4 -4r14
0
w r-42 2 C
0 (0
-- - - - - - w
00
C, 4
WU)o xU oq-l ~u ilp ,l);~9ij~0o~m T
27a

any energy absorbed after initial cracking occurred. The results for groups H and I, which
were exceptions to this general trend, are discussed in Section 3.3.
Another difference between MTS and falling weight results was in the computed
strain rate values. The MTS value (150 in/in/sec) was 1.6-2.7 times greater than the
falling weight values (56-92 in/in/sec). The difference occurred because the falling weight
drop heights were not high enough to achieve impactor velocities which would produce
values comparable to the MTS values.
3.1 Baseline Results
Figure 3.3 presents the average test results for the as-received and stripped baseline
cases. The absorbed energy and maximum displacement for the as-received coated
specimens (Group B) were markedly decreased compared to the stripped specimens
(Group A). The absorbed energy decreased from 7390 in-lb to 5160 in-lb (a 43%
decrease) while the maximum displacement decreased from 3.71 in to 1.94 in (a 91%
decrease). The data indicate that the newly applied coating reduced the impact resistance
of the uncoated polycarbonate sheet. This reduction in impact resistance because of the
coating was consistent with the findings of previous research conducted on F- 16A coated
monolithic polycarbonate material.2 11
3.2 Results for Laboratory Storage With and Without Stripping/Recoating
Figure 3.4 presents the average test results for those specimens subjected to
laboratory storage and, for three cases, stripping and recoating. Also presented for
comparison are the baseline results. Specimen group F, which retained its original coating
and which received the longest storage time, 25 months, experienced no significant loss
in impact resistance. The absorbed energy was similar to the coated baseline (Case B)
28

(A -C-
2 22
~E-
-jP
(I) -a. -
aa
06 c.
E E
29U

1-4
4-1
a0 o 0
0.0
w( WjV) ro
a)
44
C4 )WOO x oq;) pooi l owmn (isdl) sninponl .usu..
04.4
4.)
-4
a)m
__ __ _ __a_ _ E-__ __ __ _ 0.
0)-
u-NP 4J
w 4+++ QCL i
x x ~U) 4
Ia. r-4 m
IA~ WV)WV
4 .~ 4
(ooot x sqi-uj) A&jou3 ei~ (-ul) luonDtdht3 owwin
30

results while the maximum displacement was greater than or equal to the Case B results
(but not up to the maximum displacement of the Cave A stripped specimens). The results
therefore indicate that 24 months storage in the controlled laboratory environment did not
degrade the impact resistance of the coated polycarbonate sheet. The results also indicate
that the stripping and recoating process, in conjunction with the laboratory storage, did not
degrade the impact resistance, even for samples which were stripped and recoated three
times.
3.3 QUV Weathering Results
Figure 3.5 presents the average tert results for those specimens subjected to QUV
weathering. Also presented for coisiparison are the baseline results. The absorbed
energies and maximum displacements were similar to those for the stripped (Case A)
baseline specimens even though all samples receiving QUV weathering were coated. The
results show that the QUV weathering alleviated the embrittling effect of the coating,
restoring the impact resistance of the coated polycarbonate to levels obtained by uncoated
polycarbonate. (However, as discussed in Section 3.5, the-re was a significant decrease in
coating adhesion owing to t" QUV weathering.) Nearly all of the increase in absorbed
energy was obtained in the first equivalent year cf weathering, with only slight increases
occurring thereafter. Note finally that the falling weight energies were approaching the
values of the MTS energies. The specimens for these groups experienceu ,,xtensive
ductile deformation prior to cracking. Therefore little energy was absorbed after cracking,
so that the falling weight and MTS energies nearly coincided. These same trends (in
QUV effects on coated monolithic F-16A polycarbonate impact resistance and on MTS
versus falling weight absorbed energies) have been noted in other studies conduc ted on
F-16 coated monolithic polycarbonate material.2'10
31

0 0 0
00.0
aa
00
o 4J(00 x sq) 0 8(00 xaq) DO osin (!odil) snjnpofl4 eusuel-
cj)
a)
CIU)2 -4 - -P
_ _ _ _ _ CL
w CLx
z (na e
(0ee w .qju! iweu V)rio rq)wwo~di ~i
32

3.4 Results for QUV Weathering With Stripping/Recoating
Figure 3.6 presents the average test results for those specimens subjected to QUV
weathering and subsequent stripping and recoating. Three groups (J, K, and L) were
stripped and recoated after each equivalent year of QUV weathering while one group (M)
was recoated after 3 equivalent years of QUV weathering. The MTS absorbed energy and
maximum displa-ement data for groups J, K, and L show fairly significant differences, for
unknown reasons. Even so, these data, along with the falling weight data, indicate that
the impact resistances for these groups, and also for group M, were similar to the baseline
coated impact resistance. Therefore there appears to have been no degradation of impact
resistance because of the combined QUV weathering and stripping/recoating processing.
Note that the increase in impact resistance because of QUV weathering discussed in
Section 3.3 was not evident in the results for groups J, K, L, and M because stripping and
recoating followed all weathering for these groups. The stripping and recoating process
thus ap'-ears to have restored the weathered specimens to "like-new" condition from the
standpoint of impact resistance.
Finally, there was no significant difference in impact resistance between the
specimens which were stripped and recoated after each of 3 equivalent years (group L)
and those which were stripped and recoated after completing 3 continuous equivalent years
of QUV weathering (group M). Thus the accumulation of several strip and recoats did
not degrade the impact resistance relative to either the baseline results or to the results for
specimens receiving only a single strip and recoat. These results for multiple
strips/recoats agree with those of Section 3.2.
33

f~
0
4-)
in u
* C:)
4 I44
(1sd~~~~i)Q mnnol*HU. /P I0
)
C) 0
L))0, M4J
at E r-4
4c m a)
0 G
(ooot~~~ x ILQ ~qu ilD4(*l uusolsaemi
34IL

3.5 Comparison With Recoated Canopy Specimen Results
Reference 2 includes discussion of MTS and faiing weight three-point beam tests
performed on F-16A forward monolithic polycarbonate canopies that had been recoated
and, in some cases, had been subjected to additional service life after recoating. Table 3.3
summarizes the recoated canopy specimen groups and service history.
Commercially-available uncoated Lexan served as a baseline for these tests. Figure 3.7
presents a bar chart summary of the MTS test results. The results are directly comparable
to Figures 3.2-3.6 since all test conditions were similar.
Comparing stripped baseline results (group A) from Figure 3.1 with the results for
stripped specimens (groups 166, 320, 512, 408, and 525) from Figure 3.7 reveals excellent
agreement in MTS absorbed energies and maximum displacements. The absorbed energy
and maximum displacement for the group A flat sheet specimens was 7386 in-lb and 3.71
in, respectively, compared to 6711-7600 in-lb and 3.68-3.86 in for the canopy specimens.
The magnitudes of the peak loads and flexural moduli of the flat sheet and canopy
specimens were also similar. As with the flat sheet specimens, the flexural moduli of the
canopy specimens showed no correlation with pretest conditioning (service life). The
canopy specimen peak load showed some correlation with service life (no correlation was
evident for the flat sheet specimens), with the peak load for the newly recoated canopy
specimens (groups 166 and 320) being approximately 25% less than the peak loads for
the canopy specimens which had received service life after recoating (groups 512, 408)
or original coating.
Comparing the test data for the newly coated flat sheet specimens (group B) with
the newly recoated canopy specimens (groups 166 and 320) shows a considerable
difference in impact resistance. The canopy specimen energies were 86% less than the
flat sheet energies (720 in-lb versus 5160 in-lb) while the maximum displacements were
35

TABLE 3.3
HISTORY OF RECOATED F-16A CANOPY BEAMS
(From Reference 2)
Specimen Months of Service Canopy Months of Service
Group* Before Recoating Recoated? After Recoating
Lexan 0 No -
166 51 Yes 0
320 41 Yes 0
512 16 Yes 17
408 11 Yes 22
525 35 No -
*Number indicates serial number of canopy. "Lexan" denotes commercial-grade,
uncoated polycarbonate used as a baseline.
36

-4-
0 06
o-44
E EC1
>)
IN 0)(Go k x q) Poo -iuji 0
r'.
0
1 00
4i4.
04-~Ii to
(000 x) s-l bou ii~
37

76% less (0.46 in versus 1.94 in). The small differences in specimen thickness and test
span (10% at most) could not account for these sharp differences. The data appear to
indicate that the differences were due to differences in the C-254 coatings that were
applied to both the flat sheets and canopies. It is known that various formulations of the
C-254 coating can be produced which can adjust the coating hardness. It appears that the
flat sheet material received a softer coating formulation than the canopies. Despite the
differences in the resulting data, the data trends for the flat sheet and canopy coated
specimens were the same (i.e., absorbed energy and maximum displacement for
uncoated/stripped material is greater than those of a newly coated material, and increasing
weathering/service life duration results in increasing absorbed energy and maximum
displacement).
The absorbed energy and maximum displacement for the coated canopy specimens
show increasing impact resistance with increasing service life. The impact resistance
reached the same level as the stripped canopy specimens for canopy 525 after 35 months
of service life following the application of the initial coating. Note that for the flat sheet
coated samples, the impact resistance reached levels comparable to the stripped specimens
after only I equivalent year of QUV weathering. One equivalent year of QUV weathering
was therefore possibly equivalent to 3 years of service life of canopy 525 in terms of
achieving similar effects on impact resistance. (As discussed above, the flat sheet coating
was apparently softer than that applied to the canopies, so that not as much coating
degradation was required to reach impact resistance levels typical of uncoated material.
Therefore it is possible that I equivalent year of QUV could equal less than 3 years of
canopy 525 service life.) With respect to impact resistance of coated monolithic
polycarbonate, the QUV cycle times and duration for 1 equivalent year of weathering may
have been too severe to simulate the effects of 1 actual year of canopy service life. The
severe effects of QUV weathering on impact and craze resistance have been noted in
previous studies.9' 10
38

Figures 3.8 and 3.9 present failure modes for the flat sheet and canopy beams,
respectively. The baseline stripped (B) and Lexan (L) baseline beams showed excellent
ductile deformation, although the Lexan beams cracked deeply for unknown reasons. The
newly coated (A) and recoated (M and 166) beams showed little permanent deformation
prior to fracture into two pieces. The beams with the original coating and subsequent
QUV weathering (1) or service life (525) showed excellent ductile deformation. All of the
QUV beams (G, H, and I) showed excellent ductility, although the G beams all fractured
into two pieces, two of the H beams fractured into two pieces, and only one of the I
beams fractured into two pieces. None of the canopy 525 beams fractured into two
pieces. Yield lines in the coatings of the flat sheet and canopy beams were similar. The
newly coated beams had coarsely-spaced transverse yield lines which penetrated deep into
the polycarbonate substrate as a result of testing. With increasing service life or QUV
weathering, the lines became more closely spaced and shallow, giving a hazy appearance
to the test surface. For the 2 and 3-year flat-sheet beams with the original coating and
QUV weathering (H and I) and the canopy beams with the original coating and service
life (525), the coating adhesion was reduced significantly, so that the yield lines did not
penetrate the polycarbonate substrate and the coating was easily removed by scratching
by a fingernail. In summary, the failure modes of both the flat sheet and canopy beams
(1) compared favorably, (2) indicated that increasing QUV weathering or service life
resulted in increased ductile deformation during testing, and (3) indicated reduced coating
adhesion with increasing QUV weathering or service life.
39

* 2. <7~ ] I-*A ~ I U1~ ~~~(I'~2 :(~1 t.~ *
4 I


SECTION 4
CONCLUSIONS AND RECOMMENDATIONS
4.1 Conclusions
As a result of this investigation, it was determined that the strip and recoat process
did not degrade the impact resistance of the coated polycarbonate material relative to the
baseline coated material. From the standpoint of impact resistance, the process restored
the polycarbonate to its original newly-fabricated, newly-coated state, regardless of
previous conditioning (laboratory storage or QUV weathering). Other conclusions are
noted below.
1. Changes in pretest conditioning caused noticeable changes in absorbed energy
and maximum displacement of the beam specimens, so that these quantitieZ. provided an
accurate characterization of the impact resistance of the conditioned polycarbonate. Peak
load and flexural modulus showed little-to-no correlation with changes in pretest
conditioning.
2. The impact resistance of the new coated polycarbonate flat sheet was
significantly less than that of new uncoated polycarbonate material (30% reduction in
absorbed energy and 50% reduction in maximum displacement).
3. Laboratory storage of up to 24 months did not change the impact resistance of
the coated polycarbonate.
4. QUV weathering increased the impact resistance of the coated polycarbonate up
to levels comparable to the uncoated (stripped) polycarbonate. Virtually all of the increase
was accomplished in the first equivalent year of weathering.
42

5. The falling weight energies were generally much less than the MTS energies
since the falling weight energies included only the energy required to produce a visible,
open crack, while the MTS energies also included the energy absorbed after initial
cracking. The falling weight and MTS energies were very similar after QUV weathering,
however, since such specimens experienced considerable deformation before-cracking (that
is, not much additional energy was absorbed after cracking).
6. The QUV weathering produced effects on F-16 coated polycarbonate that were
similar to the effects resulting from service life (increased impact energy and maximum
displacement, decreased coating adhesion and yield line depth, and increased ductility).
However, the cycle times and/or duration for one equivalent year of QUV weathering
appeared to be too severe.
4.2 Recommendations
As a result of this investigation, it is recommended that further tests be conducted
to better establish the relationship between QUV duration and service life duration for
F-16A coated monolithic polycarbonate. The current investigation shows that the QUV
weathering produced effects on impact resistance that were similar to the effects produced
by service aging, but that the definition for an equivalent year of QUV weathering was
too severe. The additional testing would redefine the QUV equivalent year so that it
better simulated the effects of a calendar year of F-16 canopy service life (based on
canopies 408 and 525).
MTS tests would be conducted on beams fabricated from F-16A canopies 166 and
320 (recoated with no subsequent service life) which had been subjected to QUV
weathering for various lengths of time. The MTS results as well as failure mode
observations would be correlated with the existing results for canopies 408 and 525, which
43

exp. r. nced 27 and 39 months of service life, respectively, after coating/recoating. The
hours of QUV weathering which produced results similar to 27 and/or 39 months of
service life would thus be established. From this relationship, the duration of QUV
weathering which produced impact resistance results similar to those for 1 year of service
life (that is, service life typical of that for canopies 408 and 525) could easily be
computed, thus defining a revised equivalent year for the QUV weathering apparatus.
Such a definition would only be appropriate for F-16A monolithic polycarbonate canopies
coated with C-254 which experience service lives similar to those for canopies 408 and
525. Further testing would be needed to establish the QUV equivalent year for other
coatings, canopy outer ply materials, and/or service histories.
44

REFERENCES
1. J.H. Storslee, Bird Impact Testing of Recoz.ed Monolithic Polycarbonate Canopiesfor the F-16 Aircraft. AEDC-TSR-84-V26, Arnold Engineering Development Center,Arnold Air Force Station, Tennessee, Septembe, 1984.
2. M. P. Bouchard, Failure Analysis of Birdstrike-Tested Pecoated Monolithic F-16AForward Canopies AFWAL-TR-0,7-3050, Air Force Wright AeronauticalLaboratories, Wright-Patterson Air Force Base, Ohio, August 1987.
3. R. S. Yamasaki and A. Blaga, "Degradation of Polycarbonate Sheeting on OutdoorExposure. Relationship Between Chaiges in Molecular Weight and TensileProperties," Materials and Structures, Vol. 10, No. 58, July-August 1977, pp.197-204.
4. . R. Martin, J. F. Johnson, and A. R. Cooper, "Mechanical Properties of Polymers:The Influence of Molecular Weight and Molecular Wlight Distribution," J.Macromol. Sci.-Revs. Macromol. Chem., kg(1), 1972, pp. 57-199.
5. D. R. Bowman and B. S. West, "The Cause and Effect of Structural Degradation ofIn-Service Aged F-Ill ADBIRT Windshield Transparencies," paper fromProceedings for 1988 Conference on Aerospace Transparent Materials andEnclosures, Air Force Wright Aeronautical Laboratories, Wright-Patterson Air ForceBase, Ohio, to be published.
o. A.STM F736-81, Standard Practice for Impact Resistance of MonolithicF'olycarbonate Sheet by Means of a Falling Weight, October 1981.
7. M. P. Bouchard, Effects of Surface Flaws on Impact Resistance of UncoatedPolycarbonate. AFWAL-TR-84-3016, Air Force Wright Aeronautical Laboratories.Wright-Patterson Air Force Base, Ohio, March 1984.
8. A. J. Piekutowski, "Simulation of Exp, 'ire of Aircraft Transparencies to Flight LineEnvironment," paper from AFWAL- -83-4154, Proceedings for Conference onAerospace Transparent Materials and Enclosures, Air Force Wright AeronauticalLaboratories, Wright-Patterson Air Force Base, Ohio, December 1983, pp. 620-634.
9. M. P. Bouchard, Evaluation of the Effects of Artificial and Natural EnvironmentalExposures on Laminated F-16 Transparency Material, AFWAL-TR-88-3016, AirForce Wright Aeronautical Laboratories, Wright-Patterson Air Force Base. Ohio,June 1988.
45

10. K. 1. Clayton, B. S. West, and D. R. Bowman, Airciaft Transpareir TestMeth odoluev, AFWAL-TR-85-3 125, Air Force Wrigh t Aeronautical Laboratories,Wright-Patterson Air Force Base, Ohio, March 1986.
It. K. 1. Clayton, J. F. Milholland, and G. J. Stenger, Experimental Evaluation of F-16Polycarbonate Canovvy Material AFWAL-TR-81-4020, Air Force WrightAeronautical Laboratories, Wright-Patterson Air Force Base, Ohio, April 198 1.
46

APPE IX A
MTS BEAM TEST RESULTS
Peak Displacement Flexural Absorbed Maximum
Load at Peak Load Modulus Energy Displacement
(Ib) (in) (ksi) (in-lb) (in)
A-I 3530 0.48 311 7632 3.73
A-2 3160 0.48 265 7344 3.70
A-3 3130 1.29* 301 7183 3.70
Avg. 3275 0.48 292 7386 3.71
St. Dev. 223 0. 24 227 0.02
B-I 3805 0.49 266 5134 1.90
B-2 3740 0.50 295 5181 1.93
B-3 3625 0.50 319 5160 1.99
Avg. 3723 0.50 293 5158 1.94
St. Dev. 91.2 0.01 27 24 0.06
C-1 3190* 0.33* 877* 1241* 1.19*
C-4 4410 0.57 366 5223 2.57
C-7 4340 0.56 401 6062 2.94
Avg. 4375 0.565 384 5643 2.74
St. Dev. 49 0.01 25 593 0.23
D-1 3830 0.52 304 5242 2.99
D-4 3795 0.52 300 4682 2.68
D-7 3690 0.53 347 4438 2.60
Avg. 3772 0.52 317 4787 2.76
St. Dev. 73 0.01 26 412 0.21
E-1 4305 0.43 358 5132 1.72
E-4 4540 0.53 355 4940 1.76
E-6 4300 0.51 354 4780 1.87
Avg. 4382 0.49 356 4951 1.78
St. Dev. 137 0.05 2.1 176 0.08
A-i

MTS BEAM TEST RESULTS (continued)
Peak Displacement Flexural Absorbed Maximum
Load at Peak Load Modulus Energy Displacement(lb) (in) (ksi) (in-lb) (in)
F-I 4310 0.50 331 3939 1.46
F-2 4075 0.47 318 3997 1.45
F-3 4120 0.49 309 4771 1.73
Avg. 4168 0.49 319 4236 1.55
St. Dev. 125 0.02 11 465 0.16
c-I 4620 0.56 393 7065 2.57
G-4 4340 0.56 402 7062 2.74
G-7 4090 0. 58 440 7093 3.34
Avg. 4350 0.57 412 7073 2.88
St. Dev. 265 0.01 25 17 0.40
H-4 3775 0.50 321 7344 3.74
H-7 4010 0.52 275 7173 3.92
H-9 3950 0.50 323 7520 4.00
Avg. 3912 0.51 306 7346 3.89
St. Dev. 122 0.01 27 174 0.13
1-2 4435 0.55 331 7863 3.94
1-5 4310 0.54 305 7363 3.72
1-7 4315 0.54 351 7340 3.41
Avg. 4353 0.54 329 7522 3.69
Std. Dev. 71 0.01 23 296 0.27
A-2

MTS BEAM TEST RESULTS (continued)
Peak Displacement Flexural Absorbed Maximum
Load at Peak Load Modulus Energy Displacement
lb) (in) (ksi) (in-lb) (in)
J-1 4450 0.56 366 6642 2.81
J-4 4460 0.55 325 4734 1.68
J-7 4520 0.57 346 5846 2.93
Avg. 4478 0.56 346 5741 2.47
St. Dev. 38 0.01 21 958 0.69
K-1 2080* 0.03* 375 862* 0.98*
K-4 3820 0.51 305 3678 2.09
K-7 3485 0.42 330 930* 0.46*
Avg. 3683 0.47 337 3678 2.09
St. Dev. 237 0.06 35 0 0.
L-1 3200* 0.33* 593* 1089* 0.98*
L-6 4480 0.56 365 4238 1.53
L-8 4520 0.52 338 4097 1.48
Avg. 4500 0.54 352 4168 1.51
St. Dev. 28 0.03 19 100 0.04
M-1 4495 0.55 338 3884 1.47
M-2 4455 0.53 304 4016 1.49
M-3 4510 0.56 338 4929 1.83
Avg. 4487 0.55 327 4276 1.60
St. Dev. 28 0.02 20 569 0.20
*Anomalous data not averaged.
A-3

APPENDIX B
FALLING WEIGHT TEST RESULTS
Drop
Height Weight Energy Failure
Specimen (ft) (lb) (ft-lb) Modea_
B-4 10.67 35.16 275 P
B-5 6.54 35.16 230 P
B-6 9.62 10.4 100 D
B-7 12.50 10.4 130 F
C-2 18.5 10.93 202 P
c-3 19.0 10.93 208 P
C-5 19.0 10.93 208 P
c-6 21.0 10.93 230 P
C-8 20.0 10.93 219 P
D-2 6.83 19.01 130 D
D-3 9.0 19.01 172 D
D-5 13.0 19.01 247 P
D-6 11.0 19.01 209 F
D-8 11.0 19.01 209 P
E-2 6.83 18.98 130 F
F-3 8.0 18.98 152 F
E-5 10.0 18.98 190 P
E-7 9.0 18.98 171 FP
E-8 5.0 18.98 95 D
E-9 6.0 18.98 114 D
B-1

FALLING WEIGHT TEST RESULTS (continued)
Drop
Height Weight Energy Failure
Specimen (ft). (b) (ft-lb) Modea
G-2 12.0 10.93 131 D
G-3 13.0 10.93 142 D
G-5 18.0 10.93 197 D
G-6 16.0 10.93 175 D
G-8 15.0 10.93 164 D
H-2 10.5 19.01 200 D
H-3 13.0 19.01 247 D
H-5 16.0 19.01 304 D
H-6 15.0 26.93 404 D
H-8 17.0 29.93 509 D
H-10 14.0 45.25 634 P
I-i 10.0 45.25 453 D
1-3 15.0 45.25 679 P
1-4 12.0 45.25 543 P
1-6 11.0 45.25 495 P
1-8 9.0 45.25 40' D
1-9 10.0 45.25 453 Pb
J-2 18.25 10.93 199 F
J-3 17.5 10.99 198 F
J-5 16.75 10.99 197 F
J-6 18.04 10.93 192 F
J-8 18.08 10.93 184 F
J-9 15.5 10.99 170 F
B-2

FALLING WEIGHT TEST RESULTS (continued)
Drop
Height Weight Energy Failure
Specimen (ft) (lb) (ft-lb) Mode a
K-2 11.0 19.01 209 P
K-3 9.0 19.01 172 F
K-5 8.0 19.01 152 F
K-6 7.0 19.01 133 D
K-8 10.0 19.01 190 P
L-2 8.0 19.01 152 F
L-3 7.0 19.01 133 D
L-4 10.0 19.01 190 P
L-5 6.0 19.01 114 D
L-7 7.5 19.01 143 F
a~ P Penetration (deep cracking-to-complete fracture)
F -Failure threshold (crack initiation)
D - Ductile (no cracking)
b Edge -initiated Failure
B- 3U.S. Govermsent Prtng Office 548-076


