110302 Water Asset Management Plan FINAL - IPART · AUCKLAND SYDNEY BRISBANE PERTH Coffs Harbour...
34
AUCKLAND SYDNEY BRISBANE PERTH Coffs Harbour City Council Asset Management Plan for Water Supply Assets March 2011 achieving results in the public sector
Transcript of 110302 Water Asset Management Plan FINAL - IPART · AUCKLAND SYDNEY BRISBANE PERTH Coffs Harbour...

AUCKLAND SYDNEY BRISBANE PERTH
Coffs Harbour City Council
Asset Management Plan for Water Supply Assets
March 2011
achieving results in the public sector

© Morrison Low Ref: 6777 AMP for Water Supply Assets for Coffs Harbour City Council March 2011
i
TABLE OF CONTENTS
1. INTRODUCTION ........................................................................................................... 3 1.1 Background ..................................................................................................... 3 1.2 Purpose of this asset management plan ......................................................... 4 1.3 Relationship with other planning documents ................................................... 5 1.4 Scope of this plan ............................................................................................ 5 1.5 Key stakeholders ............................................................................................. 5 1.6 Organisational structure .................................................................................. 6
2. LEVELS OF SERVICE ................................................................................................. 7 2.1 Customer research and expectations ............................................................. 7 2.2 Strategic goals and objectives ........................................................................ 7 2.3 Legislative requirements ................................................................................. 8 2.4 Current levels of service ................................................................................ 10 2.5 Desired levels of service ............................................................................... 11
3. FUTURE DEMAND ..................................................................................................... 12 3.1 Demand forecast ........................................................................................... 12 3.2 Changes in technology .................................................................................. 13 3.3 Demand management plan ........................................................................... 13 3.4 New assets from growth ................................................................................ 13
4. LIFECYCLE MANAGEMENT PLAN .......................................................................... 14 4.1 Background data ........................................................................................... 14 4.2 Asset maintenance ........................................................................................ 16 4.3 Renewals ...................................................................................................... 18 4.4 Acquisition procedures .................................................................................. 19 4.5 Risk management ......................................................................................... 19 4.6 Disposal plan ................................................................................................. 21
5. FINANCIAL SUMMARY ............................................................................................. 22 5.1 Depreciation .................................................................................................. 22 5.2 Cost forecasts ............................................................................................... 22 5.3 Funding strategy ........................................................................................... 26 5.4 Valuation forecasts ........................................................................................ 26
6. ASSET MANAGEMENT PRACTICES ....................................................................... 27 6.1 Financial systems .......................................................................................... 27 6.2 Asset data ..................................................................................................... 27 6.3 Asset management gap analysis .................................................................. 27 6.4 Asset data ..................................................................................................... 28
7. IMPROVEMENT PLAN ............................................................................................... 29 7.1 General areas for improvement .................................................................... 29 7.2 Performance measures ................................................................................. 29
© Morrison Low Ref: 6777 AMP for Water Supply Assets for Coffs Harbour City Council March 2011
ii
7.3 Monitoring and review procedures ................................................................ 33 8. REFERENCES ............................................................................................................ 33
TABLE OF FIGURES
Figure 4-1 Proportion of value by asset types ................................................................................ 14 Figure 4-2 Forecast pipe renewals ................................................................................................. 19 Figure 5-1 Proposed total operating, maintenance and capital costs ............................................ 23
TABLES Table 1-1 CHCC water supply assets ............................................................................................. 5 Table 1-2 Key stakeholders ............................................................................................................. 5 Table 1-3 Asset management responsibilities ................................................................................ 6 Table 2-1 Water supply strategies ................................................................................................... 8 Table 2-2 Legislative requirements ................................................................................................. 8 Table 2-3 Levels of service based on performance indicators ...................................................... 10 Table 3-1 Demand factors, projections and impact on services ................................................... 12 Table 4-1 Proportion of value by asset types ................................................................................ 14 Table 4-2 Trunk main and reticulation pipe material and age ....................................................... 15 Table 4-3 Operations and maintenance expenditure trends for water supply assets ................... 17 Table 4-4 Critical risks and treatment plans .................................................................................. 20 Table 5-1 Standard asset life for depreciation purposes .............................................................. 22 Table 5-2 Operational and maintenance expenditure forecasts ................................................... 24 Table 5-3 Renewals expenditure forecasts ................................................................................... 25 Table 5-4 Acquisition projects expenditure forecasts.................................................................... 25 Table 6-1 Findings from gap analysis assessment ....................................................................... 28 Table 7-1 General improvement plan ........................................................................................... 30 Table 7-2 Water supply asset improvement plan .......................................................................... 33 Morrison Low Consultant Pty Ltd PO Box 1146 Toowong Queensland 4066 Tel: 07 3870 0069 Fax: 07 3870 0056 www.morrisonlow.com Document Status
Approving Director: Date: © Morrison Low Except for all client data and factual information contained herein, this document is the copyright of Morrison Low Consultants Pty Ltd. All or any part of it may only be used, copied or reproduced for the purpose for which it was originally intended, except where the prior permission to do otherwise has been sought from and granted by Morrison Low Consultants Pty Ltd. Prospective users are invited to make enquiries of Morrison Low Consultants Pty Ltd concerning using all or part of this copyright document for purposes other than that for which it was intended.

© Morrison Low Ref: 6777 AMP for Water Supply Assets for Coffs Harbour City Council March 2011
3
1. INTRODUCTION
1.1 Background
Coffs Harbours City Councils water supply serves a permanent population of approximately 66,000 people, between Corindi in the north, Sawtell/Toormina in the south and Nana Glen to the west. Council’s drinking water supply to the majority of the area is currently supplied with raw water from the 5,600 megalitres (ML) Karangi Dam, which is sourced from Cochrane’s Pool on the Orara River and from Clarence Valley Council, via the Regional Water Supply (RWS) pipeline from the Nymboida River or water from the new 30,000 ML Shannon Creek Dam. Karangi Dam is situated approximately 15 kilometres west of Coffs Harbour and Shannon Creek Dam is about 9 kms west of Coutts Crossing.
The RWS pipeline and Shannon Creek Dam are owned, operated and maintained by Clarence Valley Council, but Coffs Harbour City Council pay an agreed proportion of the costs. Council also pays part of the costs for abstraction from the Nymboida river to Country Energy, who own the infrastructure as part of the Nymboida power station.
The raw water is treated to drinking water standard by the new Karangi Water Treatment Plant just east of the dam.
Two smaller supplies are situated at the villages of Coramba and Nana Glen. Nana Glen is supplied with raw water from the Orara River and then treated at the Nana Glen Water Treatment Plant. Coramba is supplied with raw water from the Regional Water Supply Pipeline or from the Orara River, which is then disinfected before distribution to consumers.
Coffs Harbour, Coramba and Nana Glen water supplies have 20 reservoirs in total. The combined capacity of all the reservoirs is 84 megalitres. The reservoirs range in size from 0.45 megalitres to 20 megalitres capacity.
Coffs Harbour, Coramba and Nana Glen water supplies have nine water pump stations. The major pump stations are Cochrane’s Pool Intake Pump Station and Karangi Water Treatment Plant Treated Water Pump Station.
At the Karangi Water Treatment Plant the drinking water has been fluoridated since the 11th June 2009. Coramba and Nana Glen, which are not on the Karangi Water Treatment Plant supply system, do not receive fluoridated water.
The Woolgoolga Dam situated 1.5km west of the town of Woolgoolga has remained out of active service since 1986 (except for a brief period during the drought in 1993) as a result of water quality issues. The dam remains on standby for emergency use in droughts or emergencies; however with the water supply security now ensured by the Regional Water Supply Scheme its future is now uncertain.
CHCC has acquired the water supply assets over an extended period by a number of different means. Some assets have been purchased or constructed by Council or its
© Morrison Low Ref: 6777 AMP for Water Supply Assets for Coffs Harbour City Council March 2011
4
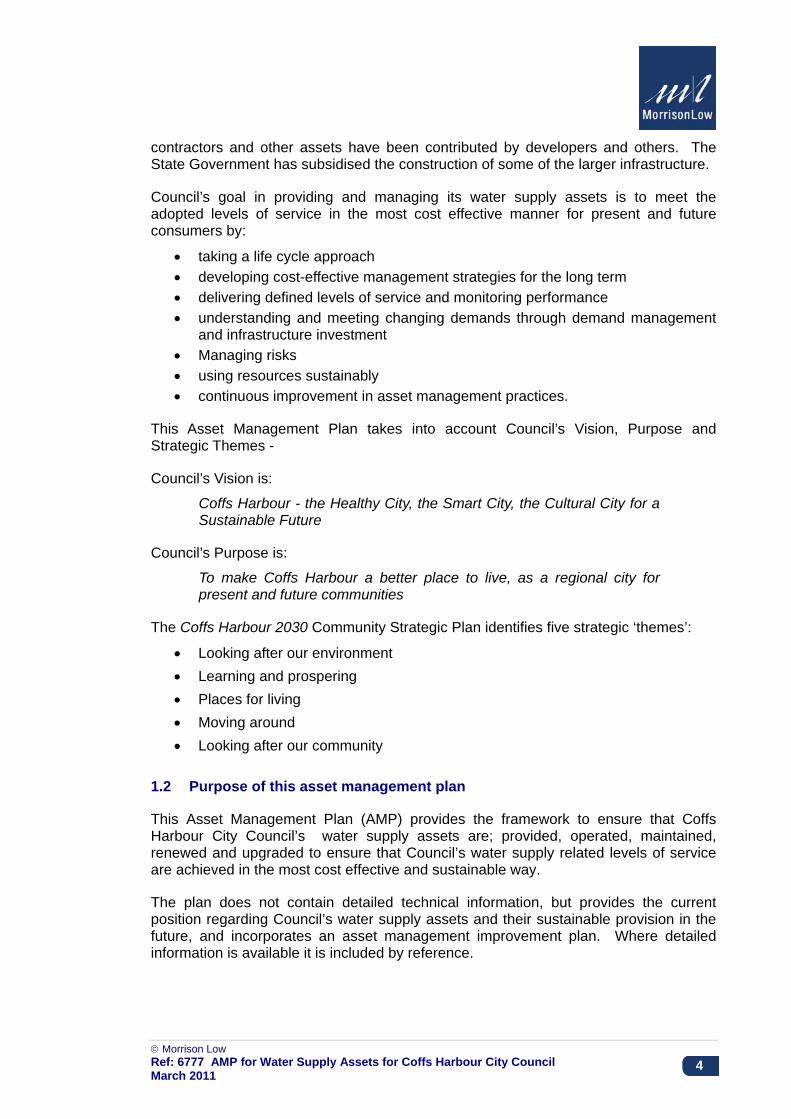
contractors and other assets have been contributed by developers and others. The State Government has subsidised the construction of some of the larger infrastructure.
Council’s goal in providing and managing its water supply assets is to meet the adopted levels of service in the most cost effective manner for present and future consumers by:
• taking a life cycle approach • developing cost-effective management strategies for the long term • delivering defined levels of service and monitoring performance • understanding and meeting changing demands through demand management
and infrastructure investment • Managing risks • using resources sustainably • continuous improvement in asset management practices.
This Asset Management Plan takes into account Council’s Vision, Purpose and Strategic Themes -
Council’s Vision is:
Coffs Harbour - the Healthy City, the Smart City, the Cultural City for a Sustainable Future
Council’s Purpose is:
To make Coffs Harbour a better place to live, as a regional city for present and future communities
The Coffs Harbour 2030 Community Strategic Plan identifies five strategic ‘themes’:
• Looking after our environment • Learning and prospering • Places for living • Moving around • Looking after our community
1.2 Purpose of this asset management plan
This Asset Management Plan (AMP) provides the framework to ensure that Coffs Harbour City Council’s water supply assets are; provided, operated, maintained, renewed and upgraded to ensure that Council’s water supply related levels of service are achieved in the most cost effective and sustainable way.
The plan does not contain detailed technical information, but provides the current position regarding Council’s water supply assets and their sustainable provision in the future, and incorporates an asset management improvement plan. Where detailed information is available it is included by reference.

© Morrison Low Ref: 6777 AMP for Water Supply Assets for Coffs Harbour City Council March 2011
5
1.3 Relationship with other planning documents
This AMP should to be read in conjunction with the following associated documents:
• Coffs Harbour 2030 Community Strategic Plan
• Coffs Harbour City Council’s Delivery Program 2010 - 2014
• Coffs Harbour City Council’s Operational Plan 2010 - 2011
• Coffs Harbour City Council’s Program Budgets 2010 - 2011
• Coffs Harbour City Council’s Asset Management Policy and Strategy
1.4 Scope of this plan
CHCC provides a range of water supply related assets representing a community investment of approximately $311 million (2010 estimated replacement value). Details of the assets covered by this AMP are provided in Table 1-1.
Table 1-1 CHCC water supply assets
Asset Category Quantity Estimated Replacement Value2010
Reservoirs and dams 22 $76,878,233.
Trunk mains 236km $84,268,270
Reticulation mains 633km $63,581,758
Pump stations 8 $2,507,487
Treatment plants 2 $83,615,237
Ancillary items $673,254
Total $311,524,239.
Note: trunk main and reticulation values include for chambers, valves and other fittings
1.5 Key stakeholders
Key stakeholders in relation to the water supply assets are detailed in Table 1-2.
Table 1-2 Key stakeholders
Stakeholder Comment
Council officers Council officers manage assets to deliver the Levels of Service agreed by Council following consultation with the community, and within agreed budgets. Council officers implement the AMP.

© Morrison Low Ref: 6777 AMP for Water Supply Assets for Coffs Harbour City Council March 2011
6
Stakeholder Comment
Council Council sets the Levels of Service taking the expectations of the community, legislative requirements and funding levels into account. They are primarily responsible to ensure that their decisions represent and reflect the needs of the wider community.
NSW Office of Water NSW Office of Water carry out the performance monitoring and benchmarking as required under National Competition Policy and the National Water Initiative. Performance monitoring is also a key requirement of the NSW Best-Practice Management of Water Supply and Sewerage Guidelines.
Community The community and visitors are users of infrastructure assets. Their expectations are communicated to Council via consultation.
Insurers Insurers have an interest in the implementation of asset management systems, which allow Council to properly manage the risks associated with the assets
NSW Health Ensure compliance with the ADWG.
1.6 Organisational structure
The responsibilities in relation to Asset management are shown in Table 1-3 below.
Table 1-3 Asset management responsibilities
Role Position in CHCC Responsibility
Asset owner To be confirmed Implementation of the strategic AMPs, O&M planning, concept designs and works specifications, works project management, asset performance monitoring and data collection.
Service delivery To be confirmed Implementing the O&M plans, repairs, renewals and new works construction, and designs.
Asset management coordination
Manager Asset Systems Asset management system, data management.
Strategic asset planning
To be confirmed Preparation of strategic AMPs, long term planning, development management.
© Morrison Low Ref: 6777 AMP for Water Supply Assets for Coffs Harbour City Council March 2011
7
2. LEVELS OF SERVICE
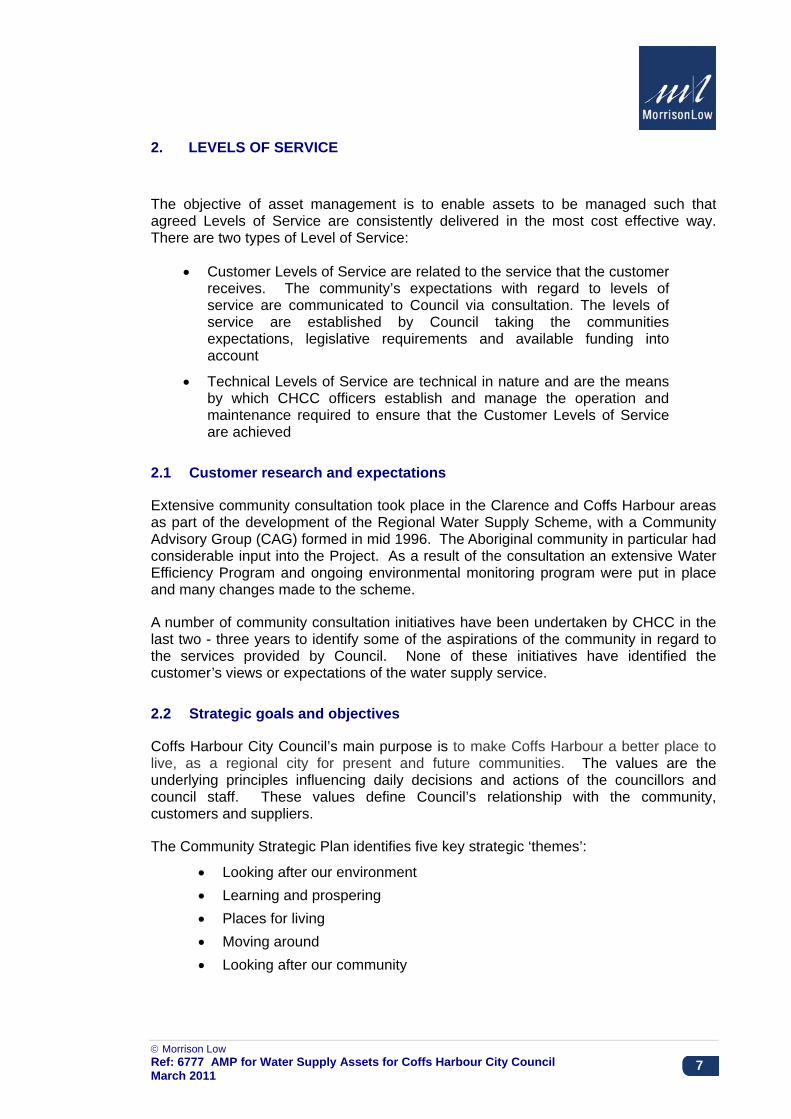
The objective of asset management is to enable assets to be managed such that agreed Levels of Service are consistently delivered in the most cost effective way. There are two types of Level of Service:
• Customer Levels of Service are related to the service that the customer receives. The community’s expectations with regard to levels of service are communicated to Council via consultation. The levels of service are established by Council taking the communities expectations, legislative requirements and available funding into account
• Technical Levels of Service are technical in nature and are the means by which CHCC officers establish and manage the operation and maintenance required to ensure that the Customer Levels of Service are achieved
2.1 Customer research and expectations
Extensive community consultation took place in the Clarence and Coffs Harbour areas as part of the development of the Regional Water Supply Scheme, with a Community Advisory Group (CAG) formed in mid 1996. The Aboriginal community in particular had considerable input into the Project. As a result of the consultation an extensive Water Efficiency Program and ongoing environmental monitoring program were put in place and many changes made to the scheme.
A number of community consultation initiatives have been undertaken by CHCC in the last two - three years to identify some of the aspirations of the community in regard to the services provided by Council. None of these initiatives have identified the customer’s views or expectations of the water supply service.
2.2 Strategic goals and objectives
Coffs Harbour City Council’s main purpose is to make Coffs Harbour a better place to live, as a regional city for present and future communities. The values are the underlying principles influencing daily decisions and actions of the councillors and council staff. These values define Council’s relationship with the community, customers and suppliers.
The Community Strategic Plan identifies five key strategic ‘themes’:
• Looking after our environment • Learning and prospering • Places for living • Moving around • Looking after our community

© Morrison Low Ref: 6777 AMP for Water Supply Assets for Coffs Harbour City Council March 2011
8
Each theme is linked to objectives and strategies. The strategies related to water supply assets are shown in Table 2-1 below.
Table 2-1 Water supply strategies
Objective Strategy
We are responsible in the use and management of our natural resources and work to reduce our ecological footprint
Implement total water cycle management practices
Our council organisation supports the delivery of high quality, sustainable outcomes for Coffs Harbour
Ensure Council’s administration structure facilitates the efficient and effective delivery of program
2.3 Legislative requirements
Council has to meet many legislative requirements including Commonwealth and State legislation and associated regulations as shown in Table 2-2.
Table 2-2 Legislative requirements
Legislation Requirement
Local Government Act 1993
Sets out role, purpose, responsibilities and powers of local governments. Draft Bill 2009 includes the preparation of a long term financial plan supported by asset management plans for sustainable service delivery. The purposes of this Act are as follows: a) to provide the legal framework for an effective, efficient,
environmentally responsible and open system of local government in New South Wales
b) to regulate the relationships between the people and bodies comprising the system of local government in New South Wales
c) to encourage and assist the effective participation of local communities in the affairs of local government
d) to give councils: − the ability to provide goods, services and facilities, and to
carry out activities, appropriate to the current and future needs of local communities and of the wider public
− the responsibility for administering some regulatory systems under this Act
− a role in the management, improvement and development of the resources of their areas.
e) to require councils, councillors and council employees to have regard to the principles of ecologically sustainable development in carrying out their responsibilities
Water Act 1912 This Act is being progressively phased out and replaced by the

© Morrison Low Ref: 6777 AMP for Water Supply Assets for Coffs Harbour City Council March 2011
9
Legislation Requirement Water Management Act 2000, but some provisions are still in force.
Environmental Planning and Assessment Act 1979
An Act to institute a system of environmental planning and assessment for the State of New South Wales. Among other requirements, the Act outlines the requirement for the preparation of Local Environmental Plans (LEP), Development Control Plans (DCP), Environmental Impact Assessments (EIA) and Environmental Impact Statements.
Occupational Health and Safety Act 2000 and Rehabilitation Act 1987
Sets out roles and responsibilities to secure the health, safety and welfare of persons at work and covering injury management, emphasising rehabilitation of workers particularly for return to work. Council is to provide a safe working environment and supply equipment to ensure safety.
Threatened Species Conservation Act 1995
An Act to conserve threatened species, populations and ecological communities of animals and plants.
Protection of the Environment Operations Act 1997
Council is required to exercise due diligence to avoid environmental impact and among others are required to develop operations emergency plans and due diligence plans to ensure that procedures are in place to prevent or minimise pollution.
Water Management Act 2000
Recognises the need to allocate and provide water for the environmental health of rivers and groundwater systems, while also providing licence holders with more secure access to water and greater opportunities to trade water in particular through the separation of water licences from land. The main tools the Act provides for managing the State's water resources are water sharing plans.
Water Management (General) Regulation 2004
Assists in implementing the Water Management Act 2000 and contains various procedural matters, specifies exemptions from the need to hold an access licence or an approval in certain circumstances and the changeover formulae applying to the new category of supplementary water access licences (formerly off–allocation water)
Disability Discrimination Act 1992
The Federal Disability Discrimination Act 1992 (D.D.A.) provides protection for everyone in Australia against discrimination based on disability. It encourages everyone to be involved in implementing the Act and to share in the overall benefits to the community and the economy that flow from participation by the widest range of people.
Native Vegetation Act 2003
This Act regulates the clearing of native vegetation on all land in NSW, except for excluded land listed in Schedule 1 of the Act. The Act outlines what landowners can and cannot do in clearing native vegetation.
Dams Safety Act 1978
This Act regulates the safe operation and maintenance of prescribed dams.

© Morrison Low Ref: 6777 AMP for Water Supply Assets for Coffs Harbour City Council March 2011
10
Legislation Requirement
Public Health Act 2010 The objects of this Act are: (a) to promote, protect and improve public health, (b) to control the risks to public health, (c) to promote the control of infectious diseases, (d) to prevent the spread of infectious diseases, (e) to recognise the role of local government in protecting public health.
Fluoridation of Public Water Supplies Act 1957
This Act regulates the fluoridation of public water supplies.
2.4 Current levels of service
Levels of service were established in the draft Water Supply Strategic Business Plan 2000/2001. Although some of these levels of service are still adhered to in many cases the performance against these is not currently monitored and they are therefore redundant. The water quality levels of service have been amended to comply with the Australian Drinking Water Guidelines 2004 and these are monitored. Response times are also monitored.
In order to meet the requirements of the National Competition Policy and the National Water Initiative, the NSW Office of Water requires CHCC to monitor and report on a number of performance indicators.
It should be noted that there are no target performance levels associated with the performance indicators – performance is assessed on a benchmark basis, although Council has a target of achieving Ranking 1 in all performance indicators, which equates to being in the top 20% of Council’s in NSW.
A number of the performance indicators are, asset management related, technical levels of service.
This AMP is based on Levels of Service taken from the performance indicators as shown in the table below. Revised specific levels of service need to be developed taking into account customer expectations and affordability.
Table 2-3 Levels of service based on performance indicators
Level of Service Performance achieved 2008/9
NSW Office of Water TBL 2008/9 Ranking
Number of connected residential properties
94% of total residential properties
n/a
Physical water quality compliance 100% 1
Chemical water quality compliance 100% 1

© Morrison Low Ref: 6777 AMP for Water Supply Assets for Coffs Harbour City Council March 2011
11
Level of Service Performance achieved 2008/9
NSW Office of Water TBL 2008/9 Ranking
Microbiological (E. coli) water quality compliance
100% 1
Number of complaints about water quality per 1000 properties
8 5
Number of complaints about water service per 1000 properties
40 5
Average frequency of unplanned interruptions per 1000 properties
24 3
Average duration of water supply interruptions
120 minutes 1
Number of water main breaks per 100 km of water main
11 4
Drought water restrictions 0% of time 1
Total days lost 3.3% of total 4
Average annual residential water supplied
165kL/property 3
Leakage 50L/service connection/day 2
Response to disruptions to water supply
2 hours n/a
Response to verbal enquiries 1 working day n/a
Response to written enquiries 10 working days n/a
Response to water services enquiries within 10 working days
90% n/a
Historically there have been no separately identified customer levels of service for water supply assets, apart from Council’s customer service policy which is generally focused on response times to customer enquiries and requests.
2.5 Desired levels of service
Initially, the desired Levels of Service and performance targets are the current performance levels as shown in the table above.
Future customer Levels of Service are to be determined at the next review of the strategic plan taking customer expectations into account. Future technical Levels of Service will be based on the customer Levels of Service.

© Morrison Low Ref: 6777 AMP for Water Supply Assets for Coffs Harbour City Council March 2011
12
3. FUTURE DEMAND
3.1 Demand forecast
Factors affecting demand include; population change, changes in demographics, seasonal factors, consumer preferences and expectations, economic factors, agricultural practices, environmental awareness, etc.
The 2009, Coffs Harbour City Population Profile, which is based on the 2006 Census undertaken by the Australian Bureau of Statistics, identifies a number of trends that will impact on service delivery as shown in Table 3-1. The average annual growth rate of Coffs Harbour over the next 10 years is forecast at 1.6%.
Table 3-1 Demand factors, projections and impact on services
Demand factor
Present position (2006) Projection (2031) Impact on services
Population Estimated Resident Population 64,910
Projected Population 98,710
Population growth will place an increased demand for the provision of Infrastructure assets
Demographics Median Age 41
% Population older than 45 is 45%
Median Age 51
% Population older than 45 is 58%
The trend towards an aging population will place a higher demand on some infrastructure assets
Increasing construction, operational, maintenance and renewal costs
The costs associated with asset construction, operations, maintenance and renewal is increasing at a greater rate than Council’s revenues
Costs increases are forecast to continue
The need to carefully plan infrastructure is increasing in importance. A focus on maximising the service that can be delivered within the funding limitations is required.
Environment and Climate Change
Current position is known
Future position is uncertain, but indications are that change, including periods of drought and increased frequency of major storm events is likely
Need to plan for both drought and storm conditions so that disruption to services is minimised
There is currently no formal procedure to take the above into account in determining demand forecasts for the water supply assets.
It should be noted that the regional water supply for supply of bulk raw water to the region was designed for a population of 94,253 in 2021 and a usage of 250 kL/year for

© Morrison Low Ref: 6777 AMP for Water Supply Assets for Coffs Harbour City Council March 2011
13
an occupied single dwelling. The present consumption is only 165 kL/property, so the system will easily cater for the 2031 population projections and beyond.
A recent study by NSW Office of Water; “Pilot Study to Assess the Impact of Climate Change on the Secure Yield of Town Water Supplies”, included the RWS as one of the pilot systems. This will go towards developing a Guideline for secure yields and will give the region assurance as to the security of the bulk supply during climate change. The population growth was taken into account in the design of the new Coffs Harbour Water Reclamation Plant and the Water Treatment Plant.
3.2 Changes in technology
The main areas where technology changes may affect the delivery of services are in the areas of condition monitoring, trenchless technology, SCADA technology and water treatment processes and construction.
Changes in demand may occur as a result of growth in population, changes in the local economy, customer education and climate change.
3.3 Demand management plan
The demand management plan covers the management of demand changes by:
• managing existing assets
• upgrading existing assets
• providing new assets to meet demands
• managing the demand, including consideration of non-asset solutions such as customer education.
3.4 New assets from growth
Growth forecasts indicate that new infrastructure assets will be required to meet future growth. CHCC will acquire these assets from private land development activities and from its own construction works.
Acquiring these new assets will commit Council to funding ongoing operation and maintenance costs for the assets, for the period that the service provided from the assets is required. These future costs are identified and considered in developing financial forecasts.
© Morrison Low Ref: 6777 AMP for Water Supply Assets for Coffs Harbour City Council March 2011
14
4. LIFECYCLE MANAGEMENT PLAN
The lifecycle management plan details how Council intends to manage and operate the assets at the agreed levels of service while optimising life cycle costs.
4.1 Background data
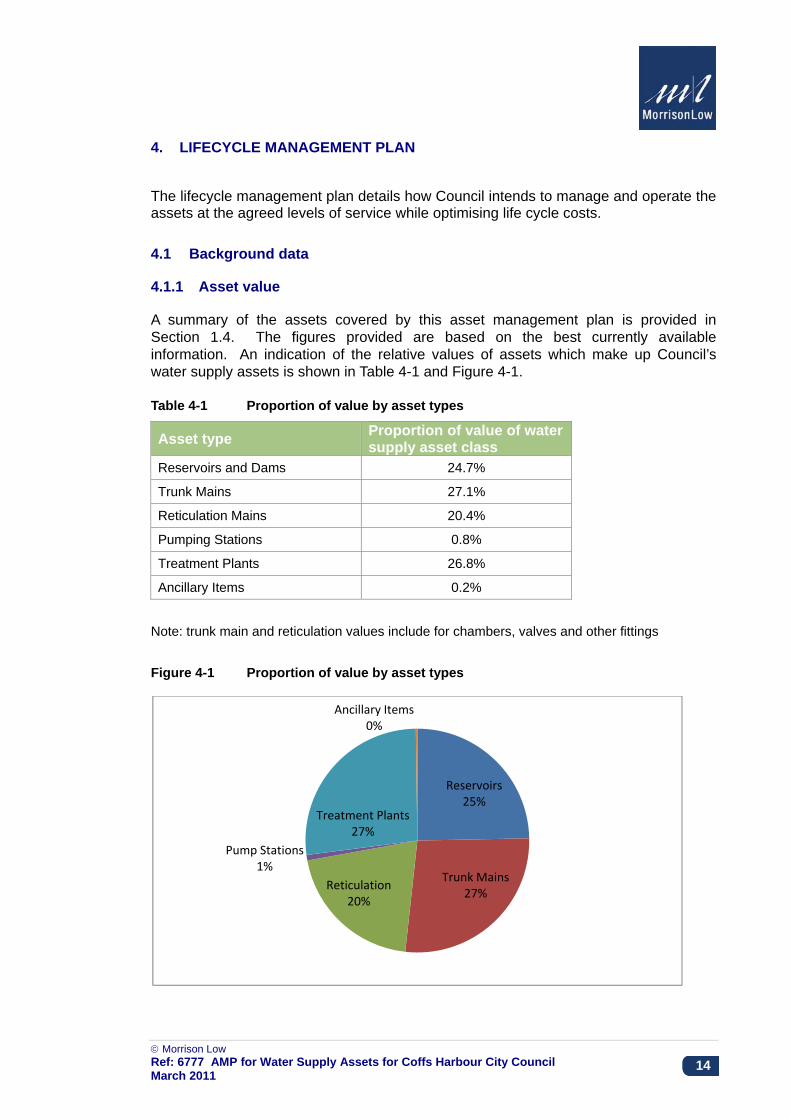
4.1.1 Asset value
A summary of the assets covered by this asset management plan is provided in Section 1.4. The figures provided are based on the best currently available information. An indication of the relative values of assets which make up Council’s water supply assets is shown in Table 4-1 and Figure 4-1.
Table 4-1 Proportion of value by asset types
Asset type Proportion of value of water supply asset class
Reservoirs and Dams 24.7%
Trunk Mains 27.1%
Reticulation Mains 20.4%
Pumping Stations 0.8%
Treatment Plants 26.8%
Ancillary Items 0.2%
Note: trunk main and reticulation values include for chambers, valves and other fittings
Figure 4-1 Proportion of value by asset types
Reservoirs25%
Trunk Mains27%
Reticulation20%
Pump Stations1%
Treatment Plants27%
Ancillary Items0%

© Morrison Low Ref: 6777 AMP for Water Supply Assets for Coffs Harbour City Council March 2011
15
4.1.2 Asset material and age
The age profile of Council’s water supply assets based on length of pipe in each material is shown in table 4.2. The profile has been developed based on current information.
Table 4-2 Trunk main and reticulation pipe material and age
Material more
than 50 years
40-49 years
30-39 years
20-29 years
9-19 years
less than 9 years
Total length m
uPVC 13,307 157,990 88,184 39,754 299,235 0.0% 0.0% 4.4% 52.8% 29.5% 13.3%
AC 5,297 19,036 85,040 70,984 515 336 175,911 3.0% 10.8% 48.3% 40.4% 0.3% 0.2%
CI 2,014 11,303 16,850 2,791 221 33,179 6.1% 34.1% 50.8% 8.4% 0.7% 0.0%
DI 10 1,229 24,147 48,710 14,705 88,801 0.0% 0.0% 1.4% 27.2% 54.9% 16.6%
HDPE 450 450 0.0% 0.0% 0.0% 0.0% 0.0% 100.0%
HOBAS 1,904 855 2,759 0.0% 0.0% 0.0% 69.0% 31.0% 0.0%
Mild Steel 55 14,052 543 101 14,751 0.0% 0.0% 0.4% 95.3% 3.7% 0.7%
STEEL 6,116 6,116 0.0% 0.0% 0.0% 100.0% 0.0% 0.0%
Unknown 6,309 3,181 2,323 11,813 0.0% 0.0% 53.4% 26.9% 19.7% 0.0%
Overall 7,311 30,349 122,790 281,165 141,351 55,346 633,015 1.2% 4.8% 19.4% 44.4% 22.3% 8.7%
The age profile indicates that 76.7% water supply pipeline assets are less than 30 years old. The system is therefore relatively young.
4.1.3 Asset condition
There is no direct data on the condition of trunk water mains and the reticulation system. The condition is informed by the frequency of pipe bursts in different parts of the system.
It is known that a portion of 96.7km of white uPVC main laid between 1977 and 1990 is in poor condition and is susceptible to bursts.

© Morrison Low Ref: 6777 AMP for Water Supply Assets for Coffs Harbour City Council March 2011
16
The condition of the treatment plant, reservoirs and pumping station are assessed informally by Council staff as being satisfactory.
4.2 Asset maintenance
4.2.1 Maintenance plans
The following maintenance plans are utilised by Council.
• Treatment plants
− Servicing of plant, equipment and instrumentation in accordance with equipment manufacturers requirements,
− Inspections of electrical switchboards
− Annual thermographic surveys of electrical switchboards
− Pest control maintenance
− Monthly test running of all generators
• Pumping stations
− Servicing of equipment and instrumentation in accordance with equipment manufacturers requirements
− Annual and weekly maintenance and inspection schedules
− Weekly inspection of dosing systems
− Inspections of electrical switchboards
− 2 yearly thermographic surveys of electrical switchboards
− Pest control maintenance
− Periodic inspection and mowing of rising main easements
− Periodic inspection of above ground rising mains
• Reticulation systems
− Maintenance of repeat burst register
− Chamber maintenance schedule
− Periodic inspection and mowing of trunk main easements
− Regular hydrant and stop valve maintenance
− Periodic inspections of cathodic protection
• Periodic inspections of reservoirs
• Meter exchange program
• Dam maintenance in accordance with O&M Manuals and Dam Safety Committee Requirements
All other maintenance is unplanned.
© Morrison Low Ref: 6777 AMP for Water Supply Assets for Coffs Harbour City Council March 2011
17
Risk based maintenance management plans, taking the above plans into account, are required for treatment plants, reservoirs, pumping stations, trunk mains and the reticulation system, taking into account likelihood and consequence for failures.
Clarence Valley Council owns and maintains the Regional Water Supply pipeline, including Shannon Creek Dam and pump stations, with Coffs Harbour City Council paying a proportion of the operation and maintenance cost. There is no existing maintenance management plan for regional water supply system, but one is in the process of being development by Clarence Valley Council.
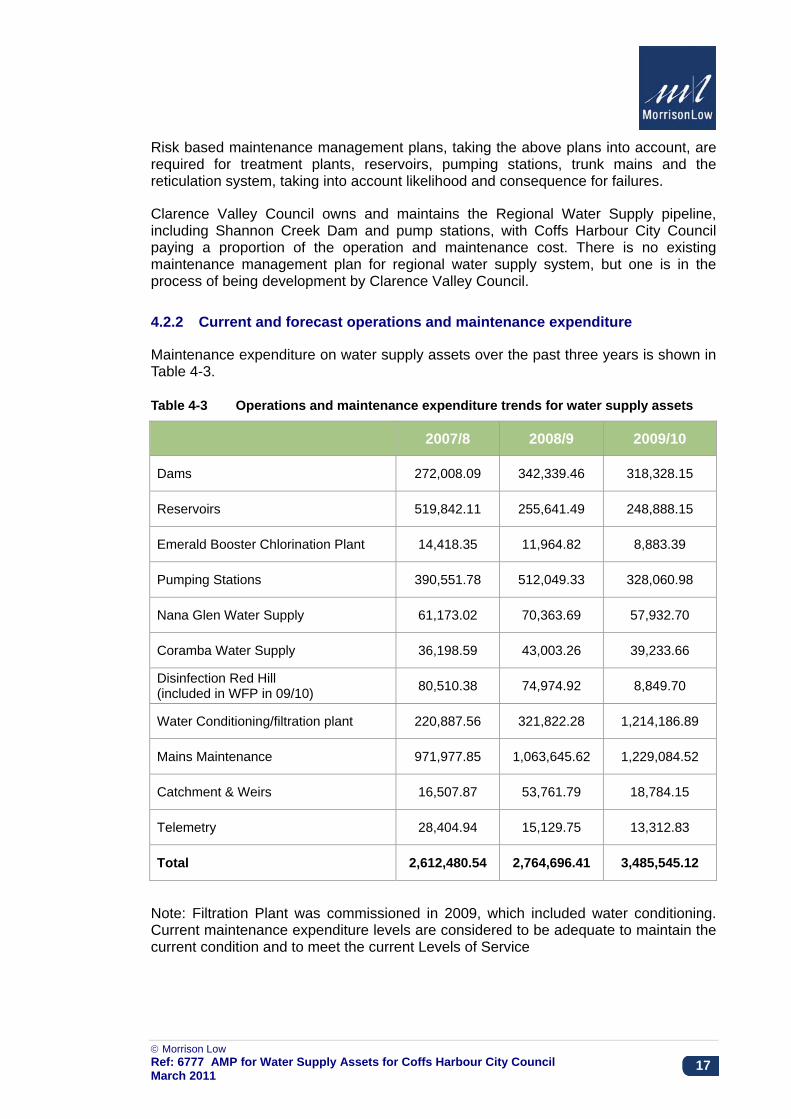
4.2.2 Current and forecast operations and maintenance expenditure
Maintenance expenditure on water supply assets over the past three years is shown in Table 4-3.
Table 4-3 Operations and maintenance expenditure trends for water supply assets
2007/8 2008/9 2009/10
Dams 272,008.09 342,339.46 318,328.15
Reservoirs 519,842.11 255,641.49 248,888.15
Emerald Booster Chlorination Plant 14,418.35 11,964.82 8,883.39
Pumping Stations 390,551.78 512,049.33 328,060.98
Nana Glen Water Supply 61,173.02 70,363.69 57,932.70
Coramba Water Supply 36,198.59 43,003.26 39,233.66
Disinfection Red Hill (included in WFP in 09/10) 80,510.38 74,974.92 8,849.70
Water Conditioning/filtration plant 220,887.56 321,822.28 1,214,186.89
Mains Maintenance 971,977.85 1,063,645.62 1,229,084.52
Catchment & Weirs 16,507.87 53,761.79 18,784.15
Telemetry 28,404.94 15,129.75 13,312.83
Total 2,612,480.54 2,764,696.41 3,485,545.12
Note: Filtration Plant was commissioned in 2009, which included water conditioning. Current maintenance expenditure levels are considered to be adequate to maintain the current condition and to meet the current Levels of Service

© Morrison Low Ref: 6777 AMP for Water Supply Assets for Coffs Harbour City Council March 2011
18
There is likely to be changes in demand for the services provided by water supply assets into the future. Additional assets to meet these demands will be acquired through development activities and by council funded works.
Over recent years, the length of Council’s water supply reticulation system has been growing at a rate of about 1.5%, although this varies among the various asset types. It is anticipated that the trend will continue.
It has been assumed that the annual growth in population served is 1.6% in accordance with the 2009, Coffs Harbour City Population Profile forecast.
The forecast of operations and maintenance expenditure is shown in table 5-2.
4.3 Renewals
In the absence of condition assessments for water supply assets, renewals forecasts for trunk mains and the reticulation system have been based on the following:
a) White uPVC pipelines will be replaced on the basis of 7% of replacement value per year.
b) Other pipeline assets that are currently assessed as having no remaining useful life, or that will have no remaining life within the next ten years, will be renewed within the ten year period.
c) Forecast cash flow for pipeline renewals is equalised over the ten year period. The renewal of the telemetry system takes place in 2014/15 at the end of its life (The telemetry system will be continually renewed).
d) Unit rates for renewals work are based on the NSW Reference Rates Manual for Valuation of Water Supply, Sewerage and Stormwater Assets.
In the absence of further information, renewal of pumping station equipment has been forecast on the basis of replacement at the end of their asset lives. It has been assumed that the renewal of the mechanical and electrical equipment will be undertaken over a five year period commencing in 2016/17 (end of asset life occurs in 2018).
The renewals forecast will be refined on the basis of improved information about asset condition and a risk assessment taking into account pipeline burst frequencies, asset condition, water quality and consequences of failure.
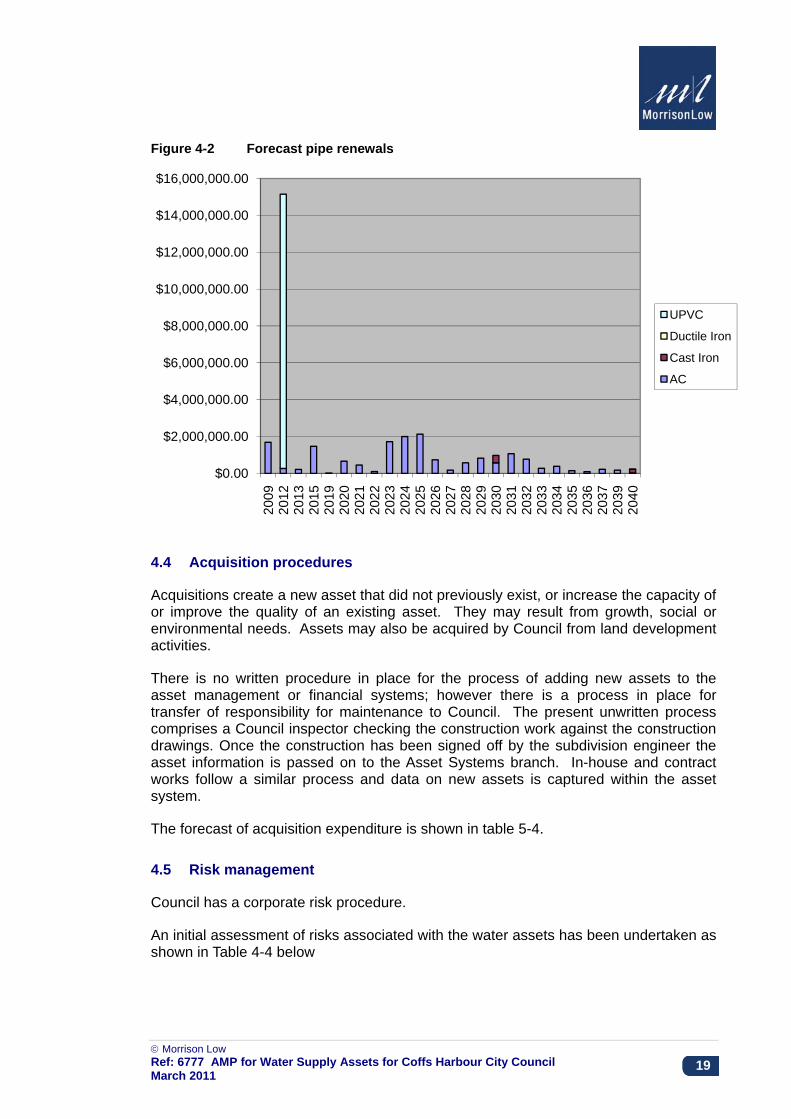
The forecast of renewals expenditure over the next 10 years is shown in table 5-3.
Figure 4-2 below shows the forecast pipe renewals based on pipe age. Apart from the replacement of the white uPVC pipe, which is shown to occur in a single year, the level of pipe renewals is at an average $850,000 per year until 2060.
© Morrison Low Ref: 6777 AMP for Water Supply Assets for Coffs Harbour City Council March 2011
19
Figure 4-2 Forecast pipe renewals
4.4 Acquisition procedures
Acquisitions create a new asset that did not previously exist, or increase the capacity of or improve the quality of an existing asset. They may result from growth, social or environmental needs. Assets may also be acquired by Council from land development activities.
There is no written procedure in place for the process of adding new assets to the asset management or financial systems; however there is a process in place for transfer of responsibility for maintenance to Council. The present unwritten process comprises a Council inspector checking the construction work against the construction drawings. Once the construction has been signed off by the subdivision engineer the asset information is passed on to the Asset Systems branch. In-house and contract works follow a similar process and data on new assets is captured within the asset system.
The forecast of acquisition expenditure is shown in table 5-4.
4.5 Risk management
Council has a corporate risk procedure.
An initial assessment of risks associated with the water assets has been undertaken as shown in Table 4-4 below
$0.00
$2,000,000.00
$4,000,000.00
$6,000,000.00
$8,000,000.00
$10,000,000.00
$12,000,000.00
$14,000,000.00
$16,000,000.00
2009
2012
2013
2015
2019
2020
2021
2022
2023
2024
2025
2026
2027
2028
2029
2030
2031
2032
2033
2034
2035
2036
2037
2039
2040
UPVC
Ductile Iron
Cast Iron
AC

© Morrison Low Ref: 6777 AMP for Water Supply Assets for Coffs Harbour City Council March 2011
20
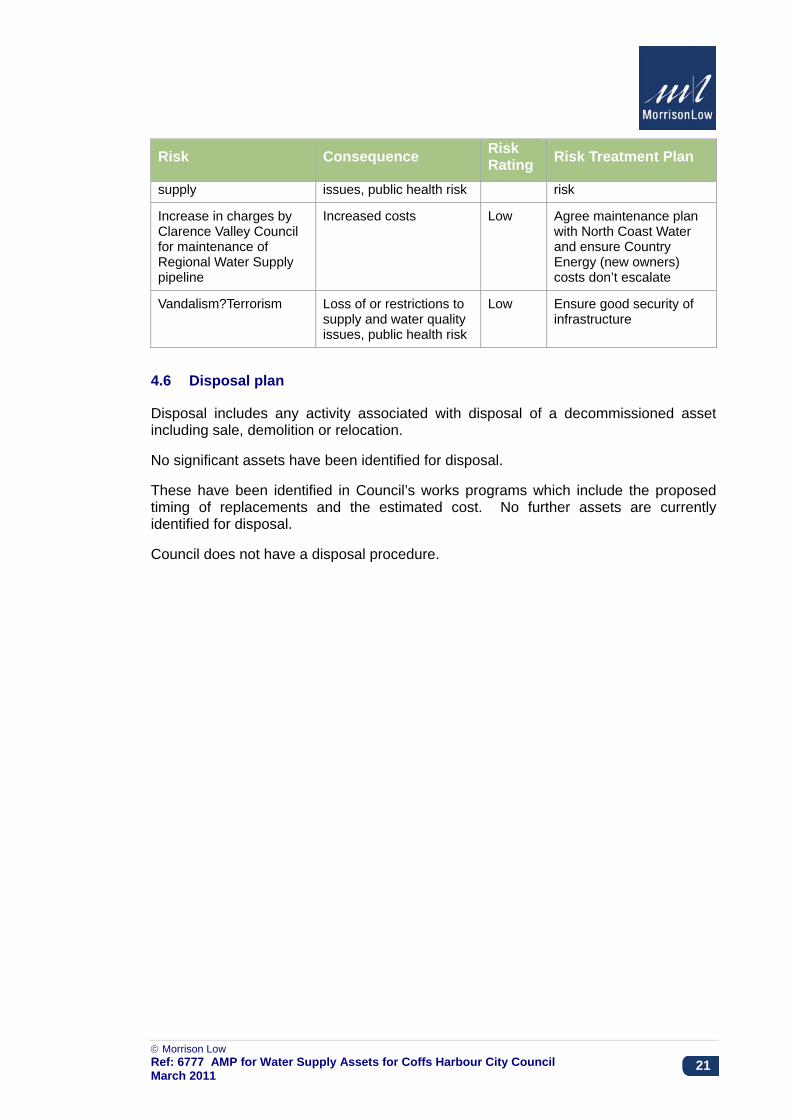
Table 4-4 Critical risks and treatment plans
Risk Consequence Risk Rating Risk Treatment Plan
Overall condition of assets decreases due to inadequate renewal and maintenance programs
Levels of Service not achieved
High Improve data, determine priorities based on lifecycle costs, service and risk criteria
Changes in legislation affect the responsibilities of Council
Changes in costs and resource requirements
Low Monitor legislative changes
Resource constraints affect the management of the assets
Levels of Service not achieved, condition of assets deteriorates
High Establish clear management plans, with forecast costs, to maintain Levels of Service and debate with Council
Unforeseen increases in fuel, plant and materials costs
Increased costs of carrying out repairs and renewals
Medium Monitor costs
Increases in power costs Increased operational costs
High Monitor costs and optimise use
Increase in chemical costs
Increased operational costs
High Monitor costs and optimise use
Failure of materials supplies
Delays to repairs and renewals and increased materials costs
Medium Ensure alternative supply arrangements are in place for critical materials
Flooding/storms Loss of short term functionality of asset, damage to asset causing loss of supply and/or cost increases
High Implement flood management program
OH&S incident whilst working on assets causes fatality or serious harm injury
Prosecution risk Low Ensure Council has OH&S procedures and staff are trained in them. Ensure all contractors have OH&S policy and procedures and they are complied with
Drought Loss of or restrictions to supply
Medium Improved security of supply and customer education
Power failure Loss of or restrictions to supply
Medium Ensuring stand by power generation is available to maintain treatment and supply
Contamination of water Loss of or restrictions to supply and water quality
Low Monitoring of water quality to reduce public health
© Morrison Low Ref: 6777 AMP for Water Supply Assets for Coffs Harbour City Council March 2011
21
Risk Consequence Risk Rating Risk Treatment Plan
supply issues, public health risk risk
Increase in charges by Clarence Valley Council for maintenance of Regional Water Supply pipeline
Increased costs Low Agree maintenance plan with North Coast Water and ensure Country Energy (new owners) costs don’t escalate
Vandalism?Terrorism Loss of or restrictions to supply and water quality issues, public health risk
Low Ensure good security of infrastructure
4.6 Disposal plan
Disposal includes any activity associated with disposal of a decommissioned asset including sale, demolition or relocation.
No significant assets have been identified for disposal.
These have been identified in Council’s works programs which include the proposed timing of replacements and the estimated cost. No further assets are currently identified for disposal.
Council does not have a disposal procedure.

© Morrison Low Ref: 6777 AMP for Water Supply Assets for Coffs Harbour City Council March 2011
22
5. FINANCIAL SUMMARY
This section contains the financial forecasts resulting from the information presented in previous sections of this asset management plan and based on the information available.
Inflation is based on the forecasts given in the Access Economics Business Outlook, September 2010 as follows:
2010/11 2.9%
2011/12 3.0%
2012/13 2.9%
2013/14 2.5%
2014/15 2.4%
And 2.4% per year thereafter
5.1 Depreciation
Depreciation of assets is undertaken on a straight line basis. Standard asset lives are shown in the Table 5-1.
Table 5-1 Standard asset life for depreciation purposes
Asset Class Asset material Standard asset life (years)
Pipelines Asbestos Cement 50 uPVC 70 Cast Iron 80 Ductile Iron 80 HDPE 100 HOBAS 80 Steel/mild steel 80 Unknown 50
Reservoirs R.C./steel 100 M&E plant and equipment 25 Telemetry 15 Other structures 50
5.2 Cost forecasts
The forecasts for operational and maintenance costs, renewals and acquisitions are shown in the tables below.
Operational and maintenance costs include all labour, plant, materials and consumables required to operate and maintain the assets.

© Morrison Low Ref: 6777 AMP for Water Supply Assets for Coffs Harbour City Council March 2011
23
The acquisition forecast is in accordance with Council’s current long term financial plan.
Regional Water Supply maintenance costs are based on the 2008/9 expenditure of $170,10 as stated in the 2008/9 Budget report.
The total expenditure forecast for the water supply assets is shown in Figure 5.1.
Figure 5-1 Proposed total operating, maintenance and capital costs
$0
$5,000,000
$10,000,000
$15,000,000
$20,000,000
$25,000,000
$30,000,000
$35,000,000

© Morrison Low Ref: 6777 AMP for Water Supply Assets for Coffs Harbour City Council March 2011
24
Table 5-2 Operational and maintenance expenditure forecasts
$,000
2010/11
2011/12 2012/13 2013/14 2014/15 2015/16 2016/17 2017/18 2018/19 2019/20
Dams 340 350 361 371 380 389 398 408 418 428 Reservoirs 266 274 282 291 298 305 312 320 328 336 Pumping Stations 360 429 471 518 530 543 556 570 583 597 Emerald Booster Chlorination Plant 20 21 21 22 23 23 24 24 25 25 Nana Glen Water Supply 73 78 81 84 86 88 90 92 95 97 Coramba Water Supply 45 24 15 16 16 17 17 18 18 18 Water Conditioning/filtration plant 1,080 1,158 1,246 1,382 1,415 1,449 1,484 1,520 1,556 1,593 Mains Maintenance 1,130 1,175 1,222 1,271 1,302 1,333 1,365 1,397 1,431 1,465 Catchment and Weirs 56 58 59 61 62 64 65 67 69 70 Telemetry 20 21 21 22 23 23 24 24 25 25 Total 3,390 3,588 3,779 4,038 4,135 4,234 4,336 4,440 4,546 4,655
• The pump station at Karangi Dam is no longer used to pump to the top of Red Hill. The pump station at Karangi WTP does
this now. This expenditure may have double counted. • The cost of servicing Coramba will be reduced when Coramba Water Supply is connected to Karangi WTP and WTP costs
increased!

© Morrison Low Ref: 6777 AMP for Water Supply Assets for Coffs Harbour City Council March 2011
25
Table 5-3 Renewals expenditure forecasts
$,000
2010/11
2011/12 2012/13 2013/14 2014/15 2015/16 2016/17 2017/18 2018/19 2019/20
AC and other types of pipe renewal
494 509 521 534 547 560 573 587 601 494
White uPVC pipe renewal 1,073 1,099 1,125 1,152 1,178 1,205 1,235 1,270 1,300 1,350
Mechanical and Electrical equipment renewal
0 0 0 0 0 2,333 2,389 2,446 2,505 0
Telemetry renewal 0 0 0 556 0 Total 2,072 2,132 1,521 2,114 1,595 3,966 4,061 4,159 4,258 2,072
Table 5-4 Acquisition projects expenditure forecasts
$,000
2010/11
2011/12 2012/13 2013/14 2014/15 2015/16 2016/17 2017/18 2018/19 2019/20 total
Shepherds Lane Res 200 1,500 0 0 0 0 0 0 0 0 1,700
Reticulation mains (s64 strategy)
600 603 651 500 3.810 520 510 559 635 0 8387
Unwins reservoir 0 0 0 0 2,000 0 0 0 0 0 2,000
West Woolgoolga 60kW. P/ Station
0 0 0 0 500 0 0 0 0 0 500
West Woolgoolga Reservoir demolition
0 0 0 0 100 0 0 0 0 0 100

© Morrison Low Ref: 6777 AMP for Water Supply Assets for Coffs Harbour City Council March 2011
26
$,000
2010/11
2011/12 2012/13 2013/14 2014/15 2015/16 2016/17 2017/18 2018/19 2019/20 total
Duplicate trunk main Karangi - Red Hill B/T*
0 0 0 0 0 0 0 2.080 0 0 2,080
Mains extensions 50 50 50 50 50 50 50 50 50 50 500
Service connections 289 298 300 300 300 300 300 300 300 300 2,987
Telemetry 50 50 20 20 20 20 20 20 20 20 260
Minor works 20 20 20 20 20 20 20 20 20 20 200
Coramba water main 750 0 0 0 0 0 0 0 0 0 750
Moonee to Emerald Trunk Main
0 0 2, 372 0 0 0 0 0 0 0 2,372
Total 1,959 2,521 3,413 890 6,800 910 900 3,029 1,025 390 21836
• *may be brought forward to 2012/13
5.3 Funding strategy
The funding strategy is detailed in Council’s 10 year long term financial plan.
5.4 Valuation forecasts
Asset values are forecast to increase as additional assets are added to the asset stock from construction and acquisition by Council and from assets constructed by land developers and others and donated to Council. The projected replacement cost asset values over the planning period is predicted to grow by 3% annually.

© Morrison Low Ref: 6777 AMP for Water Supply Assets for Coffs Harbour City Council March 2011
27
6. ASSET MANAGEMENT PRACTICES
6.1 Financial systems
Coffs Harbour City Council uses Finance One software for the management of its financial information. This system is managed by Council’s finance department.
Financial reporting must comply with the following Australian Accounting Standards:
• AASB 5 Non-current Assets Held for Sale and Discontinued Operations
• AASB 116 Property, Plant and Equipment
• AASB 136 Impairment of Assets
• AASB 138 Intangible Assets
• AASB 140 Investment Properties
• AASB 1051 Land Under Roads
The guidelines provided by the Department of Local Government are also complied with.
Items of infrastructure, property, plant and equipment are not capitalised unless their cost of acquisition exceeds $2,000.
6.2 Asset data
Council is in the process of implementing AssetMaster as its corporate asset management system. At present asset data for infrastructure asset is held in a number of systems including Council’s GIS, access data bases and excel spreadsheets.
It is anticipated that AssetMaster will be fully implemented prior to the end of the 2010/11 financial year and will include integration between the asset system and Council’s financial system.
6.3 Asset management gap analysis
An asset management gap analysis covering all asset classes was undertaken in August 2010. The results of the gap analysis for water are shown in the table below. The desired score for each component is 6. The findings of the gap analysis form the basis of the improvement plan.

© Morrison Low Ref: 6777 AMP for Water Supply Assets for Coffs Harbour City Council March 2011
28
Table 6-1 Findings from gap analysis assessment
6.4 Asset data
Reservoir condition data exists on an external web site, provided by Council’s reservoir maintenance contractor and accessible by Council. There is limited condition data on other water assets. Attributes and spatial data exists for all water assets and is currently stored in the AMS database, GIS database and various other systems.
Water & Sewerage Assets Current Score
Desired score 3yrs
Priority (1-3) 1 2 3 4 5 6 7 8 9 10
Asset Knowledge / Data 5.0 6.0 5.0 5.0 5.0 5.0 5.0 ### ### ### ### ###Asset Classification / hierarchy 4 6 4.0 4.0 4.0 4.0 ### ### ### ### ### ###Physical attributes and location 6 6 6.0 6.0 6.0 6.0 6.0 6.0 ### ### ### ###Operational / Maintenance data 6 6 6.0 6.0 6.0 6.0 6.0 6.0 ### ### ### ###Condition data 5 6 5.0 5.0 5.0 5.0 5.0 ### ### ### ### ###Performance utilisation data 6 6 6.0 6.0 6.0 6.0 6.0 6.0 ### ### ### ###GIS / spatial data 4 6 4.0 4.0 4.0 4.0 ### ### ### ### ### ###Lifecycle cost data 4 6 4.0 4.0 4.0 4.0 ### ### ### ### ### ###Valuation, depreciation and effective life data 5 6 5.0 5.0 5.0 5.0 5.0 ### ### ### ### ###
Data processes / techniques 2.1 6.0 2.1 2.1 ### ### ### ### ### ### ### ### Asset identification / clarification processes 2 6 2.0 2.0 ### ### ### ### ### ### ### ### Data capture strategies and processes 2 6 2.0 2.0 ### ### ### ### ### ### ### ### Condition assessment processes / rating systems 2 6 2.0 2.0 ### ### ### ### ### ### ### ### Performance utilisation processes 2 6 2.0 2.0 ### ### ### ### ### ### ### ### Asset GIS mapping systems 2 6 2.0 2.0 ### ### ### ### ### ### ### ### Asset handover procedures 3 6 3.0 3.0 3.0 ### ### ### ### ### ### ### Data management processes 2 6 2.0 2.0 ### ### ### ### ### ### ### ###
Strategic Asset Planning Processes 2.9 6.0 2.9 2.9 ### ### ### ### ### ### ### ### Levels of service 3 6 3.0 3.0 3.0 ### ### ### ### ### ### ### Demand forecasting 4 6 4.0 4.0 4.0 4.0 ### ### ### ### ### ### Risk management 3 6 3.0 3.0 3.0 ### ### ### ### ### ### ### Optimised decision making / predictive modelling 2 6 2.0 2.0 ### ### ### ### ### ### ### ### Lifecycle planning and funding projections 3 6 3.0 3.0 3.0 ### ### ### ### ### ### ###Financial planning and capital investment 3 6 3.0 3.0 3.0 ### ### ### ### ### ### ### Asset capital processes 3 6 3.0 3.0 3.0 ### ### ### ### ### ### ### Asset management plans 2 6 2.0 2.0 ### ### ### ### ### ### ### ###
Operations Maintenance and Work Processes 3.7 6.0 3.7 3.7 3.7 ### ### ### ### ### ### ### Maintenance strategies 2 6 2.0 2.0 ### ### ### ### ### ### ### ### Emergency response plans 3 6 3.0 3.0 3.0 ### ### ### ### ### ### ### Contract administration 4 6 4.0 4.0 4.0 4.0 ### ### ### ### ### ### Maintenance management 5 6 5.0 5.0 5.0 5.0 5.0 ### ### ### ### ### Design / construction strategies 6 6 6.0 6.0 6.0 6.0 6.0 6.0 ### ### ### ### Critical assets 2 6 2.0 2.0 ### ### ### ### ### ### ### ###
Information Systems 3.8 6.0 3.8 3.8 3.8 ### ### ### ### ### ### ### Asset register 3 6 3.0 3.0 3.0 ### ### ### ### ### ### ### Asset costing systems 3 6 3.0 3.0 3.0 ### ### ### ### ### ### ### Plans & records 4 6 4.0 4.0 4.0 4.0 ### ### ### ### ### ### Works / maintenance management 5 6 5.0 5.0 5.0 5.0 5.0 ### ### ### ### ### GIS 4 6 4.0 4.0 4.0 4.0 ### ### ### ### ### ### Asset management system / modules 3 6 3.0 3.0 3.0 ### ### ### ### ### ### ### Systems integration 4 6 4.0 4.0 4.0 4.0 ### ### ### ### ### ### Availability / user friendly 4 6 4.0 4.0 4.0 4.0 ### ### ### ### ### ###
Organisational / Commercial Context 2.3 6.0 2.3 2.3 ### ### ### ### ### ### ### ### Organisational strategy 2 6 2.0 2.0 ### ### ### ### ### ### ### ### Asset management review / improvement 2 6 2.0 2.0 ### ### ### ### ### ### ### ### Commercial tactics 4 6 4.0 4.0 4.0 4.0 ### ### ### ### ### ### Corporate sponsorship / commitment 2 6 2.0 2.0 ### ### ### ### ### ### ### ### AM roles and responsibilities 2 6 2.0 2.0 ### ### ### ### ### ### ### ### Training and awareness 2 6 2.0 2.0 ### ### ### ### ### ### ### ###

© Morrison Low Ref: 6777 AMP for Water Supply Assets for Coffs Harbour City Council March 2011
29
7. IMPROVEMENT PLAN
7.1 General areas for improvement
The gap analysis identified areas for improvement across all asset classes. These are termed general areas for improvement, and are listed in table 7-1. The highest priority tasks are:
1. Finalising and implementing the Improvement Plan
2. Establishing Levels of Service that are linked to the community plan to enable activities and expenditure to be established in accordance with the wishes of the community
3. Clearly identifying responsibilities and roles within the organisation in relation to asset management
4. Confirming corporate sponsorship of and commitment to asset management across the organisation
5. Preparation of written procedures for data and information collection
The improvement plan with tasks specifically related to water supply assets is shown in Table 7-2.
Note that, unless otherwise stated, responsibilities and resource requirements are to be confirmed.
7.2 Performance measures
The effectiveness of this asset management plan can be measured:
• by monitoring actual expenditure for capital and operational and maintenance against forecast expenditure
• by monitoring compliance with Level of Service performance targets
• by monitoring performance in relation to the improvement plans included in the asset management plan.
• by monitoring the performance indicators in the NSW Office of Water Performance Monitoring Report and the National Performance Report for urban water utilities..
.

© Morrison Low Ref: 6777 AMP for Water Supply Assets for Coffs Harbour City Council March 2011
30
Table 7-1 General improvement plan
Task No. Task Priority Responsible
Officer Resources Required
1
Develop Customer and Technical Levels of Service in conjunction with consultation on the next Strategic Business Plan
1
2 Clearly define Asset Management responsibilities for the organisation and communicate across organisation
1
3
Prepare first cut AMPs for each asset class/group based on current data and Initial Technical Levels of Service. AMPs to include asset specific improvement plans
1
4 Regular confirmation of corporate support communicated all staff 1
5
Review current condition assessment processes and consolidate into condition assessment procedures for water, wastewater and general fund assets (see asset specific improvement plans) that covers all asset classes
2 Manager Asset Systems
6
Review current data management processes and consolidate into single data management procedure that covers all asset classes
2 Manager Asset Systems
7
Establish criteria for critical assets. Then critical assets identified and recorded and included in risk management plan and emergency response plan
2
8 Review current data capture processes and consolidate into single data capture process across all asset classes
2 Manager Asset Systems
9 Develop asset hierarchy with intelligent IDs 2 Manager
Asset Systems
10
Develop risk assessment procedure and then undertake risk assessments for all asset classes. Needs to be linked to the corporate risk procedure
2
11 Update emergency response Plan, taking into account critical assets. 2
12 Establish and implement training program across the organisation 2
13 Develop written processes for demand forecasting, taking into account the 2030 Community Plan
2
14 Prepare procedure for asset management audit and review 2 Manager
Asset Systems

© Morrison Low Ref: 6777 AMP for Water Supply Assets for Coffs Harbour City Council March 2011
31
Task No. Task Priority Responsible
Officer Resources Required
15 Prepare written asset GIS mapping procedure 2 Manager
Asset Systems
16 Prepare maintenance Strategies linked into Levels of Service, critical assets and condition assessments
3
17 Develop asset hierarchies in accordance with the procedure 3 Manager
Asset Systems
18 Update valuation, depreciation and effective life data to take condition data into account
3
19 Develop asset cost system to allocate operation and maintenance and renewals costs to specific assets
3
20
Prepare procedures for managing planned and unplanned maintenance in accordance with the maintenance strategy. Prepare and implement maintenance specifications
3
21 Review current performance utilisation processes and consolidate into performance measurement procedures
3
22
Prepare written asset handover procedure. Needs to include for handover of developer as well as CHCC generated assets
3
23
Develop and implement guidelines/processes for lifecycle planning and funding projections, including operating, maintaining, renewals, development and disposal of assets
3
24 Complete GIS data input and audit current data quality after procedure implemented
3 Manager Asset Systems
25 Prepare procedure to ensure plans and records properly managed 3 Manager
Asset Systems
26 Prepare written capital investment procedure, to include asset risk assessments
3
27
Ensure linkages between planning/community plan and asset management are in place and prepare a process to convert strategies into actions.
3
28 Prepare procedures for project initiation and asset reviews 3
29 Review existing procedures and update if required 3
30 Collect performance data following completion of data capture and management procedures
4

© Morrison Low Ref: 6777 AMP for Water Supply Assets for Coffs Harbour City Council March 2011
32
Task No. Task Priority Responsible
Officer Resources Required
31 Life cycle costs to be collated following collection of maintenance data and changes to cost recording system
4
32 Undertake review to ensure contract administration is consistent with other procedures and legislative requirements
4
33 Optimised decision making may be deferred until basic asset management functioning properly
5
34 Complete installation and development of AssetMaster. on going Manager
Asset Systems
35
Undertake condition assessments of some asset classes in accordance with procedure. Update condition data for other asset types in accordance with procedure.
on going
36
Operations and maintenance data currently collected in water/wastewater, some data in other asset types. Audit data quality after procedure implemented
on going
37
Works / maintenance cost management to be included in development of AssetMaster. Note that water/wastewater have own system
on going
38 Continue with integration of systems on going
39 Review availability/user friendliness of system when Asset Master fully implemented
on going
40 Continue with loading data onto GIS. Data quality to be audited after procedure implemented
on going Manager Asset Systems
41 No immediate action regarding design/construction strategies, other than regular reviews
on going
42 Development of asset register to continue. Will need to be updated for asset hierarchy etc
on going Manager Asset Systems

© Morrison Low Ref: 6777 AMP for Water Supply Assets for Coffs Harbour City Council March 2011
33
Table 7-2 Water supply asset improvement plan
Task No. Task Priority Responsible
Officer Resources Required
1 Develop revised Levels of Service 1
2 Agree a maintenance plan for the Regional Water Supply pipelines with Clarence Valley Council
2
3 Establish procedure for risk based renewals prioritization based on burst frequencies, age of pipe etc
1
4 Create and maintain GIS layer showing location of pipe bursts
1
5 Carry out an asset risk assessment for water supply assets
1
6 Develop maintenance management plans based on the asset risk assessment
2
7.3 Monitoring and review procedures
This asset management plan will be reviewed during annual budget preparation and amended to recognise any changes in service levels and/or resources available to provide those services as a result of the budget decision process.
This asset management plan has a life of four years and is due for review in 2014.
8. REFERENCES
IPWEA, 2006, ‘International Infrastructure Management Manual’, Institute of Public Works Engineering Australia, Sydney.