11 - RESONANT VIBRATIONS IN THE RLC CIRCUIT
10
11 - RESONANT VIBRATIONS IN THE RLC CIRCUIT Manual for virtual exercises in the Physics Laboratory I The exercise aims to determine the basic parameters that characterize the resonant circuit, such as resonant frequency and Q factor of the system. 1. THEORETICAL BASIS Harmonic vibrations in the RLC circuit Harmonic vibrations in the RLC circuit are such periodic vibrations in which there is a periodic flow of electric charge between the coil L and the capacitor C, where the value of the charge at a given moment t is described by a harmonic function (sin(ωt) or cos(ωt)). An example of an electrical circuit in which harmonic oscillation occurs is the series and parallel RLC circuit. The resonant circuits are shown in Fig. 1. (a) (b) Fig. 1 RLC resonance circuit, a) serial, b) parallel. In the exercise, forced vibrations in a resonant circuit with damping will be tested. Forced vibrations are vibrations in which external harmonic extortion stimulates the resonant system to vibrate at a frequency of ω. In mechanical systems (swing, weight on a spring), an external harmonic force can act as extortion, which performs work on the system. In the case of electrical circuits, the role of extortion is played by electromotive force – obtaining harmonic signal requires the use of a sinusoidal voltage source. Damping occurs in every real resonance circuit and causes vibrations to disappear. Some of the energy accumulated in the resonant circuit is lost in each cycle due to, e.g. heat release. In a non-extortion system (where the energy loss due to damping cannot be replenished), vibrations will eventually disappear in the circuit. In the electric resonance circuit, energy losses (damping) occur on the resistor R. Current flow through the resistor causes energy loss in the form of Joule-Lenz heat. In electrical circuits, the parameter that is subject to vibrations is the electric charge q. In such circuits, the energy is accumulated in the form of an electric field (from the charge accumulated on the capacitor plates) or a magnetic field associated with the flow of current (and therefore the charge) through the coil. Charge vibrations are described by differential equations that can be derived using Kirchhoff's laws, e.g., for elements connected in series, the following differential equation applies:
Transcript of 11 - RESONANT VIBRATIONS IN THE RLC CIRCUIT

11 - RESONANT VIBRATIONS IN THE RLC CIRCUIT
Manual for virtual exercises in the Physics Laboratory I
The exercise aims to determine the basic parameters that characterize the resonant circuit, such as
resonant frequency and Q factor of the system.
1. THEORETICAL BASIS
Harmonic vibrations in the RLC circuit
Harmonic vibrations in the RLC circuit are such periodic vibrations in which there is a periodic flow of
electric charge between the coil L and the capacitor C, where the value of the charge at a given moment t is
described by a harmonic function (sin(ωt) or cos(ωt)). An example of an electrical circuit in which harmonic
oscillation occurs is the series and parallel RLC circuit. The resonant circuits are shown in Fig. 1.
(a) (b)
Fig. 1 RLC resonance circuit, a) serial, b) parallel.
In the exercise, forced vibrations in a resonant circuit with damping will be tested. Forced vibrations
are vibrations in which external harmonic extortion stimulates the resonant system to vibrate at a frequency of
ω. In mechanical systems (swing, weight on a spring), an external harmonic force can act as extortion, which
performs work on the system. In the case of electrical circuits, the role of extortion is played by electromotive
force – obtaining harmonic signal requires the use of a sinusoidal voltage source.
Damping occurs in every real resonance circuit and causes vibrations to disappear. Some of the energy
accumulated in the resonant circuit is lost in each cycle due to, e.g. heat release. In a non-extortion system
(where the energy loss due to damping cannot be replenished), vibrations will eventually disappear in the circuit.
In the electric resonance circuit, energy losses (damping) occur on the resistor R. Current flow through the
resistor causes energy loss in the form of Joule-Lenz heat. In electrical circuits, the parameter that is subject to
vibrations is the electric charge q. In such circuits, the energy is accumulated in the form of an electric field (from
the charge accumulated on the capacitor plates) or a magnetic field associated with the flow of current (and
therefore the charge) through the coil. Charge vibrations are described by differential equations that can be
derived using Kirchhoff's laws, e.g., for elements connected in series, the following differential equation applies:
2
Resonance in RLC circuits - a virtual exercise in the Laboratory Physics I. Faculty of Physics, Warsaw University of Technology
(1)
It is worth mentioning here that in electronics, instantaneous values (at any given time t) physical data are
written by lowercase letters of the alphabet (voltage- u, current - i). Resonance is defined as the vibrations of the physical system with its natural (resonant) frequency. A
characteristic feature of the resonance phenomenon is an increase in the amplitude of vibrations near the
resonant frequency. When the vibrating system is in resonance, even small periodic extortion can produce
vibrations of considerable amplitude. In an equilibrium situation, the energy losses in the form of damping are
balanced by the energy supplied by extortion. In the absence of adequate damping, the vibration amplitude
may exceed the values allowed for the system. An example of such a phenomenon may be damage to the
structure of buildings or bridges due to the action of external variable forces.
Fig. 2 and 3 show current characteristics near the resonance frequency measured when stimulating the RLC
serial electrical circuit and the parallel with harmonic electromotive force with a constant voltage amplitude U0.
As you can see, near the resonance, the current amplitude reaches the maximum for the serial circuit and the
minimum for the parallel circuit. In AC circuits, the measure of "impediment" to the flow of charge on individual
elements is impedance. The impedance of the resistor is constant and associated with its ohm resistance. Coil
impedance increases with frequency – the faster the current changes, the greater the electromotive force
induced in the coil. The capacitor's impedance decreases with frequency - due to changes in the direction of the
current flow, the capacitor is cyclically charged and discharged. In RLC circuits, impedance, therefore, depends
on the frequency of the voltage source. The parameters that characterize all resonance systems are the resonant
frequency, transmission band B, and Q factor. The resonance frequency corresponds to the frequency of
vibrations for which the vibration amplitude reaches the maximum or minimum (depending on the type of
circuit) and can be expressed by the following dependency:
(2)
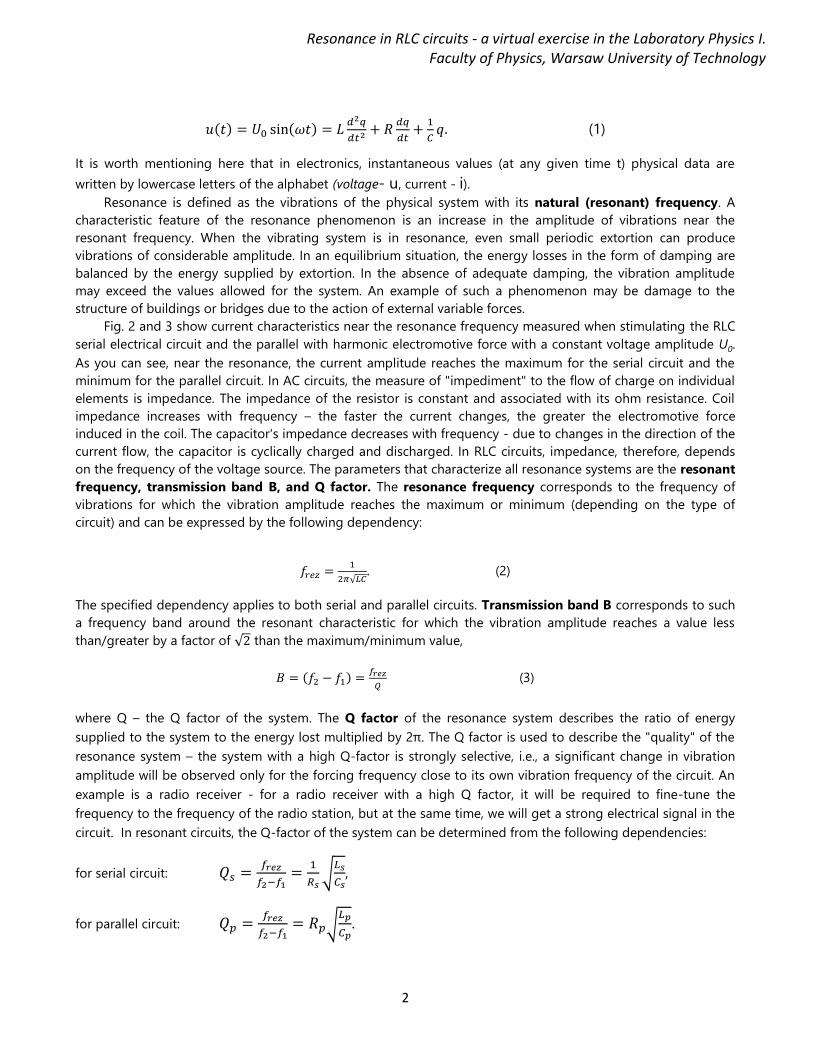
The specified dependency applies to both serial and parallel circuits. Transmission band B corresponds to such
a frequency band around the resonant characteristic for which the vibration amplitude reaches a value less
than/greater by a factor of than the maximum/minimum value,
(3)
where Q – the Q factor of the system. The Q factor of the resonance system describes the ratio of energy
supplied to the system to the energy lost multiplied by 2π. The Q factor is used to describe the "quality" of the
resonance system – the system with a high Q-factor is strongly selective, i.e., a significant change in vibration
amplitude will be observed only for the forcing frequency close to its own vibration frequency of the circuit. An
example is a radio receiver - for a radio receiver with a high Q factor, it will be required to fine-tune the
frequency to the frequency of the radio station, but at the same time, we will get a strong electrical signal in the
circuit. In resonant circuits, the Q-factor of the system can be determined from the following dependencies:
for serial circuit:
,
for parallel circuit:
.

3
Resonance in RLC circuits - a virtual exercise in the Laboratory Physics I. Faculty of Physics, Warsaw University of Technology
Fig. 2 Resonant characteristics of current in a serial RLC circuit
Fig. 3 Resonant characteristics of current in parallel RLC circuit
4
Resonance in RLC circuits - a virtual exercise in the Laboratory Physics I. Faculty of Physics, Warsaw University of Technology
Serial circuit
From the solution of the differential equation (1), it follows that the current i can be described by the
following relationship:
where I0 – current amplitude, Zs – electrical impedance of serial RLC circuit, φs – phase shift angle
between voltage and current for serial RLC system. As already mentioned, impedance is a measure of how much
the circuit components oppose the flow of electric current. It expresses the ratio of the forcing voltage to the
current flowing through the circuit. It is a complex quantity, and it has a real and an imaginary part:
ZiZZ
The real part Z' corresponds to the ohm resistance of the system, and the imaginary part Z' is associated with
the cyclical charging of the capacitor and the "reverse" electromotive force induced on the coil due to the flow
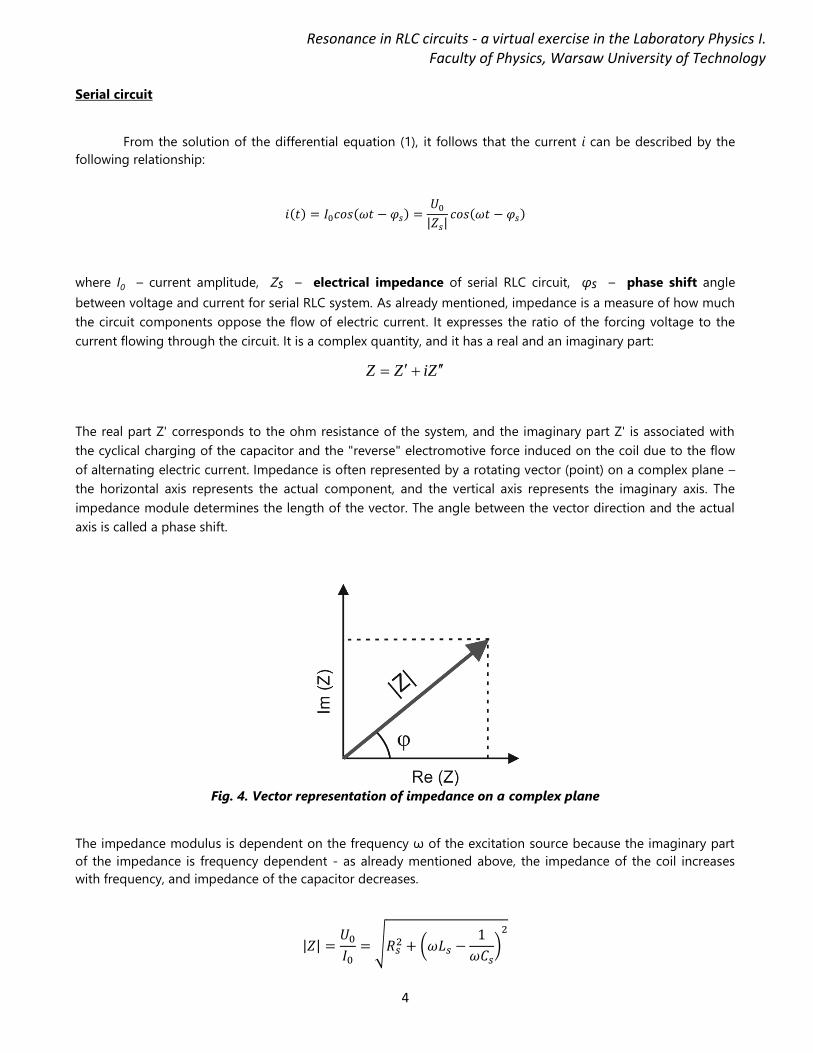
of alternating electric current. Impedance is often represented by a rotating vector (point) on a complex plane –
the horizontal axis represents the actual component, and the vertical axis represents the imaginary axis. The
impedance module determines the length of the vector. The angle between the vector direction and the actual
axis is called a phase shift.
Fig. 4. Vector representation of impedance on a complex plane
The impedance modulus is dependent on the frequency ω of the excitation source because the imaginary part
of the impedance is frequency dependent - as already mentioned above, the impedance of the coil increases
with frequency, and impedance of the capacitor decreases.

5
Resonance in RLC circuits - a virtual exercise in the Laboratory Physics I. Faculty of Physics, Warsaw University of Technology
The phase angle determines the phase shift between voltage and intensity. As shown in Figure 4, the tangent of
this angle expresses the ratio of the imaginary part of impedance to the real part.
For a resistor connected to an AC circuit, the phase angle is zero – as the voltage increases, the current
flowing through the resistor increases. Reactive elements, i.e., the coil and capacitor, introduce a shift between
current and voltage. In the case of a capacitor, the maximum current corresponds to a situation in which the
capacitor is just starting to charge, so the maximum current corresponds to zero voltage. With the increase in
voltage on the plates, the charging current decreases, so in this case, the voltage is delayed (by /2) in relation
to the intensity, and the phase angle is - /2. In the case of a coil, the electromotive force is induced by changes
in current, and according to the Lenz rule, it opposes these changes. As a result of this phenomenon, the f phase
of voltage is ahead of the phase of intensity by /2 (Fig. 5).
Fig. 5. The diagram on the plane of the complex impedance of the circuit containing the AC source and a)
resistor, b) capacitor, c) coil
In general, in complex circuits in multiple elements, the phase shift is shown in the voltage and intensity time
dependency graphs – see Figure 6.
Fig. 6. Example of RLC circuit stimulating voltage and phase shift current graph

6
Resonance in RLC circuits - a virtual exercise in the Laboratory Physics I. Faculty of Physics, Warsaw University of Technology
Resonance in a series circuit occurs when the current intensity reaches its maximum value (see Fig. 2),
i.e., when the impedance modulus reaches the minimum, which is fulfilled under the condition:
In resonance, impedance has only a real component because the impedances of the capacitor and coil endure
each other. The current in the circuit is limited only by the resistance of the resistor.
Parallel circuit
When describing resonance in parallel circuits, instead of impedance, it is more convenient to use the
concept of admittance, denoted by the letter Y. The impedance of parallel circuits is calculated similarly to the
resistance of parallel-connected resistors - the equivalent resistance is the reciprocal of the sum of the reciprocal
of the resistance of the elements. Since admittance is equal to the inverse of impedance, the admittance of the
parallel circuit can be written as the sum of admittances. Like impedance, admittance is expressed as a complex
number, and its real part is related to ohm resistance and imaginary part to the inductance and capacity. The
module of admittance in the parallel circuit can be written as:
The phase difference between current and voltage is described by the relationship:
Resonance in the parallel circuit occurs when the current reaches the minimum value, that is, when the
admittance module reaches the minimum, which is met under the condition:
The experiment aims to investigate the relationship of current flowing through a serial and parallel RLC
circuit on the forcing frequency. By measuring the current and voltage values of the system, characteristic
resonance circuit parameters such as resonance frequency and Q factor can be determined. Knowing the value
of the elements used in the circuit allows you to verify the experimentally obtained dependencies.

7
Resonance in RLC circuits - a virtual exercise in the Laboratory Physics I. Faculty of Physics, Warsaw University of Technology
2. PERFORMING THE EXERCISE
To conduct the experiment, you need a sine wave generator, voltmeter, ammeter, and RLC circuit. Fig. 7
and Fig. 8 show the diagram and how the experimental kit is connected to the serial and parallel RLC circuit. As
you can see, the current flowing through the RLC circuit will be measured with the ammeter and the voltage
from the generator with the voltmeter. The experiment will consist of recording the indications of the voltmeter
and ammeter every set step of the frequency of the forcing signal from the generator. Data from the voltmeter
and ammeter will be stored in the laptop, where the data analysis will also be performed.
Fig. 7 Diagram of the RLC serial electrical circuit to be tested
Fig. 8 Diagram of the RLC parallel electrical circuit to be tested
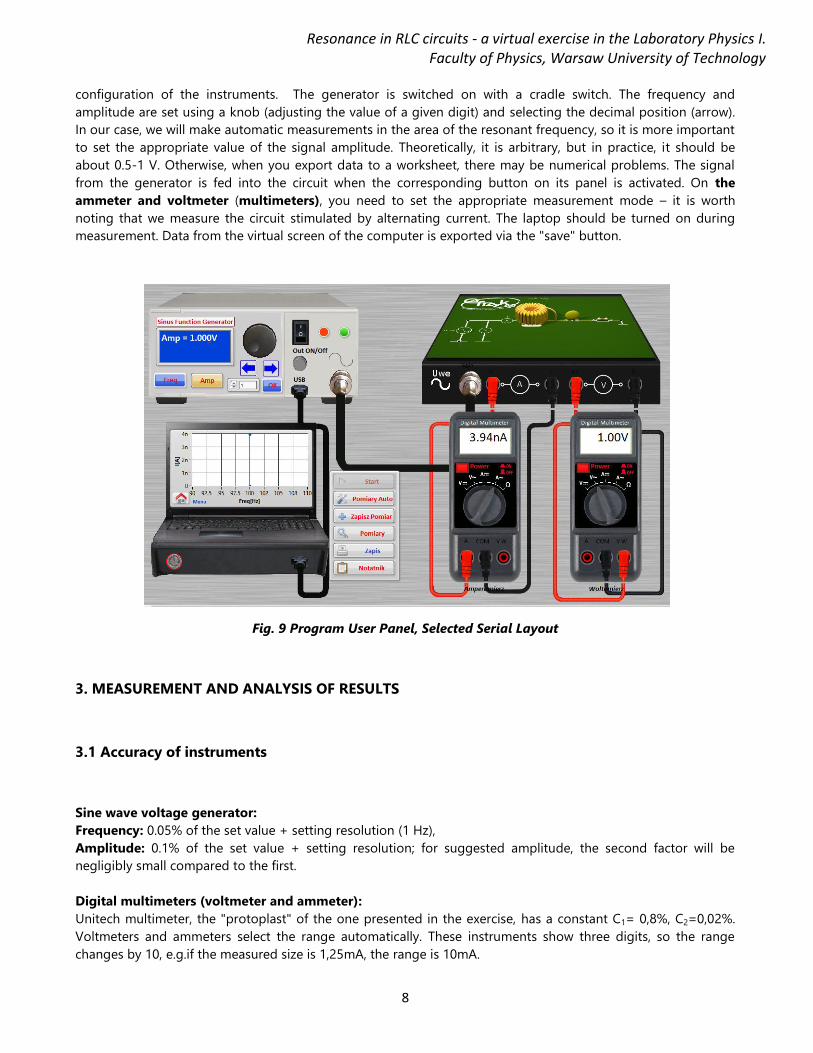
After you start the program, you must first remove the virtual instruments from the magazine and then
connect them. The program gives you the possibility to choose a circuit – serial or parallel. In the case of a serial
circuit, the user's screen will look as shown in Figure 9. Proper execution of the exercise requires the initial
8
Resonance in RLC circuits - a virtual exercise in the Laboratory Physics I. Faculty of Physics, Warsaw University of Technology
configuration of the instruments. The generator is switched on with a cradle switch. The frequency and
amplitude are set using a knob (adjusting the value of a given digit) and selecting the decimal position (arrow).
In our case, we will make automatic measurements in the area of the resonant frequency, so it is more important
to set the appropriate value of the signal amplitude. Theoretically, it is arbitrary, but in practice, it should be
about 0.5-1 V. Otherwise, when you export data to a worksheet, there may be numerical problems. The signal
from the generator is fed into the circuit when the corresponding button on its panel is activated. On the
ammeter and voltmeter (multimeters), you need to set the appropriate measurement mode – it is worth
noting that we measure the circuit stimulated by alternating current. The laptop should be turned on during
measurement. Data from the virtual screen of the computer is exported via the "save" button.
Fig. 9 Program User Panel, Selected Serial Layout
3. MEASUREMENT AND ANALYSIS OF RESULTS
3.1 Accuracy of instruments
Sine wave voltage generator:
Frequency: 0.05% of the set value + setting resolution (1 Hz),
Amplitude: 0.1% of the set value + setting resolution; for suggested amplitude, the second factor will be
negligibly small compared to the first.
Digital multimeters (voltmeter and ammeter):
Unitech multimeter, the "protoplast" of the one presented in the exercise, has a constant C1= 0,8%, C2=0,02%.
Voltmeters and ammeters select the range automatically. These instruments show three digits, so the range
changes by 10, e.g.if the measured size is 1,25mA, the range is 10mA.

9
Resonance in RLC circuits - a virtual exercise in the Laboratory Physics I. Faculty of Physics, Warsaw University of Technology
Electronic components (capacitors, resistors, coils):
rarely have a manufacturing tolerance of better than 1% of the declared value. In practice, electronic
components are often "selected" based on measurement, e.g., from several or dozens of cheap parts, those with
the nearest desired value are selected.
3.2 Analysis of the shape of diagram I(f) and determination of characteristic parameters
1. We are the first to select the RLC serial circuit. In this case, we will determine the parameters of the resonant
maximum.
2. We select the values of elements C in nF and L in mH. These values should be different for any student on
the team: 1 person chooses the first value for capacitance and the last value for inductance, subsequent
students use consecutive values (the second person uses the second C value and the penultimate L value,
the third person uses the third C value and the third from the end of the L value, etc.). The Tutor determines
the resistance value. A good starting value to observe the resonance is the value from the center of the
available series of elements, e.g., 10 ohms.
3. We measure I(f) for the range around the expected resonance frequency – in automatic mode "auto
measurements." Before setting the parameters, calculate the resonance frequency yourself. The frequency
range of the measurement should be selected according to the Q factor of the circuit – if the steep slopes of
the resonant peak are found to have been "cut" by a too narrow range, it should be extended. Similarly, if
the peak is narrow and occupies only a small slice of the range, the range can be narrowed. In the latter
case, the default measurement step should be reduced. The range of the resonant peak should consist of
several dozen measuring points.
After displaying the graph on the virtual laptop screen, we will be able to export data to a file. It is best to use
the default write option to verify that the data has been properly written to disk for custom names. In a
spreadsheet, we import the saved file and make a chart based on the collected data. In some cases, you may
need to, replace the text with numbers, e.g. "m" to "E-3" and "u" to "E-6" or a decimal character, such as a period
with a comma. After this initial editing, we can tell if the values match the curve obtained in the program.
Based on the chart, we determine:
Resonance frequency – we are looking for the maximum peak. A suitable method is numerical differentiation of
the data in the graph and determination of the intersection point of the plot of the differentiated relationship
with the horizontal axis. Numerical differentiation can be easily performed in any worksheet, dividing the
difference in value between adjacent cells representing the "y" axis by the distance between the values on the
"x" axis.
Half-width - as a criterion, we take the range of frequencies for which the intensity value will fall to
; In
the case of resonant peaks with strong asymmetry, these frequencies may not be equivalent to the resonant
frequency.
The Q factor of the circuit - as the ratio of the resonant frequency to the half-width (it should be compared
with the value determined based on the parameters of the elements in the circuit);
For all these values, we set uncertainties. An essential component of them will be the uncertainty of the method
of the determination itself (which, due to its graphical rather than analytical nature, we must estimate and treat
in calculations similarly as the uncertainty of the investigator). The uncertainty of the position of points on the
graph also contributes to the uncertainty, e.g., for the resonance frequency, we need to consider the uncertainty
of frequency (this value should be calculated for a point close to resonance). When determining the half-width,

10
Resonance in RLC circuits - a virtual exercise in the Laboratory Physics I. Faculty of Physics, Warsaw University of Technology
we must assume that it is determined based on the difference between two frequencies, each of which has
uncertainty. The uncertainty in determining this value is also influenced by the uncertainty of the determination
of Imax. Graphically, the level at which we are "looking" for the half-width can be shifted vertically within the
uncertainty of the value of
We compare the results obtained with those calculated theoretically based on the parameters of the
elements (considering the uncertainty of the values of these elements).
After consulting with the Tutor, the execution of this step may be repeated for the parallel RLC system.
3.3 Analysis of the effect of the parameters of elements R, L, C on the characteristic parameters of the
system
1. For the serial RLC circuit, we measure resonance frequency and Q-factor (similar to point 3.2) as a function
of L or C and R. Students with even numbers in the team perform an exercise for the inductive element they
used in the previous section and for a series of capacity values. The resistance value can be selected similarly
to point 3.2. Note that changes in resonant frequency may require a modification in the frequency range.
2. For one of the previously measured combinations of L and C, perform the measurement at variable
resistance, using all available resistors. Note that some resistance values may require an expansion or
narrowing of the frequency range and changes of the measurement step. The range of the resonance peak
should consist of several dozen measurement points, which allows obtaining good accuracy in determining
parameters by graphic methods.
3. We linearize the obtained dependencies frez(L), frez(C), Q(L), Q(C), Q(R) so that a straight match can be
performed using the least-squares method. After making the fit, we verify the linearity hypothesis with a
chi-square test.
4. We conclude the effect of the values of elements L, C, and R on the parameters of the resonance system and
the compatibility of observed relationships with theoretical ones.
Note that some values may show numerical errors due to too large or too small values in the export of results. If
necessary, you can experimentally select the signal amplitude from the generator so that you can get the correct
results for all measurements from one characteristic.