11. Ready Reckoner - cyclone.wmo.int · Chapter Eleven Greg Holland Formerly Bureau of Meteorology...
20
Chapter Eleven Greg Holland Formerly Bureau of Meteorology Melbourne, Australia 11. Ready Reckoner 11.1 Introduction This chapter provides a ready reference for various parameters and information related to tropical cyclones. 11.2 Unit conversion Multiply the line unit by the indicated number to get the column unit; for example, on the first line inches multiplied by 12 gives 1 ft in the second column. Only conversions to higher values are shown. Take care to convert to the degree of accuracy of the original observation only; for example a ship estimate of 20 kt based on sea state should convert to 10 ms -1 , a literal transformation to 10.256 ms -1 is incorrect. SI length units are identified by an asterisk Length mm* in ft m* km* mi nm o lat mm* 1 25.4 304.8 1000 10 6 1.61x10 6 1.85x10 6 1.11137x10 8 in 1 12 39.37 39370 63360 72913 4.38x10 6 ft 1 3.28 3281 5280 6080 364320 m* 1 1000 1609 1853 1.11137x10 5 km* 1 1.609 1.853 111.137 mi 1 1.15 69 nm 1 60 Time sec min hour day
Transcript of 11. Ready Reckoner - cyclone.wmo.int · Chapter Eleven Greg Holland Formerly Bureau of Meteorology...

Chapter Eleven
Greg Holland Formerly Bureau of Meteorology
Melbourne, Australia
11. Ready Reckoner
11.1 Introduction
This chapter provides a ready reference for various parameters and information related to tropical cyclones.
11.2 Unit conversion
Multiply the line unit by the indicated number to get the column unit; for example, on the first line inches multiplied by 12 gives 1 ft in the second column. Only conversions to higher values are shown. Take care to convert to the degree of accuracy of the original observation only; for example a ship estimate of 20 kt based on sea state should convert to 10 ms-1, a literal transformation to 10.256 ms-1 is incorrect. SI length units are identified by an asterisk
Length
mm* in ft m* km* mi nm olat
mm* 1 25.4 304.8 1000 106 1.61x10⁶ 1.85x10⁶ 1.11137x10⁸
in 1 12 39.37 39370 63360 72913 4.38x10⁶
ft 1 3.28 3281 5280 6080 364320
m* 1 1000 1609 1853 1.11137x105
km* 1 1.609 1.853 111.137
mi 1 1.15 69
nm 1 60
Time
sec min hour day

sec 1 60 3.6x10³ 8.64x10⁴
min 1 60 1.44x10³
hour 1 24
Speed
km h-1 mph kt ms-1
km h-1 1 1.61 1.85 3.6
mph 1 1.15 2.24
kt 1 1.95
Conversion from °C to °F
°F = (1.8 x °C) + 32 Conversion from °K to °C
°C = °K - 273.15
11.3 Beaufort scale
Several versions of the Beaufort wind scale exist. They mostly vary by small degrees. The following is adapted from Pielke (1991) and Dunn and Miller (1964) following work by Black and Adams (personal communication), and using information provided by R. Simpson (personal communication).
Beaufort Force Estimated 10-min averaged wind (kt) at 19m*.
Description
0 Calm Sea glassy. Appearance of being covered by oil.
1 1-3 Slight ripple.
2 4-6 Slight ripple. Isolated brief whitecaps. Unable to determine direction.
3 7-10
Gentle Breeze: Surface like wrinkled paper. Small. well defined whitecaps of uniform size but few in number. White crests disappear quickly. First able to tell direction but with difficulty.
4 11-16 Moderate Breeze: Small foam patches. Number of
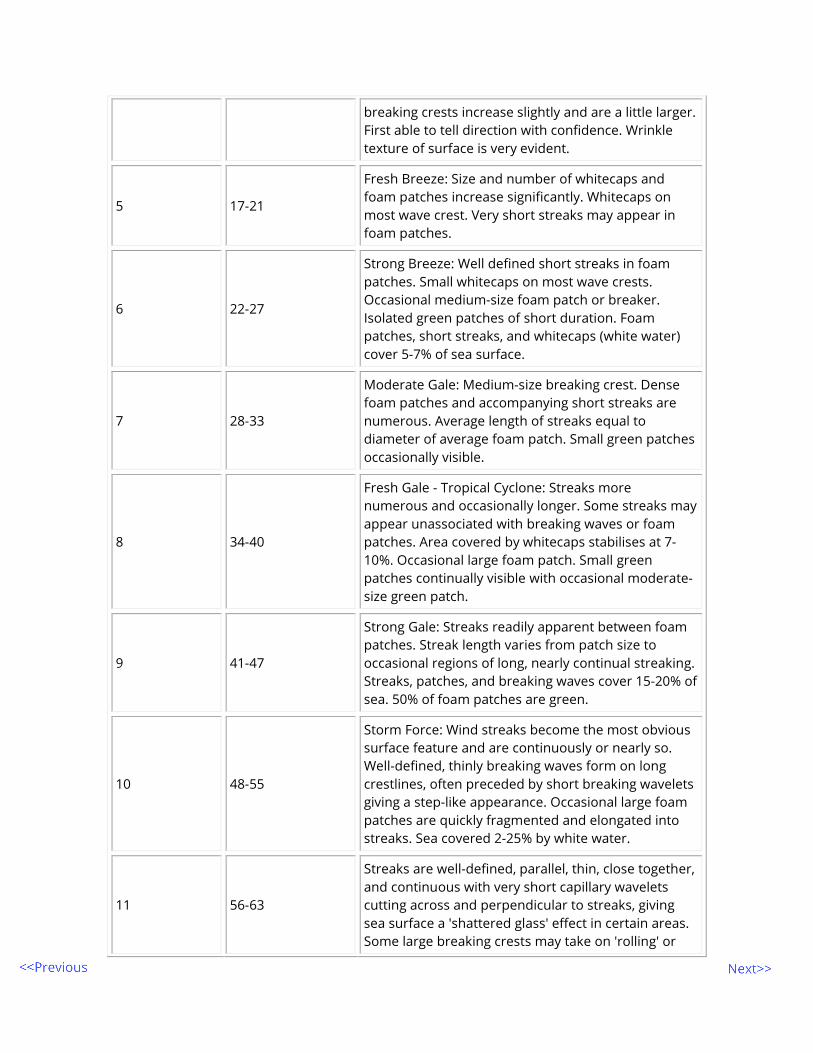
breaking crests increase slightly and are a little larger. First able to tell direction with confidence. Wrinkle texture of surface is very evident.
5 17-21
Fresh Breeze: Size and number of whitecaps and foam patches increase significantly. Whitecaps on most wave crest. Very short streaks may appear in foam patches.
6 22-27
Strong Breeze: Well defined short streaks in foam patches. Small whitecaps on most wave crests. Occasional medium-size foam patch or breaker. Isolated green patches of short duration. Foam patches, short streaks, and whitecaps (white water) cover 5-7% of sea surface.
7 28-33
Moderate Gale: Medium-size breaking crest. Dense foam patches and accompanying short streaks are numerous. Average length of streaks equal to diameter of average foam patch. Small green patches occasionally visible.
8 34-40
Fresh Gale - Tropical Cyclone: Streaks more numerous and occasionally longer. Some streaks may appear unassociated with breaking waves or foam patches. Area covered by whitecaps stabilises at 7-10%. Occasional large foam patch. Small green patches continually visible with occasional moderate-size green patch.
9 41-47
Strong Gale: Streaks readily apparent between foam patches. Streak length varies from patch size to occasional regions of long, nearly continual streaking. Streaks, patches, and breaking waves cover 15-20% of sea. 50% of foam patches are green.
10 48-55
Storm Force: Wind streaks become the most obvious surface feature and are continuously or nearly so. Well-defined, thinly breaking waves form on long crestlines, often preceded by short breaking wavelets giving a step-like appearance. Occasional large foam patches are quickly fragmented and elongated into streaks. Sea covered 2-25% by white water.
11 56-63
Streaks are well-defined, parallel, thin, close together, and continuous with very short capillary wavelets cutting across and perpendicular to streaks, giving sea surface a 'shattered glass' effect in certain areas. Some large breaking crests may take on 'rolling' or

'tumbling' appearance. Sea covered 30-40% by white water.
12 64-69
Hurricane Force: Sea may occasionally be obscured by spray and take on a murky appearance. Large, curved, breaking crests have undulating effect on steaks, giving churning appearance. Streaks appear to thicken and become milky or pale green.
13 70-75
Surface features generally become murky. Streaks and foam patches begin to sole their sharp definition and appear to smudge, thicken, or merge together. Frequent, extremely large, almost semicircular crests outlined by thinly breaking waves with occasional groups of large foam patches after entire crest breaks.
14 76-80
Quantity of spray increases. Streaks thicken and appear to have more depth. Previous crisp, shattered glass appearance now appears blurred. Most features appear to be a submerged rather than a surface phenomenon, owing to obscuration. Very short capillary wavelets which cut across streaks give surface a stressful appearance as though undergoing compression. Sea surface 50% white.
15 81-85
Sea appears flatter and entire surface takes on a whitish/greyish cast. Streaks organise somewhat into broader, diffuse bands. All features lose some definition and appear submerged. Surface 50-55% white.
16 86-90
Many thin streaks are partially obscured and those which can be seen may appear as bands spaced farther apart. Occasional cloud below aircraft blots out or obscures surface. Sea appears almost flat. Whitish cast covers 60-65% of surface.
17 91-95 Breaking waves and foam patches appear as diffuse, white, puffy areas. Streaks become fuzzy bands. Surface 70-80% white.
18 96-100
Cloud, spray, and foam patches merge into large, white, indefinable areas historically referred to as 'white sheets'. Surface features have only rough boundary definition.
19 101-105 Isolated large, white puffs. Only strongest features of previously seen thick streaks remain to be observed

and result gives impression of only a very few widely scattered and non-parallel streaks or wide bands. Whitish and greenish cast covers 100% of surface.
20 106-110
Foam patches, bands, and whitecaps merge into large indefinable areas or white sheets. Variations in brightness are less distinct but still result in churning appearance.
21 >110 Sea 100% white and green. Only slight variation in whiteness is apparent.
* The standard height for ship observations is 19m, rather than the 10m used for land.
11.4 Useful tropical cyclone parameters
11.4.1 Tropical cyclone severity scales
The Saffir Simpson Hurricane Scale (Simpson and Riehl, 1981) was developed to provide a sliding scale of damage potential for hurricanes, including that arising from storm surge. A similar scale, though adapted for local conditions is used in Australia. Global adoption of such scales is strongly recommended.
Hurricane or Severe Tropical Cyclone
Maximum Sustained Winds
Saffir-Simpson Australian Scale
Level (1-min mean, kt) (10 min mean, km h-1)
1 64-83 63-90
2 84-96 91-125
3 97-113 126-165
4 114-135 166-225
5 >135 >225
Some of the tables from the main text are also listed on the following pages for convenience.
11.4.2 Gust factors
Gust factors defined by the ratio of peak 2-s wind to the mean wind at 10 m elevation for various exposures and averaging times and in wind speeds of at least hurricane force.

Parentheses give an indication of the range in gust factors. From Atkinson (1974), Spillane and Dexter (1976) and Padya (1975).
OCEAN FLAT GRASSLAND WOODS/CITY
1-min Mean 1.25 (1.17-1.29) 1.35 (1.29-1.45) 1.65 (1.61-1.77)
10-min Mean 1.41 (1.37-1.51) 1.56 (1.51-1.70) 2.14 (1.89-2.14)
10-min Mean over Ocean 1.41 1.31 1.11
11.4.3 Dvorak intensity relationship
Empirical relationship between the current intensity number (CI), the Maximum sustained 1-min Wind Speed (MWS, kt), and the central pressure (hPa) in tropical cyclones. The central pressure values for the western North Pacific are from Shewchuk and Weir (1980).
Central Pressure
CI MWS (kt) (Atlantic) (NW Pacific)
0.0 <25
0.5 25
1 25
1.5 25
2 30 1009 1000
2.5 35 1005 997
3 45 1000 991
3.5 55 994 984
4 65 987 976
4.5 77 979 966
5 90 970 954
5.5 102 960 941
6 115 948 927

6.5 127 935 914
7 140 921 898
7.5 155 906 879
8 170 890 858
11.5 Useful constants
9.6.1 Universal constants
Avogadro's Number, NA 6.02247x1026 kmol-1
Base of Natural Logarithms, e 2.71828
Boltzmann's Constant, k 1.381x10⁻²³ J K-1 molecule-1
Gravitational Constant 6.673x10⁻¹¹ Nm2 kg-1
Pi π 3.1415927
Planck's Constant, h 6.6262 x10⁻³⁴ J s-1
Speed of Light, c 2.998x10⁸ ms-1
Speed of Sound in Air at 0°C 340 ms-1
Stefan-Boltzmann Constant, σ 5.6696x10⁻⁸ W m-2 K-4
Universal Gas Constant, R 8.3143x10³ J K-1 kmol-1
9.6.2 The Earth
Angular Velocity, Ω 7.292x10⁻⁵ s-1
Gravitational Acceleration at the surface,
g 9.81 ms-2
Radius: Mean, Equatorial Polar
RE
6370 km 6379 km 6357 km
Volume 1.083x10²¹ m3
Surface Area 5.1x10¹² m2

Mass 5.988x1024 kg
Mean Density 5.529x10³ kg m-3
Mean Distance to Moon 3.8x10⁵ km
Mean Distance to Sun 1.49x10⁸ km
Orbital Speed around Sun 2.977x10⁴ ms-1
Azimuthal Speed at Equator 465 ms-1
Solar Irradiance 1.38x10³ W m-2
9.6.3 The Atmosphere
Density of dry air at 0°C and 1000 hPa 1.29 kg m-3
Gas Constant: Universal For Dry Air,
Rd
8.31436x10³ J K-1 kmol-1 287 J K-1 kg-1
Mass of Atmosphere 5.3x10¹⁸ kg
Molecular Weight of Dry Air 28.966 kg kmole-1
Specific Heat of Dry Air: at Constant Pressure, at Constant Volume,
cp cv
1004 J K-1 kg-1 717 J K-1 kg-1
Standard Sea Level: Pressure, Temperature, Density, Speed of Sound,
ps Ts ρs cs
1013.28 hPa 288.16K 2.225 kg m-3 331.3 ms-1
9.6.4 Water
Density of Water (0°C) 1.0x10³ kg m-3
Density of Ice (0°C) 0.917x10³ kg m-3
Gas Constant for Vapour, Rv 461.5 J K-1 kg-1
Molecular Weight of Water Vapor 18.016 kg kmol-1
Specific Heat: Water Vapour: Constant Pressure
1810 J K-1 kg-1

Constant Volume Liquid Water at 0°C Ice at 0°C Latent Heat: Vaporisation at 0°C Vaporisation at 100°C Fusion at 0°C Sublimation at 0°
1350 J K-1 kg-1 4218 J K-1 kg-1 2106 J K-1 kg-1 2.5x10⁶ J kg-1 2.25x10⁶ J kg-1 3.34x10⁵ J kg-1 2.83x10⁶ J kg-1
11.6 Derived parameters
11.6.1 Definition of terms
b empirical constant
cg gravity wave phase speed
cp specific heat of dry air at constant pressure
c1, c2 empirical constants
e base of natural logarithm
f Coriolis parameter
h, H atmospheric scale height
I inertial frequency
k unit vector perpendicular to the earth surface
L latent heat of condensation
Lr Rossby radius of deformation
ln natural logarithm
Ma absolute angular momentum
N Brunt Vaisala frequency, total number in population sample
p air pressure
pc central (minimum) pressure of a tropical cyclone
pn representative environmental pressure for a tropical cyclone
q specific humidity
R universal gas constant
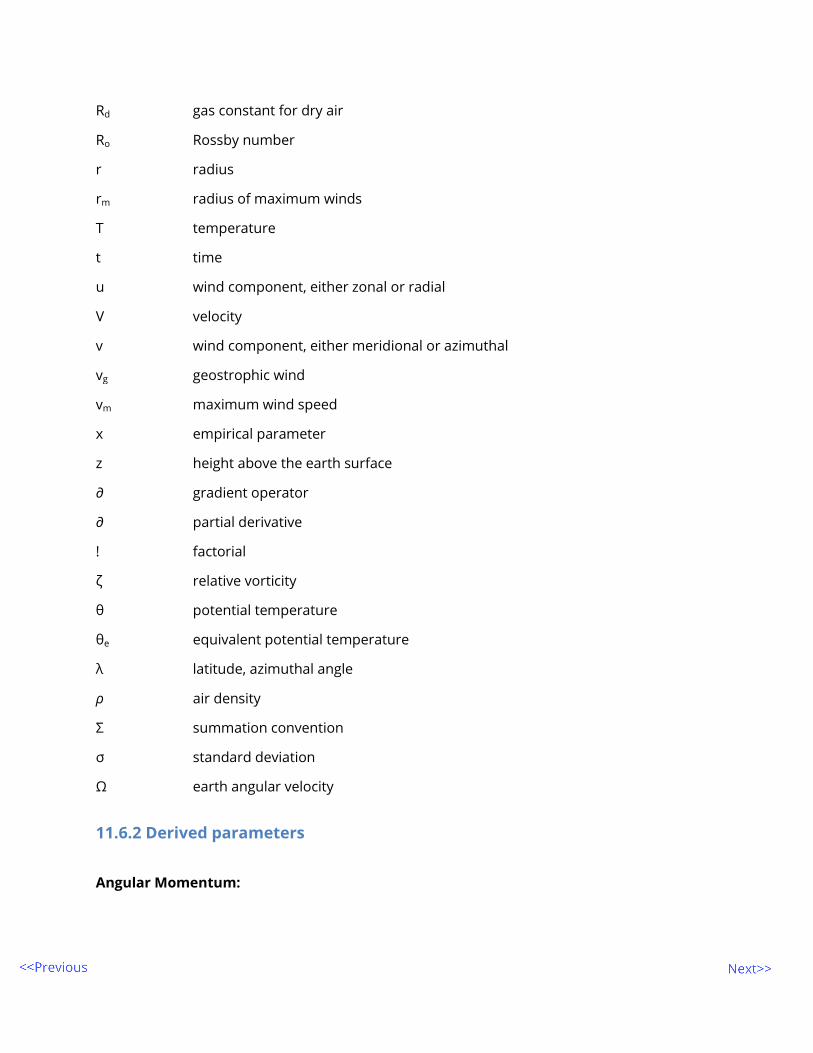
Rd gas constant for dry air
Ro Rossby number
r radius
rm radius of maximum winds
T temperature
t time
u wind component, either zonal or radial
V velocity
v wind component, either meridional or azimuthal
vg geostrophic wind
vm maximum wind speed
x empirical parameter
z height above the earth surface
∂ gradient operator
∂ partial derivative
! factorial
ζ relative vorticity
θ potential temperature
θe equivalent potential temperature
λ latitude, azimuthal angle
ρ air density
Σ summation convention
σ standard deviation
Ω earth angular velocity
11.6.2 Derived parameters
Angular Momentum:

where f0 is evaluated at the cyclone centre (Holland, 1983) Brunt Vaisala Frequency (Static Stability):
Coriolis Parameter:
Divergence:
Equation of State:
Equivalent Potential Temperature:

Inertial Frequency (Inertial Stability):
Mean:
Poisson Distribution: The discrete probability distribution
Potential Temperature:
Rossby Number:

Rossby Radius of Deformation:
Standard Deviation:
Thermal Wind:

Vorticity:
Wind Balance:
For cyclones, the positive (negative) root is used in the northern (southern) hemisphere
Wind Profiles: (Holland, et al, 2010) Knowledge of radial wind profiles has become quite complex. This is best understood by consulting the reference at:http://nldr.library.ucar.edu/repository/assets/osgc/OSGC-000-000-001-080.pdf

Wind/Pressure Relationships: Recent research into wind-pressure relationships have shown involvement of storm motion, size & latitude. The following equations are taken from (Knaff and Zehr, 2007):
where Vsrm is the maximum wind speed adjusted for storm speed, S (i.e., = V500/V500c) is the normalized size parameter (see below), and φ is latitude (in degrees). V500 is the mean tangential wind at 500km from the cyclone centre and V500c is defined below.
11.7 Tropical cyclone records
Recording records is a difficult task, because of the extreme nature of the event and the tendency for observing equipment to break. The following records are backed up by good analysis methods and are considered to be reasonably reliable.
11.7.1 Global records
These records have been taken from http://wmo.asu.edu/#cyclone and from tropical cyclone records. Visit the page for the sources for these records and also any recent updates.
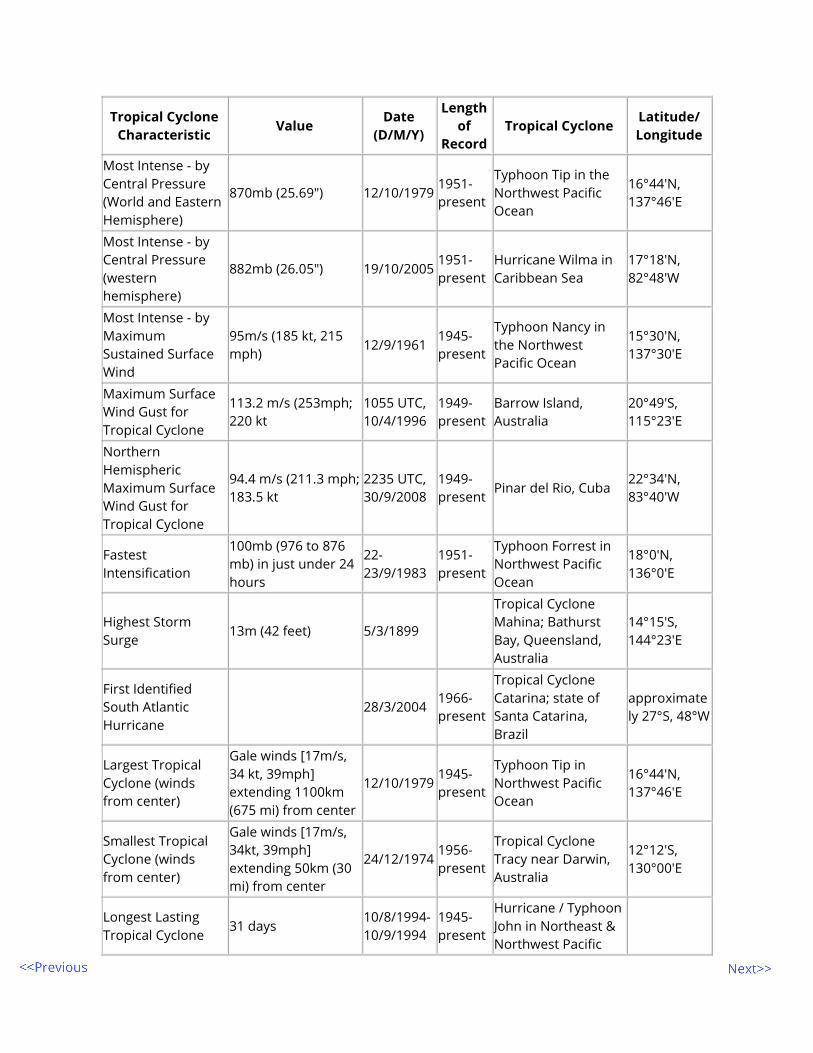
Tropical Cyclone Characteristic
Value Date
(D/M/Y)
Length of
Record Tropical Cyclone
Latitude/ Longitude
Most Intense - by Central Pressure (World and Eastern Hemisphere)
870mb (25.69") 12/10/1979 1951- present
Typhoon Tip in the Northwest Pacific Ocean
16°44'N, 137°46'E
Most Intense - by Central Pressure (western hemisphere)
882mb (26.05") 19/10/2005 1951- present
Hurricane Wilma in Caribbean Sea
17°18'N, 82°48'W
Most Intense - by Maximum Sustained Surface Wind
95m/s (185 kt, 215 mph)
12/9/1961 1945- present
Typhoon Nancy in the Northwest Pacific Ocean
15°30'N, 137°30'E
Maximum Surface Wind Gust for Tropical Cyclone
113.2 m/s (253mph; 220 kt
1055 UTC, 10/4/1996
1949-present
Barrow Island, Australia
20°49'S, 115°23'E
Northern Hemispheric Maximum Surface Wind Gust for Tropical Cyclone
94.4 m/s (211.3 mph; 183.5 kt
2235 UTC, 30/9/2008
1949-present
Pinar del Rio, Cuba 22°34'N, 83°40'W
Fastest Intensification
100mb (976 to 876 mb) in just under 24 hours
22-23/9/1983
1951- present
Typhoon Forrest in Northwest Pacific Ocean
18°0'N, 136°0'E
Highest Storm Surge
13m (42 feet) 5/3/1899
Tropical Cyclone Mahina; Bathurst Bay, Queensland, Australia
14°15'S, 144°23'E
First Identified South Atlantic Hurricane
28/3/2004 1966-present
Tropical Cyclone Catarina; state of Santa Catarina, Brazil
approximately 27°S, 48°W
Largest Tropical Cyclone (winds from center)
Gale winds [17m/s, 34 kt, 39mph] extending 1100km (675 mi) from center
12/10/1979 1945- present
Typhoon Tip in Northwest Pacific Ocean
16°44'N, 137°46'E
Smallest Tropical Cyclone (winds from center)
Gale winds [17m/s, 34kt, 39mph] extending 50km (30 mi) from center
24/12/1974 1956- present
Tropical Cyclone Tracy near Darwin, Australia
12°12'S, 130°00'E
Longest Lasting Tropical Cyclone
31 days 10/8/1994- 10/9/1994
1945- present
Hurricane / Typhoon John in Northeast & Northwest Pacific

Basins
Longest Distance Traveled by Tropical Cyclone
13280 km (7165 st. mi.)
10/8/1994- 10/9/1994
1961-present (satellite era)
Hurricane / Typhoon John in Northeast & Northwest Pacific Basins
Smallest eye 6.7km (4 mile) 24/12/1974 1956-present
Tropical Cyclone Tracy at Darwin Australia
12°12'S, 130°00'E
Largest eye 90km (56 mile) 21/2/1979 1956-present
Tropical Cycle Kerry, Coral Sea
17°30'S, 154°06'W
Largest Rainfall of Tropical Cyclones Value
Date (D/M/Y)
Length of
Record Tropical Cyclone
Latitude/ Longitude
12 hr 1.144m (45.0") 7-8/1/1966
1966-1990
Tropical Cyclone Denise in South Indian Ocean
21°14'S, 55°41'E
24 hr 1.825m (71.8") 7-8/1/1966
1966-1990
Tropical Cyclone Denise in South Indian Ocean
21°14'S, 55°41'E
48 hr 2.467m (97.1") 7-9/4/1958
1952-1980 & 2004- present
Unnamed Tropical Cyclone In South Indian Ocean
21°00'S, 55°26'E
72 hr 3.930m (154.7") 24-27/2/2007
1968- present
Tropical Cyclone Gamede in South Indian Ocean
21°12'S, 55°39'E
96 hr 4.869m (191.7") 24-27/2/2007
1968- present
Tropical Cyclone Gamede in South Indian Ocean
21°12'S, 55°39'E
10-day 5.678m (223.5") 18-27/1/1980
1968- present
Tropical Cyclone Hyacinte in South Indian Ocean
21°12'S, 55°39'E
11.7.2 Regional Records
When printing this file include your regional records here.
11.8 Trivia corner
Hurricane Rubble: Surge and waves from Hurricane Bebe at Funafuti Atoll (8°S, 179°E) during 21 October, 1972 raised a permanent rubble rampart 3.5 m high, 37 m wide and 18 km long (Maragos et al., 1973). Hot Air: A localised region of extremely warm stratospheric air with 240 hPa temperature anomaly of 18° attained over a distance of 13 km at the end of a cloud band outside the eye of Tropical Cyclone Kerry, February 1979, Coral Sea (Holland et al., 1984); measured by 747 with meteorologist in the cockpit, caused a major scare as the jet engines lost substantial power; in a similar incident in Western Australia a jet descended to 3 km altitude before regaining engine power. Best Ship Observations: Caught in a typhoon in the western North Pacific during 26 September 1935, officers of the Japanese Imperial Navy collected the first, and possibly still the most comprehensive set of observations of the surface structure of a tropical cyclone (Arakawa and Suda, 1953). Best Book Title: "An Attempt To Develop The Law of Storms By Means of Facts, Arranged According To Place and Time; and Hence To Point Out A Cause For The Variable Winds With The View To Practical Use In Navigation" (Reid, 1838). Meteorology: This word seems to have been introduced to the language by Rear Admiral FitzRoy (1862), who begged his readers to accept the "abbreviation" from the then accepted meteorologic or meteorological. Cyclone=Coiled Snake: Piddington (1855) first coined the term cyclone based on the Greek word, κυκλοζ or coil of a snake, which indicated the characteristic circular and centripetal air flow. Typhoon=Big Wind: The derivative of the word typhoon seems to have arisen from very appropriate Mandarin word t'ai fung for great wind. Hurricane=Angry God: The derivative of the word hurricane comes from Huracan, or "God of Evil" used by the Central American Tainos tribe (Anthes, 1982). Cock-Eyed Bobs: Contrary to popular belief, tropical cyclones are not referred to as Willy Willys in Australia. This name refers to dust devils. However, old timers on the Australian west coast often used the colourful name Cock-Eyed Bob to refer to severe tropical cyclones. Divine Wind: In the 13th century, a Mongol fleet, possibly the largest fleet ever assembled up to that time, was destroyed by a typhoon on its way to what would have been a successful invasion of Japan. This great fortune for Japan gave rise to the term kamikaze, for Divine Wind. Friend or Foe: Clement Wragge, the Australian forecaster who started the convention of naming tropical cyclones, occasionally named a particularly severe one after politicians with whom he was displeased.

Coincidences? The TCM-90 Field experiment was initiated following a less than good series of forecasts for Typhoon Abby; the Project Manager was Bob Abbey. The Director of the field experiment in Guam was Russ Elsberry; several months later Guam was badly damaged by Supertyphoon Russ.
11.9 References
Anthes, R. A., Tropical Cyclones: Their Evolution, Structure and Effects, American Meteorological Society, Boston, MA, 1982. Arakawa H., and Suda K., 1953, Analysis of winds, wind waves, and swell over the sea to the east of Japan during the typhoon of September 26, 1935. Mon. Wea. Rev., 81, 31-37. Atkinson G.D., 1974, Investigation of gust factors in tropical cyclones. U.S. Fleet Weather Central Tech. Note. JTWC 74-1, 9pp Battan, L. J., 1973: Radar observations of the atmosphere. The University of Chicago Press, 324 pp. Dunn, G. E., Miller B. I., 1964, Atlantic Hurricanes, Louisiana State University Press, Baton Rouge, Louisiana. Dvorak, V.F. 1984. Tropical cyclone intensity analysis using satellite data. NOAA Technical Report NESDIS 11, NTIS, Springfield, VA 22161, 45 pp FitzRoy R. 1862. The weather book: a manual of practical meteorology. Longman, Green: London. Fujiwhara, S. (1921): The natural tendency towards symmetry of motion and its application as a principle in meteorology. Q. J. Roy. Meteor. Soc., 47, 287-292. Guard C., Lander M.A., 1999. A scale relating tropl=ical cyclone wind speed to potential damage for the tropical Pacific Ocean region: A user's manual. WERI Tech. Report 86 (2nd Edition) 60pp Greg J. Holland. (1983) Angular momentum transports in tropical cyclones. Q. J. Roy. Meteor. Soc.109 187-209. Holland, G. J., T. D. Keenan, and G. D. Crane (1984), Observations of a phenomenal temperature perturbation in Tropical Cyclone Kerry (1979), Monthly Weather Review, 112, 1074-1082. Holland, G. , Belanger, J. I. and Fritz, A., 2010, A Revised Model for Radial Profiles of Hurricane Winds.Mon. Wea. Rev., 138, 4393-4401

Knaff, J. and Zehr, R. M., 2007: Reexamination of Tropical Cyclone Wind-Pressure Relationships. Wea. Forecasting, 22, 71-88. Leslie, L. M., Hess, G. D., Holland, G. J., Morison, R. P., Fraedrich, K., 1992. Predicting changes in intensity of tropical cyclones using a Markov chain technique. Aust. Met. Mag. 40(1), 41-46. Maragos, J.E., Baines, G.B.K., Beveridge, P.J., 1973. Tropical Cyclone Bebe Creates a New Land Formation on Funafuti Atoll. Science, 181(4105), 1161-1164. Padya, B.M., 1975: Spatial variability and gustiness of cyclone winds: Gervaise, Mauritius, February, 1975. Aust. Met. Mag., 23, 61-69. Piddington H., 1864, "The Sailor's Horn-Book for the Law of Storms" (Pielke (1991)) -- (11.4 Beaufort Scale - this reference cannot be sourced) Shewchuk, J. D., and R. C. Weir, 1980: An evaluation of the Dvorak technique for estimating TC intensities from satellite imagery. JTWC Tech. Note 80-2, JTWC, Pearl Harbor, HI, 16 pp Simpson, R.H. (1974). The hurricane disaster potential scale. Weatherwise, 27, 169-186. Simpson, R.H. and H. Riehl (1981): The Hurricane and Its Impact. Louisiana State Univ. Press, Baton Rouge (IBSN 0-8071-0688-7), 398 pp. Spillane K.T. and Dexter P.E. 1976: Design waves and wind in the Australian tropics. Aust. Met. Mag.,24, 37-48.