11 Design Considerations of Long-Distance … Considerations... · Design Considerations of...
61
712 1.0 INTRODUCTION The pneumatic transportation of bulk solids through pipelines has been in existence for over one hundred years. Some of the earlier applications included the vacuum unloading of grain from ships and the extraction of sawdust from timber mills. This method of conveying now is being selected for an increasing number of industrial applications and products and hence, is playing a more vital and integral role in numerous bulk handling operations and processes. Some of the major reasons are listed below. • Enclosed, safe and environmentally attractive method of transport suitable to a wide variety of products, including those with bacteria-prone, toxic or explosive properties. 11 Design Considerations of Long-Distance Pneumatic Transport and Pipe Branching Peter W. Wypych
Transcript of 11 Design Considerations of Long-Distance … Considerations... · Design Considerations of...
11-Oct-2001 JMR
712
1.0 INTRODUCTION
The pneumatic transportation of bulk solids through pipelines hasbeen in existence for over one hundred years. Some of the earlierapplications included the vacuum unloading of grain from ships and theextraction of sawdust from timber mills.
This method of conveying now is being selected for an increasingnumber of industrial applications and products and hence, is playing a morevital and integral role in numerous bulk handling operations and processes.Some of the major reasons are listed below.
• Enclosed, safe and environmentally attractive method oftransport suitable to a wide variety of products, includingthose with bacteria-prone, toxic or explosive properties.
11
Design Considerations ofLong-Distance PneumaticTransport and PipeBranching
Peter W. Wypych
Long Distance Pneumatic Transport and Pipe Branching 713
11-Oct-2001 JMR
• Simple systems requiring a prime mover, a feeding device, aconveying pipeline and a cleaning or disengaging device(Marcus et al., 1990).
• Flexibility in pipeline layout.
• Ability to distribute product to a number of different areaswithin a plant and/or pick up material from several differentlocations.
• Low maintenance and manpower costs.
• Multiple use—a single pipeline can be used for a variety ofproducts.
• Ease of automation and control.Unfortunately, many new and old systems have not been designed
properly and are being operated inefficiently. Some of the major conse-quences include high energy consumption, excessive system erosion, inad-equate conveying capacity, unexpected pipeline blockages, excessive prod-uct damage and hence, poor quality control and/or increased maintenance.These problems have resulted mainly from
• A lack of appreciation of product properties and/orcharacteristics
• Inadequate and/or inaccurate design procedures
• Selecting unsuitable hardware and/or mode of transport(Wypych, 1995a)
• Improper commissioning and/or operation of the plantA significant number of developments have occurred over the past
decade to address these important issues of pneumatic conveying (Wy-pych, 1995a). This chapter summarizes some of the major design consider-ations that have resulted from this work in relation to long-distance and pipebranching applications.
2.0 LONG-DISTANCE PNEUMATIC CONVEYING
With the advent of high-pressure feeders after World War II (e.g.,blow tanks, screw pumps), many designers and users began to applypneumatic conveying to much greater distances and/or capacities (e.g.,
714 Fluidization, Solids Handling, and Processing
11-Oct-2001 JMR
L ≥ 1 km and/or ms ≥ 100 th-1). However, in many cases, this resulted invarious problems, such as
• higher than expected pressures and energy consumption,
• excessive transport velocities, system erosion (e.g., pipes,bends) and product damage,
• low system reliability (mainly due to premature failure ofvalves and instrumentation),
• inadequate conveying capacity, and/or
• unexpected material buildup and/or blockages along thepipeline.
These problems in turn were hampering the successful design and/oroperation of long-distance pneumatic conveying systems and hence, thefuture potential of this method of transport to a wide variety of industries.
To overcome these problems, a number of interesting developmentsin research and technology have occurred over recent years and thesehave resulted in the following important design considerations.
• Characterization and classification of the material(s) to beconveyed.
• Improved blow tank design to ensure an efficient and controlleddischarge rate of material.
• New test-design procedures for the accurate prediction ofpipeline pressure drop, including the effects due to horizontal/vertical flow and bends.
• Stepped-diameter pipelines to minimize pressure drop, velocity,wear and power consumption.
• Reliable valves for blow tank filling, venting and discharge.
• Manual or automatic back-pressure unblocking of conveyingpipelines.
2.1 Product Characterization and Classification
The characterization and classification of bulk solids is becoming anincreasingly important design requirement to assess the suitability of
Long Distance Pneumatic Transport and Pipe Branching 715
11-Oct-2001 JMR
pneumatically conveying a material over long distances. The current trendsand experiences indicate that the major influential parameters include
• Particle size and distribution
• Particle density, bulk density and particle shape
• Cohesive, wet, sticky and/or electrostatic properties (ifapplicable)
• Temperature of product and carrier gas
• Permeability (or fluidization) and deaeration characteristics ofthe material (Mainwaring and Reed, 1987; Jones and Mills,1989), which depend strongly on the above parameters
Possibly, the most difficult aspect of determining particle size isselecting initially the correct or relevant definition and then calculating amean or average diameter to represent the complete bulk solid. To someextent, this will depend on the following.
• The measuring apparatus and its principle of operation
• The final application or requirements (e.g., determination offree-settling velocity v∞, minimum fluidization velocity Vmf ,minimum transport velocity Vfmin , and/or pipeline air pressuredrop ∆pt)
• The basis of definition used in a theoretical or empiricalrelationship (e.g., sieve or volume measurement)
In some cases, especially for very fine powders, researchers havelooked at other properties to explain or classify product behavior. Forexample, Geldart et al. (1984) have found that the ratio of “tapped” to“aerated” bulk density provides a good indication of the likely fluidizationcharacteristics of fine and cohesive powders.
However, this section pursues particle size measurement and evalu-ates its importance (as well as density) for the purpose of classifying thesuitability of powders for long-distance pneumatic conveying applications.Initially, an appreciation of the fundamentals and the existing powderclassification techniques is required.
Physical Properties. To determine or calculate particle size, it isimportant to be aware of the following different definitions and relatedproperties (Geldart and Abrahamsen, 1981; Allen, 1975).
716 Fluidization, Solids Handling, and Processing
11-Oct-2001 JMR
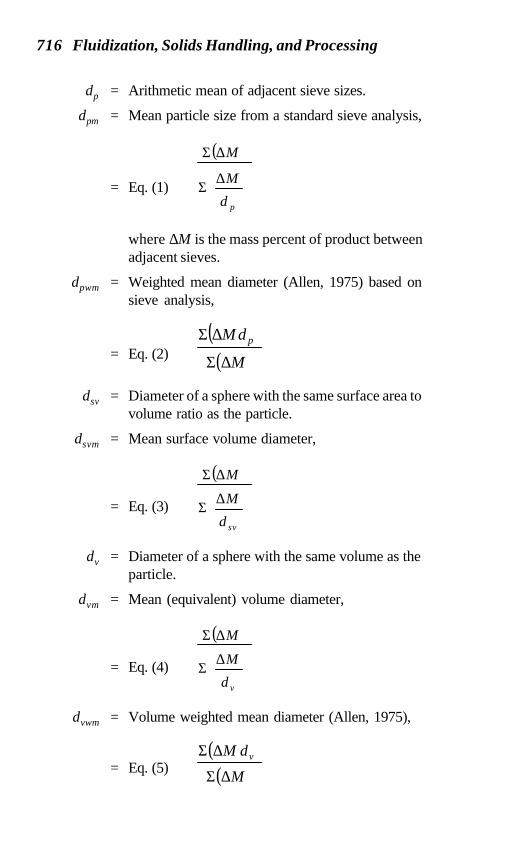
dp = Arithmetic mean of adjacent sieve sizes.
dpm = Mean particle size from a standard sieve analysis,
= Eq. (1)
( )
∆Σ
∆Σ
pd
M
M
where ∆M is the mass percent of product betweenadjacent sieves.
dpwm = Weighted mean diameter (Allen, 1975) based onsieve analysis,
= Eq. (2)( )
( )M
dM p
∆Σ
∆Σ
dsv = Diameter of a sphere with the same surface area tovolume ratio as the particle.
dsvm = Mean surface volume diameter,
= Eq. (3)
( )
∆Σ
∆Σ
svd
M
M
dv = Diameter of a sphere with the same volume as theparticle.
dvm = Mean (equivalent) volume diameter,
= Eq. (4)
( )
∆Σ
∆Σ
vd
M
M
dvwm = Volume weighted mean diameter (Allen, 1975),
= Eq. (5)( )
( )M
dM v
∆Σ
∆Σ
Long Distance Pneumatic Transport and Pipe Branching 717
11-Oct-2001 JMR
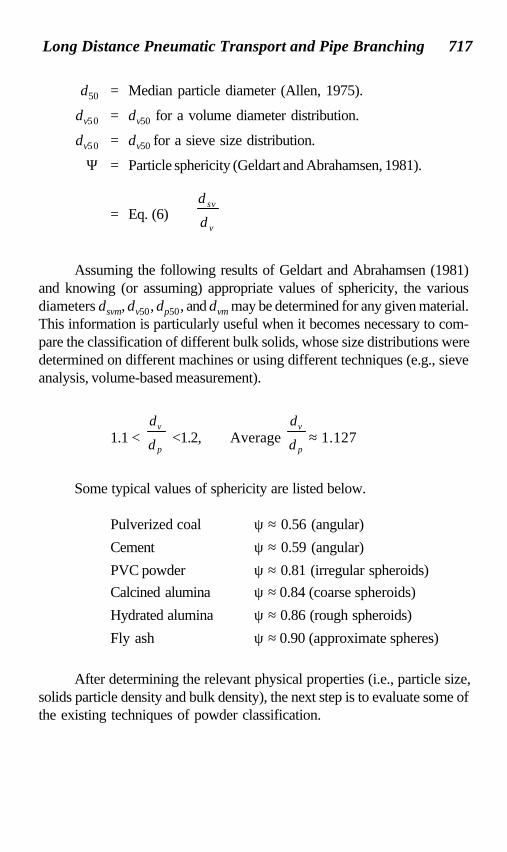
d50 = Median particle diameter (Allen, 1975).
dv50 = dv50 for a volume diameter distribution.
dv50 = dv50 for a sieve size distribution.
Ψ = Particle sphericity (Geldart and Abrahamsen, 1981).
= Eq. (6)v
sv
d
d
Assuming the following results of Geldart and Abrahamsen (1981)and knowing (or assuming) appropriate values of sphericity, the variousdiameters dsvm, dv50, dp50, and dvm may be determined for any given material.This information is particularly useful when it becomes necessary to com-pare the classification of different bulk solids, whose size distributions weredetermined on different machines or using different techniques (e.g., sieveanalysis, volume-based measurement).
1.1 < p
v
d
d <1.2, Average
p
v
d
d≈ 1.127
Some typical values of sphericity are listed below.
Pulverized coal ψ ≈ 0.56 (angular)
Cement ψ ≈ 0.59 (angular)
PVC powder ψ ≈ 0.81 (irregular spheroids)Calcined alumina ψ ≈ 0.84 (coarse spheroids)
Hydrated alumina ψ ≈ 0.86 (rough spheroids)
Fly ash ψ ≈ 0.90 (approximate spheres)
After determining the relevant physical properties (i.e., particle size,solids particle density and bulk density), the next step is to evaluate some ofthe existing techniques of powder classification.
718 Fluidization, Solids Handling, and Processing
11-Oct-2001 JMR
Powder Classification Techniques. The Geldart (1973) fluidiza-tion, and Dixon (1981) slugging classifications have been found useful inexplaining:
• some of the feeding problems that can occur in blow tankfeeders (Wypych and Arnold, 1986a),
• the differences that can occur in flow performance andminimum transport behavior (Wypych and Arnold, 1984).
Modifications to the Geldart (1973) fluidization diagram have beenproposed by Molerus (1982) and Zenz (1984), but are not considered hereas they require some knowledge or measurement of particle adhesionforces and bulk surface tension, respectively. That is, detailed investiga-tions into evaluating and/or developing such fluidization diagrams arebeyond the present scope of work.
Another useful classification technique that makes use of two differ-ent bench-type experiments (i.e., permeability and deaeration) has beenpresented by Mainwaring and Reed (1987). The above three classifica-tions are described in the following sections.
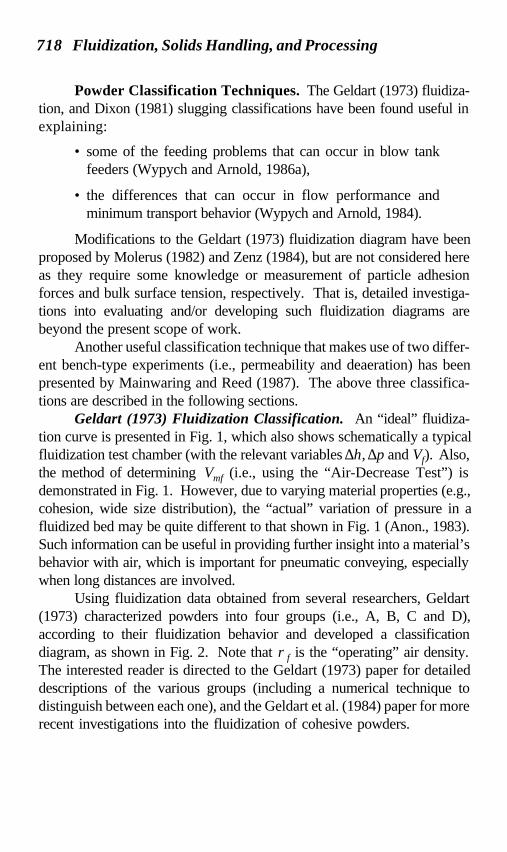
Geldart (1973) Fluidization Classification. An “ideal” fluidiza-tion curve is presented in Fig. 1, which also shows schematically a typicalfluidization test chamber (with the relevant variables ∆h, ∆p and Vf). Also,the method of determining Vmf (i.e., using the “Air-Decrease Test”) isdemonstrated in Fig. 1. However, due to varying material properties (e.g.,cohesion, wide size distribution), the “actual” variation of pressure in afluidized bed may be quite different to that shown in Fig. 1 (Anon., 1983).Such information can be useful in providing further insight into a material’sbehavior with air, which is important for pneumatic conveying, especiallywhen long distances are involved.
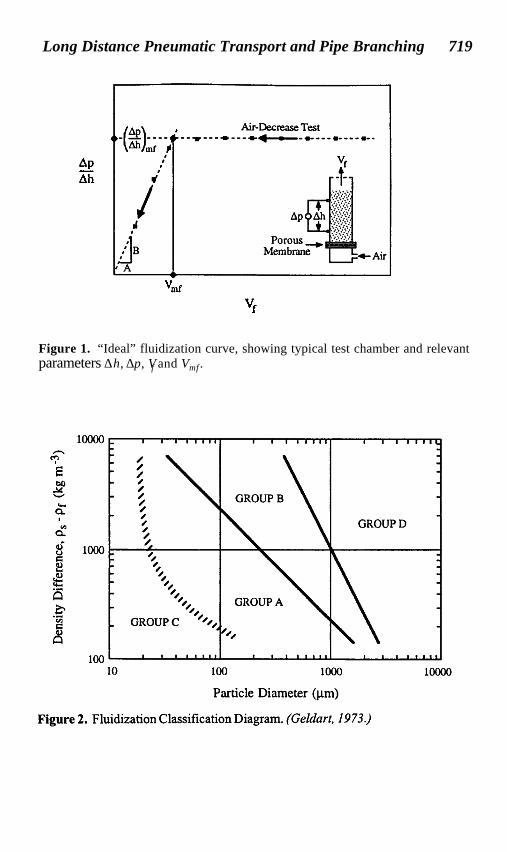
Using fluidization data obtained from several researchers, Geldart(1973) characterized powders into four groups (i.e., A, B, C and D),according to their fluidization behavior and developed a classificationdiagram, as shown in Fig. 2. Note that ρf is the “operating” air density.The interested reader is directed to the Geldart (1973) paper for detaileddescriptions of the various groups (including a numerical technique todistinguish between each one), and the Geldart et al. (1984) paper for morerecent investigations into the fluidization of cohesive powders.
Long Distance Pneumatic Transport and Pipe Branching 719
11-Oct-2001 JMR
Figure 1. “Ideal” fluidization curve, showing typical test chamber and relevantparameters ∆h, ∆p, Vf and Vmf .
Figure 2. Fluidization Classification Diagram. (Geldart, 1973.)
Ap
~
Vmf
Vf
720 Fluidization, Solids Handling, and Processing
11-Oct-2001 JMR
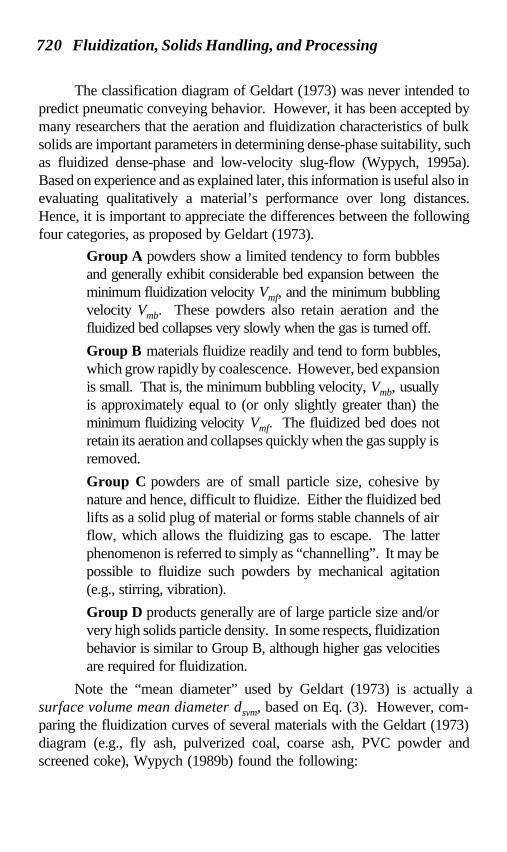
The classification diagram of Geldart (1973) was never intended topredict pneumatic conveying behavior. However, it has been accepted bymany researchers that the aeration and fluidization characteristics of bulksolids are important parameters in determining dense-phase suitability, suchas fluidized dense-phase and low-velocity slug-flow (Wypych, 1995a).Based on experience and as explained later, this information is useful also inevaluating qualitatively a material’s performance over long distances.Hence, it is important to appreciate the differences between the followingfour categories, as proposed by Geldart (1973).
Group A powders show a limited tendency to form bubblesand generally exhibit considerable bed expansion between theminimum fluidization velocity Vmf, and the minimum bubblingvelocity Vmb. These powders also retain aeration and thefluidized bed collapses very slowly when the gas is turned off.
Group B materials fluidize readily and tend to form bubbles,which grow rapidly by coalescence. However, bed expansionis small. That is, the minimum bubbling velocity, Vmb, usuallyis approximately equal to (or only slightly greater than) theminimum fluidizing velocity Vmf. The fluidized bed does notretain its aeration and collapses quickly when the gas supply isremoved.
Group C powders are of small particle size, cohesive bynature and hence, difficult to fluidize. Either the fluidized bedlifts as a solid plug of material or forms stable channels of airflow, which allows the fluidizing gas to escape. The latterphenomenon is referred to simply as “channelling”. It may bepossible to fluidize such powders by mechanical agitation(e.g., stirring, vibration).
Group D products generally are of large particle size and/orvery high solids particle density. In some respects, fluidizationbehavior is similar to Group B, although higher gas velocitiesare required for fluidization.
Note the “mean diameter” used by Geldart (1973) is actually asurface volume mean diameter dsvm, based on Eq. (3). However, com-paring the fluidization curves of several materials with the Geldart (1973)diagram (e.g., fly ash, pulverized coal, coarse ash, PVC powder andscreened coke), Wypych (1989b) found the following:
Long Distance Pneumatic Transport and Pipe Branching 721
11-Oct-2001 JMR
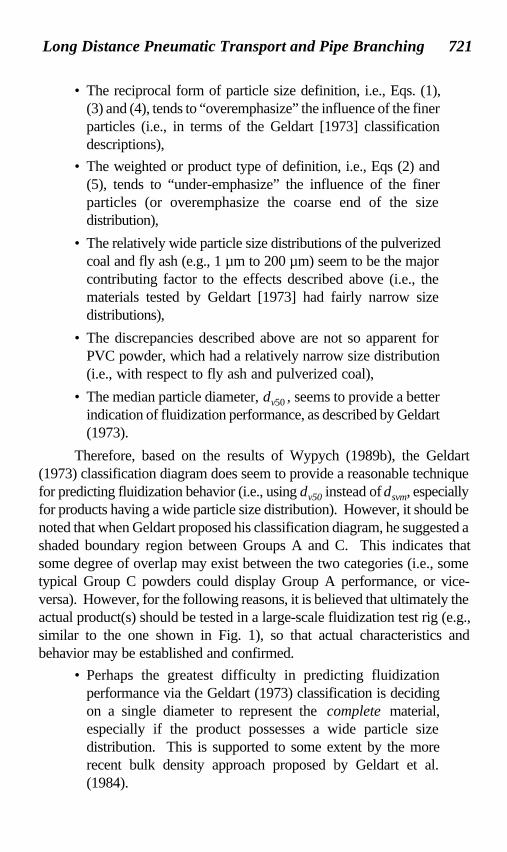
• The reciprocal form of particle size definition, i.e., Eqs. (1),(3) and (4), tends to “overemphasize” the influence of the finerparticles (i.e., in terms of the Geldart [1973] classificationdescriptions),
• The weighted or product type of definition, i.e., Eqs (2) and(5), tends to “under-emphasize” the influence of the finerparticles (or overemphasize the coarse end of the sizedistribution),
• The relatively wide particle size distributions of the pulverizedcoal and fly ash (e.g., 1 µm to 200 µm) seem to be the majorcontributing factor to the effects described above (i.e., thematerials tested by Geldart [1973] had fairly narrow sizedistributions),
• The discrepancies described above are not so apparent forPVC powder, which had a relatively narrow size distribution(i.e., with respect to fly ash and pulverized coal),
• The median particle diameter, dv50 , seems to provide a betterindication of fluidization performance, as described by Geldart(1973).
Therefore, based on the results of Wypych (1989b), the Geldart(1973) classification diagram does seem to provide a reasonable techniquefor predicting fluidization behavior (i.e., using dv50 instead of dsvm, especiallyfor products having a wide particle size distribution). However, it should benoted that when Geldart proposed his classification diagram, he suggested ashaded boundary region between Groups A and C. This indicates thatsome degree of overlap may exist between the two categories (i.e., sometypical Group C powders could display Group A performance, or vice-versa). However, for the following reasons, it is believed that ultimately theactual product(s) should be tested in a large-scale fluidization test rig (e.g.,similar to the one shown in Fig. 1), so that actual characteristics andbehavior may be established and confirmed.
• Perhaps the greatest difficulty in predicting fluidizationperformance via the Geldart (1973) classification is decidingon a single diameter to represent the complete material,especially if the product possesses a wide particle sizedistribution. This is supported to some extent by the morerecent bulk density approach proposed by Geldart et al.(1984).
722 Fluidization, Solids Handling, and Processing
11-Oct-2001 JMR
• There is some doubt over the location of the boundaryseparating Groups A and C. The particle size versus densityrelationship proposed by Geldart (1973) may not be sufficientto define these regions. For example, refer to Geldart et al.(1984).
• Products lying close to a particular boundary may exhibitfluidization behavior from either one of the adjoining categories(e.g., a product which is in close proximity of the A-Bboundary may exhibit characteristics from either Group A orB). It is difficult to estimate the “error” or “tolerance”associated with each boundary (e.g., between Groups A andB, or B and D).
Appreciating the possible limitations of the Geldart (1973) classifica-tion diagram, this technique still provides a good initial indication of what toexpect when a given product is fluidized or mixed with air. Even thoughfluidization may be confirmed by experiment and used subsequently in thedesign of feeders (e.g., to establish possible rat-holing problems inside ablow tank, Wypych and Arnold, 1986a), the application of such informationto predicting pneumatic conveying performance is a different matter and infact, has been found to be inadequate (Wypych and Arnold, 1986b;Lohrmann and Marcus, 1984).
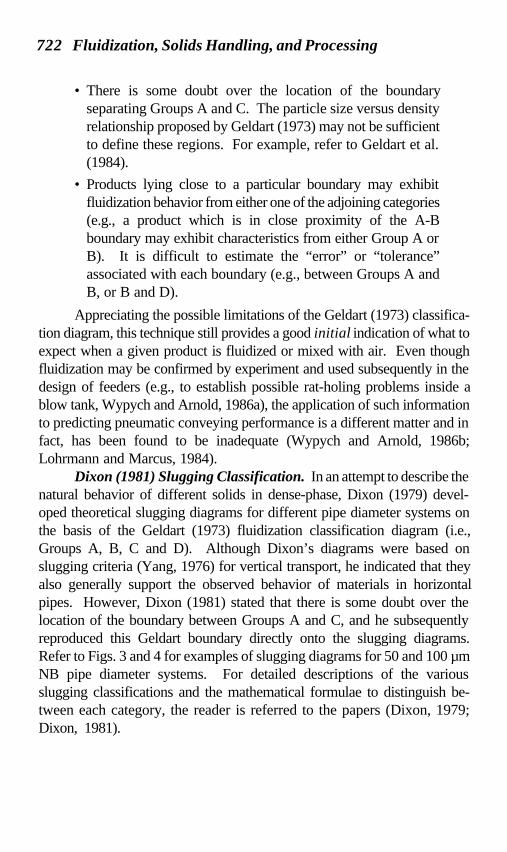
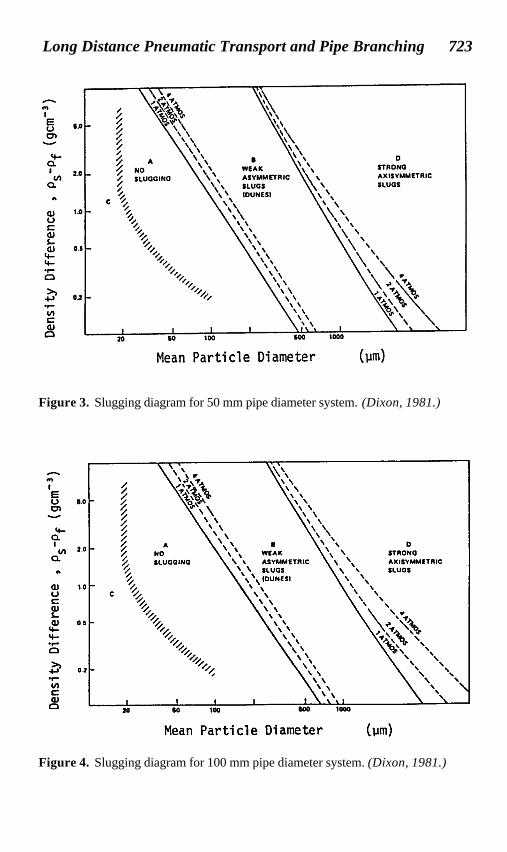
Dixon (1981) Slugging Classification. In an attempt to describe thenatural behavior of different solids in dense-phase, Dixon (1979) devel-oped theoretical slugging diagrams for different pipe diameter systems onthe basis of the Geldart (1973) fluidization classification diagram (i.e.,Groups A, B, C and D). Although Dixon’s diagrams were based onslugging criteria (Yang, 1976) for vertical transport, he indicated that theyalso generally support the observed behavior of materials in horizontalpipes. However, Dixon (1981) stated that there is some doubt over thelocation of the boundary between Groups A and C, and he subsequentlyreproduced this Geldart boundary directly onto the slugging diagrams.Refer to Figs. 3 and 4 for examples of slugging diagrams for 50 and 100 µmNB pipe diameter systems. For detailed descriptions of the variousslugging classifications and the mathematical formulae to distinguish be-tween each category, the reader is referred to the papers (Dixon, 1979;Dixon, 1981).
Long Distance Pneumatic Transport and Pipe Branching 723
11-Oct-2001 JMR
Figure 4. Slugging diagram for 100 mm pipe diameter system. (Dixon, 1981.)
Figure 3. Slugging diagram for 50 mm pipe diameter system. (Dixon, 1981.)
724 Fluidization, Solids Handling, and Processing
11-Oct-2001 JMR
A brief description of each of the four “slugging” categories, assuggested by Dixon (1979) is listed below.
Group A powders are the best candidates for dense-phaseconveying and can achieve high solids/gas loadings. Note the“dense-phase” referred to here actually is “fluidized dense-phase” (Wypych, 1995a).
Group B powders can be troublesome (e.g., severe pipevibrations) if high solids/gas loadings are contemplated.
Group C products arguably are the worst candidates for(fluidized) dense-phase conveying. This can be attributed totheir poor fluidization characteristics. If these can be overcome,and it is possible that not all Geldart (1973) Group C powderspossess poor fluidizing characteristics, then they should showthe good performances attributable to Group A powders.
Group D materials are also good candidates for dense-phaseconveying. Although they have relatively low solids/gas ratios(i.e., compared with Group A powders), they probably can beconveyed at higher loadings than Group B materials. Notethe “dense-phase” referred to here actually is “low-velocityslug-flow” (Wypych, 1995a).
The following comments are based on the findings of Wypych (1989b)who compared the actual conveying characteristics of several materialswith the slugging classifications of Dixon (1979) and Dixon (1981).
• For a product that is well contained “inside” a particular group(i.e., A, B, C or D), the Dixon (1981) slugging diagram andclassifications generally provide a good initial indication ofwhat to expect when the product is conveyed in the dense-phase mode.
• It is believed that the one main factor that will “upset” thesuggestions of Dixon (1979, 1981) is particle size distribution.Note that a similar problem was described earlier for theGeldart (1973) diagram. Also, it is quite possible thatdifferences in “particle shape” could contribute to this effect.For example, Dixon (1979, 1981) based most of his suggestionsand observations on plastic powders and granules (i.e.,relatively smooth particles with narrow size ranges).
Long Distance Pneumatic Transport and Pipe Branching 725
11-Oct-2001 JMR
• Materials that lie close to or are on a classification boundarymay exhibit slugging behavior from either one of the adjoiningcategories. This could be explained further by the “particlesize distribution” problem or limitation described above.
• The “particle to pipe diameter” ratio may be an influentialparameter in predicting dense-phase performance. Forexample, this diameter effect was noticed recently when thegood dense-phase (low-velocity slug-flow) performance of agranulated sugar in a 105 mm diameter pipeline could not berepeated in a 155 mm diameter pipeline. The shift to the“right” of the Group B-D boundary (i.e., as seen in Figs 3 and4) with increasing pipe diameter would explain this differencein performance.
• The change in slugging characteristics of a given material dueto increasing or decreasing operating pressure is difficult toconfirm.
To emphasize some of the above comments and suggestions (as wellas some of those presented earlier in relation to the Geldart [1973] diagram),the PVC powder results (Wypych, 1989b) are summarized below.
• PVC powder: dv50 ≈ 152 µm, ρs = 1400 kg m-3, ρbl = 575 kg m-3
• According to the fluidization diagram presented in Fig. 2,PVC powder was found to be classified as Geldart (1973)Group A (although close to the A-B boundary). Testing theproduct in a fluidization rig (Wypych, 1989b) confirmed thegood fluidization characteristics suggested by Geldart (1973).This result was supported by the material’s excellent air-gravity conveying performance (Wypych and Arnold, 1985a).Based on these results, it would be reasonable to assume thatthis material would be suited to fluidized dense-phase.
• However, the PVC powder was tested in a 52 mm internaldiameter pipeline, 71 m in length, and found to exhibit unstableplugging in the vicinity of saltation or minimum pressure (i.e.,prior to the fluidized dense-phase region). That is, dilute-phase transport was only possible on this test rig. Also,solids/gas loadings were quite low (e.g., max m* ≈ 20). Notethat the unstable plugging was accompanied by suddenincreases in pressure and severe pipe vibrations.
726 Fluidization, Solids Handling, and Processing
11-Oct-2001 JMR
• These unexpected results were confirmed by the Group Bclassification of Dixon (1979, 1981), (i.e., could be troublesomein dense-phase and produce severe pipe vibrations).
The above results demonstrate the danger of predicting the suitabilityof dense-phase based on only fluidization characteristics. Similar limita-tions have been observed by Lohrmann and Marcus (1984) with threeGeldart (1973) Group A materials. In contrast, the Group B suggestions ofDixon (1979, 1981) not only confirm the observed minimum transportbehavior (e.g., pipe vibrations, require high velocities), but also seem toexplain the observed (Wypych, 1989b) flow behavior (i.e., dunes growingto fill the pipe causing the high velocity slugs of air to force their waythrough the material).
The apparent anomaly between poor dense-phase performance andgood fluidization characteristics (as suggested by the PVC powder results)seems to be explained by the property of deaeration. That is, although thismaterial displayed good fluidization characteristics and is classified asGeldart (1973) Group A, it was found to deaerate quickly. For example, onseveral occasions the expanded bubbling bed was seen (Wypych, 1989b) tolose its height in less than one second (i.e., after the fluidizing air wasremoved). On the other hand, “good” dense-phase materials, such aspulverized coal and fly ash, usually display excellent fluidization character-istics but also retain their aeration for considerable lengths of time (e.g., 10to 30 minutes).
Mainwaring & Reed (1987) Classification Diagrams. The em-pirical classification technique proposed by Mainwaring and Reed, 1987,emphasizes the importance of permeability (obtained from a fluidizationtest) and deaeration. Jones and Mills, 1989 came to a similar conclusionand suggested further that the ratio of tapped to poured bulk densityprovides a good indication of the air retentive properties of a given material.Also, Geldart et al., 1984 proposed a similar ratio to distinguish betweenGroup A and Group C powders.
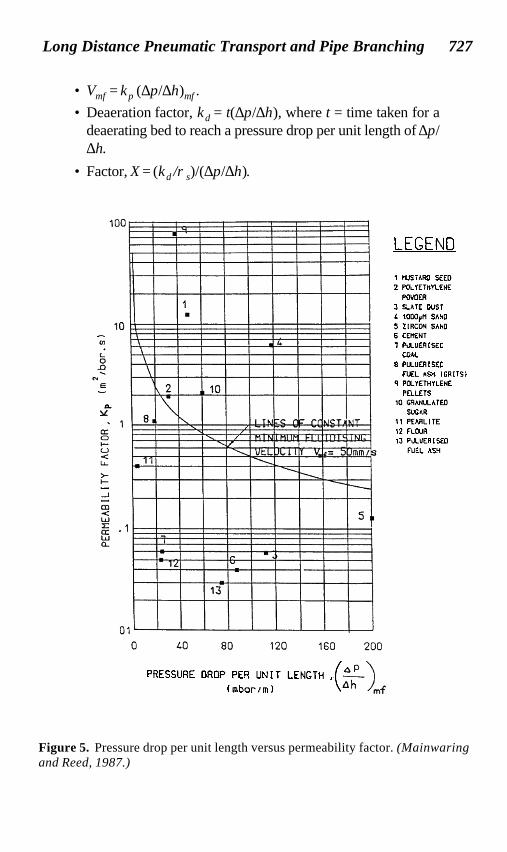
The classification technique (Mainwaring and Reed, 1987) basicallyconsists of two empirically-based diagrams, as shown in Figs. 5 and 6. Touse these graphs, the following factors need to be determined.
• Pressure drop per unit length of bed, ∆p/∆h, see Fig. 1.
• Value of ∆p/∆h at minimum fluidization, (∆p/∆h)mf , see Fig. 1.
• Permeability factor, κp = A/B = Vf /(∆p/∆h), Fig. 1.
Long Distance Pneumatic Transport and Pipe Branching 727
11-Oct-2001 JMR
• Vmf = κp (∆p/∆h)mf .• Deaeration factor, κd = t(∆p/∆h), where t = time taken for a
deaerating bed to reach a pressure drop per unit length of ∆p/∆h.
• Factor, X = (κd /ρs)/(∆p/∆h).
Figure 5. Pressure drop per unit length versus permeability factor. (Mainwaringand Reed, 1987.)
LEGEND
1 tIUSTARO SEEO
2 POLYETHYLENE
PO\10ER
3 SLATE OUST
, 100°I'M SANO
S ZIRCON SANO
6 CEMENT
, PlA.UER!SEO
COAL
8 PlA.UERISEO
FUEL ASH (GRITS)
q POLYETHYLENE
PELLETS
10 GRANULATEO
SUGAR
11 PEARLITE
12 f"LOUR
13 PULUERISEO
f"UEL ASH
PRESSURE DRDP PER UNIT LENGTH ,
728 Fluidization, Solids Handling, and Processing
11-Oct-2001 JMR
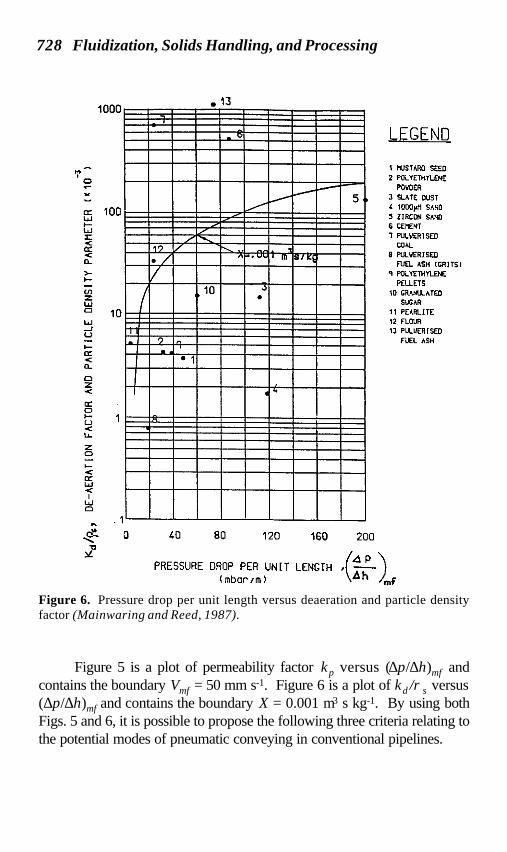
Figure 5 is a plot of permeability factor κp versus (∆p/∆h)mf andcontains the boundary Vmf = 50 mm s-1. Figure 6 is a plot of κd /ρs versus(∆p/∆h)mf and contains the boundary X = 0.001 m3 s kg-1. By using bothFigs. 5 and 6, it is possible to propose the following three criteria relating tothe potential modes of pneumatic conveying in conventional pipelines.
Figure 6. Pressure drop per unit length versus deaeration and particle densityfactor (Mainwaring and Reed, 1987).
.13
LEGEND
I tIUSTARO SEEO
2 POLYETHYLENE
PO\lOER
3 SLATE OUST
, 1000,.t1 SANO
~ ZIRCON SAHO
6 CEMENT
1 PULUERISEO
COAL
8 PULUERlSEO
FUEL ASH (GRITS)
'! POLYETHYLENE
PELLETS
10 GRANULATEO
SUGAR
11 PEARLITE
'2 FLOUR
13 PULUERISEO
FUEL ASH
...'0
-..
a: 100L.Jt-L.J~<a:<0..
>-t-
InzL.J0 10L.J..Ju
t-a:<0..
0Z<
a:0t-u<l1o
Z0
t-<a:L.J<I
L.J0
"'~
,
~-o
0 40 80 120 160 200
PRESSURE DROP PER UNIT LENGTH ,( ~ )(mbor/m) mf
Long Distance Pneumatic Transport and Pipe Branching 729
11-Oct-2001 JMR
• If for a given material, Vmf > 50 mm s-1 (i.e., above theboundary shown in Fig. 5) and X < 0.001 m3 s kg-1 (i.e., belowthe boundary shown in Fig. 6), then dense-phase low-velocityslug-flow (Wypych, 1995a) is possible (e.g., mustard seed,polyethylene powder, 1000 µm sand, polyethylene pellets andgranulated sugar). Note that dilute-phase also is possible.
• If Vmf < 50 mm s-1 and X > 0.001 m3 s kg-1, then fluidizeddense-phase (Wypych, 1995a) is possible (e.g., cement,pulverized coal, flour, fly ash). Note that dilute-phase also ispossible.
• If Vmf < 50 mm s-1 and X < 0.001 m3 s kg-1, then “fluidized”dense-phase or low-velocity slugging flow is not possible in aconventional pipeline (e.g., slate dust, zircon sand, fly ashgrits). That is, single-slug conveying (Wypych, 1995a),bypass conveying (Wypych, 1995a) or dilute-phase may haveto be considered for these materials.
Application to Long-Distance Pneumatic Conveying. From theabove three classifications, there is sufficient evidence to suggest thatpowder classification (i.e., to select ultimately the most suitable mode ofconveying for a given product and its behavioral properties) depends on thefollowing properties:
• Particle size distribution and density.
• Particle shape or sphericity (as indicated by the definitions ofdiameter).
• Deaeration and permeability.
• The ratio of tapped to poured (or perhaps fluidized) bulkdensity.
• Diameter of conveying pipeline or particle to pipe diameterratio.
Also, it seems that most of these properties are interdependent. Forexample, deaeration and permeability (Mainwaring and Reed, 1987) andperhaps the bulk density ratio (Jones and Mills, 1989) seem to provide anadequate mechanism to detect changes in material performance due todifferent particle size distribution, density and/or shape. However, possiblythe greatest disadvantage or limitation of these empirical techniques is theneed to standardize the experimental apparatus and techniques. For exam-
730 Fluidization, Solids Handling, and Processing
11-Oct-2001 JMR
ple, the measured values of deaeration rate depend on the size of theplenum chamber and to some extent the type of gas distributor. Also,different devices and techniques are available to determine vibrated ortapped bulk density. Standardization is necessary so that the results will beapplicable on an international level and can be used/compared by otherresearchers.
Based on the previous classifications and discussions, as well as theauthor’s own experiences, it is suggested that the following design proce-dure and considerations be adopted to provide an initial indication of dense-phase suitability, which as described below also has been found useful inassessing conveying performance over long distances.
• For a given bulk solid, determine particle size distribution,median particle diameter dv50 (e.g., using a Coulter Counter ora Malvern Laser Diffraction Analyser) and ρs.
• Classify the bulk solid according to the Geldart (1973)fluidization diagram. This information is useful in estimatingsay, potential rat-holing problems inside blow tanks. If thematerial is relatively close to a classification boundary, thenexpect fluidization behavior from either one of the adjoininggroups.
• Test the bulk solid in a fluidization chamber to confirm boththe Geldart (1973) classification and the material’s air retentionproperties (i.e., by undertaking deaeration experiments).
• Classify the bulk solid according to the Dixon (1979, 1981)slugging diagram that matches the existing or proposed diameterof pipeline. Based on the research and consulting experienceof the author, the following possibilities are proposed in relationto the Dixon (1979) classifications.
— Typical Group A materials (e.g., cement, baghousefly ash, pulverized coal, carbon fines) are the bestcandidates for “fluidized“ dense-phase (Wypych,1995a) and long-distance pneumatic conveying. Itis possible to achieve high values of solids/gas loading(e.g., m* = 150 over 200 m; m* = 25 over 1 km).These materials retain their aeration for considerablelengths of time.
Long Distance Pneumatic Transport and Pipe Branching 731
11-Oct-2001 JMR
— Typical Group B materials (e.g., alumina, PVCpowder, fine sand, castor sugar) may cause seriousproblems in fluidized dense-phase (e.g., unstableplugging, severe pipe vibrations, high pressures) andhence, may need to be transported in dilute-phaseover long distances (i.e., using conventionalpipelines). It still may be possible to convey thesematerials in “dense-phase” using low-velocity slug-flow or bypass pipelines (Wypych, 1995a). Also,for the coarser Group B materials (e.g., fine sand,castor sugar), it may be possible to consider thealternative of single-slug dense-phase conveying(Wypych, 1995a). Of these three options, bypassconveying is preferred when long distances areinvolved, especially when L > 500 m.
— Typical Group C materials (e.g., precipitator flyash, lead fume, zinc dust) may behave like Group Apowders (i.e., good fluidized dense-phase or long-distance performance). However, these materialscan be quite cohesive and it is important to ensurebuildup problems do not occur inside the blow tankfeeder or along the pipeline. For example, precipitatorfly ash with dv50 ≈ 10 µm has been conveyedsuccessfully and efficiently over long distances,whereas lead fume with dv50 ≈ 5 µm has been foundto cause buildup and eventual blockage problemsinside the pipeline. Flexible hoses or “collapsible”pipelines may be used to prevent this buildup ofmaterial. Another option is to consider low-velocityplugging using either an air-knife at the beginning ofthe pipeline or a bypass conveying pipeline. In somecases, the plugs tend to be “self-cleaning”. However,these options do not become practical over longdistances and must be considered carefully in termsof capital and maintenance costs.
— Many typical Group D products (e.g., wheat, rice,sugar, plastic pellets, cereals, barley, malt,agglomerated milk powder) have relatively narrow
732 Fluidization, Solids Handling, and Processing
11-Oct-2001 JMR
size distributions, high permeability and displaynatural slugging ability (Wypych and Hauser, 1990)and good low-velocity slug-flow (Wypych, 1995a).However, this mode of flow usually is limited toconveying distances of L < 500 m. The Group Dmaterials that possess wide size distributions(especially a considerable amount of fines) and/orunusual particle shape (e.g., crushed coal, petroleumcoke, crushed bath, rice hulls) usually are not suitedto low-velocity conveying. In these cases, theoptions are dilute-phase or single-slug dense-phase(i.e., these materials usually are too coarse for bypassconveying). However, when long distances areinvolved, dilute-phase may be the only practicaloption.
— If any material is in the vicinity of a classificationboundary (i.e., Group A-B or Group B-D boundary),then due to particle size distribution it is possible thatthe material may exhibit flow behavior or performancefrom either one of the adjoining categories.
Case Study. The above approach was applied recently to investiga-tions into blockage problems occurring on a long-distance pneumatic con-veying system handling baghouse fly ash at a coal-fired power station. Itwas reported by the operator that the blockages
• occurred mainly at the beginning of the pipeline,
• were accompanied by severe pipe vibrations,
• eventually cleared themselves after a period of time.During a site inspection it was found that in between baghouse
cleaning cycles, each blow tank was allowed to be filled with the coarserparticles falling through the dust collection hopper. A sample of materialwas collected directly from a blockage inside the pipeline and also from thereceiving silo which contained the conveyed product. The physical proper-ties of the “successful” (fine) material were found to be dv50 ≈ 15 µm, ρs ≈2200 kg m-3 and ρbl ≈ 900 kg m-3, and for the “troublesome” (coarse)material dv50 ≈ 100 µm, ρs ≈ 1900 kg m-3 and ρbl ≈ 800 kg m-3. Note aconsiderable amount of unburnt particles was observed in the latter sample
Long Distance Pneumatic Transport and Pipe Branching 733
11-Oct-2001 JMR
and this explained the somewhat lower value of ρs. As a result of applyingthe powder classification techniques (Geldart, 1973; Dixon, 1981) and theother suggestions made in this chapter, it was found that
• the fine ash was classified as a Group C powder—thismaterial was conveyed successfully in fluidized dense-phaseover long distances,
• the coarse ash was classified as a Geldart (1973) Group Amaterial—subsequent fluidization tests confirmed goodfluidization characteristics but poor air retention properties(i.e., the material deaerated quickly as soon as the fluidizingair was removed),
• the coarse ash according to Dixon (1981) was classified asGroup B in a 50 mm NB pipe system and was located on theGroup A-B boundary in a 100 mm NB pipe system (i.e., referto Figs. 3 and 4).
Based on these findings as well as the nature of the blockages, thecoarse ash was considered as a typical Dixon (1981) Group B material (i.e.,troublesome in fluidized dense-phase causing severe pipe vibrations). Itwas recommended to the power station that the baghouse operatingsequence be changed in such a way to ensure the blow tanks were filledonly during the cleaning cycle. This change was made easily via the controlsystem and the plant has been operating successfully since this time.
2.2 Blow Tank Design
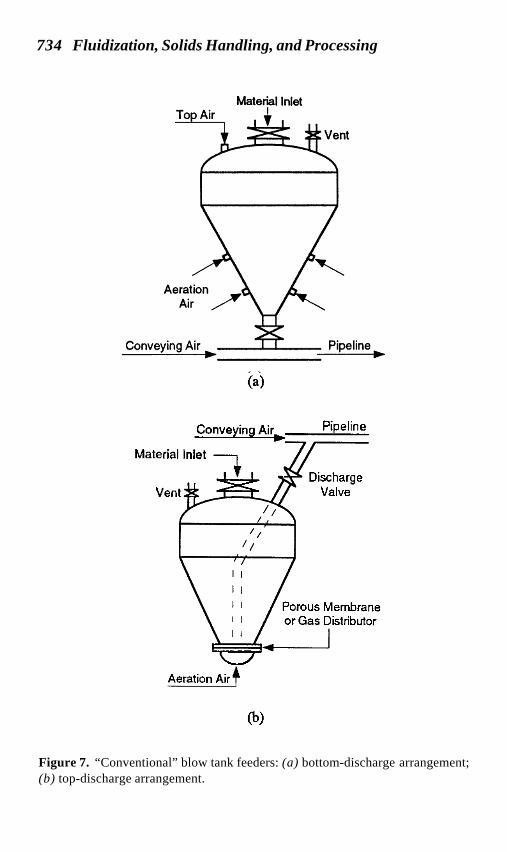
Some typical “conventional” blow tank designs are illustrated in Fig.7. This type of feeder has been used successfully in industry to handle awide range of products over relatively short distances (e.g., L = 100 to 200 m).However, the application of this type of blow tank to greater distances and/or capacities (usually in conjunction with a second blow tank unit in seriesor parallel to ensure an essentially continuous mode of flow) resulted in anumber of problems.
• Incomplete and/or inefficient discharge of material from eachblow tank mainly due to rat-holing or funnel-flow effectspromoted by
— low pressure drop across the bed of material (understeady-state conditions),
734 Fluidization, Solids Handling, and Processing
11-Oct-2001 JMR
(b)
Figure 7. “Conventional” blow tank feeders: (a) bottom-discharge arrangement;(b) top-discharge arrangement.
(a)(a)
Conveying Air.. Pipeline
Material Inlet ~
::8:Discharge
ValveVent :i$:""'
Porous Membraneor Gas Distributor
\ ,.1
Aeration Air+
(b)

Long Distance Pneumatic Transport and Pipe Branching 735
11-Oct-2001 JMR
— cohesive properties of the bulk solid, and/or— inappropriate method of blow tank air injection (e.g.,
single-point injection, excessive top-air promotingmaterial compaction),
• Flow instabilities or even pipeline blockage during start-upprocedures due to surge effects caused by the initial highpressure drop across the blow tank (and hence highinstantaneous flow rate of material),
• Pipeline blockage during shutdown procedures due to surgeeffects caused by the sudden venting of high pressure airdown the pipeline (and hence, acceleration of product towardsthe end of the pipeline).
To avoid these problems, a number of significant developments haveoccurred in the area of blow tank design, such as:
• Method of air injection (Kennedy, et al., 1987), in particularthe fluidizing-discharge-cone (Wypych, 1995a).
• Cone-dosing valve (Cürten, 1982) to control and meter theproduct into the pipeline. This is achieved by the movementof a double cone in the vicinity of the blow tank outlet. Thecone moves continuously up and down inside the vessel butthe stroke is adjusted by a proportional-integral (PI) controllerbased on a conveying line back-pressure measuring signaland set-point. The higher the conveying or operating pressure,the lower the cone set point inside the vessel thus restrictingthe flow of solids into the conveying pipeline (until a satisfactoryconveying pressure is restored). Furthermore, the cone dosingsystem provides an additional and useful feature of mechanicalagitation (and hence, flow assistance) of materials possessingcohesive and/or poor flow properties, such as manganeseoxide (Wypych, 1989a).
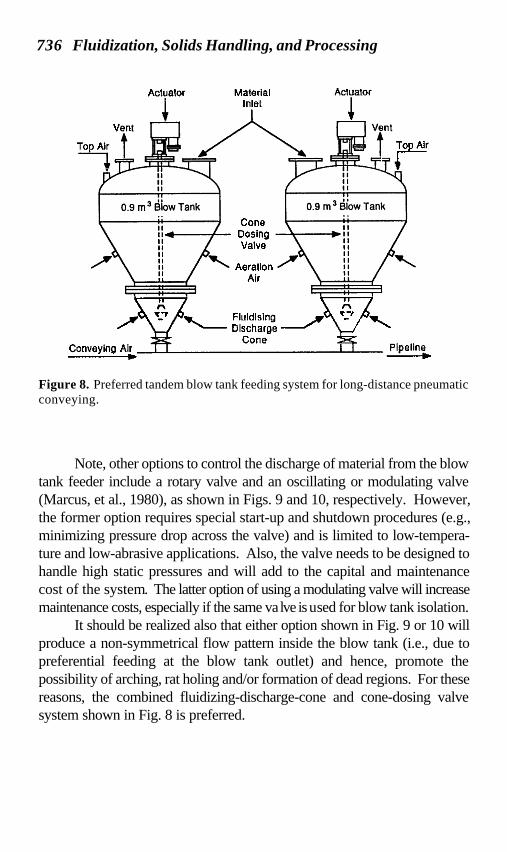
These developments have resulted in a much more reliable andefficient blow tank feeding system, especially for long-distance applica-tions, as shown in Fig. 8. Such systems now have been used successfully inmany installations throughout Australia to meet the increasingly demandingrequirements of conveying capacity and distance.
736 Fluidization, Solids Handling, and Processing
11-Oct-2001 JMR
Figure 8. Preferred tandem blow tank feeding system for long-distance pneumaticconveying.
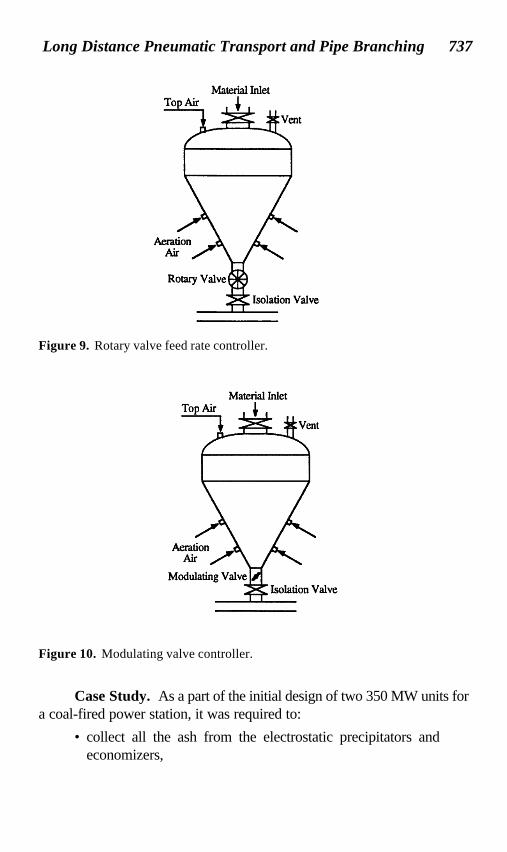
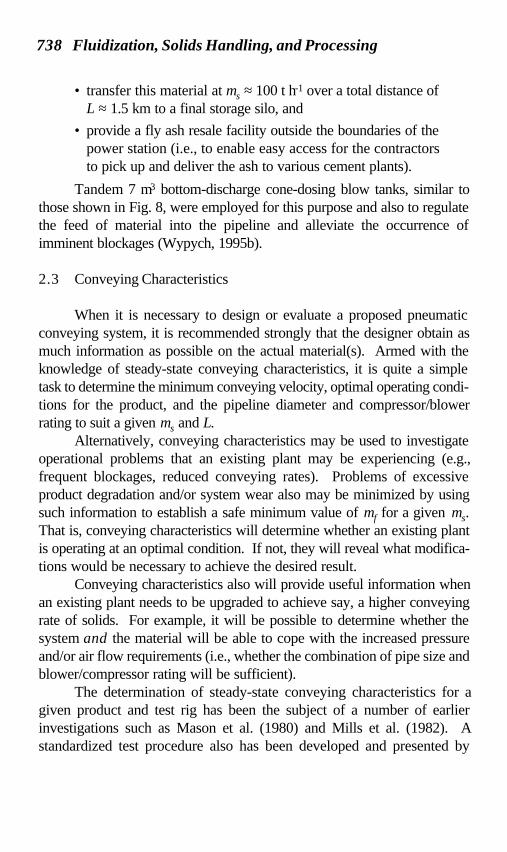
Note, other options to control the discharge of material from the blowtank feeder include a rotary valve and an oscillating or modulating valve(Marcus, et al., 1980), as shown in Figs. 9 and 10, respectively. However,the former option requires special start-up and shutdown procedures (e.g.,minimizing pressure drop across the valve) and is limited to low-tempera-ture and low-abrasive applications. Also, the valve needs to be designed tohandle high static pressures and will add to the capital and maintenancecost of the system. The latter option of using a modulating valve will increasemaintenance costs, especially if the same valve is used for blow tank isolation.
It should be realized also that either option shown in Fig. 9 or 10 willproduce a non-symmetrical flow pattern inside the blow tank (i.e., due topreferential feeding at the blow tank outlet) and hence, promote thepossibility of arching, rat holing and/or formation of dead regions. For thesereasons, the combined fluidizing-discharge-cone and cone-dosing valvesystem shown in Fig. 8 is preferred.
Actuator
J.-
MaterialInlet
Actuator
+ro--o
Vent Vent
Top Air
~
Too Air
-j T.
Cone
DosingValve
AeratIon
Air
...~ ?r ..Fluldlslng / ~ ?, ,/- -"-- Discharge
ConeConveying Air
.Pipeline
Long Distance Pneumatic Transport and Pipe Branching 737
11-Oct-2001 JMR
Case Study. As a part of the initial design of two 350 MW units fora coal-fired power station, it was required to:
• collect all the ash from the electrostatic precipitators andeconomizers,
Figure 9. Rotary valve feed rate controller.
Figure 10. Modulating valve controller.
738 Fluidization, Solids Handling, and Processing
11-Oct-2001 JMR
• transfer this material at ms ≈ 100 t h-1 over a total distance ofL ≈ 1.5 km to a final storage silo, and
• provide a fly ash resale facility outside the boundaries of thepower station (i.e., to enable easy access for the contractorsto pick up and deliver the ash to various cement plants).
Tandem 7 m3 bottom-discharge cone-dosing blow tanks, similar tothose shown in Fig. 8, were employed for this purpose and also to regulatethe feed of material into the pipeline and alleviate the occurrence ofimminent blockages (Wypych, 1995b).
2.3 Conveying Characteristics
When it is necessary to design or evaluate a proposed pneumaticconveying system, it is recommended strongly that the designer obtain asmuch information as possible on the actual material(s). Armed with theknowledge of steady-state conveying characteristics, it is quite a simpletask to determine the minimum conveying velocity, optimal operating condi-tions for the product, and the pipeline diameter and compressor/blowerrating to suit a given ms and L.
Alternatively, conveying characteristics may be used to investigateoperational problems that an existing plant may be experiencing (e.g.,frequent blockages, reduced conveying rates). Problems of excessiveproduct degradation and/or system wear also may be minimized by usingsuch information to establish a safe minimum value of mf for a given ms.That is, conveying characteristics will determine whether an existing plantis operating at an optimal condition. If not, they will reveal what modifica-tions would be necessary to achieve the desired result.
Conveying characteristics also will provide useful information whenan existing plant needs to be upgraded to achieve say, a higher conveyingrate of solids. For example, it will be possible to determine whether thesystem and the material will be able to cope with the increased pressureand/or air flow requirements (i.e., whether the combination of pipe size andblower/compressor rating will be sufficient).
The determination of steady-state conveying characteristics for agiven product and test rig has been the subject of a number of earlierinvestigations such as Mason et al. (1980) and Mills et al. (1982). Astandardized test procedure also has been developed and presented by
Long Distance Pneumatic Transport and Pipe Branching 739
11-Oct-2001 JMR
Wypych and Arnold (1985b) and hence, only a brief description is present-ed here. The test procedure basically consists of three different types ofexperiments which are applied to the material until sufficient data havebeen collected for the determination of conveying characteristics. Thesteady-state parameters generated specifically for this purpose are
• mf = Supplied mass flow rate of air (kg s-1),
• ∆pt = Total pipeline air pressure drop (kPa),
• ms = Mass flow rate of solids or conveying rate (kg s-1 ort h-1).
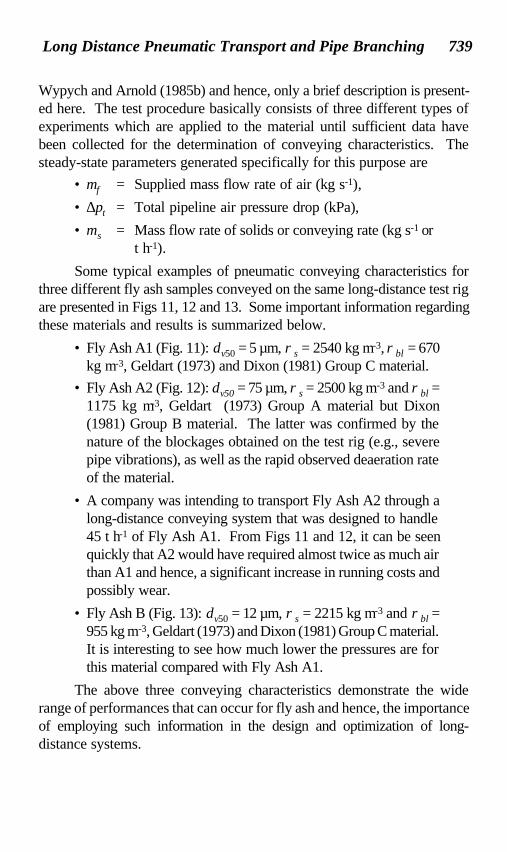
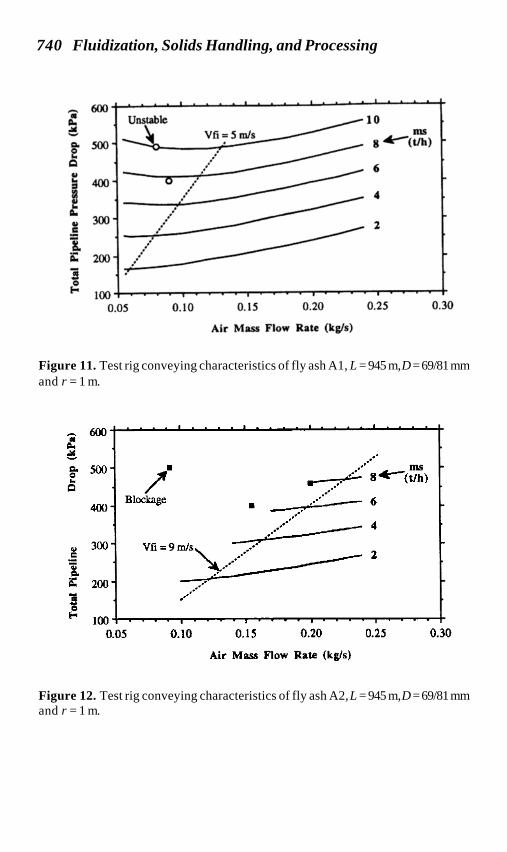
Some typical examples of pneumatic conveying characteristics forthree different fly ash samples conveyed on the same long-distance test rigare presented in Figs 11, 12 and 13. Some important information regardingthese materials and results is summarized below.
• Fly Ash A1 (Fig. 11): dv50 = 5 µm, ρs = 2540 kg m-3, ρbl = 670kg m-3, Geldart (1973) and Dixon (1981) Group C material.
• Fly Ash A2 (Fig. 12): dv50 = 75 µm, ρs = 2500 kg m-3 and ρbl =1175 kg m-3, Geldart (1973) Group A material but Dixon(1981) Group B material. The latter was confirmed by thenature of the blockages obtained on the test rig (e.g., severepipe vibrations), as well as the rapid observed deaeration rateof the material.
• A company was intending to transport Fly Ash A2 through along-distance conveying system that was designed to handle45 t h-1 of Fly Ash A1. From Figs 11 and 12, it can be seenquickly that A2 would have required almost twice as much airthan A1 and hence, a significant increase in running costs andpossibly wear.
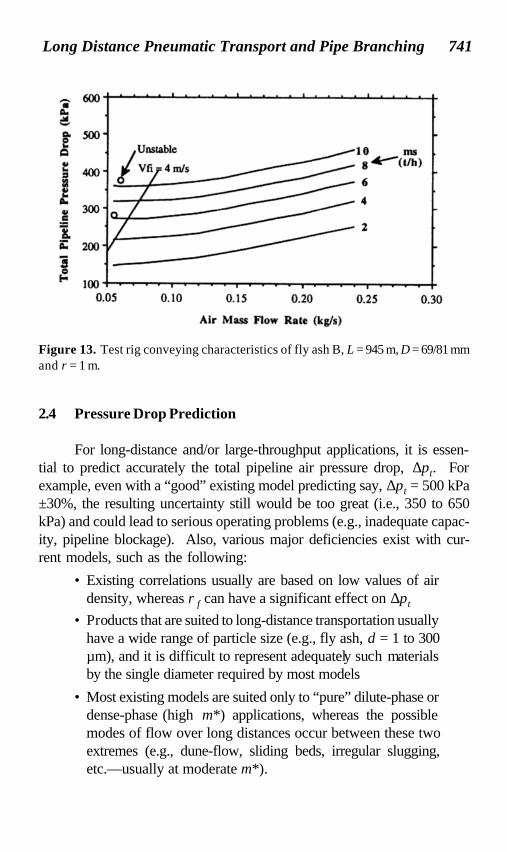
• Fly Ash B (Fig. 13): dv50 = 12 µm, ρs = 2215 kg m-3 and ρbl =955 kg m-3, Geldart (1973) and Dixon (1981) Group C material.It is interesting to see how much lower the pressures are forthis material compared with Fly Ash A1.
The above three conveying characteristics demonstrate the widerange of performances that can occur for fly ash and hence, the importanceof employing such information in the design and optimization of long-distance systems.
740 Fluidization, Solids Handling, and Processing
11-Oct-2001 JMR
Figure 11. Test rig conveying characteristics of fly ash A1, L = 945 m, D = 69/81 mmand r = 1 m.
Figure 12. Test rig conveying characteristics of fly ash A2, L = 945 m, D = 69/81 mmand r = 1 m.
-..600.~~
g. 500..
Q
.
/'
Blockage400
..... ms..
~ 8.4;-(t/h)..
..
-~6.--:..-=---
...
4f ~
Vfi=9m1s, 2
~ ~
..
..
..300.5"GiQ.A: 200
-;..0
~ 100 I I I 0.05 0.10 0.15 0.20 0.25 0.30
Air Mass Flow Rate (kg/s)
Long Distance Pneumatic Transport and Pipe Branching 741
11-Oct-2001 JMR
2.4 Pressure Drop Prediction
For long-distance and/or large-throughput applications, it is essen-tial to predict accurately the total pipeline air pressure drop, ∆pt. Forexample, even with a “good” existing model predicting say, ∆pt = 500 kPa±30%, the resulting uncertainty still would be too great (i.e., 350 to 650kPa) and could lead to serious operating problems (e.g., inadequate capac-ity, pipeline blockage). Also, various major deficiencies exist with cur-rent models, such as the following:
• Existing correlations usually are based on low values of airdensity, whereas ρf can have a significant effect on ∆pt
• Products that are suited to long-distance transportation usuallyhave a wide range of particle size (e.g., fly ash, d = 1 to 300µm), and it is difficult to represent adequately such materialsby the single diameter required by most models
• Most existing models are suited only to “pure” dilute-phase ordense-phase (high m*) applications, whereas the possiblemodes of flow over long distances occur between these twoextremes (e.g., dune-flow, sliding beds, irregular slugging,etc.—usually at moderate m*).
Figure 13. Test rig conveying characteristics of fly ash B, L = 945 m, D = 69/81 mmand r = 1 m.
742 Fluidization, Solids Handling, and Processing
11-Oct-2001 JMR
For these reasons and other complex influences (e.g., large-diameterpipelines, particle-wall friction, particle shape, bends, etc.), it has beenaccepted that if high accuracy is needed, then some form of empiricismmust be adopted. The preferred test-design procedure is listed below.
• Firstly, as described previously, characterize the bulk solid tobe conveyed by undertaking particle size, particle density,loose-poured bulk density, fluidization and deaeration tests.Then classify the material using both the Geldart (1973) andDixon (1981) diagrams to establish possible feeding problemsand dense-phase suitability, which provides an indication oflong-distance performance. For example, based on experience,Dixon (1981) Group A (and some Group C) powders displaygood fluidized dense-phase (Wypych, 1995a), as well as long-distance performance (e.g., high m*).
• Using a standardized test procedure (Wypych and Arnold,1985b), determine test rig conveying characteristics, similar tothose shown previously in Figs. 11–13.
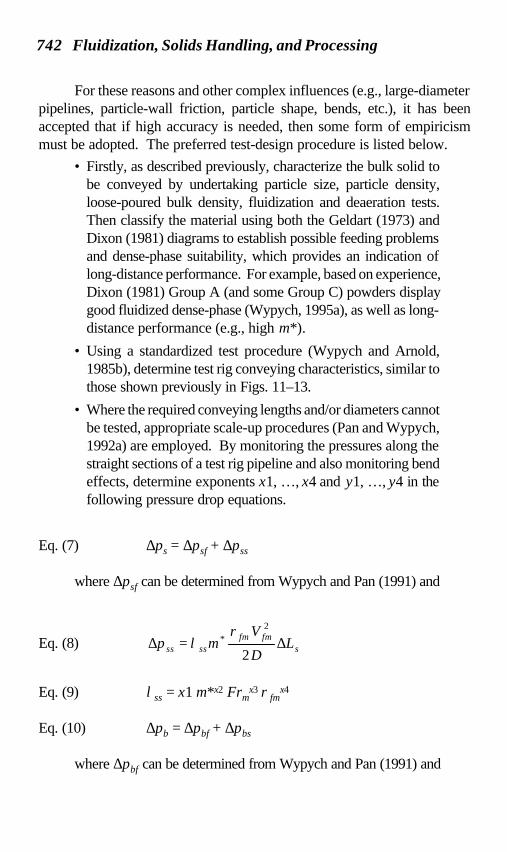
• Where the required conveying lengths and/or diameters cannotbe tested, appropriate scale-up procedures (Pan and Wypych,1992a) are employed. By monitoring the pressures along thestraight sections of a test rig pipeline and also monitoring bendeffects, determine exponents x1, …, x4 and y1, …, y4 in thefollowing pressure drop equations.
Eq. (7) ∆ps = ∆psf + ∆pss
where ∆psf can be determined from Wypych and Pan (1991) and
Eq. (8) sfmfm
ssss LD
Vmp ∆=∆ ∗
2
2ρλ
Eq. (9) λss = x1 m*x2 Frmx3 ρfm
x4
Eq. (10) ∆pb = ∆pbf + ∆pbs
where ∆pbf can be determined from Wypych and Pan (1991) and
Long Distance Pneumatic Transport and Pipe Branching 743
11-Oct-2001 JMR
Eq. (11)2
2fofo
bsbs
Vmp
ρλ ∗=∆
Eq. (12) λbs = y1 m*y2 Froy3 ρfo
y4
Note that the exponents x1, …, x4 and y1, …, y4 are valid only forthe test material and bend geometry, respectively.
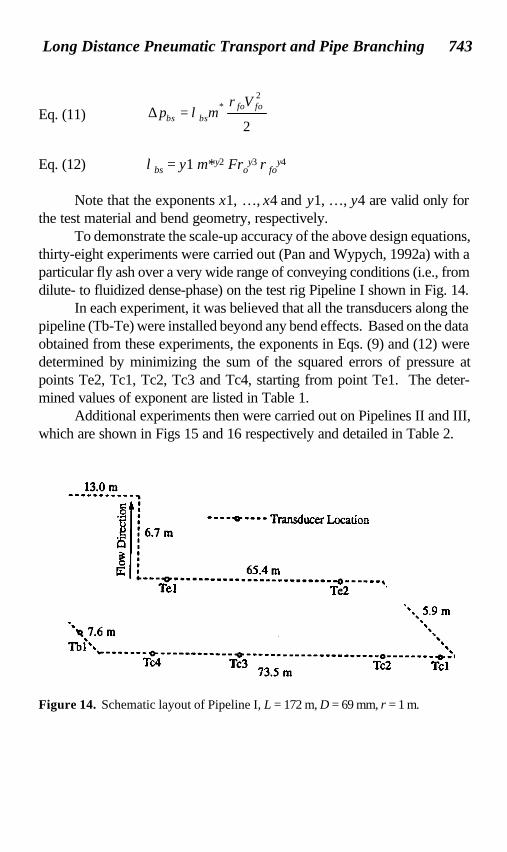
To demonstrate the scale-up accuracy of the above design equations,thirty-eight experiments were carried out (Pan and Wypych, 1992a) with aparticular fly ash over a very wide range of conveying conditions (i.e., fromdilute- to fluidized dense-phase) on the test rig Pipeline I shown in Fig. 14.
In each experiment, it was believed that all the transducers along thepipeline (Tb-Te) were installed beyond any bend effects. Based on the dataobtained from these experiments, the exponents in Eqs. (9) and (12) weredetermined by minimizing the sum of the squared errors of pressure atpoints Te2, Tc1, Tc2, Tc3 and Tc4, starting from point Te1. The deter-mined values of exponent are listed in Table 1.
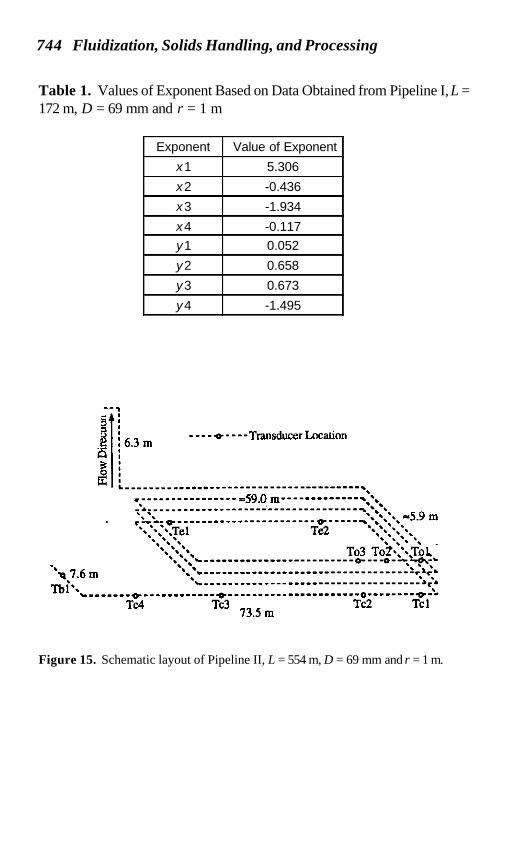
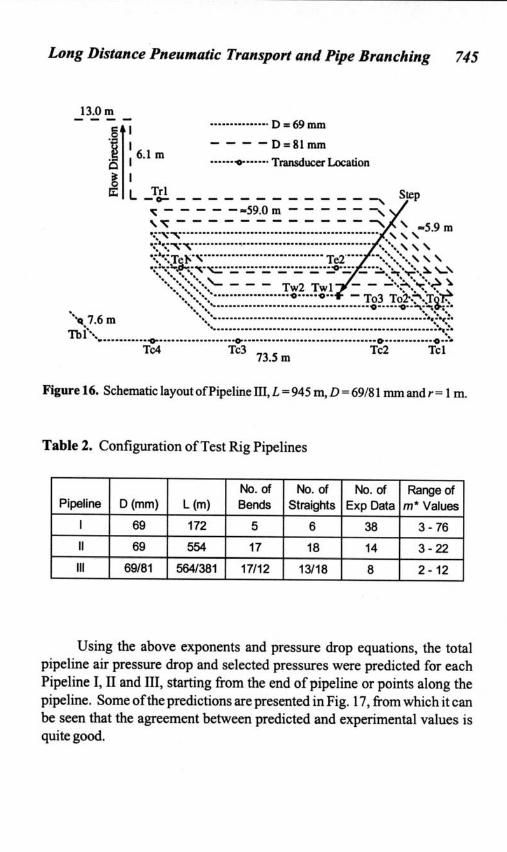
Additional experiments then were carried out on Pipelines II and III,which are shown in Figs 15 and 16 respectively and detailed in Table 2.
Figure 14. Schematic layout of Pipeline I, L = 172 m, D = 69 mm, r = 1 m.
13.0m
C~ ' O I Loca . .
~ : 000 Transducer Uon
: 6.7m.IQ I~ IO I
~ t...000 ~~~~~ 0 Tel Te2 .
."' 5.9 m
',,-0,
~ 7.6 m ", ,
Tbl', "~ ~ ~ ~ 0 ~-,Tc4 Tc3 73.5 m Tc2 Tcl
744 Fluidization, Solids Handling, and Processing
11-Oct-2001 JMR
Figure 15. Schematic layout of Pipeline II, L = 554 m, D = 69 mm and r = 1 m.
Table 1. Values of Exponent Based on Data Obtained from Pipeline I, L =172 m, D = 69 mm and r = 1 m
Exponent Value of Exponent
x1 5.306
x2 -0.436
x3 -1.934
x4 -0.117y1 0.052
y2 0.658
y3 0.673
y4 -1.495
--,-1 1 5 1 = I
9 : '0' Transducer Location16.3m
.IO I~ 1O 1~ :
~ , ,~,- ~59.0 m " "-~ , ' "" ," 59~~ 0 0 ~ ,.', " ~ .m
., ..,, , , Tel T-" , , .J.' = ' , , ,.,' '.,''" ',. ., ..
',. '. " To3 ToZ.,...To1..' ',' 0 0--~-~
, " ...~7.6m " ~ ~~1~~
.' ..Tbl.. '-- ~~..
' 0 '0' 0 '0'..Tc4 Tc3 73.5 m Tc2 Tcl
Long Distance Pneumatic Transport and Pipe Branching 745
13.0 m w--M . . . . . . . . . . . . . . . D = 69 mm
----D=81mm 6.1 m
l% 1’‘a ..-....-......o..-..-.-..........-*..............-..................~............*..-- Tc4 Tc3 73.5 m Tc2 Tel
Trl ‘*‘-““‘-----y f ---- --59.0m - - - - - 7
Figure 16. Schematic layout of Pipeline III, L = 945 m, D = 69/8 1 mm and r = 1 m.
Table 2. Configuration of Test Rig Pipelines
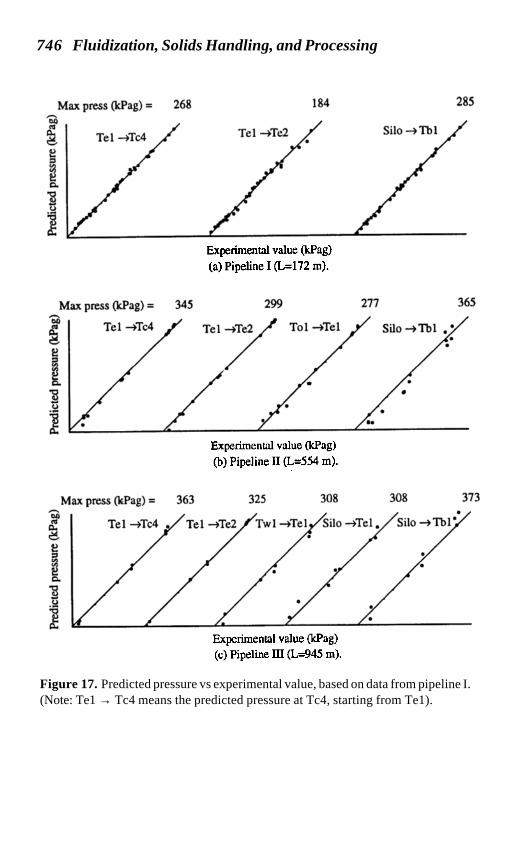
Using the above exponents and pressure drop equations, the total pipeline air pressure drop and selected pressures were predicted for each Pipeline I, II and III, starting from the end of pipeline or points along the pipeline. Some of the predictions are presented in Fig. 17, from which it can be seen that the agreement between predicted and experimental values is quite good.
746 Fluidization, Solids Handling, and Processing
11-Oct-2001 JMR
Figure 17. Predicted pressure vs experimental value, based on data from pipeline I.(Note: Te1 → Tc4 means the predicted pressure at Tc4, starting from Te1).
Experimental value (kpag)
(a) Pipeline I (L=172 m).
Experimental value (kpag)
(b) Pipeline II (L=554 m).
Experimental value (kpag)
(c) Pipeline III (L=945 m).
Long Distance Pneumatic Transport and Pipe Branching 747
11-Oct-2001 JMR
The above test-design and scale-up procedures have been applied tonumerous long-distance systems (e.g., fly ash, pulverized coal) and havebeen found to provide good accuracy and reliability. Some examples ofthese results have been presented by Pan and Wypych (1992a) and Panand Wypych (1994). The interested reader is referred to these papers forfurther details. The above procedures also have been used successfully to
• Predict conveying characteristics for a wide range of pipelineconfigurations (Pan and Wypych, 1994)
• Investigate the effect of bend number and radius on conveyingperformance (Wypych and Pan, 1993)
• Compare the pressure drop caused by horizontal and verticalsections of pipe (Wypych and Pan, 1993)
• Predict the pressure drop of large-throughput cementpneumatic conveying systems (Wypych, 1992)
2.5 Stepped-Diameter Pipelines
It is recognized commonly that
Eq. (13) Erosion ∝ Velocityn
where the power index, n, ranges from 2 for ductile materials to 6 for brittlematerials (Marcus et al., 1990). Hence, one direct way of reducing pipelinewear (e.g., pipe, bends) is to limit the “natural” increase in velocity in thedirection of flow (i.e., due to the expansion of the carrier gas). This can beachieved by increasing the bore of the conveying pipeline in the directionof flow. Other advantages of stepped-diameter pipelines include theminimization of pressure loss, air flow and hence, power consumption,which are particularly important when considering long-distance and/orlarge-throughput applications. By selecting accurate stepping pipe criteriaand models to predict pressure drop (Wypych and Reed, 1990), it ispossible to optimize the design of these pipelines and obtain more efficienttransportation over longer conveying distances (e.g., up to L = 3 or 4 km).
Some examples of long-distance stepped-diameter pipeline systemsinclude 100 t h-1 of fly ash over 1.5 km (Wypych, 1995b) and 24 t h-1 ofpulverized coal over 1.8 km (Wypych et al., 1990). Some of the differentpipeline configurations considered for the latter are repeated in Table 3below. Note:
748 Fluidization, Solids Handling, and Processing
11-Oct-2001 JMR
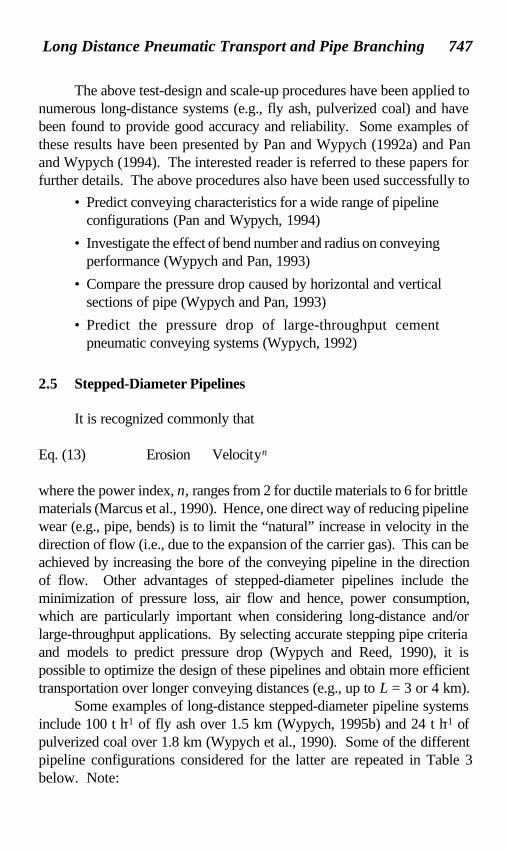
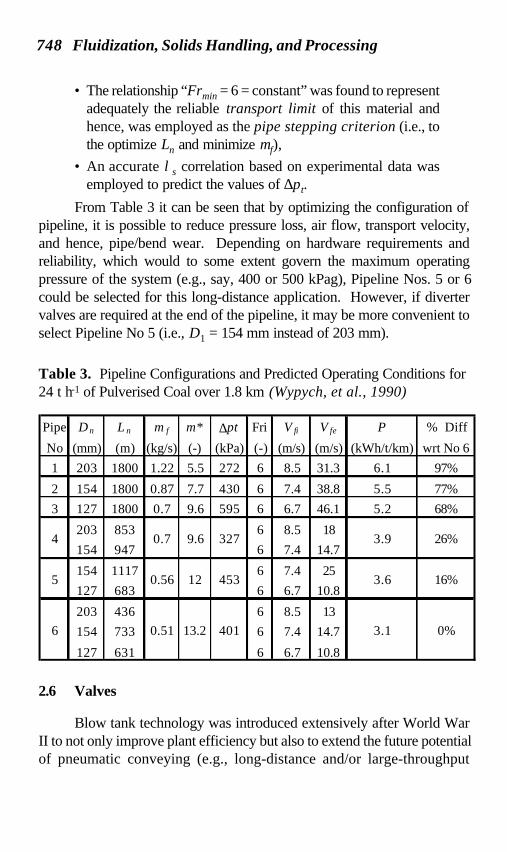
Table 3. Pipeline Configurations and Predicted Operating Conditions for24 t h-1 of Pulverised Coal over 1.8 km (Wypych, et al., 1990)
• The relationship “Frmin = 6 = constant” was found to representadequately the reliable transport limit of this material andhence, was employed as the pipe stepping criterion (i.e., tothe optimize Ln and minimize mf),
• An accurate λs correlation based on experimental data wasemployed to predict the values of ∆pt.
From Table 3 it can be seen that by optimizing the configuration ofpipeline, it is possible to reduce pressure loss, air flow, transport velocity,and hence, pipe/bend wear. Depending on hardware requirements andreliability, which would to some extent govern the maximum operatingpressure of the system (e.g., say, 400 or 500 kPag), Pipeline Nos. 5 or 6could be selected for this long-distance application. However, if divertervalves are required at the end of the pipeline, it may be more convenient toselect Pipeline No 5 (i.e., D1 = 154 mm instead of 203 mm).
2.6 Valves
Blow tank technology was introduced extensively after World WarII to not only improve plant efficiency but also to extend the future potentialof pneumatic conveying (e.g., long-distance and/or large-throughput
Pipe D n L n m f m* ∆pt Fri V fi V fe P % Diff
No (mm) (m) (kg/s) (-) (kPa) (-) (m/s) (m/s) (kWh/t/km) wrt No 61 203 1800 1.22 5.5 272 6 8.5 31.3 6.1 97%
2 154 1800 0.87 7.7 430 6 7.4 38.8 5.5 77%3 127 1800 0.7 9.6 595 6 6.7 46.1 5.2 68%
203 853 6 8.5 18154 947 6 7.4 14.7
154 1117 6 7.4 25127 683 6 6.7 10.8
203 436 6 8.5 13154 733 6 7.4 14.7
127 631 6 6.7 10.8
4
5
6 0.51
0.7
13.2 401 3.1 0%
3.6 16%0.56 12 453
9.6 327 3.9 26%
Long Distance Pneumatic Transport and Pipe Branching 749
11-Oct-2001 JMR
applications). However, the resulting higher operating pressures, togetherwith other factors such as product abrasion and/or high temperatures,resulted in the premature failure of crucial valves (e.g., blow tank inlet,blow tank discharge). A wide range of different “off-the-shelf” valvesfor gas, hydraulic and/or slurry service then were tested (e.g., ball,butterfly, plug and air-on-sleeve pinch valves). Unfortunately, most ofthese were found unsuitable, achieving service lives from only a few hoursto a few days.
Consequently, more elaborate designs had to be tested and/or devel-oped for this application of pneumatic conveying. The following two valveshave been found useful in particular areas. Note that in each case it isimperative to ensure fast actuation time (e.g., 1 second for a 100 mmnominal bore NB valve and a few seconds for a 300 mm NB valve, ifpossible). Large-bore solenoid valves and quick-exhaust valves usually arerequired for this purpose. Also, note that each one of the following valvesprovides a full cross-sectional area of flow in the open position and a 100%seal in the closed position. One of the major problems of air-on-sleevepinch valves is that they do not provide these important features forpneumatic conveying applications (e.g., a small hole in a closed sleevequickly erodes due to the subsequent high velocities of air and solids).
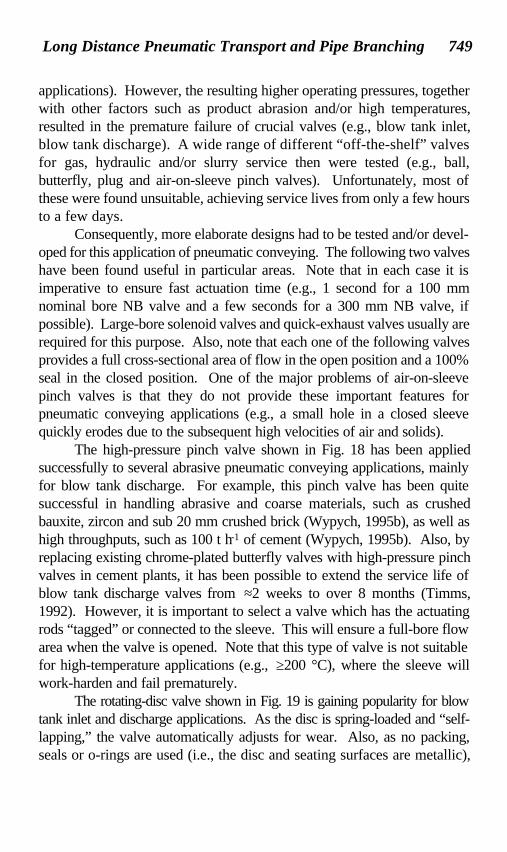
The high-pressure pinch valve shown in Fig. 18 has been appliedsuccessfully to several abrasive pneumatic conveying applications, mainlyfor blow tank discharge. For example, this pinch valve has been quitesuccessful in handling abrasive and coarse materials, such as crushedbauxite, zircon and sub 20 mm crushed brick (Wypych, 1995b), as well ashigh throughputs, such as 100 t h-1 of cement (Wypych, 1995b). Also, byreplacing existing chrome-plated butterfly valves with high-pressure pinchvalves in cement plants, it has been possible to extend the service life ofblow tank discharge valves from ≈2 weeks to over 8 months (Timms,1992). However, it is important to select a valve which has the actuatingrods “tagged” or connected to the sleeve. This will ensure a full-bore flowarea when the valve is opened. Note that this type of valve is not suitablefor high-temperature applications (e.g., ≥200 °C), where the sleeve willwork-harden and fail prematurely.
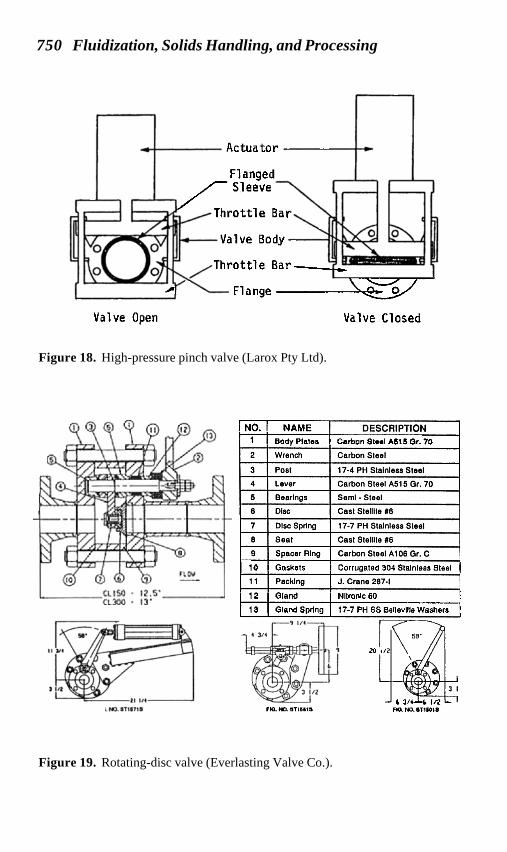
The rotating-disc valve shown in Fig. 19 is gaining popularity for blowtank inlet and discharge applications. As the disc is spring-loaded and “self-lapping,” the valve automatically adjusts for wear. Also, as no packing,seals or o-rings are used (i.e., the disc and seating surfaces are metallic),
750 Fluidization, Solids Handling, and Processing
11-Oct-2001 JMR
Figure 18. High-pressure pinch valve (Larox Pty Ltd).
Figure 19. Rotating-disc valve (Everlasting Valve Co.).
Actuator
Flanged/ Sl eeve
Throttle Bar
Valve Body
1
Valve Open
Throttle Bar-r- ~ '- "" I
Flange '.1i;::9/
Valve Closed
I NO. I NAME DESCRIPTION~ Body Plate. I Carbon Steel A515 Or. 70
Carbon Steel
17-4 PH Stainless Sleel
Carbon Steel A515 Gr. 70
Seml- Steel
Cast Ste111le .6
c wrench 3 Post 4 Lever
5 Bearings
6 Disc
7 I Disc Spring I 17-7 PH Slolnloss Slool
8 I Seat I Cast Stelllle #6
g I Spacer Ring I Carbon Steel A106 Gr. C
I 10 I Gaskets I Corrugated 304 Stainless Steel
r--11'-P8cklng I J. Crane 287-1
Nllronlc 60
17-7 PH SS Bellevllle Washers
20
6 314-'-6 112 '-FIG. 10). IT1..'"FIO.00..T".'.
Long Distance Pneumatic Transport and Pipe Branching 751
11-Oct-2001 JMR
high temperatures and pressures are possible (e.g., up to 900°C and 69000kPag). The rotating-disc valve has been used successfully (Wypych,1995b) as a discharge valve for 7 m3 blow tanks transporting hot andabrasive ash from a power station precipitator at a rate of 100 t h-1 over atotal distance of 1.5 km. These discharge valves have operated continu-ously on a 24-hour basis and achieved a service life of at least 12 months(i.e., without any form of maintenance). However, to ensure that the valvebody does not fill up with ash, purge-air has been used during actuation ofthe valve.
2.7 Pipeline Unblocking Techniques
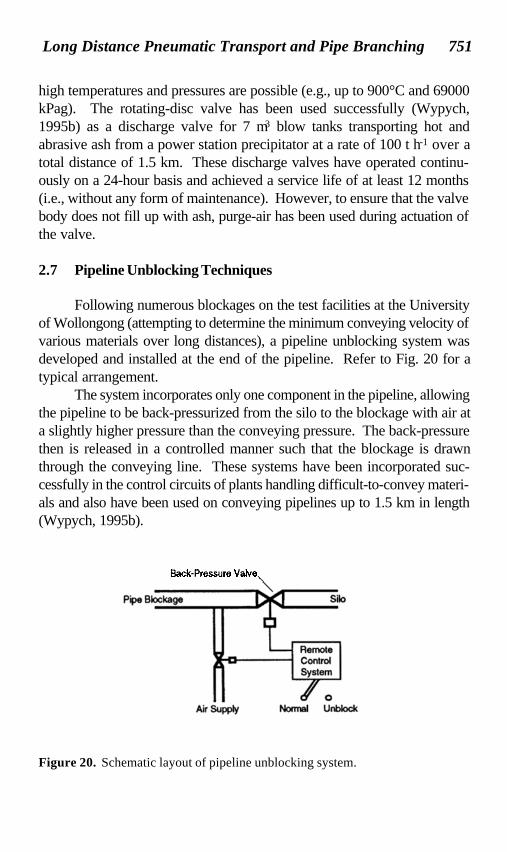
Following numerous blockages on the test facilities at the Universityof Wollongong (attempting to determine the minimum conveying velocity ofvarious materials over long distances), a pipeline unblocking system wasdeveloped and installed at the end of the pipeline. Refer to Fig. 20 for atypical arrangement.
The system incorporates only one component in the pipeline, allowingthe pipeline to be back-pressurized from the silo to the blockage with air ata slightly higher pressure than the conveying pressure. The back-pressurethen is released in a controlled manner such that the blockage is drawnthrough the conveying line. These systems have been incorporated suc-cessfully in the control circuits of plants handling difficult-to-convey materi-als and also have been used on conveying pipelines up to 1.5 km in length(Wypych, 1995b).
Figure 20. Schematic layout of pipeline unblocking system.
Back.Pressure Valve"
752 Fluidization, Solids Handling, and Processing
11-Oct-2001 JMR
2.8 General Considerations
The following comments and recommendations are based on theresearch findings presented and cited in this paper, as well as the consultingexperiences of the author.
For the general purpose of minimizing air flow, transport velocity,wear and power, the fluidized dense-phase mode of flow is preferred forlong-distance applications. Efficient blow tank feeders, rotary-screw com-pressors, refrigerated dryers and stepped-diameter pipelines also are rec-ommended. For products that are not suited to fluidized dense-phase, thepossible modes of flow include dilute-phase (suspension flow) or bypassconveying (Wypych, 1995a).
It is believed that the air velocities in a large-diameter dilute-phasesystem can be 50 to 100% higher than an equivalent well-designed dense-phase system. Hence, much greater wear problems are expected in thedilute-phase system, although significant advances have been made in thetechnology of wear-resistant materials and bends (Wypych and Arnold,1993). Other features involved with dilute-phase transport systems include:
• Limited operating pressures (e.g., 80 to 100 kPag for Roots-type blowers)
• Large-diameter pipelines
• Greater conveying velocities and system erosion (i.e., due tothe larger pipe diameters)
• Larger dust collectors to cope with the greater volumes ofconveying air
Note, the velocities required in large-diameter dilute-phase systemsmust be high to ensure suspension flow, avoid product deposition, andfacilitate good clean-out. This comment is based on personal experiencesinvolved with large-diameter pipeline systems used to unload ships (e.g.,350 mm NB pipelines 25% full of deposited cement) and provide fuel toboilers (e.g., deposition of pulverized coal even at high velocities such as 30m s-1). Note, blow tank feeders (i.e., instead of rotary valve feeders) canbe used effectively to assist in the cleaning/purging of pipelines (e.g., clean-blow cycle). However, with a Roots-type prime mover and a large-diameter (large-volume) pipeline, the effectiveness of the purge or clean-blow cycle will be reduced significantly (i.e., due to the pressure limit of 100kPag).
Long Distance Pneumatic Transport and Pipe Branching 753
11-Oct-2001 JMR
In contrast, a well-designed dense-phase system will operate atsignificantly less velocities and wear, as well as provide more efficientcleaning/purging operations (i.e., due to having smaller pipe diameters andgreater pressures, if needed). One other interesting issue is that a blow tankdense-phase system is inherently more “self-cleaning” than a dilute-phasesystem (i.e., due to the natural variations in pressure and increased materialconcentration/turbulence). Quite often dense-phase systems have beeninstalled in Australia to overcome buildup problems displayed by dilute-phase systems, where the air can flow easily over deposited material.
When evaluating a material for the purpose of establishing dense-phase and long-distance suitability, it is important to undertake all thenecessary tests (e.g., particle sizing, particle and bulk densities, fluidizationand deaeration). Also, if possible, it is useful to compare such results withthose obtained on previously conveyed similar materials (e.g., fly ash).However, it should be noted that such an evaluation only is a qualitative oneand it is not possible to predict say, minimum air flows or pipeline pressuredrop based on such data (i.e., pilot-scale tests normally are required toconfirm minimum velocities, friction factors, etc., especially over longdistances and for large-diameter pipes).
Many designers and researchers in the past have placed a great dealof emphasis on the importance of solids loading or the solids-to-air massflow rate ratio, m*. However, it should be realized that this parameter isdependent on particle and loose-poured bulk densities; conveying distanceand pressure available; frictional properties and minimum transport condi-tions of material (which will affect the maximum values of m*). Hence, itis difficult and misleading to apply “general” values of m* to differentsystems and materials. The objective always should be to achieve a well-designed long-distance transport system operating at optimal conditions—m* only should be considered as a consequence of achieving this result.
3.0 PIPE BRANCHING
The branching of pipes/ducts in pneumatic conveying has the follow-ing two main applications in industry.
• Extraction of dust via a network of branched ducts, where theparticulates are transported under vacuum conditions. Somecommon examples include the control of dust in materials
754 Fluidization, Solids Handling, and Processing
11-Oct-2001 JMR
handling operations, including conveyor transfers, screening,filling bins, ship loading, etc.
• The simultaneous splitting and distribution of solids-gasmixtures for applications requiring multipoint injection, wherethe mixtures are transported usually under positive-pressureconditions. Some common examples include tuyere injectionfor blast furnaces, large burner nozzles for pulverized coal-fired boilers, small coal-fired plasma torches providing start-up and support energy for boilers, injection of pulverized fuelinto calciners, etc.
Some of the important issues that should be considered when design-ing, improving or operating any such pipe branching applications are de-scribed in the following sections.
3.1 Dust Extraction
Most practical dust extraction systems involve multiple hoods linkedto a duct network serving a central gas cleaning unit and prime mover. Thisis very similar to an air conditioning system where the air is supplied froman air handling unit through the duct network to diffusers serving theoccupied spaces. In fact, most duct sizing methods are based on airconditioning principles and/or techniques, such as the Total Pressure Meth-od (ASHRAE, 1985), the Velocity Pressure Method (ACGIH, 1992) andthe Constant Pressure Gradient Sizing Method (DASCG and AIRAH,1987). Also, some “air-conditioning” computer programs, such as DON-KEY (DASCG and AIRAH, 1988), may be employed to assist in thedesign of the ductwork (i.e., based on one or two of these sizing methods).
The objective of the design/analysis process is to ensure (as far aspossible) that the correct quantity of air flows through each hood. Asdifferent air quantities, hood types/sizes and/or duct lengths usually areinvolved, this is not always a simple task. The correct air flows may beachieved by performing:
• A “rough” duct design and then making adjustments duringcommissioning using blast gates or dampers to control air flow
• A more involved design where the system is inherentlybalanced.
The latter method is preferred for the following reasons:
Long Distance Pneumatic Transport and Pipe Branching 755
11-Oct-2001 JMR
• Dampers may increase maintenance costs• Dampers may be tampered with during the life of the plant
• Damper control may be prohibited when handling dangerousor explosive materials
• The “rough” duct design method may result in premature dustdeposition or excessive system erosion (due to incorrect ductsizes and velocities)
Hence, even if the “rough” duct design technique is selected, someform of balancing still should be performed so that the final duct sizes areclose to optimal (in terms of pressure and velocity).
The correct application of either sizing technique will result in a ductnetwork that works well on air. It is equally important to ensure that eachair flow is adequate to transfer all the particulates from the hood/enclosureto the collection and/or cleaning device. Unfortunately, many dust controlsystems have been designed and/or are being operated with little or noregard for what actually has to go through the hood-duct network. This canresult in:
• Particulate deposition and buildup inside the duct(s)• Eventual choking of duct branch(es)
• Inefficient performance of the overall dust control system.
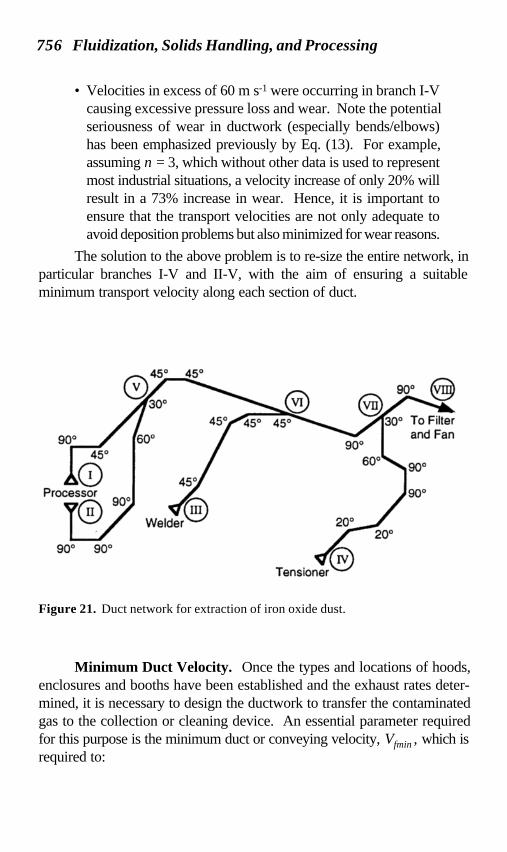
Case Study. Such a situation was found to occur in the duct networkshown in Fig. 21 and installed to extract iron oxide dust at various pointsalong a cold strip processing line. The stated problems were insufficientsuction at the hoods, buildup of contaminant in the hoods and along theprocessing line (causing cleanup problems due to eventual mixing withhydraulic fluid, lubricant, water, etc.). Analysis of the system found thefollowing:
• Branch II-V contained more bends and was over three timeslonger than branch I-V
• Branches I-V and II-V were sized to provide an approximate35%–65% split-up in air flow, respectively (i.e., using pressure-balancing techniques)
• The system would have worked initially on air, however, thelower section of branch II-V was completely blocked withcontaminant
756 Fluidization, Solids Handling, and Processing
11-Oct-2001 JMR
Figure 21. Duct network for extraction of iron oxide dust.
• Velocities in excess of 60 m s-1 were occurring in branch I-Vcausing excessive pressure loss and wear. Note the potentialseriousness of wear in ductwork (especially bends/elbows)has been emphasized previously by Eq. (13). For example,assuming n = 3, which without other data is used to representmost industrial situations, a velocity increase of only 20% willresult in a 73% increase in wear. Hence, it is important toensure that the transport velocities are not only adequate toavoid deposition problems but also minimized for wear reasons.
The solution to the above problem is to re-size the entire network, inparticular branches I-V and II-V, with the aim of ensuring a suitableminimum transport velocity along each section of duct.
Minimum Duct Velocity. Once the types and locations of hoods,enclosures and booths have been established and the exhaust rates deter-mined, it is necessary to design the ductwork to transfer the contaminatedgas to the collection or cleaning device. An essential parameter requiredfor this purpose is the minimum duct or conveying velocity, Vfmin , which isrequired to:
Long Distance Pneumatic Transport and Pipe Branching 757
11-Oct-2001 JMR
• Avoid the gradual buildup of a particular contaminant withtime
• Know whether any toxic or bacteria-prone particles are beingleft inside the ductwork (e.g., for servicing or maintenancepurposes)
• Establish whether any appreciable buildup will affect dustextraction efficiency
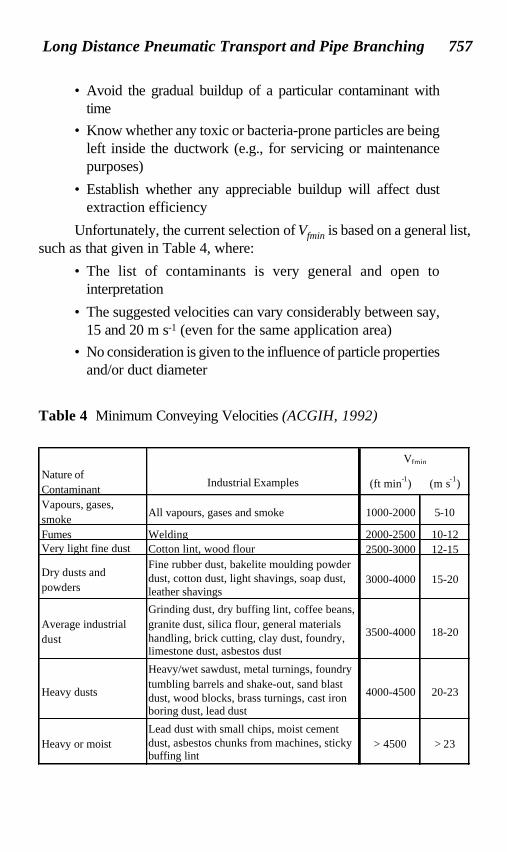
Unfortunately, the current selection of Vfmin is based on a general list,such as that given in Table 4, where:
• The list of contaminants is very general and open tointerpretation
• The suggested velocities can vary considerably between say,15 and 20 m s-1 (even for the same application area)
• No consideration is given to the influence of particle propertiesand/or duct diameter
Table 4 Minimum Conveying Velocities (ACGIH, 1992)
Nature of Contaminant
Industrial Examples (ft min-1) (m s-1)
Vapours, gases, smoke
All vapours, gases and smoke 1000-2000 5-10
Fumes Welding 2000-2500 10-12Very light fine dust Cotton lint, wood flour 2500-3000 12-15
Dry dusts and powders
Fine rubber dust, bakelite moulding powder dust, cotton dust, light shavings, soap dust, leather shavings
3000-4000 15-20
Average industrial dust
Grinding dust, dry buffing lint, coffee beans, granite dust, silica flour, general materials handling, brick cutting, clay dust, foundry, limestone dust, asbestos dust
3500-4000 18-20
Heavy dusts
Heavy/wet sawdust, metal turnings, foundry tumbling barrels and shake-out, sand blast dust, wood blocks, brass turnings, cast iron boring dust, lead dust
4000-4500 20-23
Heavy or moistLead dust with small chips, moist cement dust, asbestos chunks from machines, sticky buffing lint
> 4500 > 23
Vfmin
758 Fluidization, Solids Handling, and Processing
11-Oct-2001 JMR
For example, for the iron oxide dust considered in the previous case study,Table 2 suggested Vfmin = 18 to 20 m s-1 (i.e., assuming an “averageindustrial dust”). On analysis of the sample, it was found dp50 ≈ 80 µm,which appeared to support this classification. However, upon furtherexamination of the actual distribution of size, a significant proportion of thematerial was found > 1000 µm (e.g., large flakes). A minimum conveyingvelocity of at least Vfmin ≈ 25 m s-1 was estimated for this “dust.” Thisexplains why the iron oxide material built up and eventually blocked branchII-IV, which was sized/balanced mainly for air distribution purposes andproduced transport velocities < Vfmin.
As a result of some recent investigations into the deposition (salta-tion) of small particles in large diameter ducts (Cable, 1994; Miletich, 1994)and analogous work in pneumatic conveying (Wypych and Reed, 1990;Zenz, 1964; Cabrejos and Klinzing, 1994), some other interesting character-istics of Vfmin are listed below.
• Vfmin appears to increase with duct diameter, D. This trendhas been recognized in many “traditional” pneumatic conveyors(Wypych and Reed, 1990; Zenz, 1964; Cabrejos and Klinzing,1994), but also appears to be relevant for dust extraction(Cable, 1994; Miletich, 1994), which can be considered as aform of low-concentration pneumatic conveying (e.g., Vf = 10m s-1 may be suitable for a particular contaminant in a ductsize of D = 100 mm but may cause deposition in D = 300 mm).Further evidence of this can be seen in the work of Zenz,1964, who found that single-particle saltation, which isanalogous to the deposition of low-concentration particulatesuspensions in dust extraction, increases with duct diameteraccording to the following relationship.
Eq. (14) Vfso ∝ Dk
where k = 0.4 to 0.6. However, based on experience, Eq.(14) appears to provide conservative values of Vfso, especiallyin large-diameter ducts. This has been confirmed by Cable(1994) and Miletich (1994) who both employed 200, 300 and480 mm diameter steel ducts, and Cabrejos and Klinzing(1994) who used a 50 mm diameter copper tube.
Long Distance Pneumatic Transport and Pipe Branching 759
11-Oct-2001 JMR
• Vfmin appears initially to decrease with decreasing particlesize and then increase for very fine particles (due to cohesiveand interparticle forces). This trend is predicted (Wypych,1993) by three different saltation velocity models and alsocan be found in many industrial applications. For example, inan article describing the installation of a dust extractionsystem for very fine clay dust in a brick manufacturing plant(Anon, 1995), it was stated that a high velocity of 24 m s-1
was needed to maintain dust suspension—this velocity isapproximately equal to the 25 m s-1 estimated for the (coarserand heavier) iron oxide dust described above. Note, thisexample also provides further support to the inadequacy ofTable 4, which nominates a velocity of 18–20 m s-1 for “claydust.” It should be noted that these unusually high velocitiesmay be indicative of what would be needed to ensure “clean”ductwork (i.e., without any form of deposition), whereas inpractice a small amount of deposited material is considerednormal. Nevertheless, it is essential to ensure that such abuildup does not increase gradually with time. Also, in someapplications, especially those handling dangerous and/orbacteria prone contaminants, it may be necessary to maintain“clean” ductwork (i.e., for safety, hygienic and/or maintenancereasons).
• The velocity needed to re-entrain deposited particulates (Vfup)may need to be determined for particular applications. Thevelocity Vfup is being found (Zenz, 1964; Cabrejos and Klinzing,1994) to be much greater than Vfmin (i.e., the saltation ordeposition velocity) and again increase with duct diameter(Cabrejos and Klinzing, 1994). Also, similar to Vfmin, Vfupappears to increase with deceasing particle size, where veryfine contaminants are more difficult to re-entrain (i.e., due tointerparticle forces).
The further development of accurate models to predict the aboveparameters (including the effects of particle properties and duct diameter)is being pursued currently, and considerable effort still is required beforesuch models can be applied solely in design practice (i.e., without the needfor experience or comparative data).
760 Fluidization, Solids Handling, and Processing
11-Oct-2001 JMR
At this stage, operators of dust control systems should at least beaware of these various issues and their relative importance, which will varyfrom problem to problem. Hence, it is essential that the engineer orconsultant responsible adopts a systematic approach to the solution of theproblem in which all the relevant issues are considered and dealt with in theappropriate order.
If accurate design/analysis data are necessary (e.g., Vfmin, Vfup), it ispossible to obtain the information needed by undertaking the appropriatebench-type tests and large-scale test-design procedures, similar to theapproaches employed for pneumatic conveying (Pan and Wypych, 1992a;Arnold et al., 1994).
3.2 Flow Splitting
The layout of a typical flow-splitting system is depicted in Fig. 22.For an even split-up and distribution of material, it is essential that each pipebranch offers the same resistance to flow. This can be achieved easily byensuring that each pipe branch has the same length, type and location ofbends, as depicted in Fig. 23. This preferred approach is more feasiblewhen small diameters of pipeline are involved. However, the installation ofidentical pipe branches is not always possible. In such situations, thetraditional approach has been to install additional pipes/bends in the lowerresistance branches, such as branch Nos. 1 and 4 shown in Fig. 22. Theproblem with this approach is that bend pressure drop depends not only onconventional parameters, such as mf, ms, material properties, wall material,temperature, bend geometry, etc., but also on bend location (Wypych andPan, 1993; Pan and Wypych, 1992b). Hence, simply ensuring each pipebranch comprises the same length of pipe and number of bends still cancause inaccuracies in flow splitting efficiency.
By employing accurate test-design procedures (Pan and Wypych,1992a), it is possible to model and design each pipe branch separately sothat the system ultimately is well balanced. However, such a system maynot be reliable over time due to uneven wear in the pipes/bends, changes inmaterial property and/or on-site conditions.
Splitters. The following common splitters have been introduced toimprove the efficiency of flow splitting.
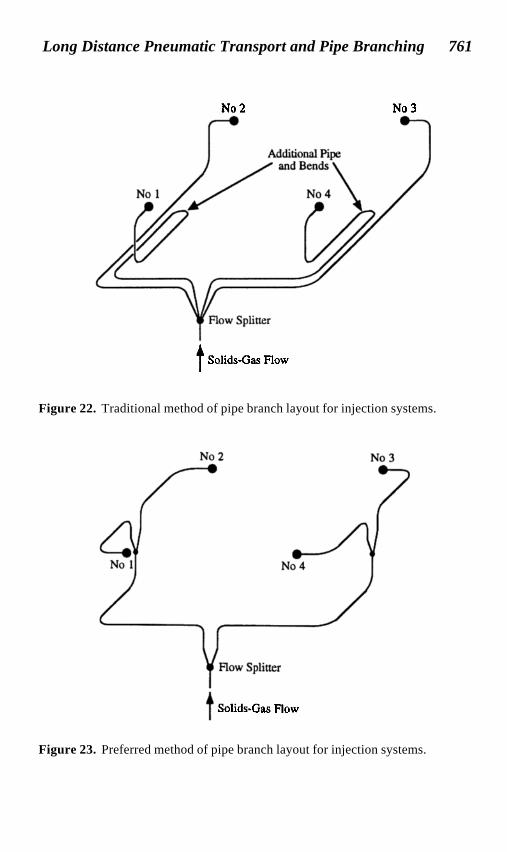
Long Distance Pneumatic Transport and Pipe Branching 761
11-Oct-2001 JMR
Figure 22. Traditional method of pipe branch layout for injection systems.
Figure 23. Preferred method of pipe branch layout for injection systems.
No3No2
Solids-Gas Flow
Solids-Gas Flow
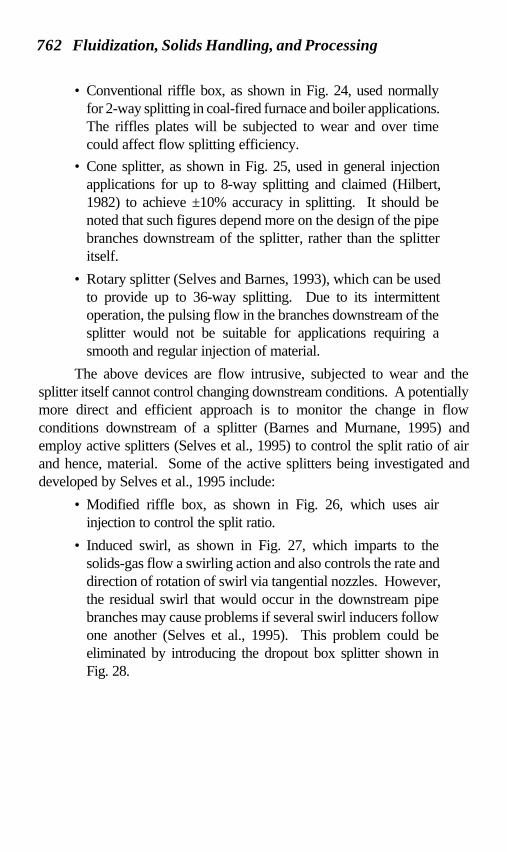
762 Fluidization, Solids Handling, and Processing
11-Oct-2001 JMR
• Conventional riffle box, as shown in Fig. 24, used normallyfor 2-way splitting in coal-fired furnace and boiler applications.The riffles plates will be subjected to wear and over timecould affect flow splitting efficiency.
• Cone splitter, as shown in Fig. 25, used in general injectionapplications for up to 8-way splitting and claimed (Hilbert,1982) to achieve ±10% accuracy in splitting. It should benoted that such figures depend more on the design of the pipebranches downstream of the splitter, rather than the splitteritself.
• Rotary splitter (Selves and Barnes, 1993), which can be usedto provide up to 36-way splitting. Due to its intermittentoperation, the pulsing flow in the branches downstream of thesplitter would not be suitable for applications requiring asmooth and regular injection of material.
The above devices are flow intrusive, subjected to wear and thesplitter itself cannot control changing downstream conditions. A potentiallymore direct and efficient approach is to monitor the change in flowconditions downstream of a splitter (Barnes and Murnane, 1995) andemploy active splitters (Selves et al., 1995) to control the split ratio of airand hence, material. Some of the active splitters being investigated anddeveloped by Selves et al., 1995 include:
• Modified riffle box, as shown in Fig. 26, which uses airinjection to control the split ratio.
• Induced swirl, as shown in Fig. 27, which imparts to thesolids-gas flow a swirling action and also controls the rate anddirection of rotation of swirl via tangential nozzles. However,the residual swirl that would occur in the downstream pipebranches may cause problems if several swirl inducers followone another (Selves et al., 1995). This problem could beeliminated by introducing the dropout box splitter shown inFig. 28.
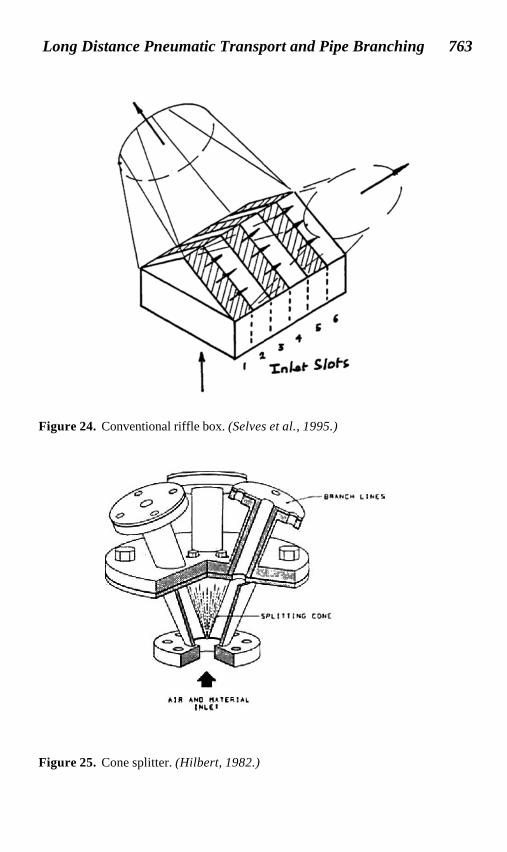
Long Distance Pneumatic Transport and Pipe Branching 763
11-Oct-2001 JMR
Figure 24. Conventional riffle box. (Selves et al., 1995.)
Figure 25. Cone splitter. (Hilbert, 1982.)
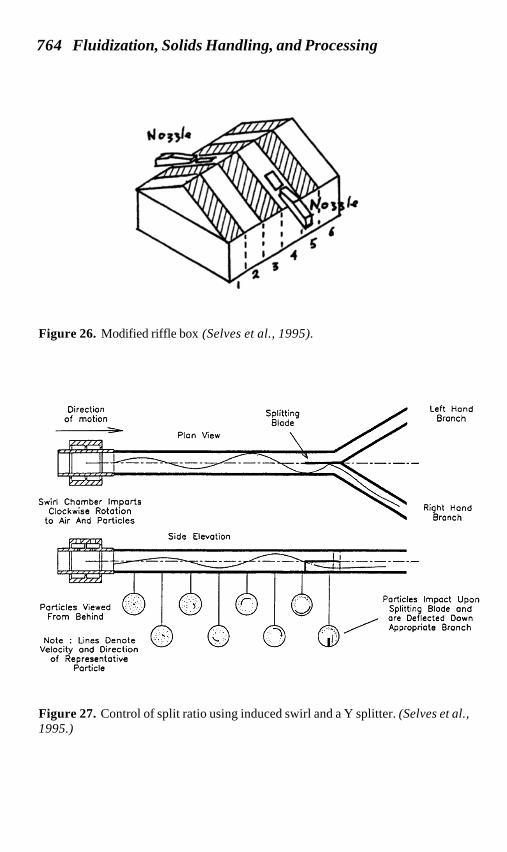
764 Fluidization, Solids Handling, and Processing
11-Oct-2001 JMR
Figure 26. Modified riffle box (Selves et al., 1995).
Figure 27. Control of split ratio using induced swirl and a Y splitter. (Selves et al.,1995.)
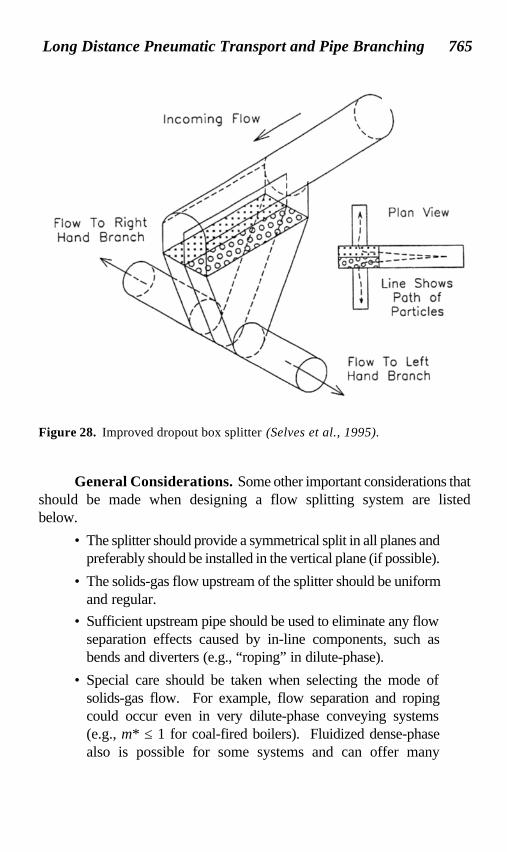
Long Distance Pneumatic Transport and Pipe Branching 765
11-Oct-2001 JMR
Figure 28. Improved dropout box splitter (Selves et al., 1995).
General Considerations. Some other important considerations thatshould be made when designing a flow splitting system are listedbelow.
• The splitter should provide a symmetrical split in all planes andpreferably should be installed in the vertical plane (if possible).
• The solids-gas flow upstream of the splitter should be uniformand regular.
• Sufficient upstream pipe should be used to eliminate any flowseparation effects caused by in-line components, such asbends and diverters (e.g., “roping” in dilute-phase).
• Special care should be taken when selecting the mode ofsolids-gas flow. For example, flow separation and ropingcould occur even in very dilute-phase conveying systems(e.g., m* ≤ 1 for coal-fired boilers). Fluidized dense-phasealso is possible for some systems and can offer many
766 Fluidization, Solids Handling, and Processing
11-Oct-2001 JMR
advantages (e.g., reduced air flow, velocity, wear, power).However, this mode of flow can be more irregular than dilute-phase (e.g., increased pressure fluctuations) and hence,produce flow splitting problems, even with active splitters.The objective here should be to achieve the minimum air flowthat is needed to ensure smooth and consistent flow under alloperating conditions.
3.3 Pressure Loss
For dust extraction systems, the concentration of solids usually isquite low. For this reason, the methods employed to calculate pressure lossare based on air-only conditions. Comprehensive information is available(ASHRAE, 1985; ACGIH, 1992) to assist the designer in estimating thepressure loss caused by pipe branches, ducts, elbows, etc.
In contrast, the amount of material being conveyed inside each pipebranch of a flow splitting application is very high and hence, design cannotbe based on air-only analyses alone. For example, Low et al., 1987 haveproposed the following empirical relationship to determine the head loss of apipe branch.
Eq. (15) K = Kf (1 + C mfa)
where K is the branch head loss for solids-gas flow, Kf is the branch headloss for air-only conditions and can be calculated theoretically from (Low etal., 1987), C = 0.22 and a = 1.27 appear to represent satisfactorily both 90°-and 45°-branches with different branch diameters and products (Low et al.,1987). Further examples of empirically based pressure loss equations forY-splitters of various angles and subjected to plastic pellets underdifferent solids loadings have been presented and cited by Marcus et al.,1990.
Good flow splitting design is dependent on the accurate predictionof the pressure drop caused by the various bends, branches and straightsections of pipe. This can be achieved by employing the above branchmodel(s), proven for the particular material and application, coupled withthe accurate “pipeline” test-design procedure described in Sec. 2.4 of thischapter.
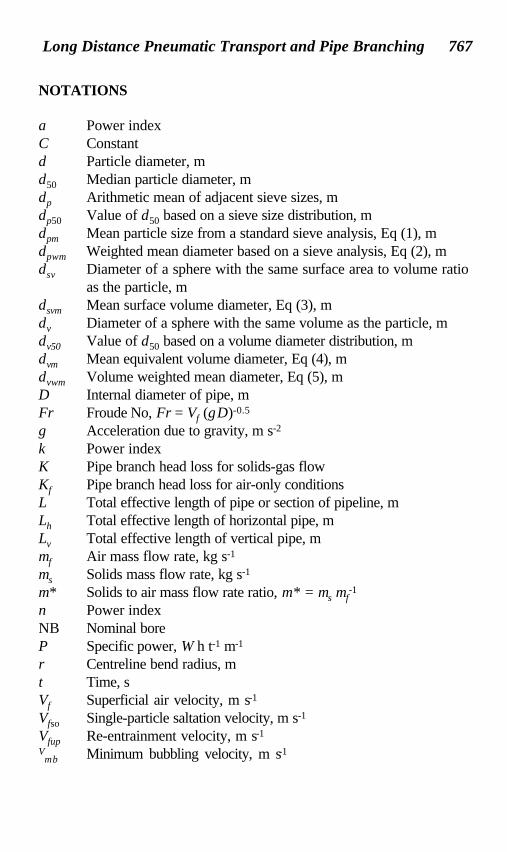
Long Distance Pneumatic Transport and Pipe Branching 767
11-Oct-2001 JMR
NOTATIONS
a Power indexC Constantd Particle diameter, md50 Median particle diameter, mdp Arithmetic mean of adjacent sieve sizes, mdp50 Value of d50 based on a sieve size distribution, mdpm Mean particle size from a standard sieve analysis, Eq (1), mdpwm Weighted mean diameter based on a sieve analysis, Eq (2), mdsv Diameter of a sphere with the same surface area to volume ratio
as the particle, mdsvm Mean surface volume diameter, Eq (3), mdv Diameter of a sphere with the same volume as the particle, mdv50 Value of d50 based on a volume diameter distribution, mdvm Mean equivalent volume diameter, Eq (4), mdvwm Volume weighted mean diameter, Eq (5), mD Internal diameter of pipe, mFr Froude No, Fr = Vf (gD)-0.5
g Acceleration due to gravity, m s-2
k Power indexK Pipe branch head loss for solids-gas flowKf Pipe branch head loss for air-only conditionsL Total effective length of pipe or section of pipeline, mLh Total effective length of horizontal pipe, mLv Total effective length of vertical pipe, mmf Air mass flow rate, kg s-1
ms Solids mass flow rate, kg s-1
m* Solids to air mass flow rate ratio, m* = ms mf-1
n Power indexNB Nominal boreP Specific power, W h t-1 m-1
r Centreline bend radius, mt Time, sVf Superficial air velocity, m s-1
Vfso Single-particle saltation velocity, m s-1
Vfup Re-entrainment velocity, m s-1
Vmb Minimum bubbling velocity, m s-1
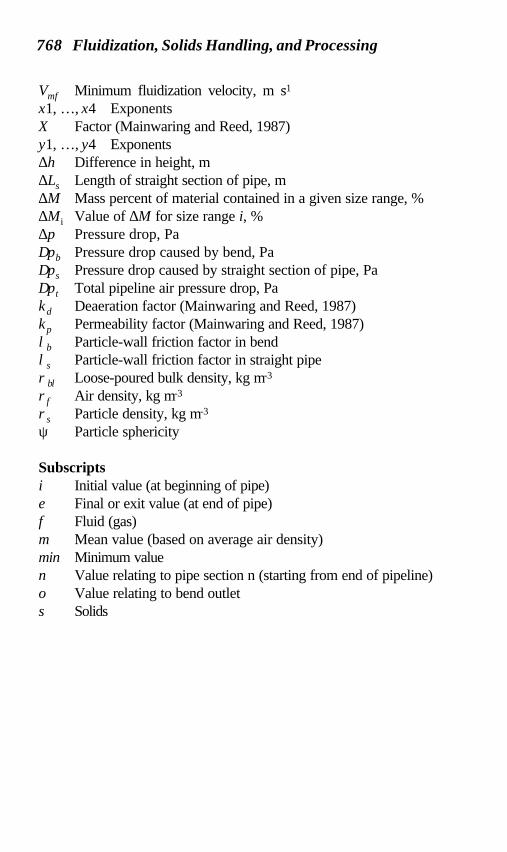
768 Fluidization, Solids Handling, and Processing
11-Oct-2001 JMR
Vmf Minimum fluidization velocity, m s-1x1, …, x4 ExponentsX Factor (Mainwaring and Reed, 1987)y1, …, y4 Exponents∆h Difference in height, m∆Ls Length of straight section of pipe, m∆M Mass percent of material contained in a given size range, %∆Mi Value of ∆M for size range i, %∆p Pressure drop, Pa∆pb Pressure drop caused by bend, Pa∆ps Pressure drop caused by straight section of pipe, Pa∆pt Total pipeline air pressure drop, Paκd Deaeration factor (Mainwaring and Reed, 1987)κp Permeability factor (Mainwaring and Reed, 1987)λb Particle-wall friction factor in bendλs Particle-wall friction factor in straight pipe ρbl Loose-poured bulk density, kg m-3
ρf Air density, kg m-3
ρs Particle density, kg m-3
ψ Particle sphericity
Subscriptsi Initial value (at beginning of pipe)e Final or exit value (at end of pipe)f Fluid (gas)m Mean value (based on average air density)min Minimum valuen Value relating to pipe section n (starting from end of pipeline)o Value relating to bend outlets Solids
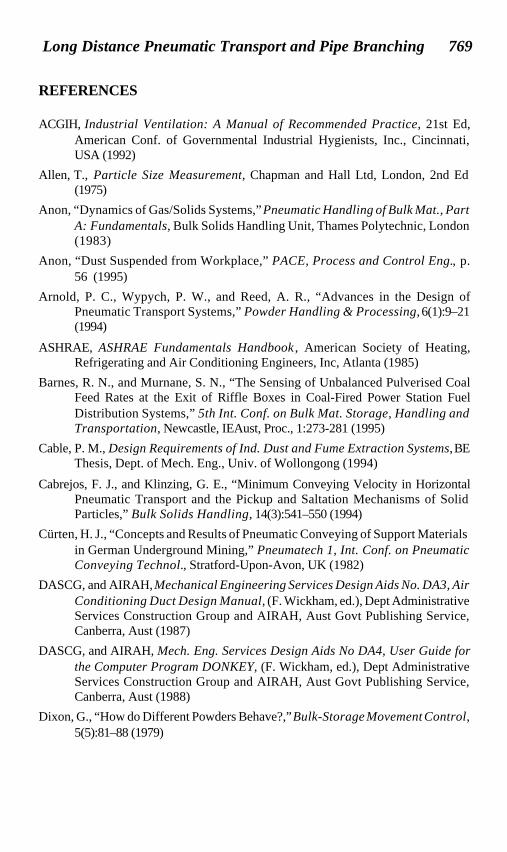
Long Distance Pneumatic Transport and Pipe Branching 769
11-Oct-2001 JMR
REFERENCES
ACGIH, Industrial Ventilation: A Manual of Recommended Practice, 21st Ed,American Conf. of Governmental Industrial Hygienists, Inc., Cincinnati,USA (1992)
Allen, T., Particle Size Measurement, Chapman and Hall Ltd, London, 2nd Ed(1975)
Anon, “Dynamics of Gas/Solids Systems,” Pneumatic Handling of Bulk Mat., PartA: Fundamentals, Bulk Solids Handling Unit, Thames Polytechnic, London(1983)
Anon, “Dust Suspended from Workplace,” PACE, Process and Control Eng., p.56 (1995)
Arnold, P. C., Wypych, P. W., and Reed, A. R., “Advances in the Design ofPneumatic Transport Systems,” Powder Handling & Processing, 6(1):9–21(1994)
ASHRAE, ASHRAE Fundamentals Handbook , American Society of Heating,Refrigerating and Air Conditioning Engineers, Inc, Atlanta (1985)
Barnes, R. N., and Murnane, S. N., “The Sensing of Unbalanced Pulverised CoalFeed Rates at the Exit of Riffle Boxes in Coal-Fired Power Station FuelDistribution Systems,” 5th Int. Conf. on Bulk Mat. Storage, Handling andTransportation, Newcastle, IEAust, Proc., 1:273-281 (1995)
Cable, P. M., Design Requirements of Ind. Dust and Fume Extraction Systems, BEThesis, Dept. of Mech. Eng., Univ. of Wollongong (1994)
Cabrejos, F. J., and Klinzing, G. E., “Minimum Conveying Velocity in HorizontalPneumatic Transport and the Pickup and Saltation Mechanisms of SolidParticles,” Bulk Solids Handling, 14(3):541–550 (1994)
Cürten, H. J., “Concepts and Results of Pneumatic Conveying of Support Materialsin German Underground Mining,” Pneumatech 1, Int. Conf. on PneumaticConveying Technol., Stratford-Upon-Avon, UK (1982)
DASCG, and AIRAH, Mechanical Engineering Services Design Aids No. DA3, AirConditioning Duct Design Manual, (F. Wickham, ed.), Dept AdministrativeServices Construction Group and AIRAH, Aust Govt Publishing Service,Canberra, Aust (1987)
DASCG, and AIRAH, Mech. Eng. Services Design Aids No DA4, User Guide forthe Computer Program DONKEY, (F. Wickham, ed.), Dept AdministrativeServices Construction Group and AIRAH, Aust Govt Publishing Service,Canberra, Aust (1988)
Dixon, G., “How do Different Powders Behave?,” Bulk-Storage Movement Control,5(5):81–88 (1979)
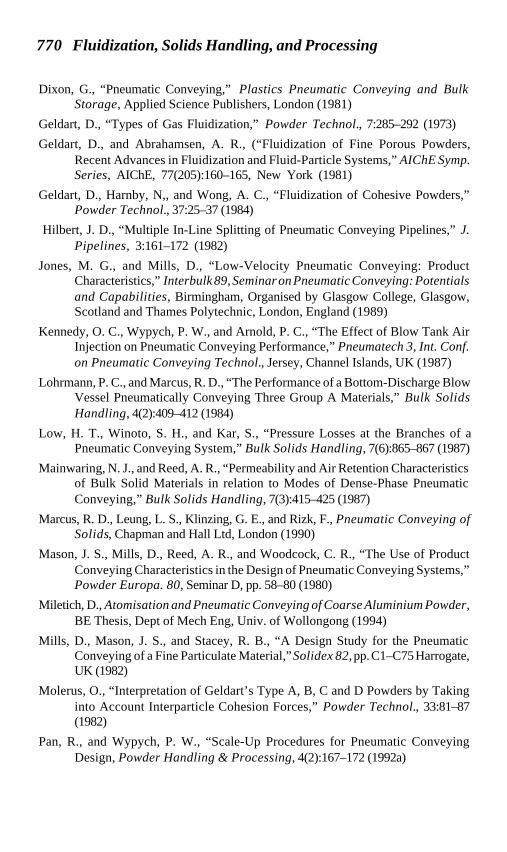
770 Fluidization, Solids Handling, and Processing
11-Oct-2001 JMR
Dixon, G., “Pneumatic Conveying,” Plastics Pneumatic Conveying and BulkStorage, Applied Science Publishers, London (1981)
Geldart, D., “Types of Gas Fluidization,” Powder Technol., 7:285–292 (1973)
Geldart, D., and Abrahamsen, A. R., (“Fluidization of Fine Porous Powders,Recent Advances in Fluidization and Fluid-Particle Systems,” AIChE Symp.Series, AIChE, 77(205):160–165, New York (1981)
Geldart, D., Harnby, N,, and Wong, A. C., “Fluidization of Cohesive Powders,”Powder Technol., 37:25–37 (1984)
Hilbert, J. D., “Multiple In-Line Splitting of Pneumatic Conveying Pipelines,” J.Pipelines, 3:161–172 (1982)
Jones, M. G., and Mills, D., “Low-Velocity Pneumatic Conveying: ProductCharacteristics,” Interbulk 89, Seminar on Pneumatic Conveying: Potentialsand Capabilities, Birmingham, Organised by Glasgow College, Glasgow,Scotland and Thames Polytechnic, London, England (1989)
Kennedy, O. C., Wypych, P. W., and Arnold, P. C., “The Effect of Blow Tank AirInjection on Pneumatic Conveying Performance,” Pneumatech 3, Int. Conf.on Pneumatic Conveying Technol., Jersey, Channel Islands, UK (1987)
Lohrmann, P. C., and Marcus, R. D., “The Performance of a Bottom-Discharge BlowVessel Pneumatically Conveying Three Group A Materials,” Bulk SolidsHandling, 4(2):409–412 (1984)
Low, H. T., Winoto, S. H., and Kar, S., “Pressure Losses at the Branches of aPneumatic Conveying System,” Bulk Solids Handling, 7(6):865–867 (1987)
Mainwaring, N. J., and Reed, A. R., “Permeability and Air Retention Characteristicsof Bulk Solid Materials in relation to Modes of Dense-Phase PneumaticConveying,” Bulk Solids Handling, 7(3):415–425 (1987)
Marcus, R. D., Leung, L. S., Klinzing, G. E., and Rizk, F., Pneumatic Conveying ofSolids, Chapman and Hall Ltd, London (1990)
Mason, J. S., Mills, D., Reed, A. R., and Woodcock, C. R., “The Use of ProductConveying Characteristics in the Design of Pneumatic Conveying Systems,”Powder Europa. 80, Seminar D, pp. 58–80 (1980)
Miletich, D., Atomisation and Pneumatic Conveying of Coarse Aluminium Powder,BE Thesis, Dept of Mech Eng, Univ. of Wollongong (1994)
Mills, D., Mason, J. S., and Stacey, R. B., “A Design Study for the PneumaticConveying of a Fine Particulate Material,” Solidex 82, pp. C1–C75 Harrogate,UK (1982)
Molerus, O., “Interpretation of Geldart’s Type A, B, C and D Powders by Takinginto Account Interparticle Cohesion Forces,” Powder Technol., 33:81–87(1982)
Pan, R., and Wypych, P. W., “Scale-Up Procedures for Pneumatic ConveyingDesign, Powder Handling & Processing, 4(2):167–172 (1992a)
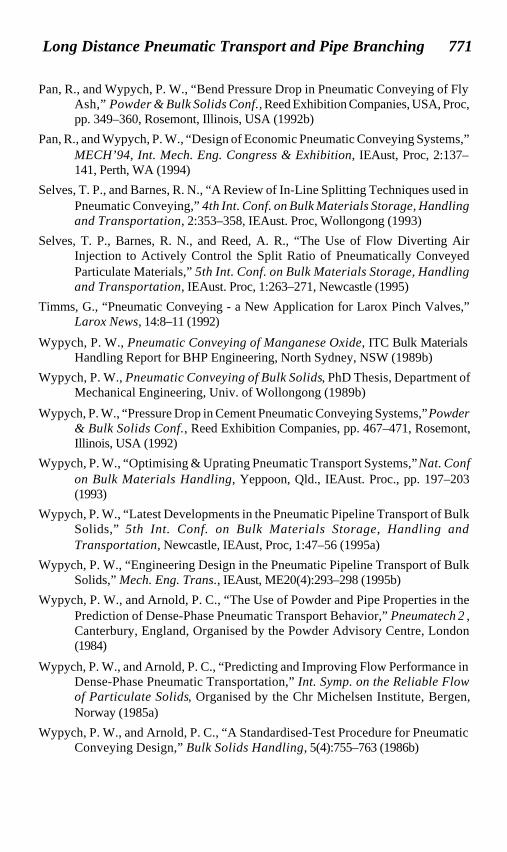
Long Distance Pneumatic Transport and Pipe Branching 771
11-Oct-2001 JMR
Pan, R., and Wypych, P. W., “Bend Pressure Drop in Pneumatic Conveying of FlyAsh,” Powder & Bulk Solids Conf., Reed Exhibition Companies, USA, Proc,pp. 349–360, Rosemont, Illinois, USA (1992b)
Pan, R., and Wypych, P. W., “Design of Economic Pneumatic Conveying Systems,”MECH’94, Int. Mech. Eng. Congress & Exhibition, IEAust, Proc, 2:137–141, Perth, WA (1994)
Selves, T. P., and Barnes, R. N., “A Review of In-Line Splitting Techniques used inPneumatic Conveying,” 4th Int. Conf. on Bulk Materials Storage, Handlingand Transportation, 2:353–358, IEAust. Proc, Wollongong (1993)
Selves, T. P., Barnes, R. N., and Reed, A. R., “The Use of Flow Diverting AirInjection to Actively Control the Split Ratio of Pneumatically ConveyedParticulate Materials,” 5th Int. Conf. on Bulk Materials Storage, Handlingand Transportation, IEAust. Proc, 1:263–271, Newcastle (1995)
Timms, G., “Pneumatic Conveying - a New Application for Larox Pinch Valves,”Larox News, 14:8–11 (1992)
Wypych, P. W., Pneumatic Conveying of Manganese Oxide, ITC Bulk MaterialsHandling Report for BHP Engineering, North Sydney, NSW (1989b)
Wypych, P. W., Pneumatic Conveying of Bulk Solids, PhD Thesis, Department ofMechanical Engineering, Univ. of Wollongong (1989b)
Wypych, P. W., “Pressure Drop in Cement Pneumatic Conveying Systems,” Powder& Bulk Solids Conf., Reed Exhibition Companies, pp. 467–471, Rosemont,Illinois, USA (1992)
Wypych, P. W., “Optimising & Uprating Pneumatic Transport Systems,” Nat. Confon Bulk Materials Handling, Yeppoon, Qld., IEAust. Proc., pp. 197–203(1993)
Wypych, P. W., “Latest Developments in the Pneumatic Pipeline Transport of BulkSolids,” 5th Int. Conf. on Bulk Materials Storage, Handling andTransportation, Newcastle, IEAust, Proc, 1:47–56 (1995a)
Wypych, P. W., “Engineering Design in the Pneumatic Pipeline Transport of BulkSolids,” Mech. Eng. Trans., IEAust, ME20(4):293–298 (1995b)
Wypych, P. W., and Arnold, P. C., “The Use of Powder and Pipe Properties in thePrediction of Dense-Phase Pneumatic Transport Behavior,” Pneumatech 2 ,Canterbury, England, Organised by the Powder Advisory Centre, London(1984)
Wypych, P. W., and Arnold, P. C., “Predicting and Improving Flow Performance inDense-Phase Pneumatic Transportation,” Int. Symp. on the Reliable Flowof Particulate Solids, Organised by the Chr Michelsen Institute, Bergen,Norway (1985a)
Wypych, P. W., and Arnold, P. C., “A Standardised-Test Procedure for PneumaticConveying Design,” Bulk Solids Handling, 5(4):755–763 (1986b)
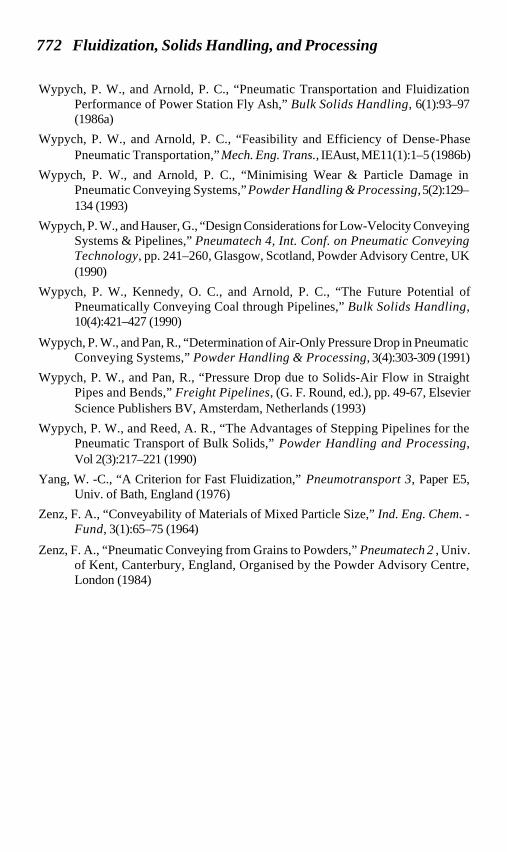
772 Fluidization, Solids Handling, and Processing
11-Oct-2001 JMR
Wypych, P. W., and Arnold, P. C., “Pneumatic Transportation and FluidizationPerformance of Power Station Fly Ash,” Bulk Solids Handling, 6(1):93–97(1986a)
Wypych, P. W., and Arnold, P. C., “Feasibility and Efficiency of Dense-PhasePneumatic Transportation,” Mech. Eng. Trans., IEAust, ME11(1):1–5 (1986b)
Wypych, P. W., and Arnold, P. C., “Minimising Wear & Particle Damage inPneumatic Conveying Systems,” Powder Handling & Processing, 5(2):129–134 (1993)
Wypych, P. W., and Hauser, G., “Design Considerations for Low-Velocity ConveyingSystems & Pipelines,” Pneumatech 4, Int. Conf. on Pneumatic ConveyingTechnology, pp. 241–260, Glasgow, Scotland, Powder Advisory Centre, UK(1990)
Wypych, P. W., Kennedy, O. C., and Arnold, P. C., “The Future Potential ofPneumatically Conveying Coal through Pipelines,” Bulk Solids Handling,10(4):421–427 (1990)
Wypych, P. W., and Pan, R., “Determination of Air-Only Pressure Drop in PneumaticConveying Systems,” Powder Handling & Processing, 3(4):303-309 (1991)
Wypych, P. W., and Pan, R., “Pressure Drop due to Solids-Air Flow in StraightPipes and Bends,” Freight Pipelines, (G. F. Round, ed.), pp. 49-67, ElsevierScience Publishers BV, Amsterdam, Netherlands (1993)
Wypych, P. W., and Reed, A. R., “The Advantages of Stepping Pipelines for thePneumatic Transport of Bulk Solids,” Powder Handling and Processing,Vol 2(3):217–221 (1990)
Yang, W. -C., “A Criterion for Fast Fluidization,” Pneumotransport 3, Paper E5,Univ. of Bath, England (1976)
Zenz, F. A., “Conveyability of Materials of Mixed Particle Size,” Ind. Eng. Chem. -Fund, 3(1):65–75 (1964)
Zenz, F. A., “Pneumatic Conveying from Grains to Powders,” Pneumatech 2 , Univ.of Kent, Canterbury, England, Organised by the Powder Advisory Centre,London (1984)