+11% +6% 11.0% - Cisionmb.cision.com/Main/1493/2385209/747928.pdf · My Little Garden, VIP Club ,...
18
1 3 months ended 30 September 2017 • Local currency sales increased by 11% and Euro sales increased by 6% to €295.3m (€278.9m). • Number of registered actives was stable at 2.6m. • EBITDA amounted to €40.0m (€30.8m). • Operating margin was 11.0% (9.0%), negatively impacted by 160 bps from currencies, and operating profit was €32.5m (€25.2m). • Net profit was €17.4m (€12.7m) and diluted EPS €0.30 (€0.23). Following the successful refinancing of the Revolving Credit Facility during the quarter, the net profit was negatively impacted by a one-off amortisation of the replaced facility’s capitalised fees of around €1.0m. • Cash flow from operating activities was €11.2m (€-5.8m). • During the quarter, Oriflame signed a new Revolving Credit Facility amounting to €160m in total. The new five-year facility replaced the €110m facility. • The year to date sales development is approximately 10% in local currency and the development in the fourth quarter to date is approximately 11% in local currency. 9 months ended 30 September 2017 • Local currency sales increased by 10% and Euro sales increased by 10% to €983.0m (€894.3m). • EBITDA amounted to €128.3m (€99.1m). • Operating margin was 10.5% (8.6%), negatively impacted by 10 bps from currencies, and operating profit was €102.8m (€77.2m). • Net profit was €56.8m (€41.5m) and diluted EPS €0.99 (€0.74). • Cash flow from operating activities amounted to €43.7m (€51.4m). Interim Report 1 January – 30 September 2017 +11% LC SALES +6% EURO SALES 11.0% OPERATING MARGIN “During Q3 2017, we continued to execute on our strategic priorities resulting in yet another quarter of healthy growth and improved profitability. The local currency sales development for the Group in the fourth quarter-to-date is in line with our long-term financial target.” CEO Magnus Brännström
Transcript of +11% +6% 11.0% - Cisionmb.cision.com/Main/1493/2385209/747928.pdf · My Little Garden, VIP Club ,...
1
3 months ended 30 September 2017
• Local currency sales increased by 11% and Euro sales increased by 6% to €295.3m (€278.9m).
• Number of registered actives was stable at 2.6m.
• EBITDA amounted to €40.0m (€30.8m).
• Operating margin was 11.0% (9.0%), negatively impacted by 160 bps from currencies, and operating profit was €32.5m
(€25.2m).
• Net profit was €17.4m (€12.7m) and diluted EPS €0.30 (€0.23). Following the successful refinancing of the Revolving
Credit Facility during the quarter, the net profit was negatively impacted by a one-off amortisation of the replaced facility’s
capitalised fees of around €1.0m.
• Cash flow from operating activities was €11.2m (€-5.8m).
• During the quarter, Oriflame signed a new Revolving Credit Facility amounting to €160m in total. The new five-year facility
replaced the €110m facility.
• The year to date sales development is approximately 10% in local currency and the development in the fourth quarter to
date is approximately 11% in local currency.
9 months ended 30 September 2017 • Local currency sales increased by 10% and Euro sales increased by 10% to €983.0m (€894.3m).
• EBITDA amounted to €128.3m (€99.1m).
• Operating margin was 10.5% (8.6%), negatively impacted by 10 bps from currencies, and operating profit was €102.8m
(€77.2m).
• Net profit was €56.8m (€41.5m) and diluted EPS €0.99 (€0.74).
• Cash flow from operating activities amounted to €43.7m (€51.4m).
Interim Report 1 January – 30 September 2017
+11% LC SALES
+6% EURO SALES
11.0% OPERATING MARGIN
“During Q3 2017, we continued to execute on our strategic priorities resulting in yet another quarter of healthy growth and improved profitability. The local currency sales development for the Group in the fourth quarter-to-date is in line with our
long-term financial target.”
CEO Magnus Brännström

Oriflame Interim report 1 January – 30 September 2017
2
“ 14%
(15%)
24% (26%)
24% (24%)
38% (35%)
11% (12%)
25% (25%)
26% (30%)
38% (33%)
13% (18%)
20% (23%)
21% (14%)
46% (45%)
0%
5%
10%
15%
0
500
1000
1500
Q3
15
Q4
15
Q1
16
Q2
16
Q3
16
Q4
16
Q1
17
Q2
17
Q3
17
Net Sales LTM
Adj. Op Margin % LTM
CEO Magnus Brännström comments
“During Q3 2017, we continued to execute on our strategic priorities resulting in yet another quarter of healthy growth and improved
profitability. The overall performance in Asia & Turkey remained strong, although with variations within the region. The growth in the CIS
continued, supported by sustained high productivity levels. Latin America was affected by the earthquakes and negative timing. Our efforts to
improve the capacity utilisation in manufacturing continued to render results during the quarter and the number of registered actives was stable.
The local currency sales development for the Group in the fourth quarter-to-date is in line with our long-term financial target.”
Key financial data 3 months ended 30 September
Sales
Registered actives
Operating profit
Net Sales LTM Adj. operating margin %
LTM
Financial summary
(€m)
3 months ended 30 September
9 months ended 30 September
LTM Oct ‘16- Sept ‘17
Year end 2016
2017 2016 Change % 2017 2016 Change %
Sales 295.3 278.9 6% 983.0 894.3 10% 1,338.1 1,249.4
Gross margin, % 73.8 70.4 72.7 70.5 72.3 70.7
EBITDA 40.0 30.8 30% 128.3 99.1 29% 177.4 148.2
Operating profit 32.5 25.2 29% 102.8 77.2 33% 144.8 119.2
Operating margin, % 11.0 9.0 10.5 8.6 10.8 9.5
Net profit before tax 24.8 20.4 21% 81.9 63.2 30% 119.2 100.5
Net profit 17.4 12.7 37% 56.8 41.5 37% 82.0 66.7
Diluted EPS, € 0.30 0.23 35% 0.99 0.74 35% 1.43 1.18
Cash flow from operating activities 11.2 (5.8) NA 43.7 51.4 (15%) 105.4 113.1
Net interest-bearing debt 85.4 111.8 (24%) 85.4 111.8 (24%) 85.4 82.3
Net interest-bearing debt at hedged values 62.2 53.8 16% 62.2 53.8 16% 62.2 13.2
Registered actives, ‘000 2,646 2,648 0% 2,646 2,648 0% 2,646 3,006
Sales / registered actives, € 110.6 104.3 6% 367.1 334.5 10% 500.3 411.9
Asia & Turkey Europe & Africa Latin America CIS
Oriflame Interim report 1 January – 30 September 2017
3
+200 bps OPERATING
MARGIN
LAUNCH OF
THE ONE NO
COMPROMISE
MASCARA
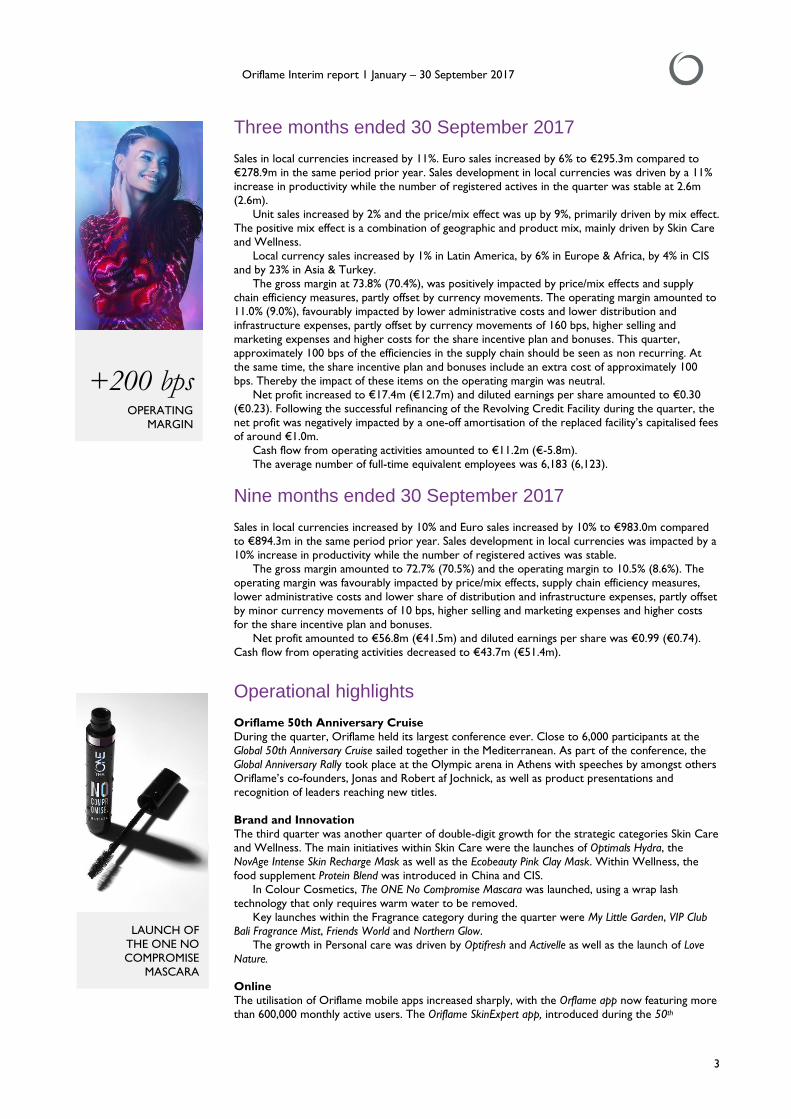
Three months ended 30 September 2017
Sales in local currencies increased by 11%. Euro sales increased by 6% to €295.3m compared to
€278.9m in the same period prior year. Sales development in local currencies was driven by a 11%
increase in productivity while the number of registered actives in the quarter was stable at 2.6m
(2.6m).
Unit sales increased by 2% and the price/mix effect was up by 9%, primarily driven by mix effect.
The positive mix effect is a combination of geographic and product mix, mainly driven by Skin Care
and Wellness.
Local currency sales increased by 1% in Latin America, by 6% in Europe & Africa, by 4% in CIS
and by 23% in Asia & Turkey.
The gross margin at 73.8% (70.4%), was positively impacted by price/mix effects and supply
chain efficiency measures, partly offset by currency movements. The operating margin amounted to
11.0% (9.0%), favourably impacted by lower administrative costs and lower distribution and
infrastructure expenses, partly offset by currency movements of 160 bps, higher selling and
marketing expenses and higher costs for the share incentive plan and bonuses. This quarter,
approximately 100 bps of the efficiencies in the supply chain should be seen as non recurring. At
the same time, the share incentive plan and bonuses include an extra cost of approximately 100
bps. Thereby the impact of these items on the operating margin was neutral.
Net profit increased to €17.4m (€12.7m) and diluted earnings per share amounted to €0.30
(€0.23). Following the successful refinancing of the Revolving Credit Facility during the quarter, the
net profit was negatively impacted by a one-off amortisation of the replaced facility’s capitalised fees
of around €1.0m.
Cash flow from operating activities amounted to €11.2m (€-5.8m).
The average number of full-time equivalent employees was 6,183 (6,123).
Nine months ended 30 September 2017
Sales in local currencies increased by 10% and Euro sales increased by 10% to €983.0m compared
to €894.3m in the same period prior year. Sales development in local currencies was impacted by a
10% increase in productivity while the number of registered actives was stable.
The gross margin amounted to 72.7% (70.5%) and the operating margin to 10.5% (8.6%). The
operating margin was favourably impacted by price/mix effects, supply chain efficiency measures,
lower administrative costs and lower share of distribution and infrastructure expenses, partly offset
by minor currency movements of 10 bps, higher selling and marketing expenses and higher costs
for the share incentive plan and bonuses.
Net profit amounted to €56.8m (€41.5m) and diluted earnings per share was €0.99 (€0.74).
Cash flow from operating activities decreased to €43.7m (€51.4m).
Operational highlights
Oriflame 50th Anniversary Cruise
During the quarter, Oriflame held its largest conference ever. Close to 6,000 participants at the
Global 50th Anniversary Cruise sailed together in the Mediterranean. As part of the conference, the
Global Anniversary Rally took place at the Olympic arena in Athens with speeches by amongst others
Oriflame’s co-founders, Jonas and Robert af Jochnick, as well as product presentations and
recognition of leaders reaching new titles.
Brand and Innovation
The third quarter was another quarter of double-digit growth for the strategic categories Skin Care
and Wellness. The main initiatives within Skin Care were the launches of Optimals Hydra, the
NovAge Intense Skin Recharge Mask as well as the Ecobeauty Pink Clay Mask. Within Wellness, the
food supplement Protein Blend was introduced in China and CIS.
In Colour Cosmetics, The ONE No Compromise Mascara was launched, using a wrap lash
technology that only requires warm water to be removed.
Key launches within the Fragrance category during the quarter were My Little Garden, VIP Club
Bali Fragrance Mist, Friends World and Northern Glow.
The growth in Personal care was driven by Optifresh and Activelle as well as the launch of Love
Nature.
Online
The utilisation of Oriflame mobile apps increased sharply, with the Orflame app now featuring more
than 600,000 monthly active users. The Oriflame SkinExpert app, introduced during the 50th

Oriflame Interim report 1 January – 30 September 2017
4
Anniversary Cruise, supports Consultants to recommend the appropriate Skin Care routine to their
customers, based on customer profile, current skin conditions and other specific skin care needs.
Prioritised activities during the quarter included continued development of the digital platform
and key mobile apps, as well as further rollout of the new e-commerce platform, which was
successfully implemented in Indonesia.
Service, Manufacturing and Other
Service levels remained healthy. The number of inventory days normalised and increased compared
to the same period last year. The capacity utilisation in manufacturing improved further during the
quarter, driven by insourcing efforts and unit growth. The implementation of the outsourcing of IT
and financial operational services to IBM continued and is developing well.

Oriflame Interim report 1 January – 30 September 2017
5
NEGATIVELY
IMPACTED BY
TIMING
+6% LC SALES
Latin America
Key figures
Q3’16 Q4’16 Q1’17 Q2’17 Q3’17
Sales, €m 40.9 39.8 35.3 40.9 40.4
Sales growth in € 16% 12% 20% 6% (1%)
Sales growth in lc 26% 21% 21% 4% 1%
Op profit, €m1 7.2 5.8 3.3 6.0 5.9
Op margin 17.6% 14.5% 9.5% 14.8% 14.6%
Registered actives, ‘000 314 288 266 284 299
Sales /registered actives, € 130.2 138.5 132.6 143.8 135.1
¹Excludes costs accounted for in the segments Manufacturing and Other such as financial expenses, gain/loss on exchange rates,
market support and manufacturing overheads. This is in line with prior years.
Countries
Chile, Colombia, Ecuador, Mexico, Peru.
Development
Local currency sales in the third quarter increased by 1% as a result of a 5% decrease in the number
of registered actives and a 6% increase in productivity. The sales development was significantly
impacted by negative timing of catalogues. Euro sales were down by 1% to €40.4m (€40.9m).
Continued positive development in Mexico, although affected by the earthquakes during the
quarter. Ecuador recorded solid growth while the development in Colombia remained weak due to
the difficult consumer situation in the market.
Operating profit amounted to €5.9m (€7.2m) and operating margin to 14.6% (17.6%). The
operating margin was negatively impacted by exchange rates, partly offset by price increases and
favourable product mix.
Europe & Africa
Key figures
Q3’16 Q4’16 Q1’17 Q2’17 Q3’17
Sales, €m 70.4 95.3 81.3 80.3 70.7
Sales growth in € (1%) (2%) (1%) (1%) 0%
Sales growth in lc 2% 5% 6% 4% 6%
Op profit, €m1 8.9 16.8 10.4 10.4 9.2
Op margin 12.7% 17.7% 12.8% 12.9% 13.0%
Registered actives, ‘000 655 812 802 734 674
Sales /registered actives, € 107.6 117.4 101.4 109.4 104.8
1Excludes costs accounted for in the segments Manufacturing and Other such as financial expenses, gain/loss on exchange rates,
market support and manufacturing overheads. This is in line with prior years.
Countries
Algeria, Bosnia, Bulgaria, Croatia, Czech Rep., Denmark, Egypt, Estonia, Finland, Greece, Holland,
Hungary, Kenya, Kosovo, Latvia, Lithuania, Macedonia, Montenegro, Morocco, Nigeria, Norway,
Poland, Portugal, Romania, Tanzania, Tunisia, Serbia, Slovakia, Slovenia, Spain, Sweden, Uganda, UK/Ireland.
Development
Local currency sales in the third quarter increased by 6%, as a result of a 3% increase in registered
actives and a 3% increase in productivity. Euro sales were stable at €70.7m (€70.4m). Stable sales in
Europe during the quarter, with continued healthy leadership development in Central Europe and
improved performance in Western Europe. Solid underlying growth in Africa driven by Egypt and
Nigeria, although the region continues to be impacted by macroeconomic and exchange rate
challenges.
Operating profit amounted to €9.2m (€8.9m) and operating margin increased to 13.0% (12.7%),
positively impacted by price increases and sales leverage, partly offset by negative currency
movements.

Oriflame Interim report 1 January – 30 September 2017
6
14.2% OPERATING
MARGIN
+23% LC SALES
CIS
Key figures
Q3’16 Q4’16 Q1’17 Q2’17 Q3’17
Sales, €m 67.2 93.9 99.5 92.9 69.9
Sales growth in € (13%) (10%) 15% 19% 4%
Sales growth in lc (3%) (10%) (6%) 6% 4%
Op profit, €m1 5.5 14.0 11.1 9.7 9.9
Op margin 8.1% 14.9% 11.2% 10.5% 14.2%
Registered actives, ‘000 784 926 889 794 698
Sales /registered actives, € 85.7 101.5 111.9 117.0 100.2
¹Excludes costs accounted for in the segments Manufacturing and Other such as financial expenses, gain/loss on exchange rates,
market support and manufacturing overheads. This is in line with prior years.
Countries
Armenia, Azerbaijan, Belarus, Georgia, Kazakhstan, Kyrgyzstan, Moldova, Mongolia, Russia, Ukraine.
Development
Local currency sales in the third quarter increased by 4%, as a result of an increase in productivity
of 16%, partly offset by a 11% decrease in the number of registered actives. Euro sales were up by
4% to €69.9m (€67.2m). Local currency sales in Russia increased by 3%, driven by sustained high
productivity levels. The situation in Ukraine and Kazakhstan improved somewhat, although
continuously impacted by macroeconomic challenges.
Operating profit amounted to €9.9m (€5.5m) and operating margin increased to 14.2% (8.1%),
favourably impacted by exchange rates, realised price increases and product mix. Asia & Turkey
Key figures
Q3’16 Q4’16 Q1’17 Q2’17 Q3’17
Sales, €m 97.5 123.3 118.2 130.3 111.7
Sales growth in € 26% 23% 14% 19% 15%
Sales growth in lc 29% 25% 16% 21% 23%
Op profit, €m1 17.7 27.6 21.1 28.0 22.1
Op margin 18.1% 22.4% 17.8% 21.5% 19.8%
Registered actives, ‘000 895 980 1,034 994 975
Sales /resgistered actives, € 109.0 125.7 114.4 131.1 114.6
¹Excludes costs accounted for in the segments Manufacturing and Other such as financial expenses, gain/loss on exchange rates,
market support and manufacturing overheads. This is in line with prior years.
Countries
China, India, Indonesia, Myanmar, Pakistan, Sri Lanka, Thailand, Turkey, Vietnam.
Development
Third quarter sales growth in local currencies was 23% as a result of a 9% increase in the number
of registered actives and a 13% increase in productivity. Euro sales were up by 15% to €111.7m (€97.5m). The performance in Vietnam was very strong during the quarter and China as well as
Turkey reported healthy growth. The development in India remained weak, partly due to the
topline impact from the Goods and Services Tax, with measures being taken to return to
sustainable growth. The combination of online activity, solid leadership and the focus on Skin Care
and Wellness sets and routines continues to drive the growth in the region.
Operating margin increased to 19.8% (18.1%) and operating profit was €22.1m (€17.7m). The
margin was positively impacted by a favourable geographical mix and timing of campaign offers,
partly offset by negative currency movements and higher selling and marketing expenses.
Oriflame Interim report 1 January – 30 September 2017
7
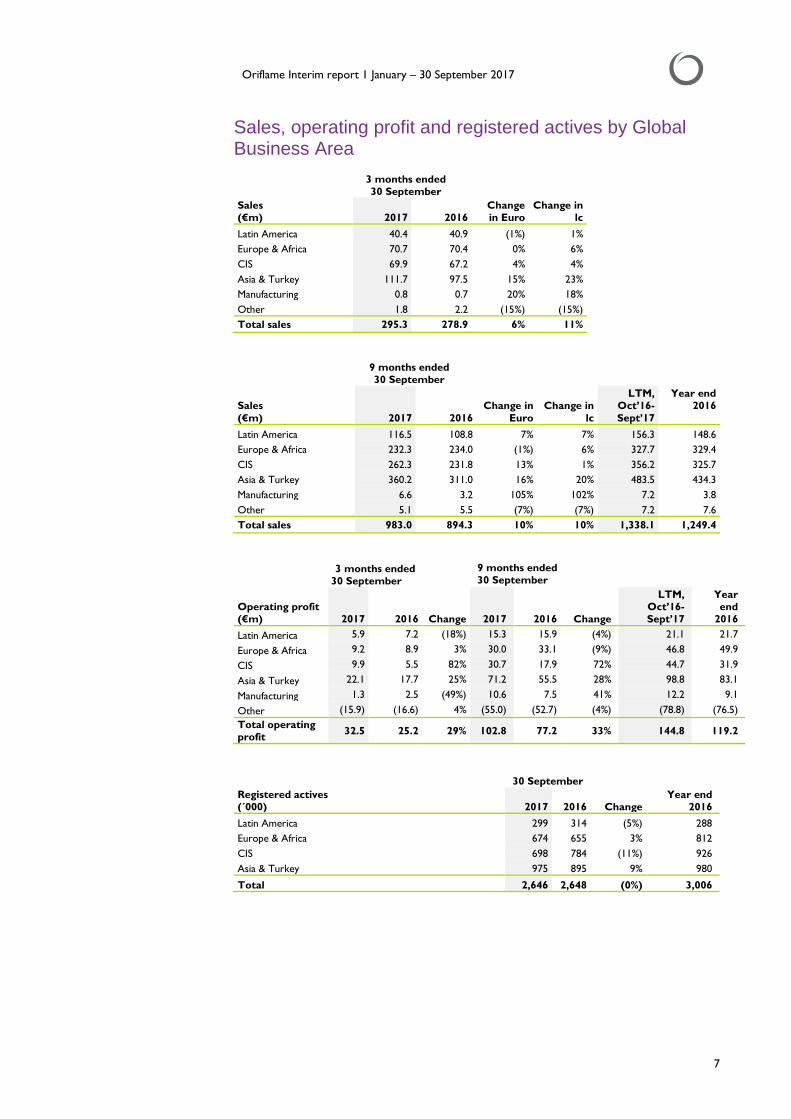
Sales, operating profit and registered actives by Global Business Area
Sales (€m)
3 months ended 30 September
2017 2016 Change in Euro
Change in lc
Latin America 40.4 40.9 (1%) 1%
Europe & Africa 70.7 70.4 0% 6%
CIS 69.9 67.2 4% 4%
Asia & Turkey 111.7 97.5 15% 23%
Manufacturing 0.8 0.7 20% 18%
Other 1.8 2.2 (15%) (15%)
Total sales 295.3 278.9 6% 11%
Sales
(€m)
9 months ended 30 September
2017 2016
Change in
Euro
Change in
lc
LTM, Oct’16-
Sept’17
Year end 2016
Latin America 116.5 108.8 7% 7% 156.3 148.6
Europe & Africa 232.3 234.0 (1%) 6% 327.7 329.4
CIS 262.3 231.8 13% 1% 356.2 325.7
Asia & Turkey 360.2 311.0 16% 20% 483.5 434.3
Manufacturing 6.6 3.2 105% 102% 7.2 3.8
Other 5.1 5.5 (7%) (7%) 7.2 7.6
Total sales 983.0 894.3 10% 10% 1,338.1 1,249.4
Operating profit (€m)
3 months ended 30 September
Change
9 months ended 30 September
2017 2016 2017 2016 Change
LTM, Oct’16- Sept’17
Year end
2016
Latin America 5.9 7.2 (18%) 15.3 15.9 (4%) 21.1 21.7
Europe & Africa 9.2 8.9 3% 30.0 33.1 (9%) 46.8 49.9
CIS 9.9 5.5 82% 30.7 17.9 72% 44.7 31.9
Asia & Turkey 22.1 17.7 25% 71.2 55.5 28% 98.8 83.1
Manufacturing 1.3 2.5 (49%) 10.6 7.5 41% 12.2 9.1
Other (15.9) (16.6) 4% (55.0) (52.7) (4%) (78.8) (76.5)
Total operating profit
32.5 25.2 29% 102.8 77.2 33% 144.8 119.2
Registered actives (´000)
30 September
Change
2017 2016 Year end
2016
Latin America 299 314 (5%) 288
Europe & Africa 674 655 3% 812
CIS 698 784 (11%) 926
Asia & Turkey 975 895 9% 980
Total 2,646 2,648 (0%) 3,006

Oriflame Interim report 1 January – 30 September 2017
8
0.4 NET DEBT AT
HEDGED VALUES
/EBITDA
Cash flow & investments
Cash flow from operating activities in the third quarter amounted to €11.2m (€-5.8m), driven by
higher EBITDA, decrease in provisions and timing of receivables and payables.
Cash flow used in investing activities amounted to €-3.8m (€-2.3m).
Financial position
Net interest-bearing debt at hedged values amounted to €62.2m (€53.8m). The net debt at hedged
values/EBITDA ratio was 0.4 (0.4).
Net interest-bearing debt amounted to €85.4m (€111.8m). The net debt/EBITDA ratio was 0.5
(0.8). Interest cover amounted to 7.7 (7.1) in the quarter and to 8.4 (6.5) during the last twelve
months.
Covenant disclosure
As per the end of the third quarter 2017, the financial measures as defined in the Agreements
relating to the existing Private Placement Notes were as follows:
Consolidated Net Debt to Consolidated EBITDA: 0.4 (covenant at ≤ 3.0 times)
Consolidated EBITDA to Consolidated Finance costs: 16.9 (covenant at ≥ 5.0 times)
Consolidated Net Worth: €212m (covenant at ≥ €120m)
As per the end of the third quarter 2017, the financial measures as defined in the Agreements
relating to the existing Revolving Credit Facility were as follows:
Consolidated Net Debt to Consolidated EBITDA: 0.4 (covenant at ≤ 3.0 times)
Consolidated EBITDA to Consolidated Finance costs: 16.9 (covenant at ≥ 4.0 times)
Note that the definition of these measures differ from the definitions of the Net Debt to EBITDA
and Interest cover disclosed in the other sections of the report, primarily related to gains from
sales of assets and cash in non-OECD markets.
Related parties
There have been no significant changes in the relationships or transactions with related parties
compared with the information given in the Annual Report 2016.
Nomination Committee for the 2018 Annual General Meeting In accordance with Swiss company law the tasks to nominate the chairman of the board, board members and the external auditor as well as appoint the chair of the general meeting are among
the unalienable responsibilities of the Board of Directors. Hence, a nomination committee can only
be constituted among the Company’s board members.
In advance of the 2018 Annual General Meeting the Company has formed a nomination and
governance committee among its board members. The nomination and governance committee
consists of Anders Dahlvig (Chairman) and Alexander af Jochnick. The nomination and governance
committee will contact the Company’s five largest shareholders, as known to the Company, to
obtain input on the nominations. Anyone wishing to contact the nomination committee may do so
via [email protected].
The 2018 Annual General Meeting will be held in Switzerland on 3 May, 2018.
Dividend The AGM held on 9 May 2017 resolved that a dividend of €1.50 per share, of which €1.00 (€0.40)
per share is to be considered as ordinary and €0.50 to be considered as extra dividend, be
distributed out of the capital contribution reserve and paid in four instalments as follows: €0.75 to
the shareholders of record on 15 May 2017, €0.25 to the shareholders of record on 15 August

Oriflame Interim report 1 January – 30 September 2017
9
11% FOURTH QUARTER
TO DATE LC SALES
10% YEAR TO DATE LC
SALES
2017, €0.25 to the shareholders of record on 15 November 2017 and €0.25 to the shareholders of
record on 15 February 2018.
The third instalment of €0.25 per share (record date 15 November 2017) will have expected
payment date 23 November 2017. The last day of trading the share including dividend right is on 13
November 2017 (Ex-Date 14 November).
The fourth instalment of €0.25 per share (record date 15 February 2018) will have expected
payment date 23 February 2018. The last day of trading the share including dividend right is on 13
February 2018 (Ex-Date 14 February).
Significant events during the quarter During the quarter, Oriflame signed a new Revolving Credit Facility amounting to €160m in total.
The new five-year Facility (with two one-year extension options at the banks’ discretion) replaces
the existing €110m Facility (signed in April 2015 and with maturity in 2020).
The Facility will be used for general corporate purposes, primarily to cover for quarterly cash flow
fluctuations within the calendar year.
Personnel The average number of full-time equivalent employees was 6,183 (6,123).
Year to date and fourth quarter update
The year to date sales development is approximately 10% in local currency and the development in
the fourth quarter to date is approximately 11% in local currency.
Long term targets
Oriflame aims to achieve local currency sales growth of approximately 10 percent per annum and
an operating margin of 15 percent.
The business of the Group presents cyclical evolutions and is driven by a number of factors:
• Effectiveness of individual catalogues and product introductions
• Effectiveness and timing of recruitment programmes
• Timing of sales and marketing activities
• The number of effective sales days per quarter
• Currency effect on sales and results
Financial Calendar for 2017/2018 The fourth quarter 2017 report will be published on 15 February 2018
The Annual Report will be published during April 2018, no later than 3 weeks prior to the Annual
General Meeting
The 2018 Annual General Meeting will be held on 3 May 2018
The first quarter 2018 report will be published on 4 May 2018
The second quarter 2018 report will be published on 7 August 2018
The third quarter 2018 report will be published on 7 November 2018
The fourth quarter 2018 report will be published on 14 February 2019

Oriflame Interim report 1 January – 30 September 2017
10
Other A Swedish translation is available on www.oriflame.com.
Conference call for the financial community
The Company will host a conference call on Wednesday, 8 November 2017 at 9.30 CET.
Participant access numbers:
SE: +46856642664
DK: +4535445576
FI: +358981710492
NO: +4723500252
UK: +442030089808
US: +18558315947
The conference call will also be audio web cast in “listen-only” mode through Oriflame’s website:
www.oriflame.com or through http://oriflame-ir.creo.se/171108
November 8, 2017
Magnus Brännström
Chief Executive Officer
This report has not been audited by the company´s auditors.
For further information, please contact:
Magnus Brännström, Chief Executive Officer Tel: +41 798 263 754
Gabriel Bennet, Chief Financial Officer Tel: +41 798 263 769
Nathalie Redmo, Sr. Manager IR Tel: +41 799 220 173
This information is information that Oriflame Holding AG is obliged to make public pursuant to the
EU Market Abuse Regulation. The information was submitted for publication, through the agency of
the contact person set out above, at 07:15 CET on November 8, 2017.
Oriflame Holding AG
Bleicheplatz 3, CH-8200 Schaffhausen, Switzerland www.oriflame.com
Company registration no CHE-134.446.883

Oriflame Interim report 1 January – 30 September 2017
11
Consolidated key figures 3 months ended
30 September
9 months ended
30 September
2017 2016 2017 2016
LTM, Oct’16-
Sept’17
Year end
2016
Gross margin, % 73.8 70.4 72.7 70.5 72.3 70.7
EBITDA margin, % 13.6 11.0 13.1 11.1 13.3 11.9
Operating margin, % 11.0 9.0 10.5 8.6 10.8 9.5
Return on:
- operating capital, % - - 51.1 32.4 51.1 38.0
- capital employed, % - - 35.6 25.7 35.6 26.7
Net debt at hedged values / EBITDA (LTM) 0.4 0.4 0.4 0.4 0.4 0.1
Net debt / EBITDA (LTM) 0.5 0.8 0.5 0.8 0.5 0.6
Interest cover 7.7 7.1 9.4 6.5 8.4 6.6
Average no. of full-time equivalent employees 6,183 6,123 6,244 6,248 6,231 6,233
Definitions Operating capital
Total assets less cash and cash equivalents and non interest-bearing liabilities, including deferred tax liabilities.
Return on operating capital
Operating profit divided by average operating capital.
Capital employed
Total assets less non interest-bearing liabilities, including deferred tax liabilities.
Return on capital employed
Operating profit plus interest income divided by average capital employed.
Net interest-bearing debt
Interest-bearing debt excluding front fees less cash and cash equivalents.
Interest cover
Operating profit plus interest income divided by interest expenses and charges.
Net interest-bearing debt to EBITDA
Net interest-bearing debt divided by EBITDA.
EBITDA
Operating profit before financial items, taxes, depreciation, amortisation and share incentive plan.

Oriflame Interim report 1 January – 30 September 2017
12
Quarterly Figures
Financial summary Q2’16 Q3’16 Q4’16 Q1’17 Q2’17 Q3’17
Sales, €m 309.6 278.9 355.1 340.1 347.6 295.3
Gross margin, % 71.5 70.4 71.2 71.6 72.9 73.8
EBITDA, €m 40.6 30.8 49.0 40.4 47.9 40.0
Operating profit, €m 30.8 25.2 42.0 29.8 40.5 32.5
Operating margin, % 9.9 9.0 11.8 8.8 11.7 11.0
Net profit before income tax, €m 27.1 20.4 37.3 27.4 29.7 24.8
Net profit, €m 18.1 12.7 25.2 19.5 19.9 17.4
EPS, diluted € 0.32 0.23 0.44 0.34 0.35 0.30
Cash flow from op. activities, €m 35.8 (5.8) 61.7 (1.5) 33.9 11.2
Net interest-bearing debt, €m 106.5 111.8 82.3 92.7 82.4 85.4
Registered actives, ‘000 2,862 2,648 3,006 2,991 2,806 2,646
Sales, €m Q2’16 Q3’16 Q4’16 Q1’17 Q2’17 Q3’17
Latin America 38.5 40.9 39.8 35.3 40.9 40.4
Europe & Africa 81.2 70.4 95.3 81.3 80.3 70.7
CIS 78.0 67.2 93.9 99.5 92.9 69.9
Asia & Turkey 109.5 97.5 123.3 118.2 130.3 111.7
Manufacturing 0.4 0.7 0.6 4.5 1.4 0.8
Other 2.0 2.2 2.2 1.3 1.8 1.8
Oriflame 309.6 278.9 355.1 340.1 347.6 295.3
Operating Profit, €m Q2’16 Q3’16 Q4’16 Q1’17 Q2’17 Q3’17
Latin America 6.1 7.2 5.8 3.3 6.0 5.9
Europe & Africa 12.4 8.9 16.8 10.4 10.4 9.2
CIS 5.2 5.5 14.0 11.1 9.7 9.9
Asia & Turkey 23.1 17.7 27.6 21.1 28.0 22.1
Manufacturing 1.6 2.5 1.6 4.9 4.4 1.3
Other (17.6) (16.6) (23.8) (21.0) (18.0) (15.9)
Oriflame 30.8 25.2 42.0 29.8 40.5 32.5
Registered actives, ‘000 Q2’16 Q3’16 Q4’16 Q1’17 Q2’17 Q3’17
Latin America 286 314 288 266 284 299
Europe & Africa 740 655 812 802 734 674
CIS 913 784 926 889 794 698
Asia & Turkey 923 895 980 1,034 994 975
Oriflame 2,862 2,648 3,006 2,991 2,806 2,646
Operating Margin, % Q2’16 Q3’16 Q4’16 Q1’17 Q2’17 Q3’17
Latin America 15.8 17.6 14.5 9.5 14.8 14.6
Europe & Africa 15.2 12.7 17.7 12.8 12.9 13.0
CIS 6.7 8.1 14.9 11.2 10.5 14.2
Asia & Turkey 21.1 18.1 22.4 17.8 21.5 19.8
Oriflame 9.9 9.0 11.8 8.8 11.7 11.0
€ Sales Growth in % Q2’16 Q3’16 Q4’16 Q1’17 Q2’17 Q3’17
Latin America 8 16 12 20 6 (1)
Europa & Africa 3 (1) (2) (1) (1) 0
CIS (20) (13) (10) 15 19 4
Asia & Turkey 26 26 23 14 19 15
Oriflame 3 6 5 11 12 6
Cash Flow, €m Q2’16 Q3’16 Q4’16 Q1’17 Q2’17 Q3’17
Operating cash flow 35.8 (5.8) 61.7 (1.5) 33.9 11.2
Cash flow used in investing activities (3.3) (2.3) (4.6) (3.0) (3.0) (3.8)
Oriflame Interim report 1 January – 30 September 2017
13
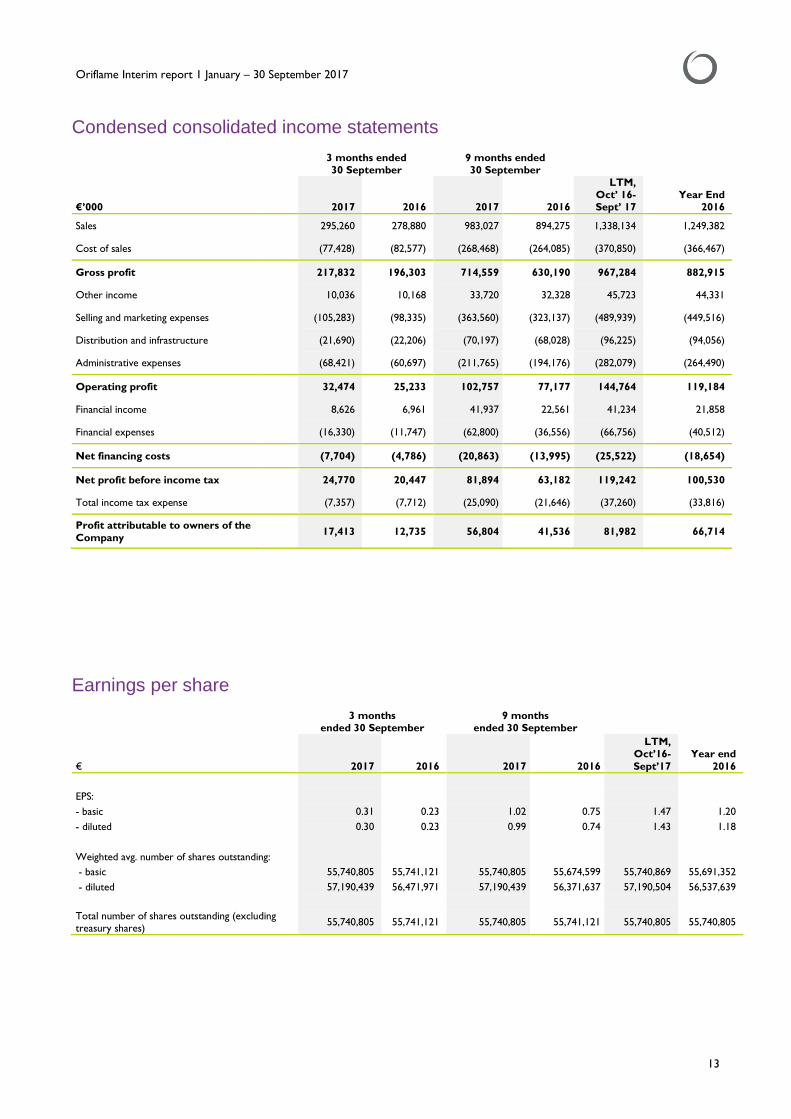
Condensed consolidated income statements
Earnings per share
€
3 months ended 30 September
9 months ended 30 September
2017 2016 2017 2016
LTM, Oct’16-
Sept’17
Year end
2016
EPS:
- basic 0.31 0.23 1.02 0.75 1.47 1.20
- diluted 0.30 0.23 0.99 0.74 1.43 1.18
Weighted avg. number of shares outstanding:
- basic 55,740,805 55,741,121 55,740,805 55,674,599 55,740,869 55,691,352
- diluted 57,190,439 56,471,971 57,190,439 56,371,637 57,190,504 56,537,639
Total number of shares outstanding (excluding treasury shares)
55,740,805 55,741,121 55,740,805 55,741,121 55,740,805 55,740,805
3 months ended 30 September
9 months ended 30 September
€’000 2017 2016 2017 2016
LTM, Oct’ 16- Sept’ 17
Year End 2016
Sales 295,260 278,880 983,027 894,275 1,338,134 1,249,382
Cost of sales (77,428) (82,577) (268,468) (264,085) (370,850) (366,467)
Gross profit 217,832 196,303 714,559 630,190 967,284 882,915
Other income 10,036 10,168 33,720 32,328 45,723 44,331
Selling and marketing expenses (105,283) (98,335) (363,560) (323,137) (489,939) (449,516)
Distribution and infrastructure (21,690) (22,206) (70,197) (68,028) (96,225) (94,056)
Administrative expenses (68,421) (60,697) (211,765) (194,176) (282,079) (264,490)
Operating profit 32,474 25,233 102,757 77,177 144,764 119,184
Financial income 8,626 6,961 41,937 22,561 41,234 21,858
Financial expenses (16,330) (11,747) (62,800) (36,556) (66,756) (40,512)
Net financing costs (7,704) (4,786) (20,863) (13,995) (25,522) (18,654)
Net profit before income tax 24,770 20,447 81,894 63,182 119,242 100,530
Total income tax expense (7,357) (7,712) (25,090) (21,646) (37,260) (33,816)
Profit attributable to owners of the
Company 17,413 12,735 56,804 41,536 81,982 66,714

Oriflame Interim report 1 January – 30 September 2017
14
Condensed consolidated statements of comprehensive income
€’000
3 months ended 30 September
9 months ended 30 September
2017 2016 2017 2016
LTM,
Oct’16- Sept’ 7
Year end 2016
Profit attributable to owners of the
Company 17,413 12,735 56,804 41,536 81,982 66,714
Other comprehensive income
Items that will not be reclassified subsequently to profit or loss:
Remeasurements of net defined benefit
liability, net of tax - - 110 (837) 631 (316)
Revaluation reserve for property, plant & equipment
- 129 - (82) (148) (230)
Total items that will not be reclassified subsequently to profit or loss
- 129 110 (919) 483 (546)
Items that are or may be reclassified subsequently to profit or loss:
Foreign currency translation differences
for foreign operations (5,662) (906) (12,579) 1,369 (1,649) 12,299
Effective portion of changes in fair value of cash flow hedges, net of tax
2 571 2,776 (2,390) 2,447 (2,719)
Total items that are or may be reclassified subsequently to profit or
loss
(5,660) (335) (9,803) (1,021) 798 9,580
Other comprehensive income for
the period, net of tax (5,660) (206) (9,693) (1,940) 1,281 9,034
Total comprehensive income for the
period attributable to owners of the Company
11,753 12,529 47,111 39,596 83,263 75,748
Oriflame Interim report 1 January – 30 September 2017
15
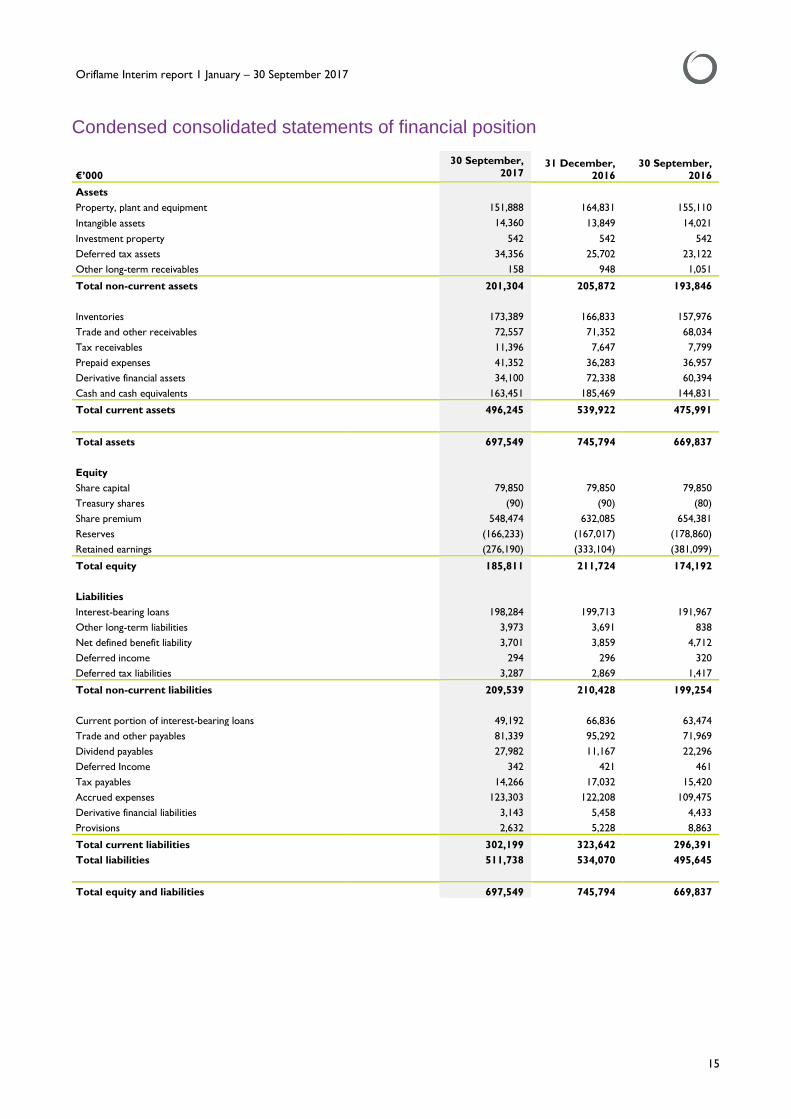
Condensed consolidated statements of financial position
€’000
30 September,
2017 31 December,
2016 30 September,
2016
Assets
Property, plant and equipment 151,888 164,831 155,110
Intangible assets 14,360 13,849 14,021
Investment property 542 542 542
Deferred tax assets 34,356 25,702 23,122
Other long-term receivables 158 948 1,051
Total non-current assets 201,304 205,872 193,846
Inventories 173,389 166,833 157,976
Trade and other receivables 72,557 71,352 68,034
Tax receivables 11,396 7,647 7,799
Prepaid expenses 41,352 36,283 36,957
Derivative financial assets 34,100 72,338 60,394
Cash and cash equivalents 163,451 185,469 144,831
Total current assets 496,245 539,922 475,991
Total assets 697,549 745,794 669,837
Equity
Share capital 79,850 79,850 79,850
Treasury shares (90) (90) (80)
Share premium 548,474 632,085 654,381
Reserves (166,233) (167,017) (178,860)
Retained earnings (276,190) (333,104) (381,099)
Total equity 185,811 211,724 174,192
Liabilities
Interest-bearing loans 198,284 199,713 191,967
Other long-term liabilities 3,973 3,691 838
Net defined benefit liability 3,701 3,859 4,712
Deferred income 294 296 320
Deferred tax liabilities 3,287 2,869 1,417
Total non-current liabilities 209,539 210,428 199,254
Current portion of interest-bearing loans 49,192 66,836 63,474
Trade and other payables 81,339 95,292 71,969
Dividend payables 27,982 11,167 22,296
Deferred Income 342 421 461
Tax payables 14,266 17,032 15,420
Accrued expenses 123,303 122,208 109,475
Derivative financial liabilities 3,143 5,458 4,433
Provisions 2,632 5,228 8,863
Total current liabilities 302,199 323,642 296,391
Total liabilities 511,738 534,070 495,645
Total equity and liabilities 697,549 745,794 669,837

Oriflame Interim report 1 January – 30 September 2017
16
Condensed consolidated statements of changes in equity
€’000
Share capital
Treasury shares
Share premium
Reserves
Retained earnings
Total equity
At 1 January 2016 79,788 (621) 654,381 (178,675) (401,416) 153,457
Net profit - - - - 41,536 41,536
Other comprehensive income, net of tax
- - - (1,103) (837) (1,940)
Total comprehensive income for the period
- - - (1,103) 40,699 39,596
Issue of ordinary shares in
relation to share incentive plan
62 - - (862) 800 -
Treasury shares used in relation to share incentive plan
- 541 - (1,655) 1,114 -
Share incentive plan - - - 3,435 - 3,435
Dividends - - - - (22,296) (22,296)
Total contributions and
distributions
62 541 - 918 (20,382) (18,861)
At 30 September 2016 79,850 (80) 654,381 (178,860) (381,099) 174,192
At 1 January 2017 79,850 (90) 632,085 (167,017) (333,104) 211,724
Net profit - - - - 56,804 56,804
Other comprehensive income,
net of tax - - - (9,803) 110 (9,693)
Total comprehensive income for the period
- - - (9,803) 56,914 47,111
Share incentive plan - - - 10,587 - 10,587
Dividends - - (83,611) - - (83,611)
Total contributions and
distributions - - (83,611) 10,587 - (73,024)
At 30 September 2017 79,850 (90) 548,474 (166,233) (276,190) 185,811

Oriflame Interim report 1 January – 30 September 2017
17
Condensed consolidated statements of cash flows
€’000
3 months ended
30 September
9 months ended
30 September
Note 2017 2016 2017 2016
Operating activities
Net profit before income tax 24,770 20,447 81,894 63,182
Adjustments for:
Depreciation of property, plant and equipment 4,234 4,569 13,399 13,598
Amortisation of intangible assets 391 427 1,224 2,437
Change in fair value of borrowings and derivatives financial instruments 932 (196) (106) 2,862
Deferred income (7) 48 (75) (357)
Impairment - - 347 2,473
Share incentive plan 2,934 586 10,587 3,435
Unrealised exchange rate differences 1,514 1,050 6,128 (10,399)
Profit on disposal of property, plant and equipment, intangible assets 96 (711) (900) (780)
Financial income (2,790) (4,158) (10,176) (12,996)
Financial expenses 5,856 5,644 16,149 18,489
Operating profit before changes in working capital and provisions 37,930 27,706 118,471 81,944
Increase in trade and other receivables, prepaid expenses and derivative financial assets (6,303) (4,627) (5,884) (5,483)
(Increase)/decrease in inventories (11,790) (15,155) (14,395) 11,445
Increase/(decrease) in trade and other payables, accrued expenses and derivatives
financial liabilities 3,574 (1,602) (7,504) 1,163
Decrease in provisions (150) (2,226) (2,606) (5,494)
Cash generated from operations 23,261 4,096 88,082 83,575
Interest received 3,410 3,856 11,877 14,021
Interest and bank charges paid (5,751) (4,799) (17,099) (19,539)
Income taxes paid (9,712) (8,990) (39,197) (26,634)
Cash flow from operating activities 11,208 (5,837) 43,663 51,423
Investing activities
Proceeds on sale of property, plant and equipment, intangible assets 90 873 1,993 1,097
Purchases of property, plant, equipment (3,266) (2,600) (10,021) (6,706)
Purchases of intangible assets (579) (566) (1,683) (1,630)
Cash flow used in investing activities (3,755) (2,293) (9,711) (7,239)
Financing activities
Proceeds from borrowings - - 105,000 -
Repayments of borrowings - (9,980) (86,471) (72,013)
Decrease of finance lease liabilities - (0) - (4)
Dividends paid (13,974) (0) (66,838) (0)
Cash flow used in financing activities (13,974) (9,980) (48,309) (72,017)
Change in cash and cash equivalents (6,521) (18,110) (14,357) (27,833)
Cash and cash equivalents at the beginning of the period net of bank overdrafts 173,146 163,528 185,365 176,384
Effect of exchange rate fluctuations on cash held (3,176) (644) (7,559) (3,777)
Cash and cash equivalents at the end of the period net of bank overdrafts 163,449 144,774 163,449 144,774

Oriflame Interim report 1 January – 30 September 2017
18
Notes to the condensed consolidated interim financial statements of Oriflame Holding AG
Note 1 • Status and principal activity
Oriflame Holding AG (“OHAG” or the “Company”) is a holding company incorporated in Switzerland and registered at Bleicheplatz 3, CH-8200 Schaffhausen. The principal activity of the Company’s subsidiaries is the direct sale of cosmetics. The condensed consolidated interim financial statements (‘interim financial statements’) of the Company as at and for the nine months ended 30 September 2017 comprise the Company and its subsidiaries
(together referred to as the “Group”).
Note 2 • Basis of preparation and summary of significant accounting policies
Statement of compliance The condensed consolidated interim financial statements for the nine months period ended 30 September 2017 have been prepared by management in accordance with the measurement and recognition principles of IFRS “Interim Financial Reporting” and should be read in conjunction with the consolidated financial statements of the Group as at and for the year ended 31 December 2016. The condensed consolidated interim financial statements
were authorised for issue by the Directors on 7 November 2017.
Significant accounting policies, use of judgements and estimates The accounting policies, significant judgements and key sources of estimation uncertainty applied by the Group in these interim financial statements are the same as those applied by the Group in its consolidated financial statements as at and for the year ended 31 December 2016.
New or amended IFRS standards
The new or amended IFRS standards, which became effective 1 January 2017, have had no material effect on the interim financial statements.