11-123-1 23 Performance Evaluation for Decentralized Operations Student Version.
35
11-1 23-1 23 Performance Evaluation for Decentralized Operations Student Version
-
Upload
adelia-mathews -
Category
Documents
-
view
215 -
download
0
Transcript of 11-123-1 23 Performance Evaluation for Decentralized Operations Student Version.

11-123-1
23
Performance Evaluation for Decentralized
Operations
Student Version
11-223-2
1
Describe the advantages and disadvantages of decentralized operations.
23-2
11-323-3
In a decentralized company, managers of separate divisions or units are delegated operating responsibility. The division (unit) managers are responsible for planning and controlling the operations of their divisions.
Decentralized Operations
1
11-423-4
Responsibility accounting is the process of measuring and reporting operating data by responsibility centers. Three common types of responsibility centers are—• Cost centers• Profit centers• Investment centers
1
11-523-5
2
Prepare a responsibility accounting report for a cost center.
23-5
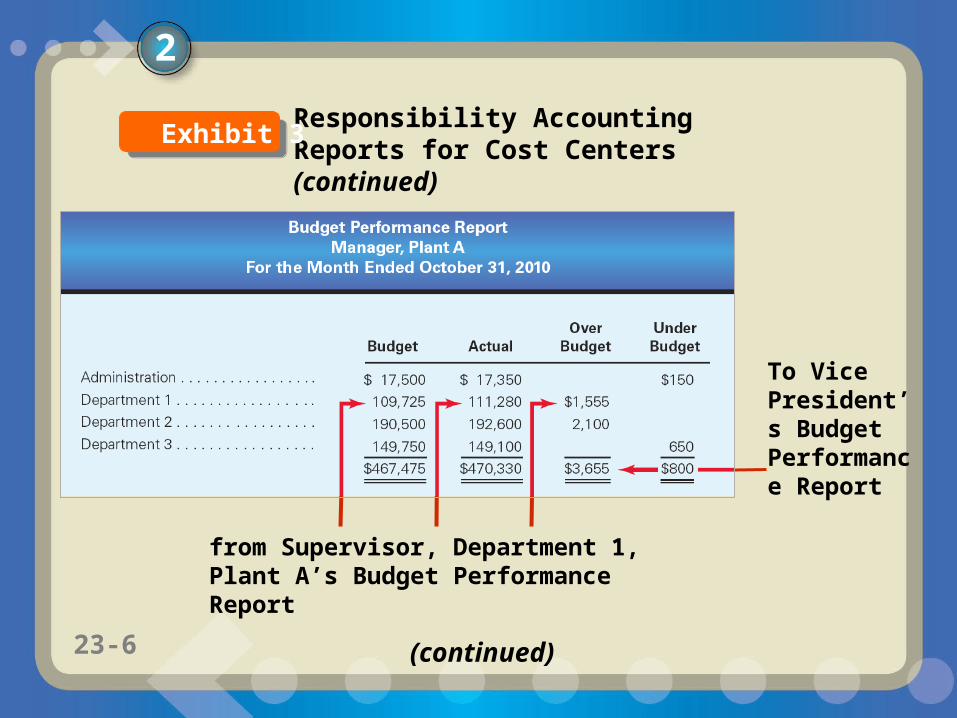
11-623-6
To Vice President’s Budget Performance Report
from Supervisor, Department 1, Plant A’s Budget Performance Report
(continued)
Responsibility Accounting Reports for Cost Centers (continued)
Exhibit 3
2

11-723-7
To Manager, Plant A’s Budget Performance Report
Responsibility Accounting Reports for Cost Centers (concluded)
Exhibit 3
2
11-823-8
3
Prepare responsibility accounting reports for a profit center.
23-8

11-923-9
In a profit center, the unit manager has the responsibility and the authority to make decisions that affect both costs and revenues (and thus profits).
Profit Center
3
11-1023-10
Service Department Charges
Services provided by internal centralized service departments are often more efficient than services contracted with outside providers. An internal service cost is called a service department charge.
3

11-1123-11
Profit Center Reporting
The income from operations is a measure of a manager’s performance. In evaluating the profit center manager, the income from operations should be compared over time to a budget. However, it should not be compared across profit centers.
3
11-1223-12
4
Compute and interpret the rate of return on investment, the residual income, and the balanced scorecard for an investment center.
23-12

11-1323-13
An investment center manager has the responsibility and the authority to make decisions that affect not only costs and revenues, but also the assets invested in the center.
4
Investment Center

11-1423-14
Revenues
Revenues
4

11-1523-15
Investment Turnover
Profit Margin
Profit$$$
4

11-1623-16
Investment Turnover
Profit Margin
Profit margin is the ratio of income from operations to sales
4

11-1723-17
Investment turnover is the ratio of sales to invested assets
Investment Turnover
4
11-1823-18
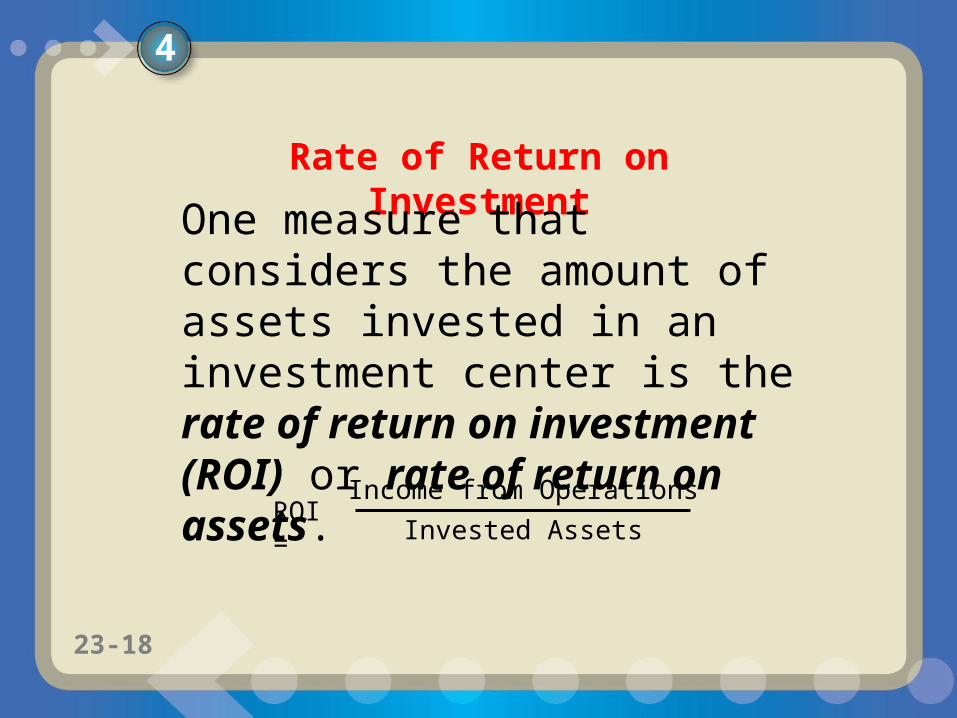
Rate of Return on Investment
One measure that considers the amount of assets invested in an investment center is the rate of return on investment (ROI) or rate of return on assets.
ROI =
Income from Operations
Invested Assets
4

11-1923-19
Income from Operations
SalesSales
Invested Assets×ROI =
DuPont Formula
Profit Margin
Profit Margin
Investment Turnover
Investment Turnover
4
11-2023-20
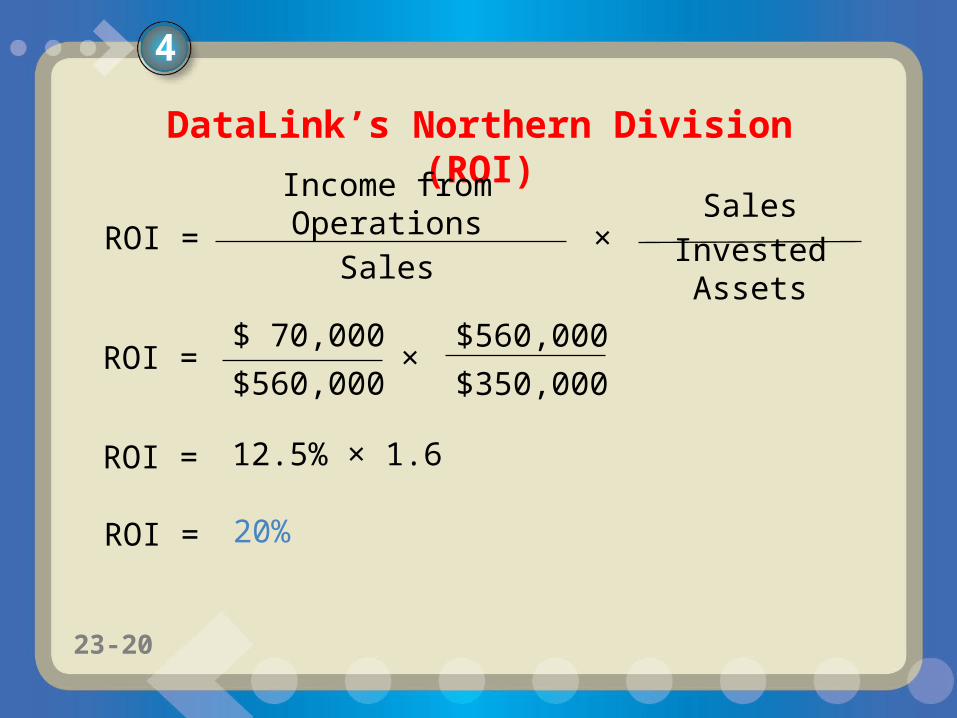
ROI =$ 70,000
$560,000×
$560,000
$350,000
ROI = 12.5% × 1.6
DataLink’s Northern Division (ROI)
Income from Operations
SalesSales
Invested Assets×ROI =
ROI = 20%
4
11-2123-21
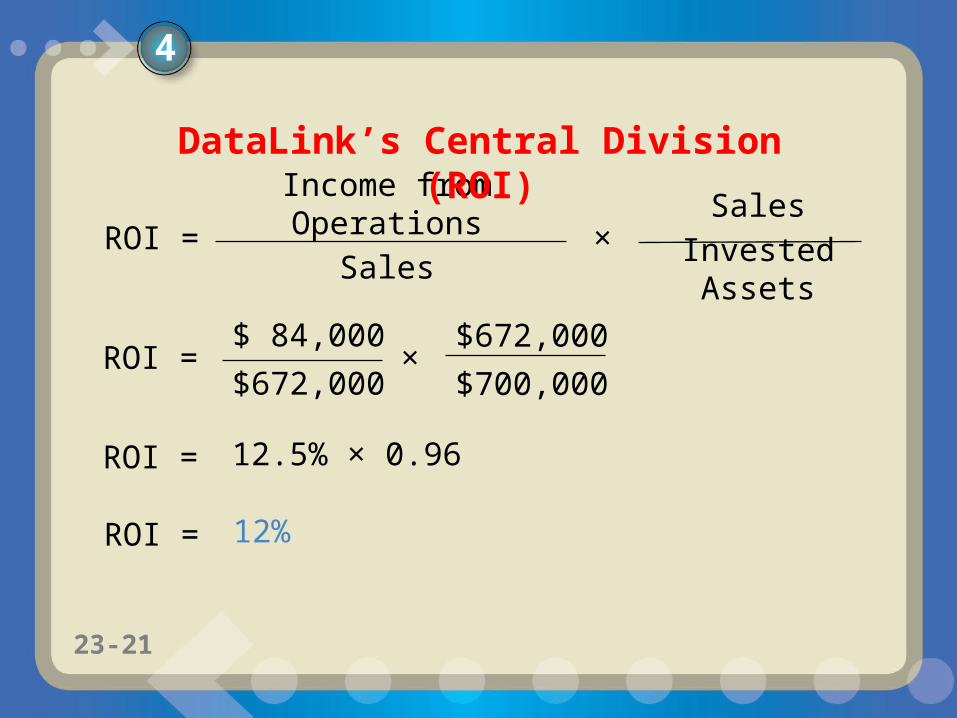
ROI =$ 84,000
$672,000×
$672,000
$700,000
ROI = 12.5% × 0.96
Income from Operations
SalesSales
Invested Assets×ROI =
ROI = 12%
DataLink’s Central Division (ROI)
4

11-2223-22
ROI =$ 75,000
$750,000×
$750,000
$500,000
ROI = 10% × 1.5
Income from Operations
SalesSales
Invested Assets×ROI =
ROI = 15%
DataLink’s Southern Division (ROI)
4

11-2323-23
DataLink’s Northern Division Proposal
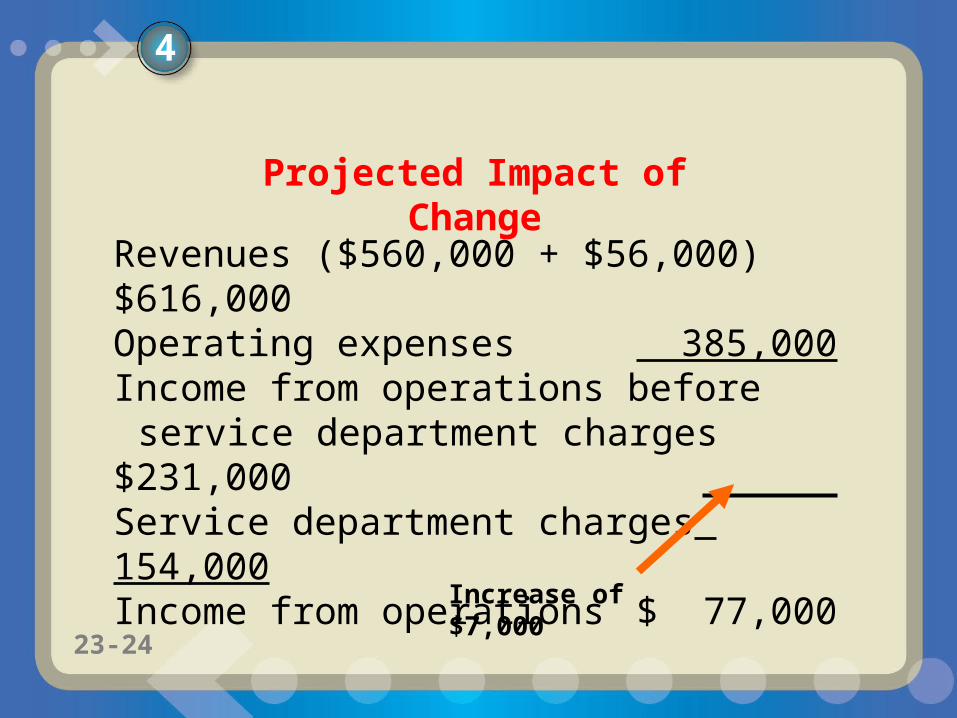
Assume that the revenues of the Northern Division could be increased by $56,000 through increasing advertising to $385,000.
4
11-2423-24
Revenues ($560,000 + $56,000) $616,000Operating expenses 385,000Income from operations before
service department charges $231,000Service department charges 154,000Income from operations $ 77,000
Projected Impact of Change
Increase of $7,000
4

11-2523-25
ROI =$ 77,000
$616,000×
$616,000
$350,000
ROI = 12.5% × 1.76
DataLink’s Northern Division (ROI) Revised
Income from Operations
SalesSales
Invested Assets×ROI =
ROI = 22%
4
11-2623-26
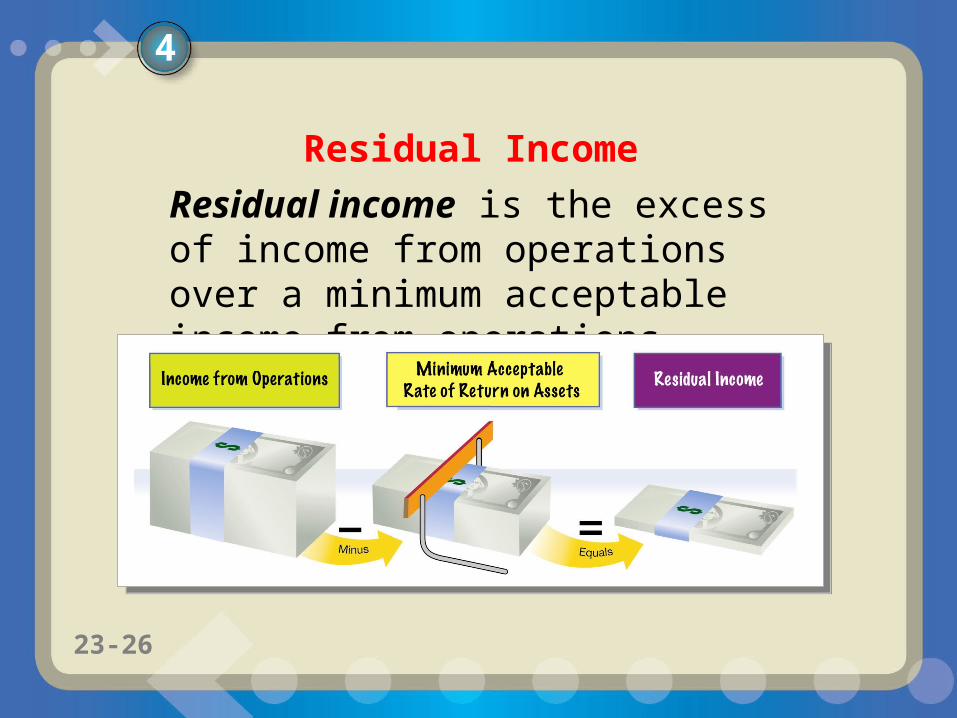
Residual Income
Residual income is the excess of income from operations over a minimum acceptable income from operations.
4
11-2723-27
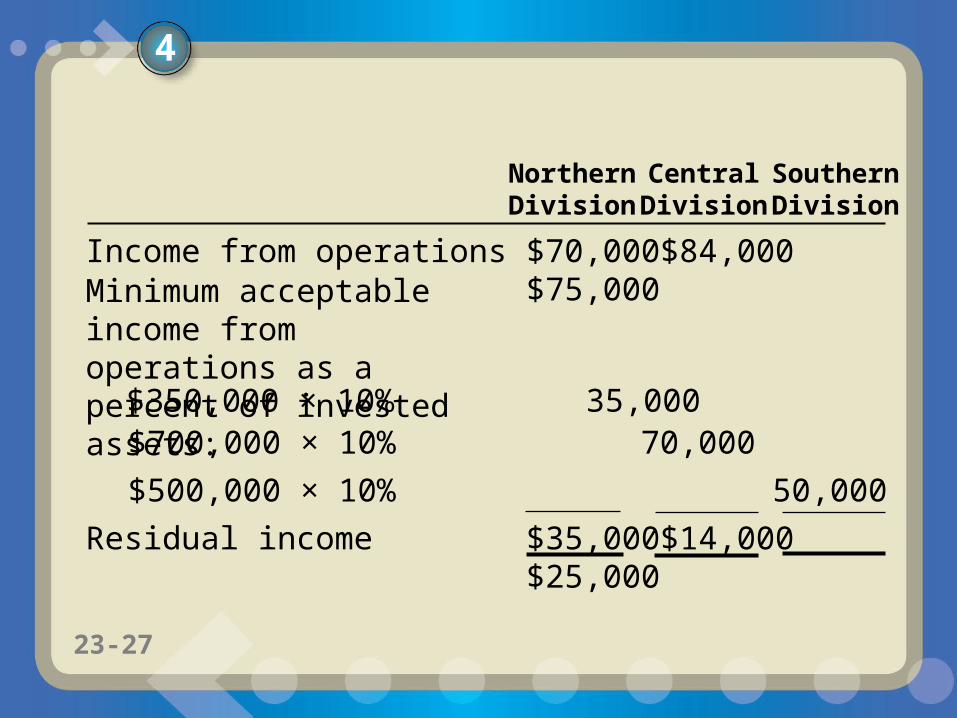
Northern Central SouthernDivision Division Division
Income from operations $70,000 $84,000$75,000Minimum acceptable income
from operations as a percent of invested assets:
$700,000 × 10% 70,000
$500,000 × 10% 50,000
Residual income $35,000 $14,000$25,000
$350,000 × 10% 35,000
4
11-2823-28
The balanced scorecard is a set of financial and nonfinancial measures that reflect multiple performance dimensions of a business.
The Balanced Scorecard
4
11-2923-29
5
Describe and illustrate how the market price, negotiated price, and cost price approaches to transfer pricing may be used by decentralized segments of a business.
23-29

11-3023-30
When divisions transfer products or render services to each other, a transfer price is used to charge for the products or services.
Transfer Pricing
5

11-3123-31
Market Price Approach
Using the market price approach, the transfer price is the price at which the product or service transferred could be sold to outside buyers.
5
11-3223-32
The negotiated price approach allows the managers of decentralized units to agree (negotiate) among themselves as to the transfer price.
Negotiated Price Approach
5
11-3323-33
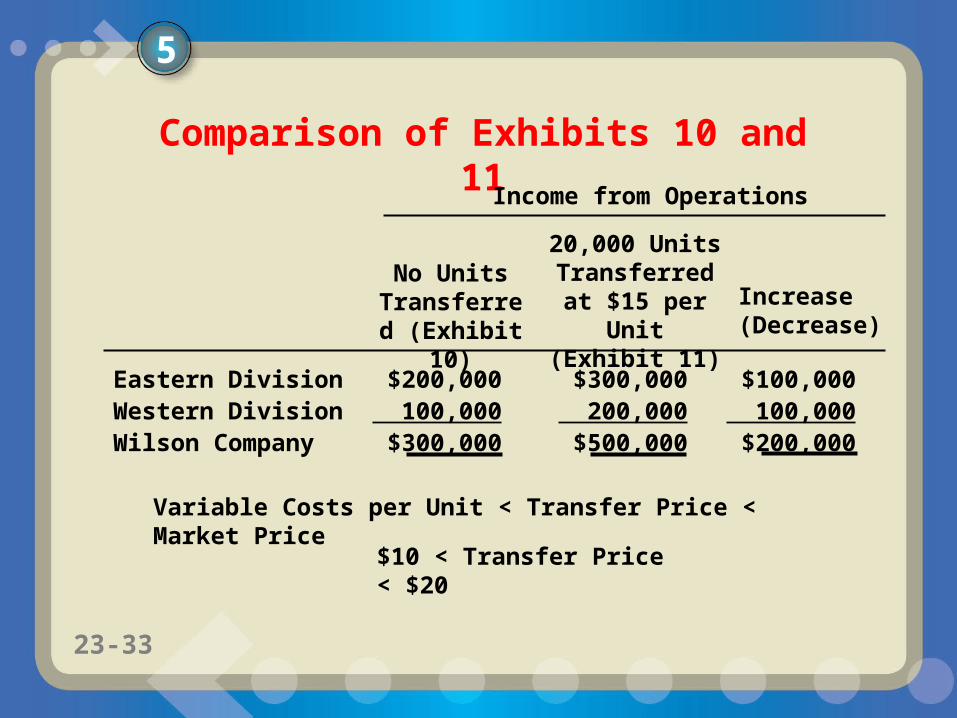
Comparison of Exhibits 10 and 11
Income from Operations
No Units Transferred (Exhibit 10)
20,000 Units Transferred at $15 per Unit (Exhibit 11)
Increase (Decrease)
Eastern Division $200,000 $300,000 $100,000Western Division 100,000 200,000 100,000Wilson Company $300,000 $500,000 $200,000
Variable Costs per Unit < Transfer Price < Market Price
$10 < Transfer Price < $20
5

11-3423-34
Cost Price Approach
Under the cost price approach, cost is used to set transfer prices. Cost may refer to either total product cost per unit or variable cost per unit.
5

11-3523-35