
10869-00 BEC1-Cover.qxd 3/13/08 10:33 AM Page C1 Building Evaluation Capacity · ·...
36
Building Evaluation Capacity Beatriz Chu Clewell Patricia B. Campbell Designing a Cross-Project Evaluation GUIDE I JANUARY 2008
Transcript of 10869-00 BEC1-Cover.qxd 3/13/08 10:33 AM Page C1 Building Evaluation Capacity · ·...

Building Evaluation Capacity
Beatriz Chu Clewell
Patricia B. Campbell
Designing a Cross-Project EvaluationG U I D E I
JANUARY 2008
10869-00_BEC1-Cover.qxd 3/13/08 10:33 AM Page C1

Building Evaluation Capacity
Beatriz Chu Clewell and Patricia B. Campbell
Designing a Cross-Project EvaluationG U I D E I
JANUARY 2008
THE URBAN INSTITUTE
Inputs
What isinvested
What isdone
Whatresults
Outputs Outcomes/Impacts
10869-01_BEC1_redo.qxd 3/13/08 10:33 AM Page i

The Urban Institute’s Program for Evaluation and Equity Research (PEER) focuses on education research. PEER staff conduct studies in the fields of educational attainment, educational access, minorities in mathematics
and science, teacher education, teacher recruitment and retention, and educational assessments.
This report was prepared for the National Science Foundation Directorate for Education and Human Resources (EHR) and supported by REC-0231644.
Copyright © February 2008. The Urban Institute. All rights reserved. Except for short quotes, no part of this reportmay be reproduced or utilized in any form or by any means, electronic or mechanical, including photocopying,recording, or by information storage or retrieval system, without written permission from the Urban Institute.
The Urban Institute is a nonprofit, nonpartisan policy research and educational organization that examines the social, economic, and governance problems facing the nation. The views expressed are those of the authors and
should not be attributed to the National Science Foundation or to the Urban Institute, its trustees, or its funders.
10869-01_BEC1_redo.qxd 3/13/08 10:33 AM Page ii

iii
CONTENTS
Acknowledgments iv
Introduction 1
Identifying Program Goals 4
Constructing a Logic Model 7
Evaluation Focus and Questions 9
Measurement Strategies 11
Conclusion 16
Notes 17
References 17
Appendix A. Description of Programs 18
Appendix B. Indicators for Programs 20
Appendix C. Published Instruments 27
Appendix D. Demographic Variables 29
10869-01_BEC1_redo.qxd 3/13/08 10:33 AM Page iii

AcknowledgmentsThe authors wish to acknowledge the assistance of the many evaluator colleagues, agencystaff, and grantees who contributed to these guides. The nine members of the Delphipanel, expert evaluators all, who participated in the process of identifying key indicatorsand measures for the selected programs, deserve our heartfelt thanks. Because one of thecharacteristics of the Delphi technique is that panel members retain their anonymity, wecannot reveal their identities. Program officers in the Division of Human ResearchDevelopment at the National Science Foundation, the Division of Minority Opportunitiesin Research at the National Institutes of Health, and the GE Foundation provided valu-able input and feedback to the guides. Principal investigators and project staff of thegrantee projects featured in the guides—ADVANCE, AGEP, LSAMP, MARC, MBRS, andMath Excellence—participated in interviews and focus groups that gave us an on theground look at the cross-project evaluation process from the perspective of the grantees.Marsha Matyas, of the American Physiological Society, and Jason Kim, of SystemicResearch, advisors to the project, guided our early efforts. Bernice Anderson and ElmimaJohnson, of the National Science Foundation, reviewed the draft guides and were instru-mental in helping us enhance their usefulness to funding agencies. Kathy Zantal-Weinerreviewed the final draft of the manuscript and provided good suggestions for improvingthe guides’ appeal to evaluators.
Last, but not least, we wish to thank the members of our project team: MatthewBuettgens, Laurie Forcier, Nicole Deterding, and Nicole Young, all formerly of the UrbanInstitute and Lesley Perlman and Rosa Carson, formerly of Campbell-Kibler Associates,who contributed substantively to the development and production of the guides. WillBradbury of the Urban Institute was, as always, extremely helpful in overseeing the edit-ing and production process.
iv
10869-01_BEC1_redo.qxd 3/13/08 10:33 AM Page iv

Building Evaluation CapacityDesigning a Cross-Project Evaluation—Guide I
The national trend toward increasing accountability of the public sector, which gaverise to the enactment in 1993 of the Government Performance and Results Act
(GPRA), has placed added emphasis on the ability of public agencies to report accuratelyand consistently on performance and results. The more recent No Child Left Behind Act,with its calls for scientific evidence in education research, and the current CampbellCollaborative, which seeks to improve social science research through a focus on randomassignment in studies in social, behavioral, and educational arenas, indicate this trend isgrowing. Evaluation capacity building (ECB), as a system for enabling organizations andagencies—both public and private—to develop the mechanisms and structure to facili-tate evaluation to meet accountability requirements, is a concept whose time has come.
One important way ECB differs from mainstream evaluation is that ECB is continu-ous and sustained rather than episodic. Other characteristics are that it is context-dependent; operates on multiple levels; is flexible in responding to multiple purposes, requiring continuous adjustments and refinements; and requires a variety of evaluationapproaches and methodologies (Stockdill, Baizerman, and Compton 2002).
The goal of this project was to develop a model to build evaluation capacity in threeorganizations: the National Science Foundation (NSF), the National Institutes of Health(NIH), and the GE Foundation. More specifically, the project’s intent was to test the fea-sibility of developing models to facilitate the collection of cross-project evaluation datafor programs within these organizations that focus on increasing the diversity of theSTEM workforce. To facilitate the standardization of the model, we chose programs witha similar goal: increasing the participation and success of underrepresented groups1 inSTEM fields of study and careers. A description of each program used to test the modelappears in appendix A.
Building Evaluation Capacity 1
ECB [Evaluation Capacity Building] is the intentional work to continuously create and sus-tain overall organizational processes that make quality evaluation and its uses routine.(Stockdill, Baizerman, and Compton 2002, 14).
10869-01_BEC1_redo.qxd 3/13/08 10:33 AM Page 1

Why Cross-Project Evaluation?Several government agencies as well as private foundationstarget broad programmatic areas for funding. For example,NSF’s Division of Human Resource Development (HRD)within the Education and Human Resources (EHR)Directorate, strives to address NSF’s agency-wide commit-ment to broaden the participation of underrepresentedgroups and institutions in STEM fields. Within NIH, theNational Institute of General Medical Science’s (NIGMS)Division of Minority Opportunities in Research (MORE)supports research and research training programs whosegoal is to increase the number of minority biomedical andbehavioral scientists. Within these two broad programmaticareas—HRD and MORE—several programs are funded thataddress the same or similar goals and the same or similartarget populations (i.e., AGEP, LSAMP, ADVANCE at NSF,MARC and MBRS at NIH).
In this era of accountability, programs are frequentlyasked to provide evidence that they are reaching theirgoals. Assessing broad program effectiveness, however, isoften difficult without being able to aggregate similardata across individual projects to determine the overalleffect of the program. Cross-project evaluation in the in-terest of evaluating a program depends on each projectcollecting uniform data so that data may be aggregatedacross projects.
In addition to meeting accountability requirements,being able to report on program level outcomes—Has thisprogram produced the intended results?—brings otherbenefits. For example, it strengthens the ability of fundersto make informed funding decisions—Should we con-tinue to put money into this program?—and it has the potential to improve the knowledge base of what works(and what works for whom) by providing a larger databaseallowing for disaggregation of data—Who benefits themost from this intervention? Who doesn’t?
The goal of cross-project evaluation is most often toprovide data for a summative evaluation by assessing theprogram’s overall success in meeting its goals as measuredby the success of individual projects in contributing tothose goals. This guide, therefore, will focus on the role ofcross-project evaluation in summative evaluation.
2 Building Evaluation Capacity
a
Programs within Three Funding
Agencies
National Science Foundation:
ADVANCEDivision of Human Resource
Development (HRD)
Alliances for Graduate Education in the
Professoriate (AGEP)Division of Human Resource
Development (HRD)
Louis Stokes Alliances for Minority Participation (LSAMP)
Division of Human Resource Development (HRD)
National Institutes of Health:
Minority Access to Research Careers (MARC)
Division of Minority Opportunities in Research (MORE)
Minority Biomedical Research Support
(MBRS)Division of Minority Opportunities
in Research (MORE)
GE Foundation:
Math Excellence
10869-01_BEC1_redo.qxd 3/13/08 10:33 AM Page 2

The two guides target three groups of potential users:
● Funders of program evaluations. These can be either staff in the program area or staffin an evaluation center within an organization. They are responsible for writing re-quests for proposals (RFPs) to solicit proposals to evaluate programs, monitoring theevaluations, and working with the evaluators to convey the results of the evaluation tothe organization and the public.
● Those involved in program evaluation. These are typically evaluators who receivecontracts from funding agencies or organizations to design and carry out cross-project evaluations within a program to assess the overall effectiveness of the program.
● Those involved in project evaluation. These project evaluators focus on design-ing and collecting data to evaluate individual projects. They work directly with the projects and typically report their data to the project director or principal investigator.
These guides show how to develop a model to guide procedures for building the capacityand ability of an organization (or an area within an organization) to conduct cross-project evaluations. Evaluators responsible for assessing the effects of a program area canalso use the guides to conceptualize cross-project evaluation and organize data collectionand analysis. Finally, they can help evaluators of individual projects understand their rolein contributing to the larger, cross-project evaluation.
There are two basic assumptions that underlie the evaluation approach used andthe evaluation knowledge and expertise the targeted audience possesses. The evalua-tion approach (i.e., the goals and procedures of evaluation) presented here is the goal-oriented approach (Stecher and Davis 1990), which determines program success basedon fulfillment of program-specific goals. We deemed this to be the most appropriateevaluation approach because of the purposes for which cross-project evaluations are typically used: to justify or inform funding decisions. For example, a program offunding is established to address an identified need through implementation of a setof projects that, by carrying out specified activities, promise to produce specific re-sults. Cross-project evaluation, by determining whether the projects have achievedthese results, justifies—or not—the decision to establish a funding initiative. Thequestion the evaluation addresses—Has this program fulfilled its goal?—is thereforean appropriate one.
Because the target audience consists of evaluators, the guides assume that readerswill have a basic knowledge of evaluation principles and procedures. The guides, there-fore, do not contain detailed instructions for implementing routine evaluation tasks.2 Theexpectation is that users of these guides will gain an appreciation of the value of con-ducting cross-project evaluation; learn how to design such an evaluation; become awareof the special issues inherent in collecting and reporting cross-project data; and under-stand the many uses of cross-project data in decisionmaking.
Building Evaluation Capacity 3
10869-01_BEC1_redo.qxd 3/13/08 10:33 AM Page 3

The two guides will discuss the following areas relevant to cross-project evaluation:
Building Evaluation Capacity—Guide I: Designing a Cross-Project Evaluation
● Evaluation design, including identification and operationalization of program goals,building of logic models, and indicator setting; and
● Selection of indicators to be measured and appropriate measures for these indicators.
Building Evaluation Capacity—Guide II: Collecting and Using Cross-Project EvaluationData
● Data collection: formats and scheduling,● Ensuring data quality,● Use of comparison data,● Reporting and displaying data, and● Using cross-project data.
Designing a Cross-Project Evaluation is the first of the two building evaluation capacityguides. It focuses on evaluation design, including identification and operationalization ofprogram goals, building of logic models, and indicator setting. This guide also covers theselection of indicators to be measured and appropriate measures for these indicators. Itbegins with the identification of program goals. Subsequent sections discuss the con-struction of logic models and the evaluation approach, including the generation of eval-uation questions, the setting of indicators, and the integration of evaluation questionsand indicators. It concludes with a discussion of measurement strategies: the selection ofappropriate measures for different indicators and the role of demographic variables.
Identifying Program GoalsThe first step in designing a cross-project evaluation is determining the programmaticgoals. For example, programs sponsored by NSF’s Division of Human ResourceDevelopment (HRD), which is located in the Directorate for Education and HumanResources, focus on carrying out HRD’s broad mandate, as expressed in the followingstatement from the NSF web site:
The Division of Human Resource Development [HRD] . . . serves as a focal point for NSF’s agency-widecommitment to enhance the quality and excellence of science, technology, engineering, and mathe-matics (STEM) education and research by broadening the participation and advancement of minority-serving institutions, women and girls, and persons with disabilities at every level of science and engi-neering enterprises including underrepresented minorities.
Within HRD, broad programmatic areas have been designated that focus on spe-cific underrepresented groups and institutions that serve these groups: minorities andminority-serving institutions, women and girls, and persons with disabilities. Within the
4 Building Evaluation Capacity
10869-01_BEC1_redo.qxd 3/13/08 10:33 AM Page 4

minorities and minority-serving institutions area are six programs: Historically BlackColleges and Universities Undergraduate Program (HBCU-UP), Tribal Colleges andUniversities Program (TCUP), Centers for Research Excellence (CREST), the LouisStokes Alliances for Minority Participation (LSAMP), Alliances for Graduate Educationin the Professoriate (AGEP), and Model Institutions for Excellence (MIE). Each programaddresses the HRD goals in a different way; some focus on a specific underrepresentedpopulation, such as TCUP (American Indians) or a specific academic level, such asLSAMP (undergraduate) and AGEP (graduate) for all underrepresented minorities (URMs).The two HRD programs in this category that our project selected are LSAMP and AGEP.See the text boxes below for the goals of these programs.
Goal-Setting as a Process
Once the broad goals of the program are identified, what steps are required to
● refine broad goals?● obtain consensus from stakeholders?● operationalize refined goals?
Refining Broader Goals. In preparation for working with stakeholders to come to con-sensus on the definition and operationalization of programmatic goals, it is first nec-essary to refocus and refine the broader goals as conceptualized by the program. Again,following through with our example from the two HRD programs, the text boxes belowshow how broad LSAMP and AGEP program goals were refined for presentation tostakeholders.
This refinement of broad programmatic goal statements into “bite-sized” segmentsfacilitates discussion with stakeholders in the next steps in the goal-setting process.3 It isimportant to remember in the refining process that the integrity of the program must bemaintained.
Arriving at Consensus with Stakeholders. Why should stakeholders be involved in goal-setting? First, stakeholders can help to illuminate the links between goals and programactivities. They can also provide insight into and expand upon the stated goals of a proj-ect. (“Even though the goal statement only mentions impact on students, the programaims to improve curriculum and faculty instruction.”) Stakeholders can also provide a re-alistic perspective for attaining goals. (“There is no way this program can double the num-ber of graduates, but it can increase them by 50 percent.”) Stakeholder consensus on whatthe program goals mean is important because it lays the groundwork for acceptance ofthe evaluation findings by the people who count. Because the goals are the departurepoint for the evaluation design, evaluators must ensure that goals reflect the under-standing and acceptance of important stakeholders.
The evaluator must decide which stakeholders to involve. Because the process canbe labor intensive and lengthy, this decision is critical.4 In determining the stakehold-ers to be involved in this project, we focused on the primary users of the guide—the
Building Evaluation Capacity 5
10869-01_BEC1_redo.qxd 3/13/08 10:33 AM Page 5

agency or foundation evaluation and program staff and experienced evaluators whowere frequently contracted by the agencies and foundations to conduct program eval-uation. We included a third group of stakeholders: project directors and principal in-vestigators of the individual projects and their evaluators. These stakeholders, who con-duct the data collection efforts in the field, must understand and buy into cross-projectevaluation for it to work. Additionally, this group can provide valuable judgment re-garding the feasibility of collecting certain types of data that might be proposed in anevaluation plan.
Operationalizing the Goals. This is the process whereby goals are transformed into ex-pected outcomes, evaluation questions, and, ultimately, into indicators that can be mea-sured quantitatively and qualitatively. Stakeholder input was used extensively in thisprocess via methods described below. Lists of indicators for each outcome were generatedand these were discussed with stakeholders, who identified the most important ones. Howis the transition made from goals to measures of their attainment? A useful tool for align-ing goals with indicators with measures is the logic model.
6 Building Evaluation Capacity
LSAMPBroad Goal
The LSAMP Program is designed todevelop the comprehensive strate-gies necessary to strengthen thepreparation and increase the num-ber of minority students who suc-cessfully complete baccalaureatesin STEM fields. This objective facili-tates the long-term goal of increas-ing the production of doctorates inSTEM fields, with an emphasis onentry into faculty positions.
Refined Goals● Increase the quality and quantity
of URM students successfullycompleting STEM baccalaureatedegree programs.
● Increase the number of URM stu-dents interested in, academicallyqualified for, and matriculatedinto programs of graduate studyin STEM.
AGEPBroad Goal
The AGEP Program seeks to signif-icantly increase the number ofURMs receiving doctoral degrees inSTEM fields customarily supportedby NSF. NSF is particularly inter-ested in increasing the number ofminorities who will enter the pro-fessoriate in these disciplines.
Refined Goals● Increase the number of underrep-
resented minority students pur-suing advanced study, obtaining doctoral degrees, and entering the professoriate in STEM disciplines.
● Establish alliances engaged incomprehensive institutional cultural changes that will lead tosustained increases in the con-ferral of STEM doctoral degrees,significantly exceeding historiclevels of performance.
10869-01_BEC1_redo.qxd 3/13/08 10:33 AM Page 6

Constructing a Logic ModelA logic model is the simplified, idealized, graphic depiction of a program or project.5 Agood logic model shows the logical relationships among resources invested, activities im-plemented, and the changes that result; in other words, a logic model illustrates how aprogram is supposed to work. Although thought of mainly as an evaluation tool, the logicmodel has been used in program planning and management. This section, however, ex-plores the role of the logic model as a tool for evaluation.
Components of a Logic Model
As one of the first steps in designing an evaluation, the logic model helps to focus an eval-uation by identifying what needs to be evaluated. The basic components of a simplifiedmodel, as figure 1 depicts, are inputs (resources invested), outputs (activities imple-mented using the resources), and outcomes/impact (results). Figure 1 illustrates howthese components can develop into a complex picture of a specific program.
Let’s apply our understanding of the logic model components to a specific program,LSAMP, and consider what goes into a logic model for this program, component bycomponent.
Inputs. The inputs for LSAMP consist of funding from NSF, resources (including in-kindcontributions) from the participating institutions, and a research base on which the pro-gram approach is based. Figure 2 gives inputs for the LSAMP Program.
Outputs. These consist of two types: activities (what the programdoes) and participants (who the program reaches). Figure 3shows the outputs identified for the LSAMP Program.
Outcomes/Impact. There are three types of outcomes: short-term,medium-term, and long-term. Short-term outcomes occur withina few years after program initiation; medium-term outcomes maybe evident about 10 years into the program; and long-term out-comes may be expected only after several years (figure 4).
The Logic Model in Evaluation
The logic model has been widely used in evaluation for thefollowing reasons: it helps to (a) determine the focus of the
Building Evaluation Capacity 7
Inputs
What isinvested
What isdone
Whatresults
Outputs Outcomes/Impacts
Figure 1. Components of a Logic Model
Inputs
Funding from NSF
Resources from institutions(including in-kind contributions)
Program research base(tested models, theoretical frameworks, research and evaluation studies, etc.)
Figure 2. LSAMP ModelInputs
10869-01_BEC1_redo.qxd 3/13/08 10:33 AM Page 7

8 Building Evaluation Capacity
Uses of the Logic Model in Evaluation1. Focus—Determine what to evaluate.2. Questions—Determine the questions your evaluation will ask.3. Indicators—Decide what data to collect to answer your evaluation questions.4. Timing—Decide when to collect which data.5. Data Collection—Determine data sources, methods, instrumentation, and samples.
Inputs
Funding from NSF
Resources from institutions(including in-kind contributions)
Program research base(tested models, theoretical frameworks, research and evaluation studies, etc.)
Outputs
Activities
Establishpartnerships
Conductstudentprofessional-izationactivities
Improve curriculum
Develop faculty
Participants
Partner institutions
Studentparticipants
Faculty participants
Outcomes/Impacts
Short-term
Student achievement in STEM
Student graduation from STEM majors
Curricular reform
Improvement of STEM faculty teaching
Medium-term
Student enrollment into a STEM graduate program
Student attainment of a graduate degree in STEM
Revisions to institutional policies and practices
Long-term
Student entry into STEM careers
Institutionalization of LSAMP practices at participating institutions
Contributions to scholarly body of work on effective models for increasing minority participation in STEM
Figure 4. LSAMP Model Inputs, Outputs, and Outcomes
Inputs
Funding from NSF
Resources from institutions(including in-kind contributions)
Program research base(tested models, theoretical frameworks, research and evaluation studies, etc.)
Outputs
Activities
Establishpartnerships
Conductstudentprofessional-izationactivities
Improve curriculum
Develop faculty
Participants
Partner institutions
Studentparticipants
Faculty participants
Figure 3. LSAMP Model Inputs and Outputs
10869-01_BEC1_redo.qxd 3/13/08 10:33 AM Page 8
evaluation—what will be evaluated; (b) determine the main evaluation questions—whatshould be measured; (c) understand indicators and determine what data best answer theevaluation questions; and (d) identify the best schedule for data collection.
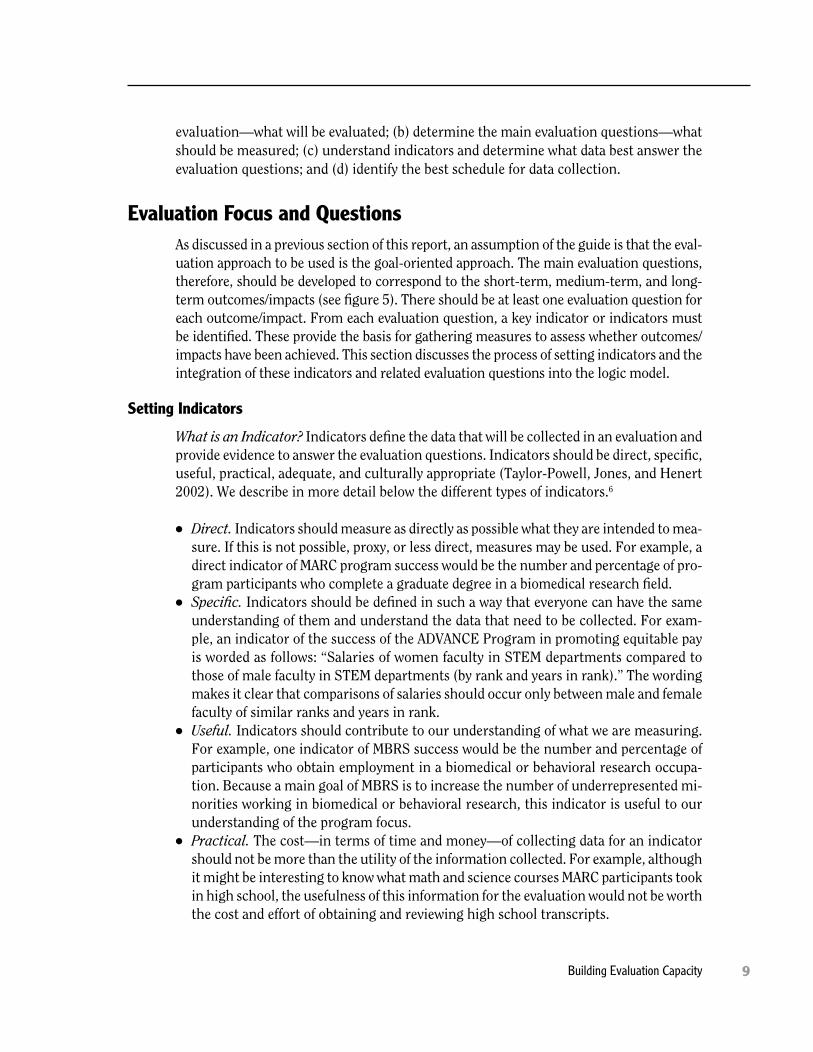
Evaluation Focus and QuestionsAs discussed in a previous section of this report, an assumption of the guide is that the eval-uation approach to be used is the goal-oriented approach. The main evaluation questions,therefore, should be developed to correspond to the short-term, medium-term, and long-term outcomes/impacts (see figure 5). There should be at least one evaluation question foreach outcome/impact. From each evaluation question, a key indicator or indicators mustbe identified. These provide the basis for gathering measures to assess whether outcomes/impacts have been achieved. This section discusses the process of setting indicators and theintegration of these indicators and related evaluation questions into the logic model.
Setting Indicators
What is an Indicator? Indicators define the data that will be collected in an evaluation andprovide evidence to answer the evaluation questions. Indicators should be direct, specific,useful, practical, adequate, and culturally appropriate (Taylor-Powell, Jones, and Henert2002). We describe in more detail below the different types of indicators.6
● Direct. Indicators should measure as directly as possible what they are intended to mea-sure. If this is not possible, proxy, or less direct, measures may be used. For example, adirect indicator of MARC program success would be the number and percentage of pro-gram participants who complete a graduate degree in a biomedical research field.
● Specific. Indicators should be defined in such a way that everyone can have the sameunderstanding of them and understand the data that need to be collected. For exam-ple, an indicator of the success of the ADVANCE Program in promoting equitable payis worded as follows: “Salaries of women faculty in STEM departments compared tothose of male faculty in STEM departments (by rank and years in rank).” The wordingmakes it clear that comparisons of salaries should occur only between male and femalefaculty of similar ranks and years in rank.
● Useful. Indicators should contribute to our understanding of what we are measuring.For example, one indicator of MBRS success would be the number and percentage ofparticipants who obtain employment in a biomedical or behavioral research occupa-tion. Because a main goal of MBRS is to increase the number of underrepresented mi-norities working in biomedical or behavioral research, this indicator is useful to ourunderstanding of the program focus.
● Practical. The cost—in terms of time and money—of collecting data for an indicatorshould not be more than the utility of the information collected. For example, althoughit might be interesting to know what math and science courses MARC participants tookin high school, the usefulness of this information for the evaluation would not be worththe cost and effort of obtaining and reviewing high school transcripts.
Building Evaluation Capacity 9
10869-01_BEC1_redo.qxd 3/13/08 10:33 AM Page 9

10
Inputs
Funding from NSF
Resources from institutions(including in-kind contributions)
Program research base(tested models, theoretical frameworks, research and evaluation studies, etc.)
Outputs
Activities
Establishpartnerships
Conductstudentprofessional-izationactivities
Improve curriculum
Develop faculty
Participants
Partner institutions
Studentparticipants
Faculty participants
Outcomes/Impacts
Short-term
Student achievement in STEM
Student graduation from STEM majors
Curricular reform
Improvement of STEM faculty teaching
Medium-term
Student enrollment into a STEM graduate program
Student attainment of a graduate degree in STEM
Revisions to institutional policies and practices
Long-term
Student entry into STEM careers
Institutionalization of LSAMP practices at participating institutions
Contributions to scholarly body of work on effective models for increasing minority participation in STEM
Are LSAMP participants achieving at a higher rate?
Are LSAMP participants completeing w/STEM undergraduate degrees?
Are LSAMP institutions reforming STEM curriculum?
Has the instruction of STEM faculty at LSAMP institutions improved?
Have LSAMP graduates enrolled in STEM grad programs?
Have LSAMP graduates completed STEM grad degrees?
Have LSAMP institutions revised policies and practices to encourage success in STEM?
Have LSAMP graduates entered the STEM workforce?
Have LSAMP grantees institutionalized program strategies and practices?
Has LSAMP made a contribution to the research base of effective models for increasing minority participation in STEM?
Distribution of GPA of LSAMP participants
#, % completing STEM undergraduate degrees
#, % of LSAMP institutions reforming STEM curriculum
#, % of faculty participating in faculty development activities
#, % of LSAMP graduates enrolled in STEM grad programs
#, % of LSAMP graduates completing STEM grad degrees
#, % of LSAMP institutions with revised policies and practices
#, % of LSAMP graduates who enter STEM workforce
#, % of LSAMP grantees that institutionalize program strategies and practices
#, % of LSAMP reports and publications in refereed journals and elsewhere about effectiveness of LSAMP model
Key Evaluation Questions
Indicators
Notice how each evaluation
question has its own indicator!
Note: In this example, the evaluation depicted is a summative evaluation, thus evaluation questions and indicators are only developed for program Outcome/Impacts. If the evaluation also included a formative component, the evaluator would also develop questions and indicators for the Inputs and Outputs portions of the logic model.
Figure 5. LSAMP Program Model with Summative Evaluation Questions and Indicators
10869-01_BEC1_redo.qxd 3/14/08 11:17 AM Page 10

● Culturally appropriate. Indicators need to be relevant within the cultural context. Anexample of an irrelevant indicator would be the rate of participation of MBRS programenrollees in the International Baccalaureate program in high school.
● Adequate. Although there is no correct number or type of indicators, the indicatorschosen are a function of what is being measured, the information needed, and the re-sources available. Often more than one indicator is necessary. Take, for example, themultiple indicators of success for ADVANCE that include number and percentage ofwomen faculty in tenured positions by STEM department, on promotion/tenure com-mittees, awarded tenure or promoted, and several others (all compared with numbersand percentages of men in similar situations).
Stakeholder Input in Setting Indicators. Setting indicators through stakeholder input isa complex, time-consuming, and important process. As suggested above, in order for anevaluation to be credible to a variety of stakeholders, there should be agreement amongstakeholders regarding the specific indicators that will be used to prove whether a pro-gram is successful in fulfilling its goals. In soliciting stakeholder input and consensus indetermining the indicators used in this project, we used several strategies.
Consensus with different groups of stakeholders can be achieved in various ways. Forthis project, the process for obtaining input, feedback, and consensus differed by group.We held meetings with the program staff of each organization involved in the project tosolicit their input from the program perspective regarding the most appropriate indica-tors; we also conducted focus groups with project directors/PIs and evaluators for eachprogram to solicit not only input and consensus, but also to explore the feasibility of col-lecting specific data. Finally, to obtain the input and consensus of expert evaluators fromacross the nation on indicators and related measures, we conducted an online Delphi ex-ercise with nine expert evaluators.
Indicators identified for each of the programs are listed in appendix B. These indica-tors, judged to be “very important” or “important” through the process described above,represent stakeholder consensus.
Integrating the Logic Model with Evaluation Questions and Indicators
Figure 5 illustrates evaluation questions and indicators integrated into a logic model. Inthe interest of continuity, we once again use the LSAMP Program as an example.
Key evaluation questions developed from the outcomes are linked to the indicators.Measures must then be identified and sources of these measures found. The following sec-tion discusses ways of selecting appropriate measures for indicators.
Measurement StrategiesSelecting Measures for Indicators
The task of selecting measures for indicators can be difficult. While it is important for rea-sons of validity to select appropriate measures, issues of time and cost must also be consid-ered. And it is important to remember that sometimes the best measure is the simplest one.
Building Evaluation Capacity 11
10869-01_BEC1_redo.qxd 3/13/08 10:33 AM Page 11

Self-defined Indicators. Measures should emerge from indicators identified in the evalu-ation plan. Sometimes indicators are themselves measures. The short-term indicatorshown in figure 5, distribution of GPA of LSAMP participants, is an example of such anindicator. Indicators that can be measured by the number or percentage of entities meet-ing a quantifiable milestone (for example, number and percentage of LSAMP graduatescompleting STEM graduate degrees) are in this category of self-defined indicators.
Performance and Attitudinal Indicators. Indicators are more difficult to measure when theyrequire a judgment as to whether behavioral, attitudinal, or cognitive change has occurred.These indicators call for measures with a high degree of validity and reliability. Additionally,multiple measures of attitudinal indicators may be required to strengthen the credibility offindings. For example, career interest and attitudes toward science careers are MBRSsubindicators for indicator 3, number and percentage of participants who complete a grad-uate degree in biomedical or behavioral research. Strategies to measure performance orchanges in performance (e.g., changes in behavior, knowledge, or skill levels) include thefollowing: selected response tests, constructed response tests, performance simulations,self-report measures, performance indicators, and data (Morris, Fitz-Gibbon, and Lindheim1991). Measurement approaches to attitudinal change (i.e., changes in affect, feelings, val-ues, or beliefs) include self-report measures, reports of others, sociometric procedures, andrecords (Henerson, Morris, Fitz-Gibbon 1991).
The following is a description of characteristics of measures for performance andattitudinal indicators.
Performance indicators
● Selected response tests: Paper-pencil tests where respondents choose from among var-ious responses. Common formats are multiple choice and true and false.
● Constructed response tests: Tests that require examinees to compose an answer to aquestion by writing a short answer, solving a problem, or delivering an oral presenta-tion. Assessments of writing ability where examinees display their writing ability bycomposing short essays or paragraphs are examples of this format.
● Performance simulations: This type of test requires examinees to perform tasksdemonstrating knowledge or skills under controlled conditions similar to real life. Anexample of this format might be a hands-on scientific problem-solving task.7
● Self-report measures: This is where respondents provide information about the degreeto which behaviors of interest are occurring. For example, high school students mightreport an increase in participation in math or science after-school activities.
● Evaluator-developed performance indicators: A type of measurement that requires theevaluator to develop indicators that demonstrate success in reaching program goals orobjectives. For example, increases in student proficiency in math might be measuredby the number of problems solved correctly within a specified time.
● Extant data: This strategy involves the use of data that might have been collected forother purposes. State assessment results, for example, may give a good indication ofstudent progress in acquiring certain math concepts or skills.
12 Building Evaluation Capacity
10869-01_BEC1_redo.qxd 3/13/08 10:33 AM Page 12

Attitudinal indicators
● Self-report measures: Participants report directly about their attitudes. These data areoften collected through interviews, surveys, polls, questionnaires, and attitude ratingscales, logs, journals, or diaries.
● Reports of others: Individuals who are in a position to observe participants report abouttheir attitudes. Data may be gathered through interviews, questionnaires, logs, jour-nals, reports, and observation procedures.
● Sociometric procedures: Participants in a group report their attitudes toward one an-other. Peer ratings and social choice techniques are typical methods of data-gathering.
● Records: Information on changes in participants’ attitudes may be gathered throughcounselor files or attendance and participation records.
Sources of Measurement Tools. Finding performance and attitudinal measures that al-ready exist—as long as they are appropriate measures—has many advantages. By usingthese measures, evaluators can save time and benefit from others’ experiences. Such in-struments have probably been field tested and have validity and reliability data.
Already developed performance tests come from three main sources:
● Curriculum materials that have pre- or posttests or curriculum-embedded progress ormastery tests;
● State, district, or funding agency tests that are part of an area-wide assessment pro-gram; and
● Tests developed by a test publisher or borrowed from a researcher, professional asso-ciation, or another source.
Published attitude measures consist mostly of paper and pencil, self-report instruments,many of which may require modification because they were developed for purposes otherthan program evaluation. Several attitude measures are standardized and available on thecommercial test market. “Homemade” instruments developed by a school or school dis-trict or copyrighted instruments developed for research are other types of tools availablefor measuring attitudinal change.
Appendix C contains sources for already published instruments that can be used tocollect data on attitudes.
Demographic Variables
Demographic variables on participants must be collected to answer the key question,“what works for whom in what context?”. Here are some common demographic vari-ables as well as issues for cross-project evaluators to consider when using them. It isimportant to keep in mind that the best versions of these variables are those the fund-ing agency uses to collect and report data. A review of data-collection instruments de-veloped by the funding agency should provide this information. Appendix D providesthe demographic variables identified as very important or important for each programby the stakeholders.
Building Evaluation Capacity 13
10869-01_BEC1_redo.qxd 3/13/08 10:33 AM Page 13

Age. Age appears to be a straightforward variable; however, there are some pitfalls. Forexample, asking for date of birth can be problematic because some people will enter thecurrent year rather than their birth year. Providing people with age categories with five orten year spans (30–39, 30–34, 35–39) is often done, but it limits analysis flexibility includ-ing the degree to which age can be used as a dependent variable. For adults, it is generallybest just to ask people how old they are.
When the subjects are children, it is often necessary to ask for more than how manyyears old they are. There can be large development differences between a child who turnedfive yesterday and one who will turn six tomorrow. For children, it is often useful to askboth their age and the month in which they were born.
Disability Status. Disability can be used as a variable at several different levels.Individuals are often asked if they have any disabilities. This question is so broad it is oflittle value in any analysis. At a more useful level, disabilities can be broken into threelevels—physical disabilities, emotional disabilities, and intellectual disabilities, includinglearning disabilities—and individuals can indicate any areas in which they have dis-abilities. The most widely used set of definitions comes from the federal law, the Indi-viduals with Disabilities Education Act (IDEA), which breaks disabilities into 13 areas(http://www.nichcy.org/pubs/genresc/gr3.htm#categories):
1. Autism2. Deaf-blindness3. Deafness4. Emotional disturbance5. Hearing impairment6. Mental retardation7. Multiple disabilities8. Orthopedic impairment9. Other health impairment
10. Specific learning disability11. Speech or language impairment12. Traumatic brain injury13. Visual impairment including blindness
Educational Level. Definitions of educational level are quite standard. The following comefrom the 2000 Census (http://www.census.gov/prod/2003pubs/c2kbr-24.pdf):
No schooling completedNursery school to 4th grade5th grade or 6th grade7th grade or 8th grade9th grade10th grade11th grade
14 Building Evaluation Capacity
10869-01_BEC1_redo.qxd 3/13/08 10:33 AM Page 14

12th grade, no diplomaHigh school graduate—high school diploma or equivalent (for example, GED)Some college credit, but less than 1 year1 or more years of college, no degreeAssociate degree (for example, AA, AS)Bachelor’s degree (for example, BA, AB, BS)Master’s degree (for example, MA, MS, MEng, MEd, MSW, MBA)Professional degree (for example, MD, DDS, DVM, LLB, JD)Doctorate degree (for example, PhD, EdD)
Job Category. While there can be many different job categories, the occupational defi-nitions the Census Bureau and the U.S. Equal Employment Opportunity Commissionuse come the closest to a standard (http://www.eeoc.gov/eeo1survey/jobclassification.html):
● Officials and managers—Occupations requiring administrative and managerial per-sonnel, who set broad policies, exercise responsibility for executing these policies, anddirect individual departments or special phases of a firm’s operation.
● Professionals—Occupations requiring either college graduation or experience thatprovides a comparable background.
● Technicians—Occupations requiring a combination of basic scientific knowledge andmanual skill that can be obtained through two years of post–high school education,such as is offered in many technical institutes and junior colleges, or through on-the-job training.
● Sales—Occupations engaged wholly or primarily in direct selling.● Official and clerical—Administrative support occupations, including all clerical-type
work regardless of difficulty, where the activities are not predominately manual,though some manual work not directly involved with altering or transporting the prod-ucts is included.
● Craft workers (skilled)—Manual workers of relatively high level (precision productionand repair) having a thorough and comprehensive knowledge of the process involvedin their work. They exercise considerable independent judgment and usually havereceived extensive training.
● Operative (semiskilled)—Workers who operate transportation or materials movingequipment, who operate machine or processing equipment, or who perform otherfactory-type duties of intermediate skill level that can be mastered in a few weeks andrequire only limited training.
● Laborers (unskilled)—Handlers, equipment cleaners, helpers, and other workers inmanual occupations that generally require no special training and who perform ele-mentary duties that may be learned in a few days and require the application of littleor no independent judgment. Farm workers (laborers) are placed here, as well as farm-ing, forestry and fishing occupations not elsewhere covered.
● Service workers—Workers in both protective and nonprotective service occupations.
Building Evaluation Capacity 15
10869-01_BEC1_redo.qxd 3/14/08 11:17 AM Page 15

Race/ethnicity. Race/ethnicity is in many ways the most difficult demographic data to col-lect. One solution is to use the racial/ethnic categories the funding agency uses to collect andreport data. Another possible solution is to use the same procedures as the Census Bureau:
The minimum categories for race are: American Indian or Alaska Native; Asian; Black or AfricanAmerican; Native Hawaiian or Other Pacific Islander; White and Some Other Race. Respondents canselect one or more races when they self-identify. There are also two minimum categories for ethnic-ity: Hispanic or Latino and Not Hispanic or Latino. Hispanics and Latinos may be of any race.(http://www.census.gov/population/www/socdemo/race/racefactcb.html)
Alternatively, members of the target audiences can be asked which racial category titlesare most appropriate for their population. Asian/Pacific Islander is often used as a cate-gory. However, since Pacific Islanders are considered an underrepresented minority andAsians are not, it is better to separate them into two categories. “Other” or “some otherrace” should be used either minimally or not at all since such a category is difficult to in-terpret. Individuals who indicate their race/ethnicity as “other” also cannot be includedas underrepresented minorities.
Sex/Gender. Sex/gender is a straightforward variable. The only major decision is if “sex”or “gender” should be used as the variable name. At times gender is used rather than sexso there can be no confusion with questions related to sexuality.
Socioeconomic Status (SES). There are a number of different types of data that can beused to determine SES, none of which are perfect. Public school students’ eligibility forfree or reduced lunch is often used as a measure of low-income status. For all age levels,in combination with census data, zip codes can be used as a measure of SES. More infor-mation about the use of census data can be found at http://www.census.gov/main/www/access.html.
Family income is also used as an SES measure. Since people tend to know only theirapproximate family income, it is usually more effective to provide people with income cat-egories with five or ten thousand dollar spans ($30,000–$39,999 or $30,000–$34,999;$35,000–$39,999) than to ask for an exact amount.
Education level and job category can also indicate SES. For children, parents’ educa-tion levels and job categories are used; for adults, their own and their spouse’s or part-ner’s are used. A sample procedure, the Barratt Simplified Measure of Social Status(BSMSS) has been developed for measuring SES and can be found at http://wbarratt.indstate.edu/socialclass/Barratt_Simplifed_Measure_of_Social_Status.pdf.
ConclusionAs the first of a two-volume guide, “Designing a Cross-Project Evaluation” lays out theprocess for the design of a program evaluation of multiproject programs. A second vol-ume, “Collecting and Using Data in Cross-Project Evaluations,” follows and provides guid-ance on the collection, reporting, and use of evaluation data. Together, these guides offera wealth of information and practical advice that will enable organizations to develop theircapacity to conduct cross-project evaluations.
16 Building Evaluation Capacity
10869-01_BEC1_redo.qxd 3/13/08 10:33 AM Page 16
Notes1. The underrepresented groups include women, African Americans, Latinos, and American Indians.
2. The authors refer those seeking information on routine evaluation tasks to the NSF “User Friendly Guides” listedin the references.
3. There are situations in which it is helpful to involve stakeholders at this stage, particularly when they are especially knowledgeable about program goals and objectives.
4. In cross-project evaluation, the ultimate beneficiaries of the projects are rarely considered stakeholders.
5. The section on constructing a logic model is based on “Enhancing Program Performance with Logic Models”(Taylor-Powell, Jones, and Henert 2002).
6. This discussion of indicators draws from Taylor-Powell, Jones, and Henert (2002).
7. The use of rubrics or checklists to guide the collection of measurement data on this type of indicator is helpful.
ReferencesHenerson, M. E., L. L. Morris, and C. T. Fitz-Gibbon. 1991. How to Measure Attitudes. Newbury Park: Sage
Publications.
Morris, L. L., C. T. Fitz-Gibbon, and E. Lindheim. 1991. How to Measure Performance and Use Tests. Newbury Park:Sage Publications.
Stecher, B. M., and Davis, W. A. 1990. How to Focus an Evaluation. Newbury Park: Sage Publications.
Stockdill, S. H., M. Baizerman, and D. W. Compton, D. W. 2002. “Toward a Definition of the ECB Process: A Conversation with the ECB Literature.” New Directions in Evaluation 93: 1–25.
Taylor-Powell, E., L. Jones, and E. Henert. 2002. “Enhancing Program Performance with Logic Models.” Universityof Wisconsin-Extension web site: http://www1.uwex.edu/ces/lmcourse/.
Building Evaluation Capacity 17
10869-01_BEC1_redo.qxd 3/13/08 10:33 AM Page 17

Appendix A. Program DescriptionsThe following section describes the programs chosen from each of the participating organizations.
National Science Foundation (NSF)
ADVANCE (Institutional Transformation Award): Established in 2001 as part of the over-all ADVANCE goal of increasing the representation and advancement of women in aca-demic science and engineering careers, the Institutional Transformation Award allowsinstitutions to define and implement approaches to increase the participation and advancement of women faculty members into senior and leadership ranks of scienceand engineering.
Alliances for Graduate Education and the Professoriate (AGEP): This program, estab-lished in the mid-1990s, seeks to increase significantly the number of African-American,Hispanic, and American Indian students receiving doctoral degrees in all disciplinesfunded by NSF. AGEP programs develop and implement innovative models for recruit-ing, mentoring, and retaining minority students in doctoral programs as well as effectivestrategies for identifying and supporting underrepresented minorities who wish to pur-sue academic careers.
Louis Stokes Alliances for Minority Participation (LSAMP): LSAMP, established in 1991,is a comprehensive, multidisciplinary, undergraduate program to increase substantiallythe quantity and quality of URM students completing degrees in STEM and continuingon to graduate programs in STEM fields. The program requires each awardee to establishmeaningful partnerships among academic institutions, government agencies and labo-ratories, industry, and professional organizations.
National Institutes of Health (NIH)
Minority Access to Research Careers: Undergraduate Student Training in AcademicResearch (MARC: U*STAR): Established in 1977, this program has as its goal increasingthe participation of URMs in biomedical research and health care professions. Additionalgoals are to increase the number and capabilities of scientists from underrepresentedminority groups who are engaged in biomedical research and to strengthen sciencecurricula and student research opportunities at institutions with substantial minorityenrollments to prepare them for research careers. All projects provide undergraduatestudents with a summer research experience at a research-intensive institution, academic-year research opportunities, and other educational experiences.
Minority Biomedical Research Support (MBRS)—Initiative for Minority StudentDevelopment (IMSD): The goal of MBRS, established in 1993, is to develop biomedical andbehavioral research scientists who are also URMs. As a subprogram of MBRS, IMSD encour-ages the development and expansion of innovative programs to improve the academic andresearch competitiveness of URMs at the undergraduate, graduate, and postdoctoral levels.
18 Building Evaluation Capacity
10869-01_BEC1_redo.qxd 3/13/08 10:33 AM Page 18

GE Foundation
Math Excellence Initiative: The purpose of this program, established in 2001, is tostrengthen and expand the pipeline of URMs and women in engineering, informationtechnology, and quantitative business disciplines (finance, accounting, and economics).Grants support comprehensive strategies that have a long-term, sustained impact onstrengthening students’ math and quantitative problem-solving skills; increasing studentknowledge and interest in math and quantitative careers; and increasing college-level re-cruitment and retention in these fields. Individual projects target elementary, middle, andhigh school students and teachers, and college students and professors.
Building Evaluation Capacity 19
10869-01_BEC1_redo.qxd 3/13/08 10:33 AM Page 19
Appendix B. Program IndicatorsADVANCE-Important Indicators
Indicator and Additional Measures1. Number and percentage of women faculty in tenured positions by STEM department
(compared to men)2. Number and percentage of women accepted into faculty positions in STEM depart-
ments (by faculty rank and tenure)3. Number and percentage of women STEM faculty awarded tenure/promoted (com-
pared to men)4. Salaries of women faculty in STEM departments vs. male faculty in STEM depart-
ments (by rank and years in rank)
Years in rankFaculty salaries
5. Changes in hiring procedures to advance equity6. Changes in promotion and tenure procedures to advance equity7. Years in rank of women in faculty positions in the institution (compared to men)8. Number and percentage of women on promotion/tenure committees (compared to
men)9. Number and percentage of women in high administrative positions
10. Number and percentage of women applying for faculty positions in STEM depart-ments by faculty rank (compared to men)
11. Changes in faculty evaluation to advance equity12. Establishment of, or increase in, “family friendly” policies toward faculty and grad-
uate students (e.g., availability of day care, flexibility in time schedule for tenure/degree attainment)
13. Institutionalization of recruitment strategies that attract female applicants
AGEP-Important Indicators
Indicator and Additional Measures1. Number and percentage of underrepresented minorities who enroll in graduate degree
programs in STEM
Graduation with STEM graduate degree (MS, PhD)Department/MajorDegree soughtCurrent standing/progress towards degreeAwards receivedType of institution (Carnegie classification)
2. Number and percentage of underrepresented minorities who graduate with a doctoraldegree in STEM
20 Building Evaluation Capacity
10869-01_BEC1_redo.qxd 3/13/08 10:33 AM Page 20

Department/MajorType of institution (Carnegie classification)
3. Number and percentage of underrepresented minorities who obtain faculty positionsin STEM
Highest STEM degree attainedType of employerMajor in highest STEM degreeFaculty rankTenure status
4. Changes in graduate student funding policies to be more reflective of individual stu-dent needs
LSAMP-Important Indicators
Indicator and Additional Measures1. Number and percentage of participants who complete a baccalaureate degree in a
STEM field Major
Type of institution (Carnegie classification)GPAParticipation in program activities (by activity type)Presentations and publications
2. Number and percentage of participants who enter a graduate program in STEM
Department/MajorDegree SoughtGraduation with STEM graduate degree (MS, PhD)Type of institution (Carnegie classification)
3. Number and percentage of participants who complete a graduate degree in STEM
Degree attainedType of institution (Carnegie classification)
4. Number and percentage of participants who obtain employment in a STEM occupation
Major in highest STEM degreeHighest STEM degree attainedType of employerPosition
5. Changes in the curriculum at the department level to advance equity
Building Evaluation Capacity 21
10869-01_BEC1_redo.qxd 3/13/08 10:33 AM Page 21
MARC U*STAR-Important Indicators
Indicator and Additional Measures1. Number and percentage of participants and underrepresented non-participants who
enter a STEM undergraduate major leading to a biomedical science research career
MajorDegree soughtGraduation with a STEM Baccalaureate degree (follow-up measure)High School GPAParticipation in program activities (by activity type)Student research skillsConfidence in mathAttitudes towards science and math careersStandardized test scores, e.g., SAT, ACT
2. Number and percentage of participants and underrepresented non-participants whoreceive a baccalaureate degree in STEM that can lead to a biomedical science researchcareer
MajorDegree attainedParticipation in program activities (by activity type)GPAStudent research skillsPresentations and publications (# and type)Attitudes towards science and math careersGRE test scores
3. Number and percentage of participants and underrepresented non-participants whoenter a PhD program in a biomedical or behavioral science field
Department/MajorCurrent standing/progress towards degreeGPA (Undergraduate)Attitudes towards science and math careersPresentations and publications (# and type)Type of institution (Carnegie classification)GRE test scores
4. Number and percentage of participants who complete a PhD in a biomedical or behav-ioral research field
Department/MajorDegree attainedType of institution (Carnegie classification)
22 Building Evaluation Capacity
10869-01_BEC1_redo.qxd 3/13/08 10:33 AM Page 22
Presentations and publications (# and type)Career interests/intentTime to degree
5. Number and percentage of participants who obtain postdoctoral training or researchemployment in a biomedical science research field
Major in highest STEM degreeHighest STEM degree obtainedType of employerPositionCareer focus
6. Number and percentage of students at institutions with substantial minority enroll-ments receiving meaningful research opportunities
MajorGraduation with a STEM Baccalaureate degreeCurrent standing/progress towards degreeCourses being takenCourses gradesGPAStudent research skillsPresentations and publications (# and type)Attitudes towards science and math careersInitial career interestStandardized test scores, e.g., SAT, ACT
7. Increase in the quality of the science curriculum at institutions with substantialminority enrollments
8. Number and percentage of participants who take the GRE9. Increase in the number and level of required math and quantitative science courses in
institutions with substantial minority enrollments
Math Excellence-Important Indicators
Indicator and Additional Measures1. Number and percentage of participants who show increases in knowledge about math
and quantitative careers
Courses being takenCourse gradesConfidence in mathGPAAttitudes towards math and math careersInitial career interests
Building Evaluation Capacity 23
10869-01_BEC1_redo.qxd 3/13/08 10:33 AM Page 23

2. Number and percentage of participants who successfully complete AP high schoolmath courses
Courses being takenConfidence in mathScores on AP examsCourse gradesGPAInitial career interestsAttitudes towards math and math careersStandardized test scores (changes over time)
3. Number and percentage of participants who show an increased interest in math andquantitative careers
Course being takenCourse gradesGPAConfidence in mathAttitudes towards math and math careersInitial career interests
4. Number and percentage of participants who enter college majors in quantitative dis-ciplines (i.e. math, physical sciences, engineering, finance, accounting)
MajorDegree soughtCurrent standing/progress towards degreeCourses being takenCourse gradesGPAConfidence in mathAttitudes towards math and math careersInitial career interestsStandardized test scores, e.g., SAT, ACT
5. Number and percentage of participants who graduate with a baccalaureate degree in aquantitative discipline field
MajorDegree attainedCourses being takenCourse gradesGPAConfidence in mathAttitudes towards math and math careers
24 Building Evaluation Capacity
10869-01_BEC1_redo.qxd 3/13/08 10:33 AM Page 24

6. Number and percentage of teachers in collaborating school systems who received train-ing from the project
7. Number and type of collaborations between school systems and colleges/universities8. Number and percentage of participants successfully completing Algebra I in the 8th
grade Courses being taken
Course gradesGPAConfidence in mathAttitudes towards math and math careersInitial career interests
MBRS-Important Indicators
Indicator and Additional Measures1. Number and percentage of participants who graduate with a baccalaureate degree in
biomedical or behavioral research
MajorDegree attainedCourse gradesGPAPresentations and publications (# and type)Attitudes towards science careers
2. Number and percentage of participants who enter a graduate program in biomedicalor behavioral research
Department/MajorDegree soughtGraduation with STEM graduate degree (MS, PhD)Type of institution (Carnegie classification)Current standing and progress toward degreeCourses being takenGPAStudent research skillsPresentations and publications (# and type)Attitudes towards science careersInitial career interestStandardized test scores, e.g., GRE
3. Number and percentage of participants who complete a graduate degree in biomedicalor behavioral research
Department/MajorDegree attained
Building Evaluation Capacity 25
10869-01_BEC1_redo.qxd 3/13/08 10:33 AM Page 25

Type of institution (Carnegie classification)GPAPresentations and publications (# and type)Attitudes towards science careersCareer interestsStandardized test scores, e.g., GRE
4. Number and percentage of participants who obtain employment in a biomedical orbehavioral research occupation
Major in highest STEM degreeHighest STEM degree attainedType of employerPositionPresentations and publications (# and type)Attitudes towards science careers
26 Building Evaluation Capacity
10869-01_BEC1_redo.qxd 3/13/08 10:33 AM Page 26

Appendix C. Published Instruments for Collecting Attitudinal DataExamples of Instruments that Measure Student Attitudes
Building Evaluation Capacity 27
General Academic Motivation
Academic Motivation Scale
Affective Perception Inventory, Advanced Level
Estes Attitude Scales: Secondary Form
Intellectual Achievement Responsibility Questionnaire
Inventory of School Motivation (ISM)
Motivated Strategies for Learning Questionnaire (MSLQ)
School Attitude Measure
Attitudes Towards Math
Aiken’s Enjoyment of Mathematics and Value of Mathematics Scales
Fennema-Sherman Mathematics Attitudes Scales
Indiana Mathematical Belief Scales
Math Anxiety Questionnaire
Mathematical Self-Concept Scale
Mathematics Self-Efficacy Scale
National Assessment of Educational Progress, Released Exercises: Mathematics.
Revised Math Attitude Scale
Students’ Beliefs about Mathematics
High School & Adult
High School
7–12
1–12
High School
Middle School
1–12
High School & Undergraduate
9–12
High School & Undergraduate
6–12
Undergraduate
High School & Adult
4, 8, 12
Undergraduate
12-Jan
Robert J. Vallerand, et al
Soares & Sorares
Estes, Estes, Richards, and Roettger
Crandall, Katkovsky, and Crandall
McInerney & Swisher
Pintrich and DeGroot
ACT
Aiken
Fennema and Sherman
Kloosterman & Stage
Wigfield and Meese
Gourgey
Betz & Hackett
Aiken
Spangler
1993
1979
1981
1965
1995
1990
1989
1983
1976
1992
1988
1982
1993
1983
1963
1992
Educational and Psychological
Measurement, 53, 159–172.
Soares Associates; 111 TeeterRock Rd., Trumbull, CT 06611
PRO-ED; 5341 Industrial OaksBoulevard, Austin, TX 78735
Child Development, 36,
91–109.
Journal of American Indian
Education, 34(3), 28–51.
Journal of Educational
Psychology, 82, 33–40.
Standardized test, ACT
Educational and Psychological
Measurement, 43(4), 1247–53.
Journal of Research in
Mathematics Education,
7(5), 324–326.
School Science and Mathematics,
92(3), 109–15.
Department of Human Development, Institute for Child Study, University of Maryland, College Park
ERIC Document Reproduction Service (ED 223 702; 18 pages)
Mind Garden, P.O. Box 60669, Palo Alto, CA 94306
National Assessment of Educational Progress; Box 2923; Princeton, NJ 0854
The Journal of Educational
Research, 56(9), 476–80
Arithmetic Teacher, 40(3), 148–52.
Instrument Grade Level Author Pub. Date Source
(continued)
10869-01_BEC1_redo.qxd 3/13/08 10:33 AM Page 27

28 Building Evaluation Capacity
Who and Mathematics
Attitudes Towards Science
Attitudes Toward Science Inventory
Attitude Towards Science (ATS)
Attitudes Toward Science in School Assessment
Modified Attitudes Toward Science Inventory
Science Anxiety Questionnaire
Science Attitude Scale for Middle School Students
Test of Science Related Attitudes (TOSRA)
Views on Science-Technology-Society
Attitudes Towards STEM Study and Careers
Longitudinal Survey of American Youth (LSAY)*
High School and Beyond*
Image of Science and Scientists Scale
Interest in Scientific Activities
Schwirian Science Support Scale
Science Research Temperament Scale
Test of Perceptions of Scientists and Self
Women in Science Scale
9–12
Middle and High School
4–5
7–8
Middle School urban students
Undergraduate
5–8
High School
High School
Middle School to Adult
High School & Adult
High School
High School
Undergraduate and Adult
High School & Undergraduate
High School
Middle & High School
Leder and Forgasz
Gogolin and Swartz
Klausmeier, DiLuzio, Brumet
ETS
Weinberg and Steele
Mallow
Misiti, Shrigley, Hanson
Fraser
Aikenhead, Ryan and Fleming
Krajkovich, Joseph G
Gardner & Tamir
Schwirian
Kosinar
Mackay & White
Erb & Smith
2002
1992
1976
1988
2000
1994
1991
1981
1989
1987
1980
1978
1989
1968
1955
1976
1983
Two new instruments to probe attitudes about gender and mathematics. (ERIC Document Reproduction Service No. ED 463312).
Journal of Research in Science Teaching, 29, 487–504.
Wisconsin Research and Development Center for Cognitive Learning
ETS TestLink
Journal of Women and Minorities in Science and Engineering, 6(1)
Journal of Science Education and Technology, 3(4), 227–38.
Science Education, 75(5), 525–540.
Australian Council for Educational Research
Views on science-technology-society (Saskatoon, Sasatchewan: Department of Curriculum Studies)
Michigan State University www.lsay.org
National Center of Education Statistics
ETS TestLink
Journal of Research in Science Teaching, 26(5), 409–23.
Science Education, 52(2), 172–79.
Psychometric Affiliates
ETS TestLink
Journal of Research in Science Teaching, 21(4), 391–97.
Instrument Grade Level Author Pub. Date Source
Note: A rich source for published testing instruments is ETS TestLink (http://sydneyplus.ets.org). This list was compiled using a search for “attitude measures.”
Appendix C. Continued
10869-01_BEC1_redo.qxd 3/13/08 10:33 AM Page 28

Appendix D. Demographic Variables by ProgramDemographic Indicators Deemed “Important” or “Very Important,” by program
Program and IndicatorsADVANCE
SexDepartment/Administrative OfficeFaculty RankTenure StatusRace/Ethnicity
AGEPRace/EthnicitySexFirst generation college
LSAMPRace/EthnicitySexFirst generation college
MARC U*STARRace/EthnicitySexFirst generation college
MBRSRace/EthnicitySex
Building Evaluation Capacity 29
10869-01_BEC1_redo.qxd 3/13/08 10:33 AM Page 29

10869-01_BEC1_redo.qxd 3/13/08 10:33 AM Page 30

Phone: 202.833.7200Fax: 202.429.0687E-mail: [email protected]://www.urban.org
2100 M Street, NWWashington, DC 20037
The UrbanInstitute
10869-00_BEC1-Cover.qxd 3/13/08 10:33 AM Page C4


