
10/27/2020 Using Zoom! - bptraining.ornl.gov
39
10/27/2020 1 Using Zoom! 1 Mute yourself! Have a question? Use the chat feature. Controls accessed at the bottom Rename yourself: “Name (Company)” Right click on your picture or 3 dots OR Controls accessed at the right after clicking ‘Participants’ at bottom. Access Chat at the bottom Note: We will NOT be recording this workshop For Tyson renaming! Tyson - Fresh Meats Tyson - Prepared Foods Tyson - Poultry This session will be recorded for those not in attendance! REFRIGERATION SYSTEM VIRTUAL IN-PLANT TRAINING SESSION 1 – OCT 27, 2020 Thank You! Sponsor: 1 2 3
Transcript of 10/27/2020 Using Zoom! - bptraining.ornl.gov

10/27/2020
1
Using Zoom!
1
Mute yourself! Have a question? Use the chat feature.
Controls accessed at the bottom
Rename yourself: “Name (Company)”
Right click on your picture or 3 dots
OR
Controls accessed at the right after
clicking ‘Participants’ at bottom.
Access Chat at the bottom
Note: We will NOT be recording this workshop
For Tyson renaming!
Tyson - Fresh Meats
Tyson - Prepared Foods
Tyson - Poultry
This session will be recorded for those not in attendance!
REFRIGERATION SYSTEM
VIRTUAL IN-PLANT TRAINING
SESSION 1 – OCT 27, 2020
Thank You!
Sponsor:
1
2
3

10/27/2020
2
Meet Your Trainers
Steve Koski, PE
Principal Engineer
Cascade Energy, [email protected]
Tom Simenc, PE
Project Engineer
Cascade Energy, [email protected]
Please direct questions to [email protected]
Training Schedule
Sessions 1 and 2
Introduction to Refrigeration Systems
Compressors
Sessions 3 and 4 – Condensers
Sessions 5 and 6 - Evaporators/Defrost
Sessions 7 and 8
Evaporators/Defrost continued
Opportunity List Reporting
Meet Your Colleagues
4
5
6

10/27/2020
3
Today’s Agenda – Session 1
Welcome & Intros
Opportunity tracking
Energy basics
Fundamentals of refrigeration
Compressor Basics
Compressor Lift
Compressor Part Load
Compressor Homework
Introduction to Refrigeration Systems
and Compressors
8
Everyone Contributes to Energy Efficiency
Management
provides funding andexecutive buy-in
Operations
oversees schedules and production
Maintenance
“boots on the ground” equipment and system
support
Energy
Efficiency
7
8
9

10/27/2020
4
Preconditions for Energy Efficiency Success
Why INPLT?
Maximize the energy efficiency of your existingrefrigeration system.
Identify energy saving projects.
INPLT Objectives
1. Knowledge
2. Tools
3. Action
Energy
Savings
10
11
12

10/27/2020
5
Benefits of Energy Efficiency
Lower your energy costs
Reduce maintenance costs
Identify capital projects
Increase employee satisfaction
Improve customer satisfaction
1. Safety
2. Production
3. Quality
4. Energy
Let’s Get our Priorities Straight …
Opportunity Ideas
Note opportunity ideas as they pop into your head.
Use the Better Plants Opportunity Ideas pages.
We’ll flesh these out more in sessions 2 and beyond.
13
14
15

10/27/2020
6
Introduction to Utility Bills
16
Why Understand your Utility Bill?
What if your local gas
station treated you just like
your electric utility does?
Common Utility-Bill Line Items
16
17
18
10/27/2020
7
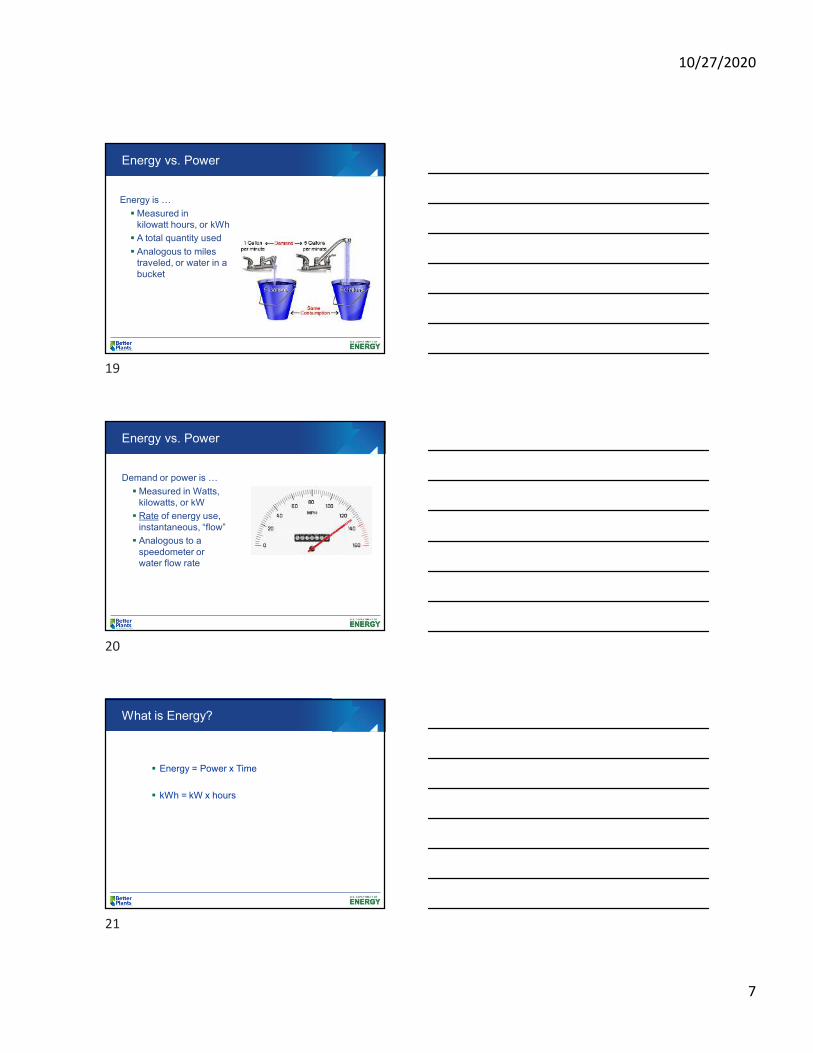
Energy vs. Power
Energy is …
Measured in kilowatt hours, or kWh
A total quantity used
Analogous to miles traveled, or water in a bucket
Energy vs. Power
Demand or power is …
Measured in Watts, kilowatts, or kW
Rate of energy use, instantaneous, “flow”
Analogous to a speedometer or water flow rate
What is Energy?
Energy = Power x Time
kWh = kW x hours
19
20
21

10/27/2020
8
How is Energy Calculated?
Let’s take a hair dryer for example …
Power = 1500 Watts or 1.5 kW
Total Annual Energy = 1.5 kW x 200 hr/yr
= 300 kWh/yr
Cost = 300 kWh/yr x $0.10/kWh = $30/yr
What is Energy?
0
200
400
600
800
1000
1200
1400
1600
1/1 1/6 1/11 1/16 1/21 1/26 1/31
kW
Date
Energy is the area under the curve
What is Peak Demand?
0
200
400
600
800
1000
1200
1400
1600
1/1 1/6 1/11 1/16 1/21 1/26 1/31
kW
Date
A Month of 15-Minute Power Data
Peak Demand
22
23
24

10/27/2020
9
Simplification: Bulk Rate
Used to simplify cost saving estimates.
12 month total cost: $1,381,000
12 month total energy: 22,982,000 kWh
$1,381,000 / 22,982,000 kWh = $.060/kWh
Bulk Rate: $.060/kWh
Simplified Savings Estimate
Shorthand Cost Savings Estimate
Use about 85% of bulk rate: $.060 x .85 = $.051
If you expected 10,000 kWh savings, this would be about
$510 savings on your bill.
Rules of Thumb
2% Compressor savings per °F of increase in suction
temperature.
1.5% Compressor savings per °F of decrease in
condensing temperature.
Workbook – Pages 3 and 4
25
26
27

10/27/2020
10
Rules of Thumb
2% Compressor savings per °F of increase in suction
temperature.
1.5% Compressor savings per °F of decrease in
condensing temperature.
Refrigeration Fundamentals
29
Refrigeration Basics: Two Key Principles
No.1: Heat flows from hot to cold
28
29
30

10/27/2020
11
Refrigeration Basics: Two Key Principles
No.2: For a saturated refrigerant (mix of liquid and gas)
Pressure Temperature
Pressure Temperature
Four Major Processes
Evaporator
Compressor
Condenser
Expansion Valve
Gas (Vapor)Liquid
Refrigeration Cycle
HeatHeat
31
32
33

10/27/2020
12
Rules of Thumb
2% Compressor savings per °F of increase in suction
temperature.
1.5% Compressor savings per °F of decrease in
condensing temperature.
Workbook – Page 5
Rules of Thumb
2% Compressor savings per °F of increase in suction
temperature.
1.5% Compressor savings per °F of decrease in
condensing temperature.
Activity: Refrigeration vs. Total-plant Energy
Refrigeration
Everything else
?% ?%
34
35
36

10/27/2020
13
Activity: Annual Energy Cost
What is the annual energy cost to run a 250 hp
compressor fully loaded 24/7?
1. $10,000/year
2. $25,000/year
3. $40,000/year
4. $90,000/year
200 HP
300 HP
500 HP
400 HP
Inter. Cooler
EC-1
EC-2
HPR
Dock Evaps
Freezer Evaps
HS Recirc
Hydro Cooler
LS Recirc
Activity – Sketch your system
Rules of Thumb
2% Compressor savings per °F of increase in suction
temperature.
1.5% Compressor savings per °F of decrease in
condensing temperature.
Sketch an ammonia system
37
38
39

10/27/2020
14
Activity – Sketch Your System
1. Suction vessels
2. Loads
3. Compressors
4. Condensers
5. Liquid path
Email a picture, screen snap, etc. to [email protected]
[insert Break slide]BREAK
Sketch Your System – Review
40
41
42

10/27/2020
15
Day 1: Compressors
Compressors
Compressor Basics
Type Max HPPres.
Ratio
Typical Type
Booster High Single
Reciprocating 300 8:1 X X
Rotary Screw 1,500 20:1 X X X
Rotary Vane 400 5:1 X
43
44
45

10/27/2020
16
Rules of Thumb
2% Compressor savings per °F of increase in suction
temperature.
1.5% Compressor savings per °F of decrease in
condensing temperature.
Workbook – Page 6
Screw Compressor Components
Motor
Control panel
Oil separatorCompressor
Suction Discharge
Screw Compressors: Key Energy Issues
1. Lift (suction and discharge)
2. Capacity control
3. Volume ratio
4. Cooling
5. Economizing
46
47
48

10/27/2020
17
Twin Screw Compressor
Reciprocating Compressors
25-Ton “Recip” from the Early 1900’s
49
50
51
10/27/2020
18
What’s the Ideal?
Minimal Lift (max suction, min discharge)
Slide Valve Properly Functioning
Minimal Inefficient Unloading
Correct Volume Ratio
Controls Telling the “Truth”
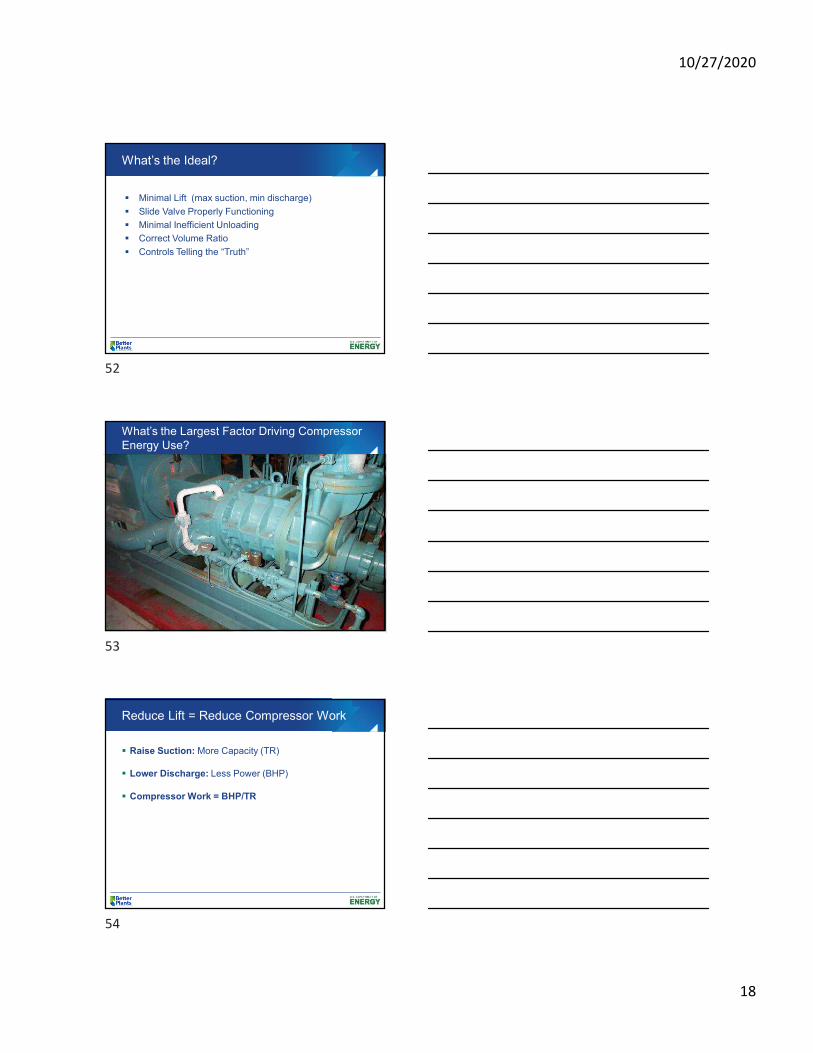
What’s the Largest Factor Driving Compressor Energy Use?
Reduce Lift = Reduce Compressor Work
Raise Suction: More Capacity (TR)
Lower Discharge: Less Power (BHP)
Compressor Work = BHP/TR
52
53
54

10/27/2020
19
Rules of Thumb
2% compressor savings per °F of increase in suction temperature
1.5% compressor savings per °F of decrease in condensing temperature
(Must work in saturated temperature, not pressure.)
Capacity in Graphic Form
0
50
100
150
200
250
-25 -20 -15 -10 -5 0 5 10
TR
Suction Temperature (°F)
Frick RWB II-134 Rated Capacity
TR @ 75.0°F
TR @ 85.0°F
TR @ 95.0°F
TR @ 105.0°F
Horsepower in Graphic Form
0
50
100
150
200
250
300
350
-25 -20 -15 -10 -5 0 5 10
BH
P
Suction Temperature (°F)
Frick RWB II-134 Rated Power
BHP @ 105.0°F
BHP @ 95.0°F
BHP @ 85.0°F
BHP @ 75.0°F
55
56
57

10/27/2020
20
What Does this Mean for Compressor Work?
0.0
0.5
1.0
1.5
2.0
2.5
3.0
-25 -20 -15 -10 -5 0 5 10
BH
P/T
R
Suction Temperature (°F)
Frick RWB II-134 Efficiency (Power per Unit of Capacity)
BHP/TR @ 105.0°F
BHP/TR @ 95.0°F
BHP/TR @ 85.0°F
BHP/TR @ 75.0°F
Facts & Figures Sheet
Rules of Thumb
2% Compressor savings per °F of increase in suction
temperature.
1.5% Compressor savings per °F of decrease in
condensing temperature.
Workbook – Page 7
58
59
60

10/27/2020
21
Compressor Lift Question 1
3 psig = -21°F
6 psig = -15°F
6°F increase in suction temp
6°F x 2% = 12%
12% x 3,000,000 kWh = 360,000 kWh
360,000 kWh x $.10 = $36,000/yearMaximum Suction Temperature =
Room or Application Temperature
- Coil Rated TD
Compressor Lift Question 2
110 psig = 68°F
100 psig = 63°F
5°F reduction in saturated discharge pressure
5°F x 1.5% = 7.5%
7.5% x 3,000,000 kWh / 2 = 112,500 kWh
112,500 kWh x $.10 = $11,250Maximum Suction Temperature =
Room or Application Temperature
- Coil Rated TD
100
80
60
40
20
0
-20
Suction and Discharge Limits
0°F Suction
60°F Head
0°F Room
60°F WB
61
62
63

10/27/2020
22
100
80
60
40
20
0
-20
Real-World Scenario
100
80
60
40
20
0
-20-12°F
Suction
75°F Head60°F WB
0°F Room
Coil Temperature Difference (TD)
Refrigerant
Temperature
(30°F)
Entering air
(40°F)
Entering Air Temperature – Refrigerant Temperature = Temperature Difference
40°F – 30°F = 10°F TD
Temperature
Difference
(10°F)
Suction Pressure—Setting Goals
Room or Application Temperature - Coil Rated TD= Maximum Suction Temperature
~12°F TD typical for refrigerant to air evaporators
~5°F TD typical for refrigerant to liquid evaporators
64
65
66

10/27/2020
23
What is Limiting Your Suction?
Pick your coldest zone
Assume a 12°F evaporator TD
Estimate what suction your equipment is rated for
Maximum Suction Temperature =
Room or Application Temperature
- Coil Rated TD
Rules of Thumb
2% Compressor savings per °F of increase in suction
temperature.
1.5% Compressor savings per °F of decrease in
condensing temperature.
Workbook – Page 8
Barriers to Lower Condensing Pressure
Minimum Pressure
Setpoint
Liquid Injection
Other?
Hot Gas Defrost
Misperceptions about VI
Tradition
Oil Separator
67
68
69

10/27/2020
24
Common Barriers to Lower Condensing Pressure
Hot gas defrost Heated zones Icing or other winter issues Water defrost and common
sump Oil separator performance Gas-powered valves or
unloaders Liquid injection oil cooling Screw compressor oil
carryover Underfloor heating
Control Pressure Receiver setup
Pumper drum setup Direct-expansion coils Process or door hot gas Inadequate liquid pressure
to serve loads Concerns about condenser
fan and pump energy Misperceptions about
volume ratio and efficiency Tradition
Rules of Thumb
2% Compressor savings per °F of increase in suction
temperature.
1.5% Compressor savings per °F of decrease in
condensing temperature.
Workbook – Page 9
Compressor Part Load
Two absolute rules:
1. Compressor efficiency is worse at lower loads
2. Speed control is the most efficient part-load control for screw compressors
70
71
72

10/27/2020
25
True or False—90% slide valve = 90% capacity?
How Does a Slide Valve Work?
How Does a Slide Valve Work?
73
74
75

10/27/2020
26
Slide Valve Position ≠ Capacity
0%
10%
20%
30%
40%
50%
60%
70%
80%
90%
100%
0% 10% 20% 30% 40% 50% 60% 70% 80% 90% 100%
% C
ap
aci
ty
% Slide Valve Position
Compressor Slide Valve Position to Capacity
2.2 vi
3.5 vi
5.0 vi
Activity—Compressor Slide Valve
Given: 3.5 Vi screw compressor at 90% slide valve position
Find: % capacity
72%
Activity—Compressor Slide Valve
Given: 3.5 Vi screw compressor at 0% slide valve position
Find: % capacity
18%
76
77
78

10/27/2020
27
Compressor Part-Load Performance
0%
10%
20%
30%
40%
50%
60%
70%
80%
90%
100%
0% 10% 20% 30% 40% 50% 60% 70% 80% 90% 100%
% P
ow
er
% Capacity
Compressor Capacity to Power
Slide Valve
VFD
Recip
Ideal
Compressor Part-Load Performance
What % power does a screw compressor use when the slide valve is fully unloaded?
~50%
VFDs vs. Slide Valves
Given: Two same-model, screw compressors, but one has a VFD. What is the power at 60% capacity?
Slide Valve
76%
VFD
62%
79
80
81

10/27/2020
28
VFDs vs. Slide Valves
Given: Two same-model, screw compressors, but one has a VFD. Which one is more efficient at full load?
Slide Valve
100%
VFD
103%
Compressor Part Load
What can we do about
compressor part load?
Compressor Staging
Right compressor. Right load. Right time.
82
83
84

10/27/2020
29
How are Compressors Sequenced?
OR
Efficiency Opportunities
Questions to consider:
Slide valve not operating properly?
Compressor current limiting?
Appropriate volume index control?
How is compressor oil cooled?
Economized compressors?
Slide Valve Calibrations
Does slide valve (SV) indicator gauge match control panel reading?
Do amps increase after SV already shows 100%?
Does the control panel never reach 100% SV reading?
Does the control panel ever reach below 0% or above 100% SV reading?
85
86
87

10/27/2020
30
Current Limiting
Definition: The compressor forces itself to unload, or is unable to fully load due to an indication of excessive motor current.
The concern: Compressors can’t fully load, or additional compressors may start. Inefficiency results from multiple unloaded compressors.
Why is This Compressor Current Limiting?
Current Limiting Causes
Improper VI
Amp reading out of calibration
Improper amp limiting settings in microprocessor
Too much, oil or refrigerant injection?
Some compressors have adjustable oil feed valves that should be properly tuned
Over cooling with liquid injection will increase compressor power
88
89
90

10/27/2020
31
Case Study
Screw compressors have an internal “volume ratio,” or VI. VI = Initial gas volume / Final gas volume Typically range from 2:1 to 5:1
Suction
Discharge
Initial Volume
Final Volume
Screw Compressor Volume Ratio
The “Ideal” Volume Ratio
The compressor discharges at exactly the same pressure as the condensing pressure.
In an over-compressed state, gas is compressed to a higher pressure than condensing and expands as it leaves the discharge port.
“Two steps forward, and one step back.”
91
92
93

10/27/2020
32
I
The “Ideal” Volume Ratio
In an under-compressed state some gas sneaks back into the compressor when the rotors open to discharge, then it gets pushed out, as the rotors turn further.
Over-compression generally has more of a penalty
than under-compression.
Under, or Over-Compression
0
20
40
60
80
100
120
140
160
Pre
ssu
re (
psi)
Compression Process
Examples of Over or Under-Compression
Be
gin
nin
g o
f C
om
pre
ss
ion
En
d o
f C
om
pre
ss
ion
Suction
Pressure
Discharge
Pressure
Over-Compression
Under-Compression
Compressor Volume Ratio
94
95
96

10/27/2020
33
How Does Auto VI Work?
Compressor Volume Ratio
Is the compressor operating at the proper volume index?
If it is fixed or manually adjustable, strive for an optimal VI
corresponding to the average conditions.
Correcting Volume Index Issues
Ask the manufacturer
Fix controls that are not working
Calibrate
Adjust
Modify (machine, change parts)
Run a different compressor
97
98
99

10/27/2020
34
Compressor Cooling Methods
Screw compressors Liquid injection
Water/glycol
Thermosiphon
Reciprocating compressors Water in cylinder and head jackets–most common
Refrigerant in jackets
Rotary vane Liquid injection
Water cooling
Example of Liquid Injection with TXV
Energy Issues
Injected refrigerant must be recompressed.
Injection requires a minimum liquid pressure for thermal expansion valve (TXV) to operate properly.
Oil heat is seen by high-stage on multi-stage system.
Example of Liquid Injection with EEV
Energy Issues
Electronic Expansion Valve (EEV) usually eliminates liquid pressure as a barrier to lowering condensing pressure.
Still have injection penalty
Oil heat still goes to next stage (if booster)
100
101
102

10/27/2020
35
Example of Thermosiphon Oil Cooling
Energy Issues
Oil heat goes directly to condenser (good)
Does not limit condensing pressure (good)
Economized Screw Compressors
An Economizer with a Regulator
103
104
105

10/27/2020
36
What’s Wrong? (Compressor Panel)
Top Compressor Action Items
Optimize Suction Pressure
Optimize Condensing Pressure
Use your Best Part-Load Option
Calibrate
Address Improper Volume Ratio
Optimize Economizer Operation
Address Current Limiting Issues
[insert Break slide]BREAK
106
107
108

10/27/2020
37
Activity—Compressors
Brainstorm:
1. The ways the compressor could be operating inefficiently
2. How you identify the symptoms
3. How you fix it
Activity—Compressors
1. Suction & Discharge
2. Slide Valve
3. Current Limiting
4. Volume Index
5. Oil Cooling
6. Oil Carryover
In 15 minutes, share your findings with the group.
Rules of Thumb
2% Compressor savings per °F of increase in suction
temperature.
1.5% Compressor savings per °F of decrease in
condensing temperature.
Compressor Group Activity
109
110
111

10/27/2020
38
Compressor Activity & Homework
Back at your plants, fill out compressor check sheets:
One compressor – Everything you can
Remaining compressors – Can skip difficult parts
We will review on Thursday.
Please direct questions to [email protected]
Homework - Compressor Check Sheet
Homework - Compressor Check Sheet
112
113
114

10/27/2020
39
Rules of Thumb
2% Compressor savings per °F of increase in suction
temperature.
1.5% Compressor savings per °F of decrease in
condensing temperature.
End of Session 1
115


