
100 SMART CITIES - MOVING AHEAD TO BUILD - … SMART CITIES - MOVING AHEAD TO BUILD INDIA’S...
40
100 SMART CITIES - MOVING AHEAD TO BUILD INDIA’S LIVABLE CITIES Jagan Shah Director National Institute of Urban Affairs
Transcript of 100 SMART CITIES - MOVING AHEAD TO BUILD - … SMART CITIES - MOVING AHEAD TO BUILD INDIA’S...

100 SMART CITIES - MOVING AHEAD TO BUILD INDIA’S LIVABLE CITIES
Jagan Shah
Director
National Institute of Urban Affairs


Jaipur, built in late 18th century

Chandni Chowk, c. 1900
Mughal route map of Shajehanabad


Advert for concrete, Journal of the Indian Institute of Architects, 1946

Kolhapur-Sangli-Miraj-Kupwad
Coimbatore-Tirupur-Erode-Bhavani- SalemBangalore-Vellore-Chennai
Peri-urban areas support 9% of the country’s population and provide 18% of the employment on 1 per cent of the country’s land area (12th FYP)
Urbanization – rapid spatial expansion (80% over last 10 years)

SAHARANPUR
MORADABAD
RAMPUR
BAREILLY
AGRA
LUCKNOW
KANPUR
JHANSIALLAHABAD
VARANASI
GHAZIABAD
ALIGARH
100 Km
60 Miles
N
Source: Nighttime view of Southern Asia, November 2012.
earthobservatory.nasa.gov

Sectoral ProfilePrimary
Secondary
Tertiary ECONOMY
36,371
18230
20266
23710
26525
28306
28495
35,125
1553615041
22598
17321
SAHARANPUR
MORADABAD
RAMPUR
BAREILLY
AGRA
LUCKNOW
KANPUR
JHANSIALLAHABAD
VARANASI
GHAZIABAD
ALIGARH
Per Capita Income (Rs) at 2004-05 constant
prices, 2012-13
Source: Directorate of Economics and Statistics of Uttar Pradesh,
Unit Level Data of NSSO on employment/unemployment 2012-13
Work-Force Participation
BPL Population
Varanasi and Agra among top Indian cities
with maximum self-employed. Varanasi has
highest female work force participation in India
at 35%, while Agra has lowest at 2%
Agra with highest per capita income has equal
focus on Manufacturing (Leather, foundry,
engineering) and Tourism, while Varanasi with
similar sectoral profile is based on craft-based
industries such as saris, food processing etc.

Comparison between City Size (Sqkm) and
Population Density
Source: Census of India, 2011
City Size (Km)
Population Density
(P/km2)
SAHARANPUR
MORADABAD
RAMPUR
BAREILLY
AGRA
LUCKNOW
KANPUR
JHANSIALLAHABAD
VARANASI
GHAZIABAD
ALIGARH
Sanitation
Power
Water Supply
Housing
Road Density
Access to
Internet at
Household
Level

13
75
2
5
6
49
411 3
7
7
3
1
1
2 1
22
1
2
1

• UID Integration with Planning and Execution
• GIS enables integration of planning, finance and management
• Fast growth in availability of Big Data
• 904 million wireless subscribers (TRAI, Mar 2014)
• Urban Tele-density – 140 connections per 100 inhabitants
• Youthful society can fully utilize ‘Smart’ paradigm
• Innovation & Enterprise Potential (Frugal Technologies)
• IT industry among fastest growing in the country
• High Acceptance of E-Governance:In 2012, 98,000 Common Service Centres providing E-governance services; over 600 out of 1100 citizen and business services available electronically
OPPORTUNITIEDS

• India will have about 400 million additional persons in the labour force bythe year 2050.
• Agriculture and related activities that provide subsistence to about 220million of the current workforce of 500 million cannot absorb thisadditional labour without further reducing levels of earnings.
• There has to be a massive transfer of people from primary tosecondary and tertiary sectors, and from rural to urban areas.
• Industries and businesses are moving away from megacities into lowerorder cities or rural locations, while the informal sector is moving into themegacities.
• It is the non-polluting tertiary activities and growth of select informal sector that are driving the limited urbanization in million plus cities
• Informal livelihoods must be integrated into urban plans and zoning regulations: unorganized workforce gains access to markets and basic amenities
THE BIGGEST CHALLENGE: LIVELIHOODS

“Drive economic growth & improve quality of life
by enabling local development & harnessing technology as a means to create smart outcomes for citizens ”
SALIENT FEATURES
• Competitive
• Citizen Engagement
• Area Based Development
• Retrofit (500 acres+)
• Redevelop (50 acres+)
• Greenfield (250 acres+ with 80% ‘green’ buildings)
• Pan-city solutions
• 10% Solar Power
• ICT for service delivery
• Strategic Planning
• Replicability
• Convergence
SPECIAL PURPOSE VEHICLE
• Limited company incorporated under Companies Act, 2013 at City Level
• Plan, Appraise, Release Funds, Implement, Manage, Operate, Monitor and Evaluate Smart City Development Projects

Citizen Engagement
MEASURES OF CITIZEN ENGAGEMENTI. Self Assessment- 4 cities in Scenario 4- Cities supported their claim with ongoing activities
II. Citizen Engagement Framework- Three rounds as defined by SCP- IAP2 (Int. Assoc. for Public Participation) framework used by Bhubaneshwar- Other cities adopted three step process with some modifications
III. Future scenario- All cities aspire for scenario 4- Few cities have projects for citizen engagement on an ongoing basis
INCLUSION- Mostly included elderly, women, youth and slum dwellers. Some cities also included children, alternate genders, tourists and migrants- Focus on representative participation than individuals in many cities- Locally relevant means were used in most cities to reach to maximum citizens; included street plays, songs, jingles, student competitions
Step 1
VISIONING EXERCISE
• Maximum engagement in visioning exercise
• Open ended- competitions (drawing, essays, logos)
• Close ended-(voting on priority areas identified by city authorities after engagement with selected citizens)
Step 2
AREA BASED DEVELOPMENT
•Citizens were involved majorly in selection of area from priority areas identified by city authorities
•Few cities involved citizens in identifying projects within ABD in addition to selection of area
PAN CITY SOLUTION
•Citizen aspiration based on priorities identified in visioning exercise
•Some cities in addition added solutions based on expert opinion which were not chosen by citizens
Step 3
FINAL SCP
• Cities shared the Draft SCP on MyGov or city websites
THREE STEP PROCESS

Convergence Agenda
• 12% of total budgets of 20 cities are through convergence
• Government of India schemes and programs for convergence:
– AMRUT (water supply, sewerage, storm water drains, open spaces)
– HRIDAY (heritage conservation)
– Housing for All / PMAY
– Swacch Bharat (total sanitation)
– Digital India
– National Solar Mission
– National Urban Health Mission
– Make in India + Skill India
– National Livelihoods Mission
– IPDS (Integrated Power Development Scheme)
– FAME (Faster Adoption & Manufacturing of Hybrid & Electric Vehicles)
• Solapur (46%) and Guwahati (35%) have highest convergence funding identified.
• AMRUT (26%), IPDS (13%) and PMAY (6.5%) are the most identified sources of convergence funding

• Leverage factor: 2.2 of smart city grants
• Land monetization most widely used mechanism within own source revenue
• Borrowing is the least preferred option
• Ahmedabad (Rs 4110), Chennai (Rs 2918) and Surat (Rs 5820) have the lowest per capita expenditures in their smart city plans
• Solapur, Belgavi and Kakinada have the most diversified portfolios for resource mobilization.
30%
12%
13%
32%
8%5%
Smart City Grants Convergence
Public Private Partnerships Own Source Revenue
Borrowing Others (CSR)
FUNDING SOURCES FOR LIGHTHOUSE CITIES
Financial Mobilization in 20 Lighthouse Cities


Lighthouse Cities
The Story So Far and the emerging landscape
MILESTONES
• Target: 100 cities in 3 years
• Mission launched 25 June 2015
• 20 lighthouse cities identified
• 13 cities added through ‘fast track’
• Round 2 submissions on 30 June

DIVERSITY
• Geographically spread in 12 states; hilly areas to semi-desert; coastal and landlocked; metropolitan and intermediary
• Port cities, market towns, tourist destinations, administrative cities and industrial cities
• Different civic status-Municipal Council/ Corporation
• Population size between 0.2 and 5.5 Million
• Total population = 35.2 million
• Density range from less than 5000/sqkm to more than 25000/sqkm
• Varying financial health: credit ratings, borrowing capacities, bonds
Profile of Lighthouse Cities

PAN CITY PROPOSALS
• ITS and Urban Mobility (15)• e-Gov services (8)• Smart Water & Sewerage Mgt. (8)
• Smart Solid Waste Mgt. (7)• Smart Energy Mgt. & LED Lighting (6)
• Control & Command center (5)• m-Gov Services (4)• Citizen engagement Platform (3)• GIS Mapping & e-Town Planning (3)
• Security & safety (2)• Smart Disaster Mgt (2) • Smart education & health (1)• Incident Response Center (1)
•Smart sensors and devices (20)
•Open data, city dashboards, city apps (20)

AREA BASED PROPOSAL
• Affordable Housing (11)
• Open space management (11)
• Lake and river precinct (10)
• Transit infrastructure (9)
• Central business district and markets (7)
• Heritage area (7)
• Street facade improvement (3)
• Flood management (3)
• Incubation centre (6)
• Museum (2)
• Mega projects- Stadium, Convention centre etc. (2)

New Delhi Municipal CouncilPan City Proposal│ ICT Based │Budget INR 528 CrSmart grid implementation - Smart Grid & Energy Management project shall help in peak load management, renewal energy integration, improvement in operational efficiency & consumer services.
Kochi Municipal CorporationArea Based Proposal│ ICT Based │ Budget INR 175.8 CrProvision of grid connected solar panels for at least 40% HHs; 24*7 Power supply with complete underground wiring to reduce T&D losses
Energy in 20 cities
Energy related measures:
o Smart Grido Rooftop Solar Panels o Air Quality Monitoringo LED Street Lightingo Smart Poleso Smart Bus Shelterso Wind Power Generationo Greenway Projectso Waste to Energy o Smart sensorso Smart Meterso Central command and control
Center
Bhopal Municipal CorporationArea Based Proposal│ ICT Based Bhopal Smart City would be a highly energy efficient urban zone, all street light would be LED based with Solar Panels, Smart Grids would be used to contain Transmission & Distribution Losses
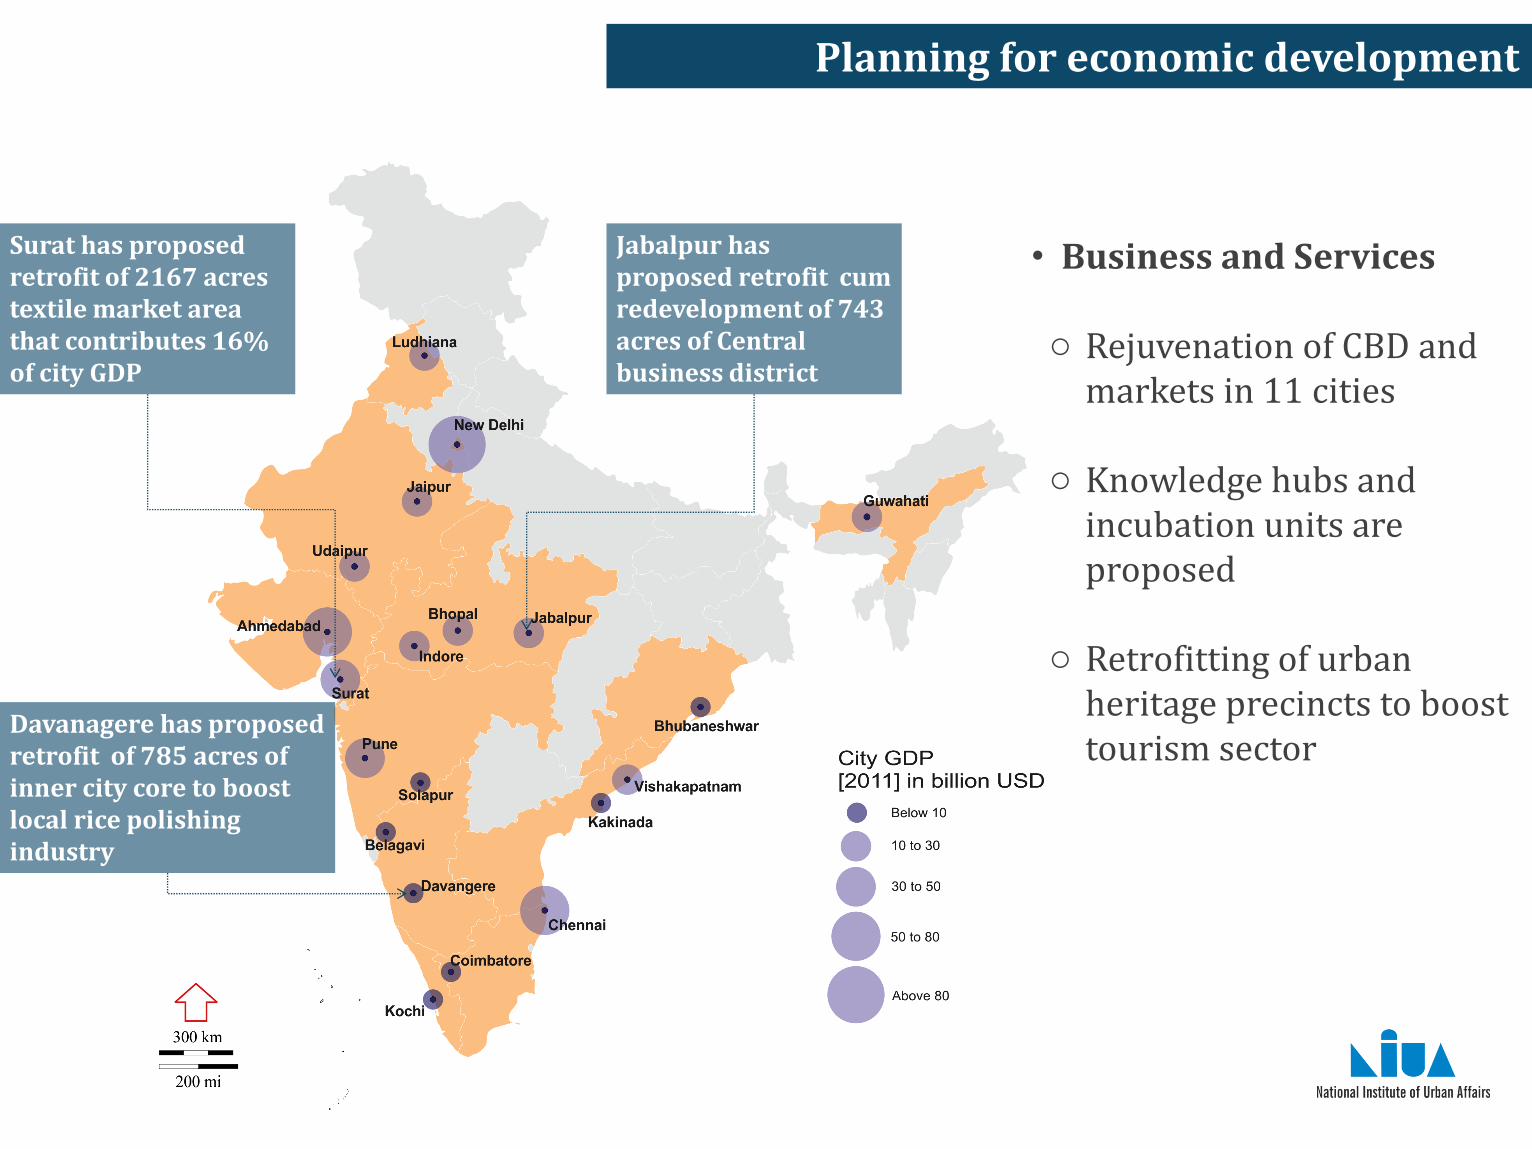
Surat has proposed retrofit of 2167 acres textile market area that contributes 16% of city GDP
• Business and Services
o Rejuvenation of CBD and markets in 11 cities
o Knowledge hubs and incubation units are proposed
o Retrofitting of urban heritage precincts to boost tourism sector
Jabalpur has proposed retrofit cum redevelopment of 743 acres of Central business district
Planning for economic development
Davanagere has proposed retrofit of 785 acres of inner city core to boost local rice polishing industry

Mobility Projects in 20 cities
• Total Central and State Govt for 100 Smart Cities: €13.2 Billion
• 20 Lighthouse Cities• Total Investments –
€6.8 Billion
• Integrated mobility projects as part of SCP – 212 projects
• Total budget committed to 212 mobility projects - €1.62 Billion
• ~25% of budget for Mobility
• NMT (Bicycle and Pedestrian Infrastructure) - € 350 Million
• Mobility ICT/ITS Systems - €210 Million
• Mobility Investment per capita - €46
• €1.62 Billion committed to integrated mobility across 20 cities
• NMT, smart parking, ITS, Public transit and TOD the most common.

• Sustainability projects as part of SCP –256
• Total budget committed to 186 projects –€1.6 Billion
• 25% of budget for Sustainability
• Investment Average - € 46/capita
Four scales of intervention• Green city design and resilient
infrastructure – € 968 Million• Energy efficient public transport- €118
Million• Energy efficient and sustainable
buildings - € 307 Million• Smart energy systems and grids for
cities- € 339 Million
Sustainability Projects in 20 cities
• Guwahati proposed € 210 Million environmental retrofit of river and river precinct.

Potential projects for intelligent and green buildings
• Ahmedabad: 75 Acre redevelopment
• Jabalpur and Indore: SPV monetizes 20 million sq. feet as residential and commercial space in redeveloped land.
• Bhopal: Unlock 350 Acres of underutilized prime land
• Slum redevelopment and affordable housing in 11 cities, mega projects in 2 cities
Green Building Potential in 20 cities
• Integrated Building Management Systems • Automation, energy/water saving fixtures• Rainwater harvesting, water recycling.• Promotion of local materials• GRIHA rating

EMERGING THEMES / CHALLENGES / OPPORTUNITIES
INTEGRATED MOBILITY
ENERGY SUSTAINABILITY AND CLIMATE CHANGE
LOCAL ECONOMIC DEVELOPMENT
ROLE OF ICT
CITIZEN ENGAGEMENT
GREEN BUILDINGS
CONVERGENCE
RESOURCE MOBILIZATION

DEMOGRAPHY
• Annual growth rate of population: ~2.35 % (2.76)
• Average density: 8502 persons per square km.
• Average area of 20 smart cities: 135.6 sq.km. (Average area of Urban
India: 12.92 sq.km.)
• 85.68 of the population is literate (84.11)
• 57.67 of the households live in self-owned houses (69.1)
• 28.3 of households live in congested houses (32.9)
• 18.1 percent resides in slum areas (17.4)
• Every 13th person is poor (~7%) (13.7)
• Youth: 17.9 % of total population (19.6)
ECONOMY
• Working age group: 60.25 % population (65.2)
• Workforce participation: 35.8 % (35.5)
• Per Capita Income: Rs. 43,797 per month (~584 Euro) (Rs. 35,947)
• Employment: Self-employed- 41.8% (42.0%), Regular wage/salaried
employees- 42.1% (44%), Casual Labour- 16 % (14%)
• Sectors: Primary Sector 6.5% (8%), Secondary Sector 35.2 % (34%),
Tertiary Sector 58.2% (58%)
TACKLING COMPLEXITY - 1

INFRASTRUCTURE
• 75.7 % households have access to tap water (62.01)
• 95 % households have access to electricity (92.67)
• 80.7 % households have toilet facilities within premises (72.5)
• 86.6 % households are connected to drainage (81.7)
• 9.5 % households have access to computer with internet (8.2)
• 65.35 % households have mobile phones (64.3)
• Mobility: Bicycle – 43.7% (41.9) , two-wheelers – 41.7% (35.2%), four-
wheelers – 12.2% (9.7%)
GOVERNANCE
• Elections held regularly but tenure of mayor is not fixed (1.5 - 5 yrs)
• 50 % of the statutory towns do not have a development (master) plan
• On average, 25 % of the municipal budget is allocated for the poor
• ‘Own Revenues’ comprise ~ 50 % of the city’s earnings; grants and aid
constitute the remaining half
• Property Tax comprises ~ 70 % of the ‘Own Revenues’; remaining
comprises user charges, license fees and other taxes
TACKLING COMPLEXITY - 2

TWELFTH SCHEDULE (Article 243W): 18 MUNICIPAL FUNCTIONS
1. Urban planning including town planning
2. Regulation of land-use and construction of buildings
3. Planning for economic and social development
4. Roads and bridges
5. Water supply for domestic, industrial and commercial purposes
6. Public health, sanitation conservancy and solid waste management
7. Fire services
8. Urban forestry, protection of the environment and promotion of ecological aspects
9. Safeguarding weaker sections, including handicapped and mentally retarded
10. Slum improvement and upgradation
11. Urban poverty alleviation
12. Provision of urban amenities and facilities such as parks, gardens, playgrounds
13. Promotion of cultural, educational and aesthetic aspects
14. Burials and burial grounds; cremations, cremation grounds and electric crematoriums
15. Cattle pounds; prevention of cruelty to animals
16. Vital statistics including registration of births and deaths
17. Public amenities incl. street lighting, parking lots, bus stops and public conveniences
18. Regulation of slaughter houses and tanneries
TACKLING COMPLEXITY – 3

Promoting Innovation
• Example: Building façade with Solar Panels
Energyo Integrated Energy and E-waste
Management policyo Green MobilityBuilding Construction and
Materialso Integrated Building Systemso Research in Bamboo and
recycled/ salvaged materialso Research in Disaster ResilienceUrban Management o Use of Big data in urban
simulation and modelingo Curricula of current architecture
and urban planning institutionso Urban Networks & Systemso IOT, convergence of multiple
networks and technologieso Integrated city Management
Platformo Reliability, Security and Accuracy
of data

60% of the population of
Barcelona is within 600m
of a subway line (99kms of
subway lines and 136
metro stations)
To provide the same accessibility as
Barcelona, Atlanta would have to
build 3,400 km of metro line
(compared to the current 74 km)
and build 2,800 new railway
stations
Compact City Urban Sprawl
Selecting the Appropriate Role Models

Thinking Holistic

• Promote e-Governance
• Leverage Diversity
• Decentralize development models
• Ensure Convergence
• Integrated policies and planning
• Support economic vibrancy
• Promote ‘decoupling’
• Build Public Trust
THE SMART WAY AHEAD

• KNOW-HOW (SKILL INDIA)
• RESEARCH
• MAKE (TECHNOLOGY) IN INDIA
• INVEST IN PUBLIC-PRIVATE-PARTNERSHIP
• SUPPORT (START-UP) ENTREPRENEURS
OPPORTUNITIES FOR INDO-GERMAN PARTNERSHIPS


