100% business rate retention pilots: what can be learnt ... · 100% business rate retention pilots:...
18
100% business rate retention pilots: what can be learnt and at what cost? IFS Briefing note BN233 Neil Amin-Smith David Phillips Polly Simpson
Transcript of 100% business rate retention pilots: what can be learnt ... · 100% business rate retention pilots:...
100% business rate retention pilots: what can be learnt and at what cost?
IFS Briefing note BN233
Neil Amin-SmithDavid PhillipsPolly Simpson

100% business rate retention pilots: what can be learnt and at what cost?
Neil Amin-Smith David Phillips Polly Simpson
Copy-edited by Judith Payne
Published by
The Institute for Fiscal Studies
ISBN 978-1-911102-90-8
The report was funded by IFS’s Local Government Finance and Devolution Consortium. The main consortium supporters are the Economic and Social Research Council (ESRC) through grant ES/M010147/1, PwC, Capita, and the Chartered Institute of Public Finance and Accountancy (CIPFA). Additional consortium supporters include the Municipal Journal, the Society of County Treasurers, and a range of councils from across England. The authors would like to thank members of the consortium group and Rowena Crawford, Carl Emmerson, and Paul Johnson for providing helpful comments on earlier drafts of this work. Any errors and all views expressed are those of the authors alone.
2 © Institute for Fiscal Studies
Executive summary The business rates retention scheme (BRRS) means that councils bear a proportion of the real-terms change in business rates revenues in their areas. When the BRRS was introduced in 2013–14, this proportion was up to 50%. However, since April 2017, the government has been piloting 100% retention of real-terms changes in business rates revenues in a number of areas of England. From April 2018, a further 10 areas are piloting 100% schemes.
In this briefing note, we examine two questions. First, what are the financial implications of the pilots for different councils? In particular, what is the financial benefit to councils taking part in the pilots, and what does this imply for those councils not in pilot areas? Second, what can be learnt from these pilots? The government has explicitly set out what it hopes to learn, but how informative are the pilots actually likely to be?
What are the pilot schemes? Pilot areas retain 100% of any real-terms changes in business rates revenues. A ‘no
detriment’ clause protects all pilot councils from losing out relative to a situation where they had instead remained under 50% retention.
There is considerable variation across pilots in how revenues are divided between upper- and lower-tier councils. In most two-tier pilot areas, counties will now retain a greater share relative to districts than under the rules of the 50% retention system.
Pilot councils in the second wave of pilots are required to form pools with the other pilot councils in their areas. The pooling arrangements – how revenue will be shared and, to some extent, spent – have not been systematically published in full despite having a potentially significant effect on individual councils’ funding.
Where are the pilot areas? Pilot areas in the first wave were chosen by the Ministry of Housing, Communities and
Local Government (MHCLG). For the second wave, areas were invited to submit bids to become pilots and MHCLG chose 10 areas from among those that applied.
Pilots in the first wave are mostly in urban areas; those in the second wave mostly in rural areas. Accordingly, the first wave mostly consists of Labour-controlled councils, and the second wave Conservative-controlled councils. There is a mix of councils from the north and south of England. Together the pilot areas cover 53% of the English population and raise 63% of English business rates revenues.
What are the financial implications of the pilots? Pilots will gain as a result of retaining 100% rather than 50% of any real-terms growth in
revenues in 2018–19. In addition, the way the system has been set up means they will also benefit from 100% (rather than 50%) of any real-terms growth since 2013–14.
These factors, among others, lead us to estimate that pilot areas will see a financial benefit in 2018–19 of around £870 million in total, calculated based on councils’ revenue forecasts. This is equivalent to 3.6% of pilot councils’ core spending power, or almost 2% of the spending power of all councils. This financial benefit represents a cost
© Institute for Fiscal Studies 3
to central government, to which this revenue would otherwise have flowed. This revenue could have been used to reduce the budget deficit, or fund tax cuts or higher central government spending. There is therefore an ‘opportunity cost’ to the 100% business rates retention pilots.
One alternative option for using this money would have been to have increased grant funding for all English councils instead. £870 million, equivalent to 2% of councils’ core spending power, would have enabled an increase in grants of £16 per person, on average. If this had been allocated according to official assessments of spending needs, one-in-ten areas would have seen spending power that was £16.80 per person or 2.1% higher than is currently planned for 2018–19. But most – although not all – pilot areas would have received less funding, as they gain more from pilot status than they would have gained from needs-based grants.
What can be learnt from the pilots? The government’s stated goals for the second wave of pilots are to ‘test more technical
aspects of the 100% business rates retention system, such as tier-splits’, allow councils to make decisions jointly, and test councils’ administration and technical planning.
The scope for learning from the pilots is likely to be limited though. The non-random selection of pilot areas means they are unlikely to be representative of all councils. And with the pilots only guaranteed to last until the end of 2018–19 councils’ responses may differ substantially from how they would respond to the longer-term introduction of 100% retention. In addition, the ‘no detriment’ clause means councils are not facing the risks that they would under nationwide 100% retention.
There may, on the other hand, be other benefits to the government of running the pilot schemes. For instance, they may help maintain the momentum of local government finance reform following the setback of the June 2017 election (since which time the legislation to take forward previous plans for a national roll-out of 100% rates retention has not been resurrected).
4 © Institute for Fiscal Studies
1. Introduction The business rates retention scheme (BRRS) was introduced in April 2013 to provide councils with stronger financial incentives to support property development and boost the economy in their local areas. It means that councils bear a proportion of the real-terms change in business rates revenues in their areas: gaining when revenues grow in real terms, losing when they fall. That proportion was initially set at 50% across England.
However, since April 2017, the government has been piloting 100% retention of real-terms changes in business rates revenues in parts of England: Cornwall, Greater Manchester, Merseyside, the West of England (Bristol and environs) and the West Midlands. A further 10 areas started piloting 100% retention from April 2018, having been chosen from over 20 areas that submitted bids to be pilots in Autumn 2017.
In this briefing note, we examine two questions. First, what are the financial implications of the pilots for different councils? In particular, what is the financial benefit to councils taking part in the pilots, and what might this mean for those councils not in pilot areas? Second, what can be learnt from these pilots – the government has explicitly set out what it hopes to learn, but how informative are the pilots actually likely to be?
It is worth noting that it is not clear what will happen to these pilots after 2018–19. The government previously intended to roll out 100% retention across England in 2019–201 and the pilots could presumably have been rolled into that national scheme. This plan, however, was put on hold following the June 2017 general election. The government now plans to roll out a 75% retention scheme in 2020–21 instead.2 The pilots may therefore prove short-lived or could remain in place alongside a more general scheme of 75% retention across the rest of the country.
1 HM Treasury, ‘Chancellor unveils “devolution revolution”’, October 2015,
https://www.gov.uk/government/news/chancellor-unveils-devolution-revolution. 2 Department for Communities and Local Government, ‘Provisional local government finance settlement 2018
to 2019: statement’, December 2017, https://www.gov.uk/government/speeches/provisional-local-government-finance-settlement-2018-to-2019-statement.
© Institute for Fiscal Studies 5
2. What, and where, are the pilot schemes?
What does being in a pilot scheme entail?
The key element of the pilot schemes is that areas taking part retain 100% of any real-terms changes in business rates revenues. In addition to this, the levies on growth that are paid by some councils under 50% retention are not paid by councils in pilot schemes.3 In view of the fact that the move from 50% to 100% retention increases councils’ exposure to financial risk, safety-net payments are made to councils whose retained revenues fall below 97% of pre-determined funding needs – as opposed to 92.5% under 50% retention.4
As part of all pilot schemes, councils have agreed to forgo general grant funding (known as the Revenue Support Grant) from the Ministry of Housing, Communities and Local Government (MHCLG).5 On top of this, different areas have agreed to other cuts to their funding. For example, London and the West of England have agreed to cuts to funding from the Department for Transport, councils in Liverpool no longer receive the improved Better Care Fund (a ring-fenced fund for adult social care), and Greater Manchester councils have given up the Public Health Grant. Pilot councils will not lose out by forgoing any such funding – the tariffs they pay or the top-ups they receive from the business rates retention system will be adjusted to ensure this.
How are retained revenues shared within pilot areas?
Each pilot area typically covers a cluster of councils, sometimes with a unifying combined authority. Arrangements differ in the specifics of how retained business rates are shared within pilot areas – these differences reflect different approaches to risk sharing and strategic coordination. In particular, there are two ways in which pilots can differ in how revenues (and the associated risks) are shared by their constituent councils – through differing tier shares and through pooling arrangements.
Tier shares A council’s ‘tier share’ defines the share of locally raised business rates revenues that it formally retains. In areas where there are two ‘tiers’ of local government (e.g. where there
3 Levies are paid by councils estimated to be able to raise more in business rates revenues than they are
assessed to need from rates retention. They mean that such councils in fact retain less than 50% of any real-terms growth in revenues under the current 50% retention policy.
4 Note that as under the 50% retention scheme, all councils in pilot areas are exposed to ‘appeals risk’ – if the tax base in their area changes due to businesses appealing their valuations, councils are not compensated by central government. This differs from the plans outlined in the government consultation for England-wide 100% retention, which suggested that appeals risk would be centralised when retention increased to 100%. See Department for Communities and Local Government, ‘100% business rates retention: further consultation on the design of the reformed system’, 2017, https://assets.publishing.service.gov.uk/government/uploads/system/uploads/attachment_data/file/592368/100__Business_Rates_Retention_-_Further_Consultation.pdf.
5 Prior to 8 January 2018, MHCLG was the Department for Communities and Local Government (DCLG). In this briefing note, we refer to the department as MHCLG but we list the source for reports and data from prior to 8 January 2018 as DCLG.
6 © Institute for Fiscal Studies
is both a county and a district council), these tier shares thus define what share of locally raised revenues is to be retained by each tier. Tier shares have been set for pilot councils at levels agreed to by both the pilot councils and MHCLG.
In single-tier pilot areas, these tier shares have increased to 99% or 100%, reflecting the move from 50% to 100% retention.6 However, in areas with multiple tiers of government, there is more variation. For example, in the West of England the combined authority has a tier share of 5% (leaving the other three councils each with 94% shares of the revenues raised in their respective areas),7 whilst in the West Midlands pilot the combined authority has a tier share of 0%. In two-tier areas, some pilots (e.g. Surrey) have allocated their county council 70% of retained revenues – thus leaving 30% for the district councils in the area – whilst others (e.g. Suffolk) have allocated only 20% to the county council – with 80% being retained by the local district councils.
All else being equal, a smaller tier share means facing less of the risk (or reward) of fluctuations in business rates – receiving a smaller share of any growth but also having to bear a smaller share of any losses. Under the current 50% retention policy, county councils are assigned one-fifth of locally retained revenues and districts four-fifths, implying a ratio of 1:4 in the split between counties and districts. By contrast, the ratio in almost all pilot areas will mean that counties will retain substantially higher shares of locally retained revenues relative to the districts in their areas than before. For example, in Surrey this ratio will instead be 7:3. Amin-Smith et al. (2018)8 recently argued that such a change could bring about a more sustainable balance of risk and reward across all councils – counties are bigger than districts, with larger budgets and broader tax bases, and therefore may be better able to bear volatility in business rates.
Pooling arrangements In areas covered by the second wave of pilots (which tend to be two-tier county areas), councils are required to form a business rates ‘pool’ with the other councils in their cluster whereby gains and losses are shared. In these areas, formal tier shares will only partly explain the inter-council division of revenues. In fact, pilot areas have had to themselves specify how revenues will be pooled and utilised strategically to support growth and financial sustainability and have adopted a range of approaches.
Surprisingly, given the potential effect that pooling arrangements could have on individual councils’ budgets, pilot schemes have not been required to make these arrangements public. However, the Berkshire pilot proposal provides an example of the sorts of deviations from formal tier shares that might be possible. Whilst all unitary authorities in Berkshire will nominally retain 99% of locally raised revenues (the remaining 1% is allocated to the area’s fire authority), in practice ‘the authorities themselves propose to retain only 30% of any additional resources retained within Berkshire’ and the pilot as a whole will invest £25 million of locally retained revenues in strategic infrastructure.9
6 The figure is 99% in most single-tier areas and some two-tier areas – 1% of local revenues are retained by the
local fire authority where this is separate from the single-tier or upper-tier council. 7 The remaining 1% of revenues is allocated to Avon Fire and Rescue Service. 8 N. Amin-Smith, D. Phillips and P. Simpson, Spending Needs, Tax Revenue Capacity and the Business Rates
Retention Scheme, IFS Report R141, 2018, available at https://www.ifs.org.uk/publications/10542. 9 Details from ‘Berkshire pilot submission – summary of key points’, sent to the authors by a representative of
the Berkshire pilot.
© Institute for Fiscal Studies 7
A summary of other areas pooling arrangements has been made available.10 In general these pools tend to provide for some form of internal no-detriment clause for their constituent councils. The Derbyshire pool offers a typical example of this – stating that ‘each authority, where resources allow, will receive the same level of funding they would have received had they acted under the 50% scheme.’ Most, but not all, of the pooling arrangements also provide for some proportion of the gains from being a pilot scheme to be spent collectively on investment. But this proportion differs across pools.
What do the pilot areas look like?
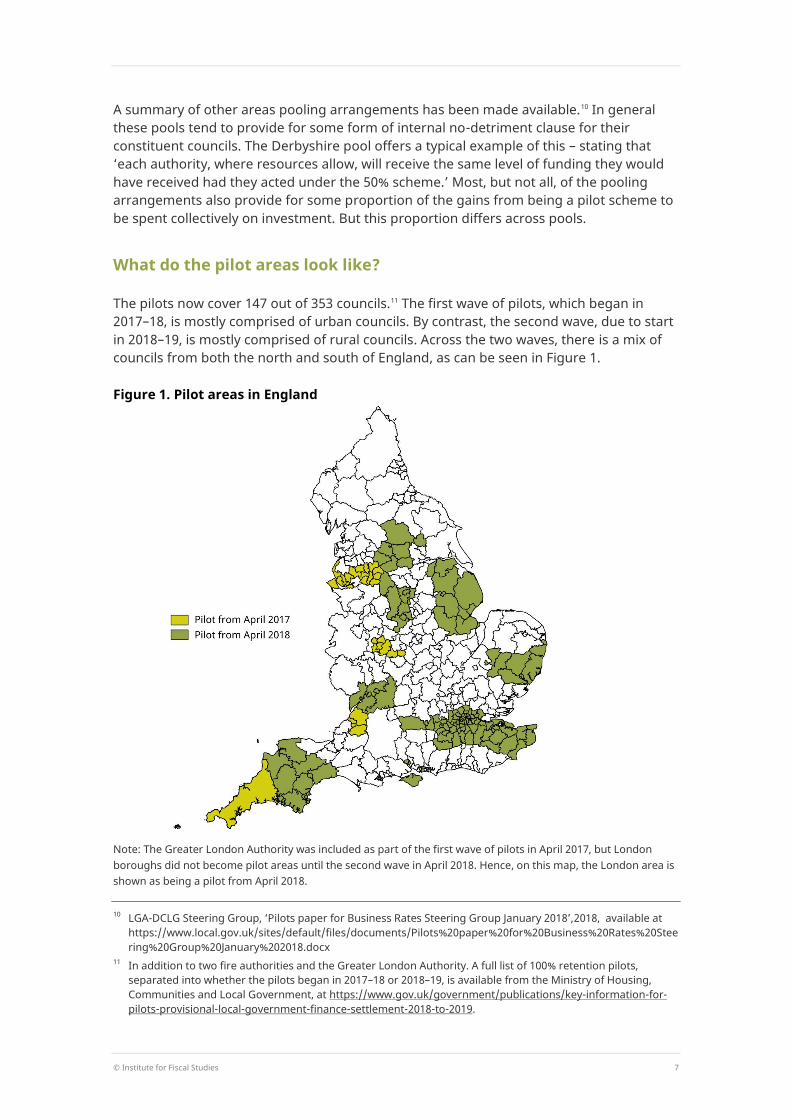
The pilots now cover 147 out of 353 councils.11 The first wave of pilots, which began in 2017–18, is mostly comprised of urban councils. By contrast, the second wave, due to start in 2018–19, is mostly comprised of rural councils. Across the two waves, there is a mix of councils from both the north and south of England, as can be seen in Figure 1.
Figure 1. Pilot areas in England
Note: The Greater London Authority was included as part of the first wave of pilots in April 2017, but London boroughs did not become pilot areas until the second wave in April 2018. Hence, on this map, the London area is shown as being a pilot from April 2018.
10 LGA-DCLG Steering Group, ‘Pilots paper for Business Rates Steering Group January 2018’,2018, available at
https://www.local.gov.uk/sites/default/files/documents/Pilots%20paper%20for%20Business%20Rates%20Steering%20Group%20January%202018.docx
11 In addition to two fire authorities and the Greater London Authority. A full list of 100% retention pilots, separated into whether the pilots began in 2017–18 or 2018–19, is available from the Ministry of Housing, Communities and Local Government, at https://www.gov.uk/government/publications/key-information-for-pilots-provisional-local-government-finance-settlement-2018-to-2019.
8 © Institute for Fiscal Studies
In terms of the politics of pilot areas, 19 out of 27 of the 2017–18 pilot councils are under Labour control and 4 under Conservative control (the remainder were under no overall control). By contrast, out of the 120 councils in the new 2018–19 pilot areas, only 33 are under Labour control, whilst 69 are under Conservative control. These figures reflect the urban–rural split between the first and second waves of pilots – more rural areas tend to contain more Conservative voters and vice versa.
Table 1 summarises further characteristics of the pilot areas. It shows that around 53% of the population lives in a pilot area, although these areas account for 63% of national business rates revenues. This high revenue share is driven by the inclusion of London as a pilot area in 2018–19 – London councils generate 33.8% of overall business rates revenues whilst housing only 15.9% of the English population.
Table 1. Characteristics of pilot and non-pilot councils 2017–18
pilots 2018–19 pilots
Non-pilot areas
Share of population 15.7% 37.0% 47.3%
Share of national business rates revenues 12.2% 51.1% 36.7%
Index of Multiple Deprivation scorea 27.8 (8.2)
19.3 (7.4)
18.3 (7.6)
Real-terms change in local business rates revenues 2013–14 to 2018–19b
10.1% (5.2%)
12.7% (8.8%)
12.2% (8.5%)
Baseline funding as a % of core spending powerc
30.5% (7.1%)
25.3% (7.7%)
23.9% (5.9%)
a Higher score indicates more deprived. Mean across all councils is 21.8; range is from 5.0 to 42.0. b This is calculated as the percentage difference between each council’s 2018–19 local share of business rates revenues (adjusted as for the business rates retention scheme) and their business rates baseline for 2018–19. c Baseline funding is the term used to describe the assessment of how much business rates revenues councils need given their other revenues (such as grants and council tax). The baseline funding figures used here are those that apply under 50% retention to enable consistent comparisons between pilot and non-pilot councils. Notes: Figures for all non-share variables show the mean and, in brackets, the standard deviation. Source: Department for Communities and Local Government, ‘English indices of deprivation 2015’, 2015, https://www.gov.uk/government/statistics/english-indices-of-deprivation-2015; Office for National Statistics, ‘Population estimates April 2015 – local authority based by year of age’, 2016, https://www.nomisweb.co.uk/default.asp; Department for Communities and Local Government, ‘NNDR1 local authority data: 2017 to 2018’, 2017, https://www.gov.uk/government/statistical-data-sets/national-non-domestic-rates-local-authority-level-data.
The 2017–18 pilot areas have a higher level of deprivation than the rest of the country, which is unsurprising given that most of the 2017–18 pilot councils covered urban areas, which tend to be more deprived. 2018–19 pilot councils look more similar to the rest of the country, on average. However, councils in the new pilot areas include some of the most deprived areas (such as parts of inner London) and least deprived areas (such as Berkshire and Surrey) in England.
We also show that there is little variation between pilot and non-pilot areas in terms of cumulative real-terms growth in business rates revenues between 2013–14 and 2018–19. This is particularly interesting in light of discussions later in this report, since the amount of such growth is a key factor in determining the financial gain of taking part in a pilot.

© Institute for Fiscal Studies 9
From the final two rows of Table 1 it can be seen that those areas chosen to become pilots in April 2017 have been assessed to need a considerably larger amount of business rates revenues, measured as a proportion of their overall core spending power, relative to other areas. This reflects the fact that many of the initial pilot councils cover urban areas in the Midlands and North that have relatively low council tax bases. They can therefore raise less themselves via council tax and rely more on funding from the business rates retention scheme than other councils, on average.
10 © Institute for Fiscal Studies
3. What are the financial implications of the pilots?
Councils have been clear that a key motivation for taking part in the 100% retention pilot schemes has been the expectation of a financial gain. However, any financial gain accruing to pilot councils represents a ‘cost’ to central government (except to the extent that those gains are generated by increases in revenues resulting from the financial incentives provided by 100% retention). Whilst MHCLG has asserted that ‘the 100% rates retention pilots are cost-neutral at the point of delivery’,12 in this section we explain why pilot councils are set to gain from taking part in pilots and then estimate the aggregate ‘cost’ to central government that these gains represent.
Why are pilot areas gaining financially?
Under 100% retention, pilot areas that experience real-terms growth in their business rates revenues in 2018–19 will gain from being able to retain 100% rather than 50% of that growth.
In addition, pilot areas are likely to gain financially through a number of more subtle but possibly substantial channels. The most immediate of these arises almost mechanically from the way in which business rates retention has been set up. Councils have been able to retain up to 50% of any real-terms growth (and bear up to 50% of any real-terms declines) in business rates since the scheme was set up in 2013–14. The precise set-up of the 100% retention pilots means that pilot councils will instead benefit from 100% of the real-terms growth since 2013–14, not just 100% of the real-terms growth from when they become pilots. Since almost all pilot councils have seen real-terms growth in business rates revenues between 2013–14 and 2017–18, going from retaining (up to) 50% to retaining 100% of that growth represents a significant in funding for the pilot councils.
Furthermore, as discussed in the previous section, councils taking part in pilot schemes will not have to pay the levy on real-terms growth imposed on some councils under 50% retention. Finally, it is worth noting that pilot schemes have been set up under a ‘no detriment’ principle, guaranteeing that no council will lose out from being in a pilot relative to staying under the 50% BRRS.
How big are these gains?
In order to estimate the size of this increase in government funding to pilot councils, we use councils’ revenue forecasts for 2018–19 to model business rates retention both with and without the pilot schemes being in place.13 In doing so, we assume that the size of the
12 Ministry of Housing, Communities and Local Government, explanatory note on pilots, from ‘Supplementary
information for pilots: final local government finance settlement 2018 to 2019’, 2018, https://assets.publishing.service.gov.uk/government/uploads/system/uploads/attachment_data/file/679627/100__Pilots_-_Explanatory_Note.pdf.
13 Revenue forecasts from Ministry of Housing, Communities and Local Government, ‘National non-domestic rates collected by councils in England: forecast for 2018 to 2019’, 2018, https://www.gov.uk/government/statistics/national-non-domestic-rates-collected-by-councils-in-england-forecast-for-2018-to-2019. In order to estimate the increase in government funding to pilot councils that take
© Institute for Fiscal Studies 11
tax base is unaffected by the introduction of the pilots (in other words, that the total amount of business rates revenue raised in each area is the same under 50% and 100% retention). This seems a reasonable approximation in the short run, although the government hopes that 100% retention would lead to stronger revenue growth in the longer term as councils act on their stronger incentives.
What we find is that the pilot schemes could mean an increase in the funding of pilot areas of around £873 million in 2018–19. 14 This would correspond to an increase of around 3.6% in the core spending power of pilot councils in 2018–19.
Of this, London councils (including the Greater London Authority) could receive an extra £431 million and the Berkshire pool an extra £53 million (equivalent to increases of around 4.9% and 8.4% in core spending power, and £49 and £59 per person, respectively).15 Many of the metropolitan districts that were part of the original 2017–18 pilot scheme could also benefit substantially – for example, Birmingham is set to receive £24 million in extra funding in 2018–19 as a result of being a pilot area. However other councils, where business rates revenue growth has been less strong are set to gain less. We estimate that Liverpool, for instance, is set to gain £2.5 million (0.6% of core spending power, or £5 per person).
It is worth noting that, on average, councils have historically tended to be overly optimistic about their future business rates revenues. While the precise relationship between forecasts and outturns varies from year to year, on average between 2013–14 and 2016–17 forecasts have been 2.3% higher than outturns.16 Revising 2018–19 forecasts down by this percentage for all councils would reduce our estimate of the overall increase in central government funding of pilot areas to around £650 million, of which London councils could receive £311 million and the Berkshire pool £43 million.17 This would still represent an increase in core spending power of around 2.7% across all pilots.
What do the gains mean for the government and other councils?
Although the government has said that ‘these pilot[s] … have no impact on the funding available for other areas’,18 the extra retained business rates revenues is money that
part in the pilot scheme as part of a pool, we model the income those councils would be forecast to receive if pooled under 50% retention and compare this to the income they are forecast to receive as a pool in a 100% pilot. We do not make assumptions about how income is shared within these pilot councils’ pools, and thus the extra income received by such areas is shown both here and in the accompanying spreadsheet at the level of the relevant pool. For pilot councils not pooling under 100% retention, we model their income in both scenarios as an individual council.
14 To the extent that councils’ revenue forecasts are projecting an increase in the size of the business rates tax base in their areas as a result of being pilots, this figure will overstate the ‘cost’ to central government (but understate the gain to pilot areas).
15 Our estimates of the gains to each pilot council/pool are available in the sheet ‘Extra income’ in the spreadsheet available at www.ifs.org.uk/publications/12912.
16 Calculated by comparing NNDR3 figures with NNDR1 figures across all councils. 17 Our estimate of the gains to each pilot council/pool if revenue forecasts are 2.3% too high in each council are
available in the sheet ‘Extra income_forecastadj’ in the spreadsheet available at www.ifs.org.uk/publications/12912.
18 Ministry of Housing, Communities and Local Government, explanatory note on pilots, from ‘Supplementary information for pilots: final local government finance settlement 2018 to 2019’, 2018,

12 © Institute for Fiscal Studies
would have otherwise flowed into central government coffers and have been spent in other ways.19 In other words, there is an opportunity cost to the pilots. For instance, the revenues could have been used to reduce the overall budget deficit, fund tax cuts or increase central government spending instead. This includes central government grants to councils.
We cannot know for certain how these revenues would otherwise have been spent. The latter option, however, seems like a relevant policy counterfactual: what if rather than increasing the budgets for a subset of councils via the rates retention pilots, the government had used the same amount of money to increase grants to all councils? £873 million is equivalent to £15.80 per person, or 2% of councils’ core spending power across England as a whole (including both areas which in reality are and are not pilots).
This means that if the money being spent on business rates pilots had instead been used to increase grant-funding per person in all parts of England by the same cash amount, areas that are not pilots would have had £15.80 per person extra to spend (split between upper-tier and lower-tier councils in two-tier areas). Conversely, most – but not all – pilot areas would have had less to spend if the money had instead been used to increase grants in this way (as their gains from being 100% rates retention pilots are generally greater than £15.80 per person).20
We have also modelled a scenario in which £873 million was instead allocated across all councils in line with assessed spending needs using the most recent Relative Needs Formulae from 2013–14. This is how additional funding for adult social care has been allocated.21 In Figure 2, we show how much each upper-tier council area (or pilot pool) is forecast to gain or lose from the 100% pilot scheme, relative to what it would have received under such an increase in grant allocations.22
The graph shows that the majority of pilot areas gain more from piloting 100% retention than they would have gained from needs-based increases in their grant funding. For example, the Berkshire and London pool areas gain £46 and £31 per head respectively (equivalent to 6.5% and 3.1% respectively of their spending power). These figures are of course, lower than those mention earlier because Berkshire and London would have received £13 and £18 per head, respectively, if the extra funding had instead been allocated across all councils according to assessed spending need.
https://assets.publishing.service.gov.uk/government/uploads/system/uploads/attachment_data/file/679627/100__Pilots_-_Explanatory_Note.pdf.
19 Except to the extent that overall business rates growth is higher as a result of the pilots (e.g. if councils are anticipating stronger revenue growth as they respond to the incentives created by 100% retention).
20 Our estimates of the gain/loss to each council/pool relative to if the additional funding had been allocated via equal per-person increases in grants are available in the sheet ‘Gainslosses_population’ in the spreadsheet available at www.ifs.org.uk/publications/12912.
21 In particular, funding has been allocated according to the Adult Social Care Relative Needs Formula. 22 Thus, for areas not taking part in pilots, the graph shows, as a negative amount, the amount of extra funding
they would have received had the funding been allocated according to assessed spending needs. For pilot areas, the graph shows the extra funding they are forecast to receive as a result of the pilot minus what they would have received had the funding instead been allocated according to assessed spending need. Our estimates of the gain/loss to each council/pool are available in the sheet ‘Gainslosses_need’ in the spreadsheet available at www.ifs.org.uk/publications/12912.
© Institute for Fiscal Studies 13
On the other hand, there are some pilot areas that would have been better off if the extra funds had been allocated in this way and no pilot schemes had been run. These tend to be in metropolitan districts that became pilot areas in 2017–18 and that have high levels of needs and/or low growth in business rates revenues. This includes councils such as Dudley in the West Midlands pilot, Liverpool in the Merseyside pilot, and Oldham in the Greater Manchester pilot.
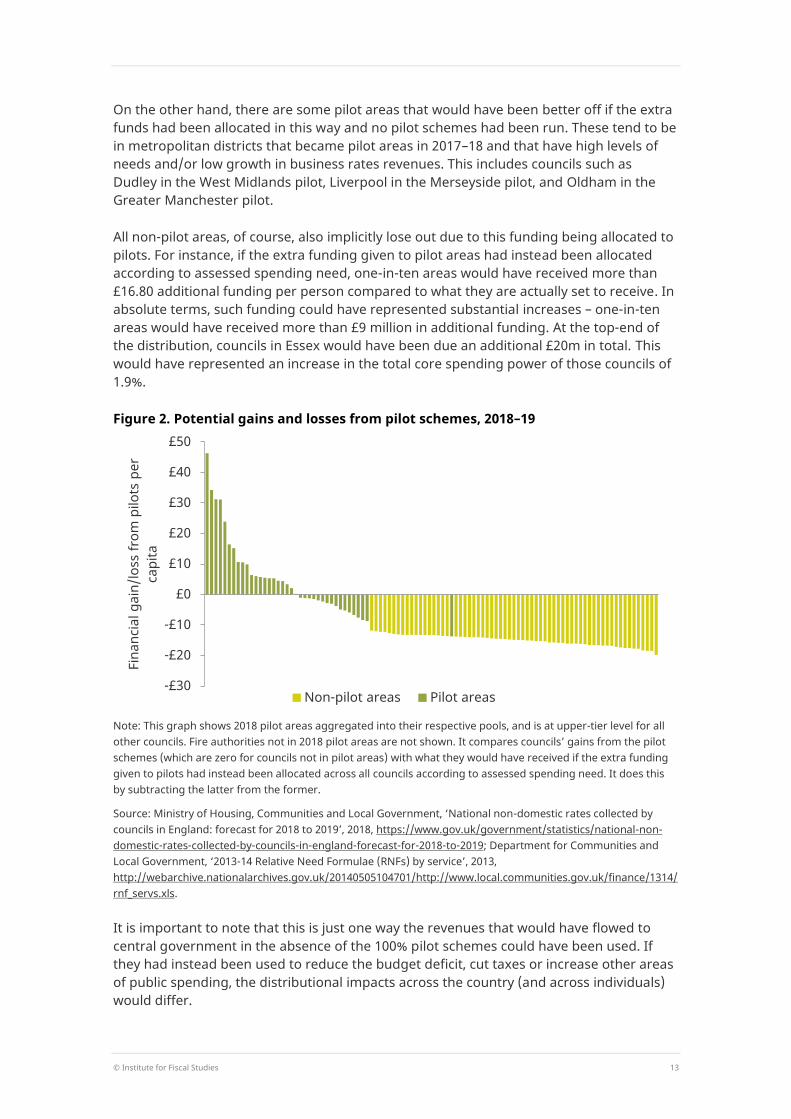
All non-pilot areas, of course, also implicitly lose out due to this funding being allocated to pilots. For instance, if the extra funding given to pilot areas had instead been allocated according to assessed spending need, one-in-ten areas would have received more than £16.80 additional funding per person compared to what they are actually set to receive. In absolute terms, such funding could have represented substantial increases – one-in-ten areas would have received more than £9 million in additional funding. At the top-end of the distribution, councils in Essex would have been due an additional £20m in total. This would have represented an increase in the total core spending power of those councils of 1.9%.
Figure 2. Potential gains and losses from pilot schemes, 2018–19
Note: This graph shows 2018 pilot areas aggregated into their respective pools, and is at upper-tier level for all other councils. Fire authorities not in 2018 pilot areas are not shown. It compares councils’ gains from the pilot schemes (which are zero for councils not in pilot areas) with what they would have received if the extra funding given to pilots had instead been allocated across all councils according to assessed spending need. It does this by subtracting the latter from the former.
Source: Ministry of Housing, Communities and Local Government, ‘National non-domestic rates collected by councils in England: forecast for 2018 to 2019’, 2018, https://www.gov.uk/government/statistics/national-non-domestic-rates-collected-by-councils-in-england-forecast-for-2018-to-2019; Department for Communities and Local Government, ‘2013-14 Relative Need Formulae (RNFs) by service’, 2013, http://webarchive.nationalarchives.gov.uk/20140505104701/http://www.local.communities.gov.uk/finance/1314/rnf_servs.xls. It is important to note that this is just one way the revenues that would have flowed to central government in the absence of the 100% pilot schemes could have been used. If they had instead been used to reduce the budget deficit, cut taxes or increase other areas of public spending, the distributional impacts across the country (and across individuals) would differ.
-£30
-£20
-£10
£0
£10
£20
£30
£40
£50
Fina
ncia
l gai
n/lo
ss fr
om p
ilots
per
ca
pita
Non-pilot areas Pilot areas
14 © Institute for Fiscal Studies
4. What can be learnt from the pilots? Given the financial cost of the pilots, what does the government hope to learn from them? The stated goal of the initial round of pilots, commencing in April 2017, was to
help to develop the mechanisms that will be needed to manage risk and reward under 100% rates retention and … help authorities to build financial capacity to reform core services and invest in long term economic growth from 2017.23
The stated goal of the second wave of pilots, commencing in April 2018, is to
test more technical aspects of the 100% business rates retention system, such as tier-splits.… allow authorities to make coherent strategic decisions about the wider area and to jointly manage risk and reward ... [and] ... test authorities’ administration (e.g. how they tackle avoidance), technical planning for implementation, and look at system maintenance.24
But do the pilots actually allow a rigorous evaluation of these issues?
The pilot areas may not be representative
One issue is that the 2018–19 pilots were chosen by MHCLG from those areas that voluntarily applied to become pilots. And the 2017–18 pilots were chosen directly by MHCLG. As a result, pilot areas may not be representative of all councils. They may differ in terms of their behaviour, and as we saw in Section 2, their characteristics differ from non-pilot areas (for instance, perhaps surprisingly, their business rates revenues have grown somewhat less on average since 2013–14 than revenues in non-pilot areas).
Effects of pilots may differ from effects of longer-term policies
There are other reasons for thinking the scope for learning from the pilots may be limited.
The first is that the pilots are only only guaranteed to run until the end of 2018–19. There is an inherent limitation to how much one can learn in a year or two, given that the impact of 100% rates retention on funding levels and risk would tend to grow over time. A mechanism able to cope for a couple of years may not be suitable in the longer term.
Related to this, councils may respond differently to the short-term incentive and additional funding provided by a pilot from how they would respond under a longer-term 100% (or indeed 75%) BRRS. For instance, their behaviour in relation to the promotion of revenue and economic growth may be different. With the greater incentive only guaranteed for a
23 Paragraph 1.281 of HM Treasury, Budget 2016, available at https://www.gov.uk/government/topical-
events/budget-2016. 24 Paragraphs 1.7–1.9 of Department for Communities and Local Government, ‘Invitation to local authorities in
England to pilot 100% business rates retention in 2018/19 and to pioneer new pooling and tier-split models’, 2017, available at https://www.gov.uk/government/publications/100-business-rates-retention-pilots-2018-to-2019-prospectus.
© Institute for Fiscal Studies 15
year, they may make less effort to boost revenues or growth; or they may prioritise ‘quick wins’ rather than longer-term but larger pay-offs.
One ‘quick win’ in terms of revenue would be for smaller properties that have been empty long-term to remain empty rather than be occupied by a small business which could claim small business rates relief. If action to boost the economy and promote new property development takes time to bear fruit, the short-term incentive from a pilot could therefore encourage councils to try to discourage reoccupation of empty small properties instead.25
Councils’ use of the extra funding we estimated in the previous section may also differ from their use of funding provided by a longer-term 100% BRRS. Councils may be more likely to use the extra funding for one-off expenses or investments rather than for ongoing expenditures, even if the latter were more beneficial (e.g. in terms of boosting growth or supporting service delivery). Or they could channel the extra funding into their reserves. That is because ongoing expenditures could have to be cut back again after 2018–19 if the pilots were not renewed.
Other features of pilots limit opportunities for learning big lessons
Second, the design of the pilots mean they are not conducive to learning about risk and reward:
The ‘no detriment’ guarantee prevents pilot councils from having lower funding than if they remained in the national 50% BRRS. Such a policy seems unlikely to apply under a nationwide system of 100% (or 75%) retention.
There is no variation among pilots in features of the system most closely linked to risk and reward. These include: the ‘safety-net’ threshold below which funding is prevented from falling; the absence of any levy on the revenue growth of areas with large business rates tax bases; and the treatment of revenue losses due to appeals by ratepayers.
One area where there is significant variation is in tier-splits between upper-tier counties and lower-tier districts in pilot areas with two-tier local government (see Section 2). However, even here, more could probably be learnt about the effects of different tier-splits on the risk and reward for counties through statistical analysis of simulated revenue projections instead. Such analysis using historical revenue data can be found in Amin-Smith et al. (2018),26 and we hope to do further analysis using simulated revenue projections. MHCLG is also undertaking similar work.
But is there a strategic benefit from the pilots?
The major benefit of the pilots, at least from the government’s perspective, may be more strategic. First, the pilots allow it to maintain momentum behind its local government
25 This issue was discussed in K. Muldoon-Smith and P. Greenhalgh, ‘Surveying business rate decentralisation’,
RICS Property Journal, March 2016, 20–21. 26 N. Amin-Smith, D. Phillips and P. Simpson, Spending Needs, Tax Revenue Capacity and the Business Rates
Retention Scheme, IFS Report R141, 2018, available at https://www.ifs.org.uk/publications/10542.
16 © Institute for Fiscal Studies
finance reforms following the June 2017 election: legislation to take forward previous plans for a national roll-out of 100% rates retention was not resurrected following the government’s loss of its majority. A progressive expansion of voluntary pilots could eventually allow the government to deliver a national 100% BRRS without primary legislation.
Second, the fact that councils have to bid for pilot status, and there is ‘excess demand’ for this status, means the government could argue it has vetted successful groups of councils’ plans and is more confident that the money will be well spent.
Third, the voluntary nature of pilots and excess demand from councils to be a pilot could give the government greater leverage over councils. In particular, in order to maximise their chances of securing pilot status, prospective pilot groups may propose changes to the BRRS that the government itself wants but which could be more controversial if imposed centrally. This includes changes in the tier-splits between counties and districts, and the greater pooling of funds between councils.
The benefit of the pilots may therefore be less about lessons for technical policy design than about the government’s broader desire to continue progressing with local government finance reform that last summer seemed to be on the verge of stalling.
© Institute for Fiscal Studies 17
5. Summing up This briefing note has looked at the 100% business rates retention pilots being rolled out across parts of England.
Our analysis has shown that around 53% of the population of England will live in areas piloting 100% retention in 2018–19. These areas will generate around 63% of all the business rates collected by councils. However, pilot councils are a diverse group, including a broad mix of Labour and Conservative councils, both urban and more rural councils, and more and less deprived councils.
The pilot schemes are also diverse. In the pilots in areas of England with two-tier local government, the formal allocation of real-terms changes in rates revenues to the upper-tier county council varies from 20% in Suffolk to 70% in Surrey. Overall though, compared with the current 50% retention scheme, county councils are generally allocated a higher share – something which recent research suggests is likely to have benefits.27 Schemes also differ with respect to the scale and use of pooled funds. In some cases, most of the estimated gain from being a pilot area is being pooled and allocated jointly by councils according to agreed priorities; in other cases, it is mostly flowing to individual councils for them to decide what to do with it.
We have found that the pilots are likely costing central government somewhere in the order of £870 million in 2018–19 – equivalent to 2% of all councils’ core spending power. This is money that would otherwise have flowed in to central government coffers and could have been spent some other way. If the money being spent on pilots were instead allocated according to councils’ assessed spending needs (measured by the official Relative Needs Formulae), councils in some non-pilot areas would have nearly £20 per person more to spend in 2018–19 than they do under current plans.
It is unclear how much can actually be learnt from the pilots. With pilots only guaranteed until the end of 2018–19, councils’ responses – both to the stronger financial incentive for growth provided by 100% retention and in their use of the financial dividend from taking part – may differ significantly from how they would respond to a longer-term scheme. Furthermore, the ‘no detriment’ clause means pilot councils cannot be worse off than under the 50% scheme, so we cannot learn how they would respond to the greater risk that could ultimately result from a 100% scheme.
Of course, there may be other benefits of the pilots, at least from the government’s perspective. First, the pilots may help to maintain momentum behind the government’s local government finance reforms following the setback of the June 2017 election. Second, pilot councils have had to bid for their status, setting out how they would use additional revenues to boost growth and support service delivery. The government could argue this means it can be more confident that the money will be well spent – important given the tight fiscal context. However, such arguments may be cold comfort for those councils not taking part in pilots who would have welcomed the millions in extra funding that could have come their way if what is being spent on the pilots was instead used to boost grants to all councils.
27 N. Amin-Smith, D. Phillips and P. Simpson, Spending Needs, Tax Revenue Capacity and the Business Rates
Retention Scheme, IFS Report R141, 2018, available at https://www.ifs.org.uk/publications/10542.


![[A PILOTS PERSPECTIVE OF THE 1989 PILOTS DISPUTE ]apaterson/aviation/1989_pilot_dispute.pdf · flight.org Alex Paterson | . [A PILOTS PERSPECTIVE OF THE 1989 PILOTS DISPUTE ] ALEX](https://static.fdocuments.net/doc/165x107/5ad4c90f7f8b9aff228c436f/a-pilots-perspective-of-the-1989-pilots-dispute-apatersonaviation1989pilotdisputepdfflightorg.jpg)