1.0 TOXIC AIR POLLUTANTS - CPCB ENVIS| Control of...
41
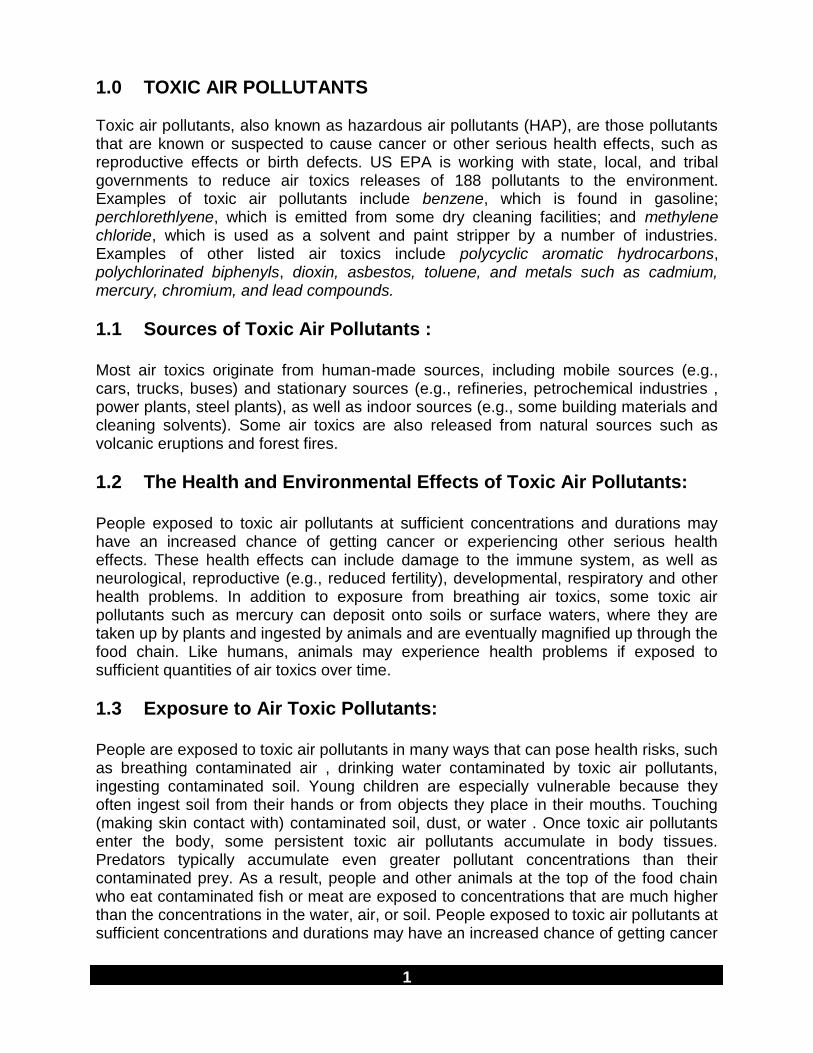
1 1.0 TOXIC AIR POLLUTANTS Toxic air pollutants, also known as hazardous air pollutants (HAP), are those pollutants that are known or suspected to cause cancer or other serious health effects, such as reproductive effects or birth defects. US EPA is working with state, local, and tribal governments to reduce air toxics releases of 188 pollutants to the environment. Examples of toxic air pollutants include benzene, which is found in gasoline; perchlorethlyene, which is emitted from some dry cleaning facilities; and methylene chloride, which is used as a solvent and paint stripper by a number of industries. Examples of other listed air toxics include polycyclic aromatic hydrocarbons, polychlorinated biphenyls, dioxin, asbestos, toluene, and metals such as cadmium, mercury, chromium, and lead compounds. 1.1 Sources of Toxic Air Pollutants : Most air toxics originate from human-made sources, including mobile sources (e.g., cars, trucks, buses) and stationary sources (e.g., refineries, petrochemical industries , power plants, steel plants), as well as indoor sources (e.g., some building materials and cleaning solvents). Some air toxics are also released from natural sources such as volcanic eruptions and forest fires. 1.2 The Health and Environmental Effects of Toxic Air Pollutants: People exposed to toxic air pollutants at sufficient concentrations and durations may have an increased chance of getting cancer or experiencing other serious health effects. These health effects can include damage to the immune system, as well as neurological, reproductive (e.g., reduced fertility), developmental, respiratory and other health problems. In addition to exposure from breathing air toxics, some toxic air pollutants such as mercury can deposit onto soils or surface waters, where they are taken up by plants and ingested by animals and are eventually magnified up through the food chain. Like humans, animals may experience health problems if exposed to sufficient quantities of air toxics over time. 1.3 Exposure to Air Toxic Pollutants: People are exposed to toxic air pollutants in many ways that can pose health risks, such as breathing contaminated air , drinking water contaminated by toxic air pollutants, ingesting contaminated soil. Young children are especially vulnerable because they often ingest soil from their hands or from objects they place in their mouths. Touching (making skin contact with) contaminated soil, dust, or water . Once toxic air pollutants enter the body, some persistent toxic air pollutants accumulate in body tissues. Predators typically accumulate even greater pollutant concentrations than their contaminated prey. As a result, people and other animals at the top of the food chain who eat contaminated fish or meat are exposed to concentrations that are much higher than the concentrations in the water, air, or soil. People exposed to toxic air pollutants at sufficient concentrations and durations may have an increased chance of getting cancer
Transcript of 1.0 TOXIC AIR POLLUTANTS - CPCB ENVIS| Control of...
1
1.0 TOXIC AIR POLLUTANTS
Toxic air pollutants, also known as hazardous air pollutants (HAP), are those pollutants that are known or suspected to cause cancer or other serious health effects, such as reproductive effects or birth defects. US EPA is working with state, local, and tribal governments to reduce air toxics releases of 188 pollutants to the environment. Examples of toxic air pollutants include benzene, which is found in gasoline; perchlorethlyene, which is emitted from some dry cleaning facilities; and methylene chloride, which is used as a solvent and paint stripper by a number of industries. Examples of other listed air toxics include polycyclic aromatic hydrocarbons, polychlorinated biphenyls, dioxin, asbestos, toluene, and metals such as cadmium, mercury, chromium, and lead compounds.
1.1 Sources of Toxic Air Pollutants : Most air toxics originate from human-made sources, including mobile sources (e.g., cars, trucks, buses) and stationary sources (e.g., refineries, petrochemical industries , power plants, steel plants), as well as indoor sources (e.g., some building materials and cleaning solvents). Some air toxics are also released from natural sources such as volcanic eruptions and forest fires.
1.2 The Health and Environmental Effects of Toxic Air Pollutants: People exposed to toxic air pollutants at sufficient concentrations and durations may have an increased chance of getting cancer or experiencing other serious health effects. These health effects can include damage to the immune system, as well as neurological, reproductive (e.g., reduced fertility), developmental, respiratory and other health problems. In addition to exposure from breathing air toxics, some toxic air pollutants such as mercury can deposit onto soils or surface waters, where they are taken up by plants and ingested by animals and are eventually magnified up through the food chain. Like humans, animals may experience health problems if exposed to sufficient quantities of air toxics over time.
1.3 Exposure to Air Toxic Pollutants: People are exposed to toxic air pollutants in many ways that can pose health risks, such as breathing contaminated air , drinking water contaminated by toxic air pollutants, ingesting contaminated soil. Young children are especially vulnerable because they often ingest soil from their hands or from objects they place in their mouths. Touching (making skin contact with) contaminated soil, dust, or water . Once toxic air pollutants enter the body, some persistent toxic air pollutants accumulate in body tissues. Predators typically accumulate even greater pollutant concentrations than their contaminated prey. As a result, people and other animals at the top of the food chain who eat contaminated fish or meat are exposed to concentrations that are much higher than the concentrations in the water, air, or soil. People exposed to toxic air pollutants at sufficient concentrations and durations may have an increased chance of getting cancer
2
or experiencing other serious health effects. These health effects can include damage to the immune system, as well as neurological, reproductive (e.g., reduced fertility), developmental, respiratory and other health problems.
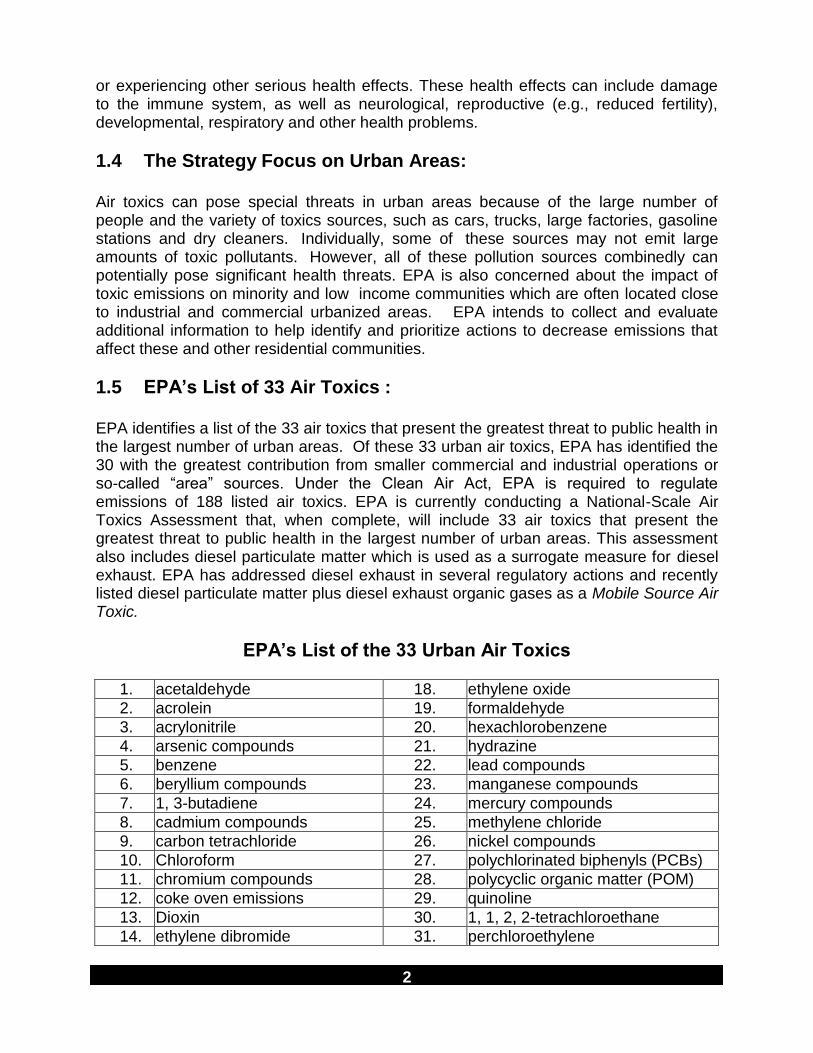
1.4 The Strategy Focus on Urban Areas: Air toxics can pose special threats in urban areas because of the large number of people and the variety of toxics sources, such as cars, trucks, large factories, gasoline stations and dry cleaners. Individually, some of these sources may not emit large amounts of toxic pollutants. However, all of these pollution sources combinedly can potentially pose significant health threats. EPA is also concerned about the impact of toxic emissions on minority and low income communities which are often located close to industrial and commercial urbanized areas. EPA intends to collect and evaluate additional information to help identify and prioritize actions to decrease emissions that affect these and other residential communities.
1.5 EPA’s List of 33 Air Toxics : EPA identifies a list of the 33 air toxics that present the greatest threat to public health in the largest number of urban areas. Of these 33 urban air toxics, EPA has identified the 30 with the greatest contribution from smaller commercial and industrial operations or so-called “area” sources. Under the Clean Air Act, EPA is required to regulate emissions of 188 listed air toxics. EPA is currently conducting a National-Scale Air Toxics Assessment that, when complete, will include 33 air toxics that present the greatest threat to public health in the largest number of urban areas. This assessment also includes diesel particulate matter which is used as a surrogate measure for diesel exhaust. EPA has addressed diesel exhaust in several regulatory actions and recently listed diesel particulate matter plus diesel exhaust organic gases as a Mobile Source Air Toxic.
EPA’s List of the 33 Urban Air Toxics
1. acetaldehyde 18. ethylene oxide
2. acrolein 19. formaldehyde
3. acrylonitrile 20. hexachlorobenzene
4. arsenic compounds 21. hydrazine
5. benzene 22. lead compounds
6. beryllium compounds 23. manganese compounds
7. 1, 3-butadiene 24. mercury compounds
8. cadmium compounds 25. methylene chloride
9. carbon tetrachloride 26. nickel compounds
10. Chloroform 27. polychlorinated biphenyls (PCBs)
11. chromium compounds 28. polycyclic organic matter (POM)
12. coke oven emissions 29. quinoline
13. Dioxin 30. 1, 1, 2, 2-tetrachloroethane
14. ethylene dibromide 31. perchloroethylene
3
15. propylene dichloride 32. trichloroethylene
16. 1, 3-dichloropropene 33. vinyl chloride
17. ethylene dichloride --
1.6 EPA’s List of Seven Specific Air Toxics : The seven pollutants [alkylated lead compounds, polycyclic organic matter (POM) , hexachlorobenzene, mercury, polychlorinated biphenyls, 2,3,7,8-tetrachlorodibenzofurans (TCDF) and 2,3,7,8-tetrachlorodibenzo-p-dioxin (TCDD)] were among the pollutants of concern identified by the International Joint Commission of the United States and Canada, and the Great Lakes Commission, as well as EPA's Great Waters Program because of their persistence and tendency to bioaccumulate in the environment. These pollutants are also associated with adverse health effects such as nervous system damage and reproductive effects.
2.0 POLYCYCLIC AROMATIC HYDROCARBONS (PAHS): The major PAH compounds as given in the Table : 1 are present in the most of pollution sources : area , point & mobile sources .
Table : 1 List of Priority PAHs
Molecular Formula
Molecular Weight
Naphthalene C10H8 128
Phenanthrene C14H10 178
Anthracene C14H10 178
Fluoranthene C16H10 202
Pyrene C16H10 202
Chrysene C18H12 228
Benzo(a) anthracene C18H12 228
Benzo(b) f luoranthene C20H12 252
Benzo(k) f luoranthene C20H12 252
Benzo(e) pyrene C20H12 252
Benzo(a) pyrene C20H12 252
Perylene C20H12 252
Benzo(ghi) perylene C22H12 276
Dibenzo(ah) anthracenes C22H14 278
Indeno(cd) pyrene C22H12 276
Coronene C24H12 300
4
2.1 Sources of Polycyclic Aromatic Hydrocarbons (PAHs) : The sources of atmospheric PAHs are both natural and anthropogenic. The natural sources are forest fire, volcanic activities and bacterial decay of organic materials. The anthropogenic sources may be divided into the following four categories.
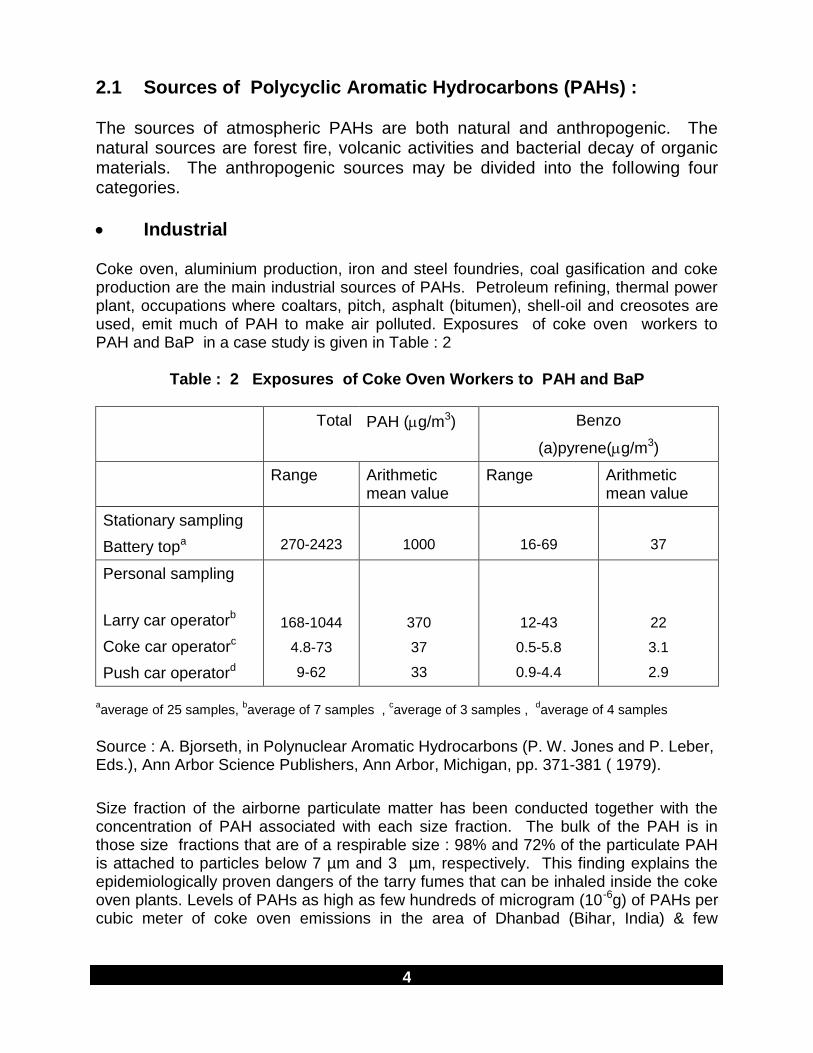
Industrial Coke oven, aluminium production, iron and steel foundries, coal gasification and coke production are the main industrial sources of PAHs. Petroleum refining, thermal power plant, occupations where coaltars, pitch, asphalt (bitumen), shell-oil and creosotes are used, emit much of PAH to make air polluted. Exposures of coke oven workers to PAH and BaP in a case study is given in Table : 2
Table : 2 Exposures of Coke Oven Workers to PAH and BaP
Total PAH (g/m3) Benzo
(a)pyrene(g/m3)
Range Arithmetic mean value
Range Arithmetic mean value
Stationary sampling
Battery topa
270-2423
1000
16-69
37
Personal sampling
Larry car operatorb
Coke car operatorc
Push car operatord
168-1044
4.8-73
9-62
370
37
33
12-43
0.5-5.8
0.9-4.4
22
3.1
2.9
aaverage of 25 samples,
baverage of 7 samples ,
caverage of 3 samples ,
daverage of 4 samples
Source : A. Bjorseth, in Polynuclear Aromatic Hydrocarbons (P. W. Jones and P. Leber, Eds.), Ann Arbor Science Publishers, Ann Arbor, Michigan, pp. 371-381 ( 1979).
Size fraction of the airborne particulate matter has been conducted together with the concentration of PAH associated with each size fraction. The bulk of the PAH is in those size fractions that are of a respirable size : 98% and 72% of the particulate PAH is attached to particles below 7 µm and 3 µm, respectively. This finding explains the epidemiologically proven dangers of the tarry fumes that can be inhaled inside the coke oven plants. Levels of PAHs as high as few hundreds of microgram (10-6g) of PAHs per cubic meter of coke oven emissions in the area of Dhanbad (Bihar, India) & few
5
hundred nanogram (10-9g) of PAH per cubic meter.in ambient air in their vicinity have been measured by Central Pollution Control Board .
Industrial Air Pollution (An Iron & Steel Plant)
Automobile
Motor vehicle emissions (especially diesel vehicles) make a considerable contribution to PAH concentration in air due to burning and incomplete combustion of diesel or gasoline. Air craft engine as a source of PAH in the atmosphere has also been identified.
Vehicular Pollution (ITO, Delhi)
6
Diesel Exhaust Particles and Their Health Effects
The popularity of the diesel engine in heavy duty applications in trucking, rail road, marine transport, DG sets and construction industry is due to both its fuel efficiency and long service life relative to the gasoline engine. Compared with gasoline engine, diesel emissions are lower in carbon monoxide (CO), hydrocarbon (HC) and carbon dioxide (CO2), but higher in oxides of nitrogen (NOx) and particulate matter (PM). Diesel exhaust is a complex mixture of both particulate and gaseous phase.
Diesel exhaust has particulate with mass median diameter of 0.05 to 1.00 micrometer, a size rendering them easily respirable and capable of depositing in the airways and alveoli. The particles consist of a carbonaceous core with a large surface area to which various hydrocarbons are absorbed, including carcinogenic polycyclic aromatic hydrocarbons (PAHs) and Nitro-PAHs that have elicited the most concern with respect to human health. The gaseous phase contains various products of combustion and hydrocarbons including some of the PAHs present in the particle phase. Once emitted, components of diesel exhaust undergo atmospheric transformation in ways that may be relevant to human health. For example, nitro-PAHs, created by the reaction of directly emitted PAHs with hydroxyl radicals in the atmosphere can be more potent mutagens and carcinogens and more bio available than their precursors. A study undertaken by a Swedish Consultancy, Ecotraffic (Peter Ahlvik and Ake Branberg,1999) shows that the cancer potency of diesel vehicles is more than two times than that of petrol vehicles in India. If only the most harmful of the exhaust emissions, that is particulate emission is considered, the carcinogenic effect of one new diesel car is equivalent to 24 petrol cars and 84 new CNG cars on the road. The Honourable Supreme Court of India has restricted the use of commercial diesel driven vehicles in Delhi due to its harmful effects.
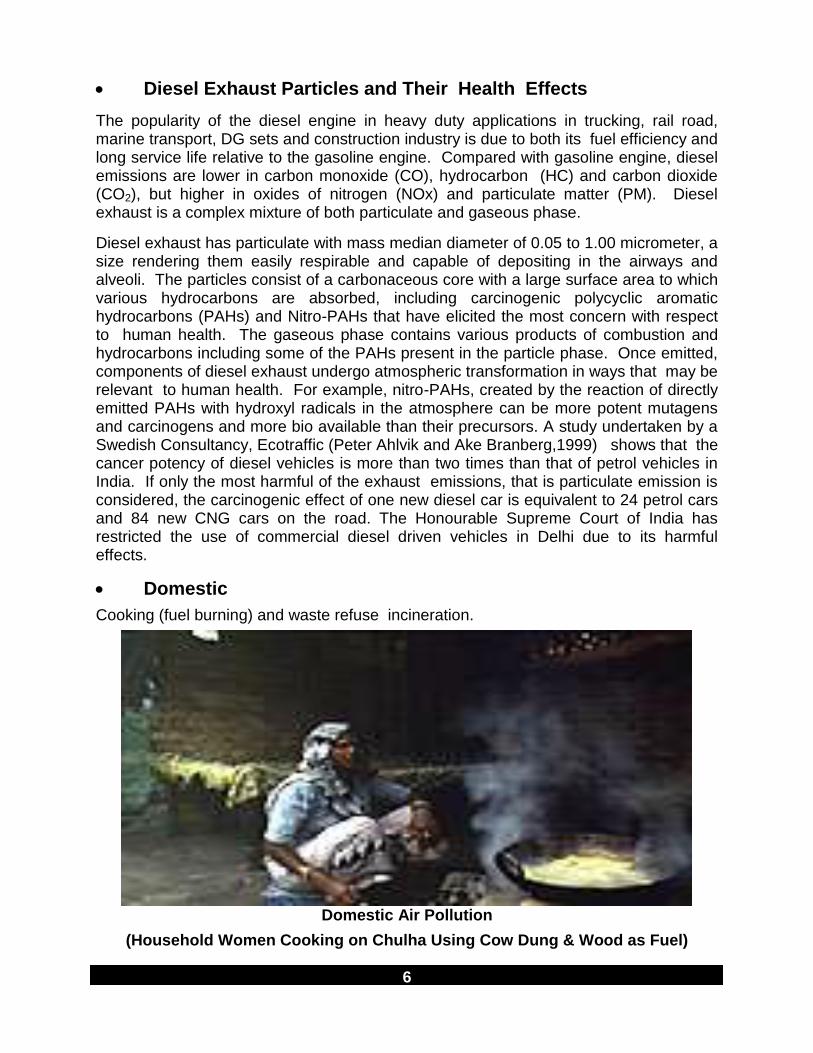
Domestic
Cooking (fuel burning) and waste refuse incineration.
Domestic Air Pollution
(Household Women Cooking on Chulha Using Cow Dung & Wood as Fuel)
7
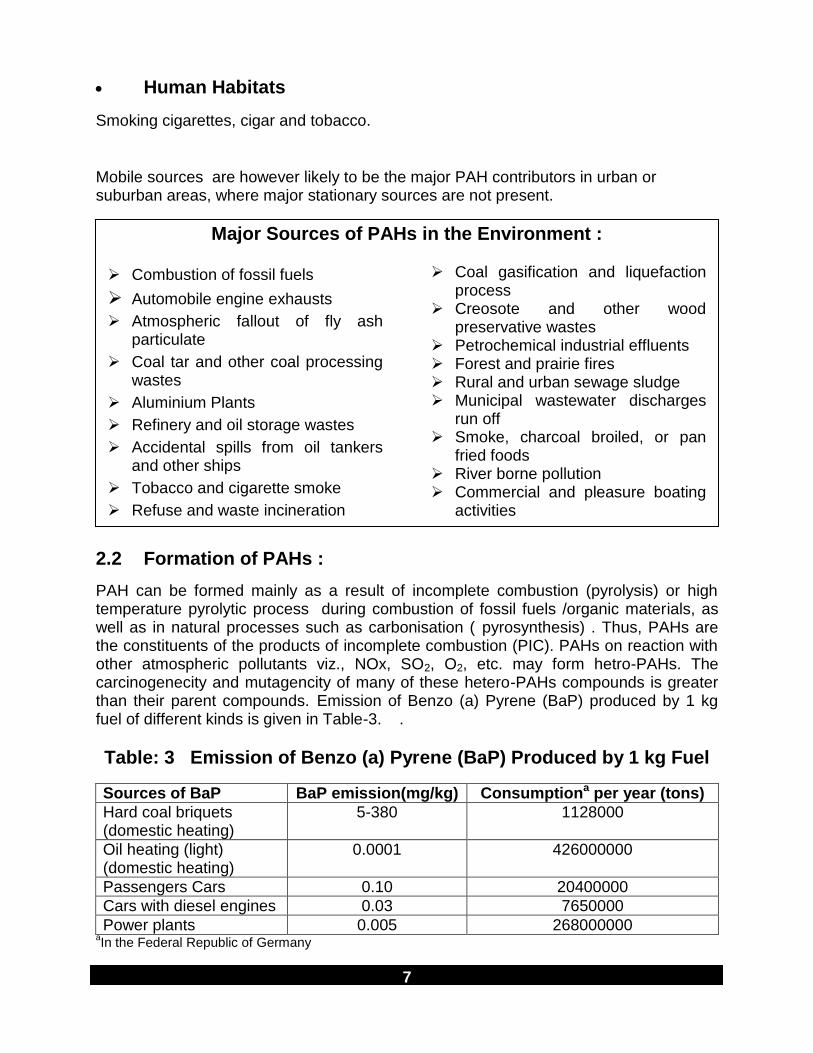
Human Habitats
Smoking cigarettes, cigar and tobacco.
Mobile sources are however likely to be the major PAH contributors in urban or suburban areas, where major stationary sources are not present.
Major Sources of PAHs in the Environment :
Combustion of fossil fuels
Automobile engine exhausts
Atmospheric fallout of fly ash particulate
Coal tar and other coal processing wastes
Aluminium Plants
Refinery and oil storage wastes
Accidental spills from oil tankers and other ships
Tobacco and cigarette smoke
Refuse and waste incineration
Coal gasification and liquefaction process
Creosote and other wood preservative wastes
Petrochemical industrial effluents Forest and prairie fires Rural and urban sewage sludge Municipal wastewater discharges
run off Smoke, charcoal broiled, or pan
fried foods River borne pollution Commercial and pleasure boating
activities
2.2 Formation of PAHs :
PAH can be formed mainly as a result of incomplete combustion (pyrolysis) or high temperature pyrolytic process during combustion of fossil fuels /organic materials, as well as in natural processes such as carbonisation ( pyrosynthesis) . Thus, PAHs are the constituents of the products of incomplete combustion (PIC). PAHs on reaction with other atmospheric pollutants viz., NOx, SO2, O2, etc. may form hetro-PAHs. The carcinogenecity and mutagencity of many of these hetero-PAHs compounds is greater than their parent compounds. Emission of Benzo (a) Pyrene (BaP) produced by 1 kg fuel of different kinds is given in Table-3. .
Table: 3 Emission of Benzo (a) Pyrene (BaP) Produced by 1 kg Fuel
Sources of BaP BaP emission(mg/kg) Consumptiona per year (tons)
Hard coal briquets (domestic heating)
5-380 1128000
Oil heating (light) (domestic heating)
0.0001 426000000
Passengers Cars 0.10 20400000
Cars with diesel engines 0.03 7650000
Power plants 0.005 268000000 aIn the Federal Republic of Germany
8
Source : A. Bjorseth, in Polynuclear Aromatic Hydrocarbons (P. W. Jones and P. Leber, Eds.), Ann Arbor Science Publishers, Ann Arbor, Michigan, pp. 371-381 ( 1979).
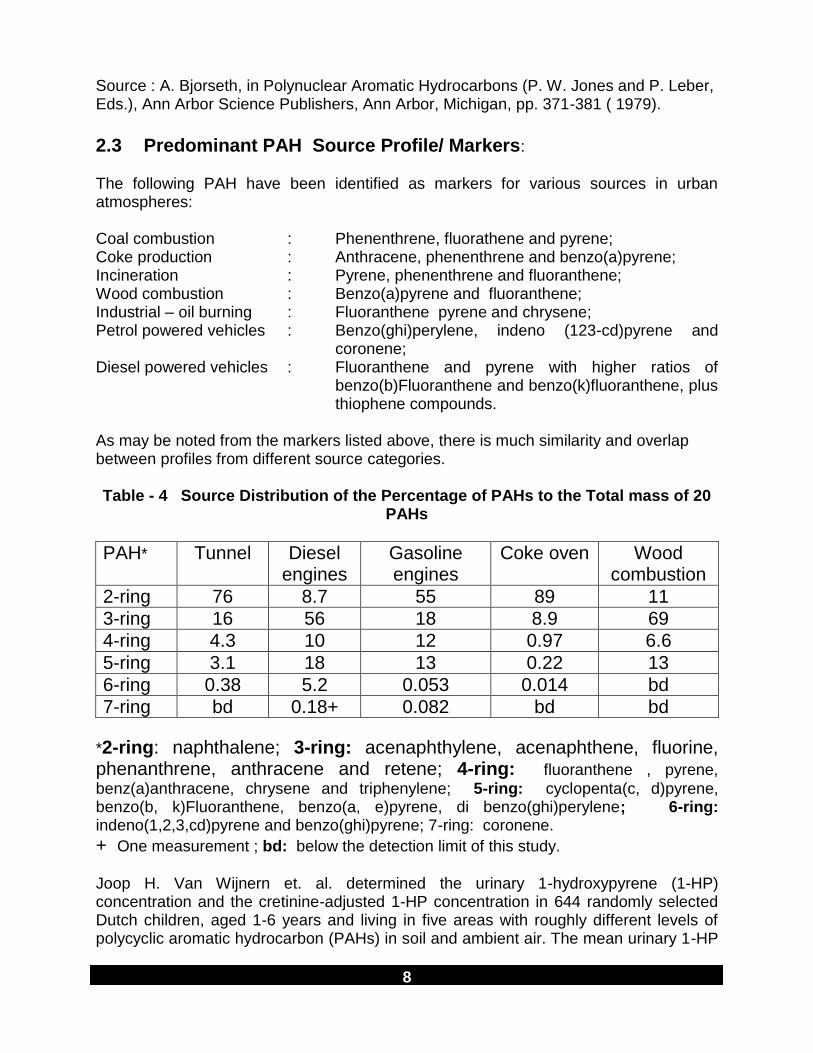
2.3 Predominant PAH Source Profile/ Markers:
The following PAH have been identified as markers for various sources in urban atmospheres: Coal combustion : Phenenthrene, fluorathene and pyrene; Coke production : Anthracene, phenenthrene and benzo(a)pyrene; Incineration : Pyrene, phenenthrene and fluoranthene; Wood combustion : Benzo(a)pyrene and fluoranthene; Industrial – oil burning : Fluoranthene pyrene and chrysene; Petrol powered vehicles : Benzo(ghi)perylene, indeno (123-cd)pyrene and
coronene; Diesel powered vehicles : Fluoranthene and pyrene with higher ratios of
benzo(b)Fluoranthene and benzo(k)fluoranthene, plus thiophene compounds.
As may be noted from the markers listed above, there is much similarity and overlap between profiles from different source categories. Table - 4 Source Distribution of the Percentage of PAHs to the Total mass of 20
PAHs
PAH* Tunnel Diesel engines
Gasoline engines
Coke oven Wood combustion
2-ring 76 8.7 55 89 11
3-ring 16 56 18 8.9 69
4-ring 4.3 10 12 0.97 6.6
5-ring 3.1 18 13 0.22 13
6-ring 0.38 5.2 0.053 0.014 bd
7-ring bd 0.18+ 0.082 bd bd
*2-ring: naphthalene; 3-ring: acenaphthylene, acenaphthene, fluorine, phenanthrene, anthracene and retene; 4-ring: fluoranthene , pyrene,
benz(a)anthracene, chrysene and triphenylene; 5-ring: cyclopenta(c, d)pyrene, benzo(b, k)Fluoranthene, benzo(a, e)pyrene, di benzo(ghi)perylene; 6-ring: indeno(1,2,3,cd)pyrene and benzo(ghi)pyrene; 7-ring: coronene.
+ One measurement ; bd: below the detection limit of this study.
Joop H. Van Wijnern et. al. determined the urinary 1-hydroxypyrene (1-HP) concentration and the cretinine-adjusted 1-HP concentration in 644 randomly selected Dutch children, aged 1-6 years and living in five areas with roughly different levels of polycyclic aromatic hydrocarbon (PAHs) in soil and ambient air. The mean urinary 1-HP
9
content of the total study population was 2.06 nmol/l. This varied from 1.58 nmol/l in the reference area (Flevoland) to 2.71 nmol/l in the valley of the Geul. Only indoor sources of PAHs showed a small , positive association with urinary 1-HP. In one neighbourhood built on coal –mine tailings, the urinary 1-HP content in children was weakly but positively associated with the PAH content in the upper soil layer of the garden of their homes.
2.4 Nitro PAHs : Both petrol and diesel fueled vehicles produce PAHs and nitro - PAHs. Diesel exhaust tend to contain higher concentration of carcinogenic nitro-PAHs and low toxicity 2, 3 and 4 ring PAHs. Petrol engine exhaust gases tend to produce higher concentrations of the 5 and 6 rings PAHs (Benzo(a)pyrene, Benzo (g, h, I) perylene, Indeno (1,2,3-cd) pyrene coronene and Anthanthrene) which are more carcinogenic than the 2 and 3 ring PAHs . Nitro-PAHs is either formed from combustion process or via nitro substituion of the parent PAH. In later case these are initiated by chemical reactions in the atmosphere with OH radicals in the presence of NOx and N2O5 and sunlight. Although the total concentration of nitro-PAHs emitted from diesel exhaust is lower than the total concentration of PAHs, their toxicity is much greater. Non-toxic primary PAHs such as naphthalene can undergo photochemical reactions to form highly toxic nitro-PAHs such 1-nitronaphthalene.
2.5 Vapour / Particle Phase Distribution of PAHs : PAHs and nitro - PAHs may exist in vapour or particle phase. The lower molecular weight PAHs and nitro-PAHs with a ring number of 2 and 3 tend to be associated with the vapour phase. The larger molecular weight PAHs tend to be associated with particulate in the atmosphere. PAH species with a molecular weight below that of below pyrene exist to a large extent in the gas phase. On an average 47% of the total PAH were reported in gas phase. Three ring PAH are predominantly gaseous, five ring PAH mixture of both phases and five six ring PAH primarily particulate. Pierce and Katz also studied size distribution of PAH containing particulates, which showed approximately a log-normal relationship for suburban and rural sampling sites with majority of PAH content (50-78%) associated with particles below 3.0 um diameter. Total PAHs were higher for winter period by a factor of 65-75% and concentration range
vary between lowest 2 ug/g particulate (anthracene) to 20 g/g particulate (BghiP). For all the sites, approximately 85-90% of the PAH content with respect to volume of air sampled was associated with particles less than 5.0 um diameter for the winter sampling period, while 70-85% was associated with the same size fraction for the summer sampling period (1972-1973) in Toronto, Canada. PAH species with a molecular weight below that of below pyrene exist to a large extent in the gas phase (R.M. Hoff et.al., 1987, M.L. Lee et.al., 1976). According snook et al., 1976, on average 47% of the total PAH were reported in gas phase. Three ring PAH are predominantly gaseous, five ring PAH mixture of both phases and five, six ring PAH primarily particulate.
10
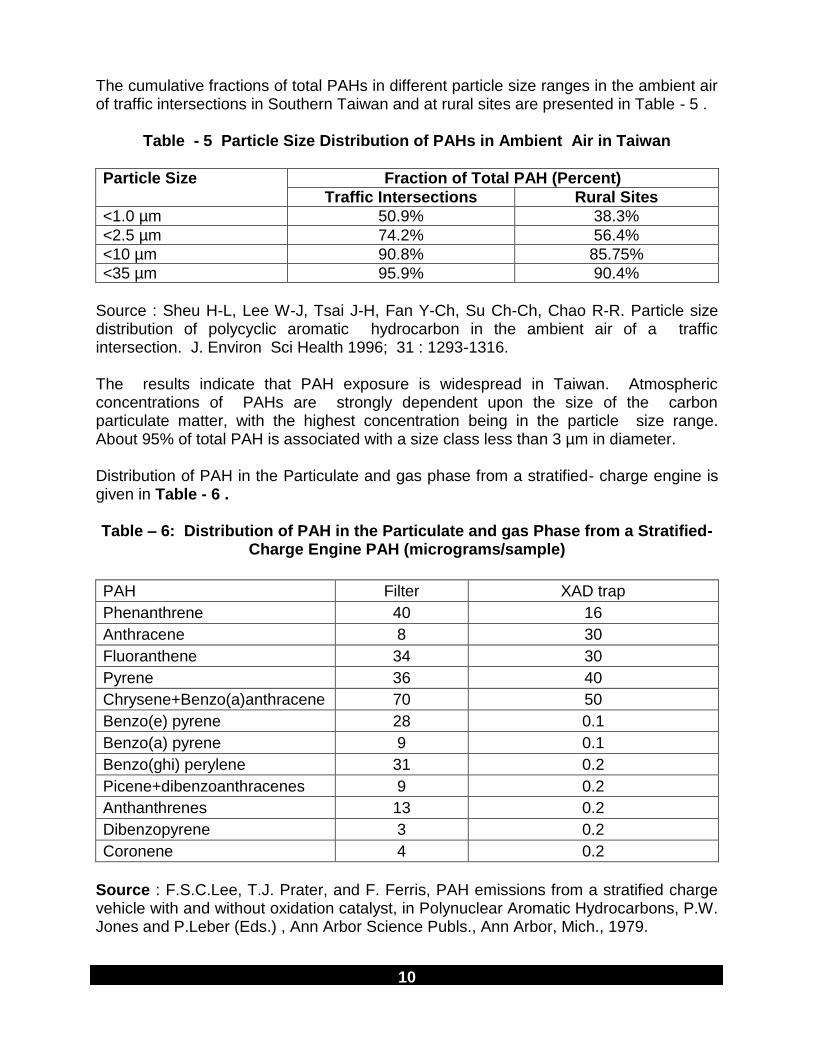
The cumulative fractions of total PAHs in different particle size ranges in the ambient air of traffic intersections in Southern Taiwan and at rural sites are presented in Table - 5 .
Table - 5 Particle Size Distribution of PAHs in Ambient Air in Taiwan
Particle Size Fraction of Total PAH (Percent)
Traffic Intersections Rural Sites
<1.0 µm 50.9% 38.3%
<2.5 µm 74.2% 56.4%
<10 µm 90.8% 85.75%
<35 µm 95.9% 90.4%
Source : Sheu H-L, Lee W-J, Tsai J-H, Fan Y-Ch, Su Ch-Ch, Chao R-R. Particle size distribution of polycyclic aromatic hydrocarbon in the ambient air of a traffic intersection. J. Environ Sci Health 1996; 31 : 1293-1316. The results indicate that PAH exposure is widespread in Taiwan. Atmospheric concentrations of PAHs are strongly dependent upon the size of the carbon particulate matter, with the highest concentration being in the particle size range. About 95% of total PAH is associated with a size class less than 3 µm in diameter. Distribution of PAH in the Particulate and gas phase from a stratified- charge engine is given in Table - 6 . Table – 6: Distribution of PAH in the Particulate and gas Phase from a Stratified-
Charge Engine PAH (micrograms/sample)
PAH Filter XAD trap
Phenanthrene 40 16
Anthracene 8 30
Fluoranthene 34 30
Pyrene 36 40
Chrysene+Benzo(a)anthracene 70 50
Benzo(e) pyrene 28 0.1
Benzo(a) pyrene 9 0.1
Benzo(ghi) perylene 31 0.2
Picene+dibenzoanthracenes 9 0.2
Anthanthrenes 13 0.2
Dibenzopyrene 3 0.2
Coronene 4 0.2
Source : F.S.C.Lee, T.J. Prater, and F. Ferris, PAH emissions from a stratified charge vehicle with and without oxidation catalyst, in Polynuclear Aromatic Hydrocarbons, P.W. Jones and P.Leber (Eds.) , Ann Arbor Science Publs., Ann Arbor, Mich., 1979.
11
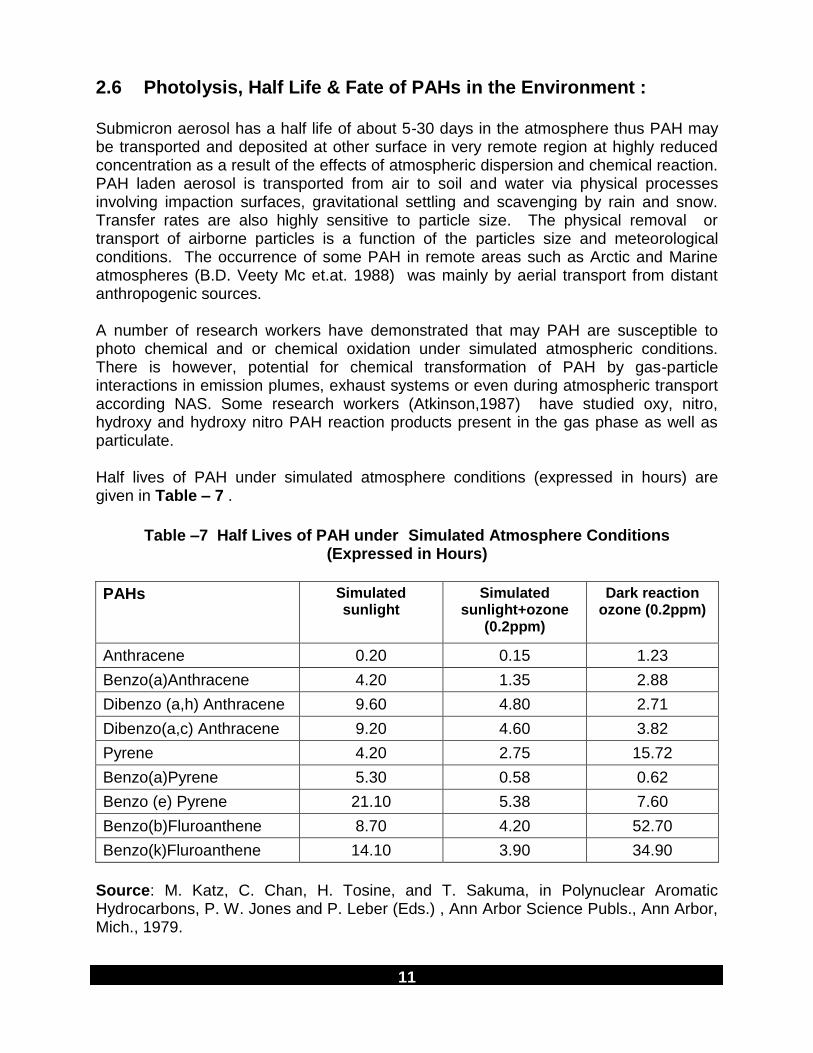
2.6 Photolysis, Half Life & Fate of PAHs in the Environment : Submicron aerosol has a half life of about 5-30 days in the atmosphere thus PAH may be transported and deposited at other surface in very remote region at highly reduced concentration as a result of the effects of atmospheric dispersion and chemical reaction. PAH laden aerosol is transported from air to soil and water via physical processes involving impaction surfaces, gravitational settling and scavenging by rain and snow. Transfer rates are also highly sensitive to particle size. The physical removal or transport of airborne particles is a function of the particles size and meteorological conditions. The occurrence of some PAH in remote areas such as Arctic and Marine atmospheres (B.D. Veety Mc et.at. 1988) was mainly by aerial transport from distant anthropogenic sources. A number of research workers have demonstrated that may PAH are susceptible to photo chemical and or chemical oxidation under simulated atmospheric conditions. There is however, potential for chemical transformation of PAH by gas-particle interactions in emission plumes, exhaust systems or even during atmospheric transport according NAS. Some research workers (Atkinson,1987) have studied oxy, nitro, hydroxy and hydroxy nitro PAH reaction products present in the gas phase as well as particulate. Half lives of PAH under simulated atmosphere conditions (expressed in hours) are given in Table – 7 .
Table –7 Half Lives of PAH under Simulated Atmosphere Conditions
(Expressed in Hours)
PAHs Simulated sunlight
Simulated sunlight+ozone
(0.2ppm)
Dark reaction ozone (0.2ppm)
Anthracene 0.20 0.15 1.23
Benzo(a)Anthracene 4.20 1.35 2.88
Dibenzo (a,h) Anthracene 9.60 4.80 2.71
Dibenzo(a,c) Anthracene 9.20 4.60 3.82
Pyrene 4.20 2.75 15.72
Benzo(a)Pyrene 5.30 0.58 0.62
Benzo (e) Pyrene 21.10 5.38 7.60
Benzo(b)Fluroanthene 8.70 4.20 52.70
Benzo(k)Fluroanthene 14.10 3.90 34.90
Source: M. Katz, C. Chan, H. Tosine, and T. Sakuma, in Polynuclear Aromatic Hydrocarbons, P. W. Jones and P. Leber (Eds.) , Ann Arbor Science Publs., Ann Arbor, Mich., 1979.
12
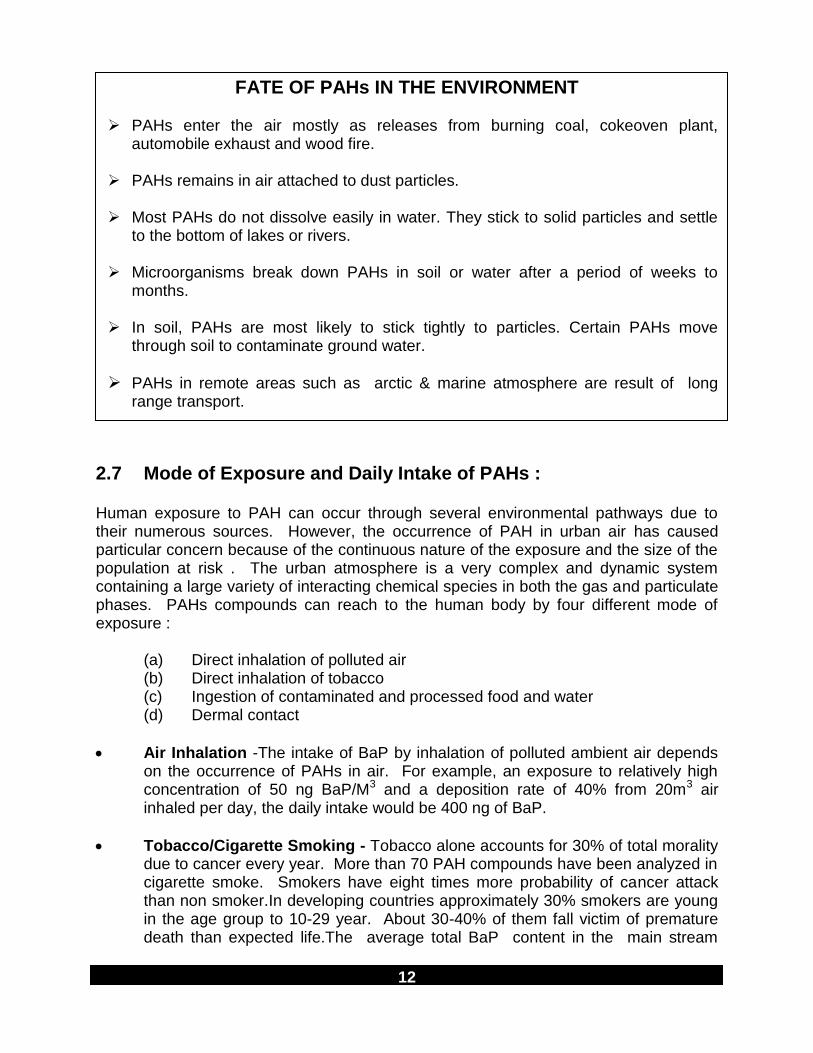
FATE OF PAHs IN THE ENVIRONMENT
PAHs enter the air mostly as releases from burning coal, cokeoven plant, automobile exhaust and wood fire.
PAHs remains in air attached to dust particles.
Most PAHs do not dissolve easily in water. They stick to solid particles and settle to the bottom of lakes or rivers.
Microorganisms break down PAHs in soil or water after a period of weeks to months.
In soil, PAHs are most likely to stick tightly to particles. Certain PAHs move through soil to contaminate ground water.
PAHs in remote areas such as arctic & marine atmosphere are result of long range transport.
2.7 Mode of Exposure and Daily Intake of PAHs : Human exposure to PAH can occur through several environmental pathways due to their numerous sources. However, the occurrence of PAH in urban air has caused particular concern because of the continuous nature of the exposure and the size of the population at risk . The urban atmosphere is a very complex and dynamic system containing a large variety of interacting chemical species in both the gas and particulate phases. PAHs compounds can reach to the human body by four different mode of exposure : (a) Direct inhalation of polluted air (b) Direct inhalation of tobacco (c) Ingestion of contaminated and processed food and water (d) Dermal contact
Air Inhalation -The intake of BaP by inhalation of polluted ambient air depends on the occurrence of PAHs in air. For example, an exposure to relatively high concentration of 50 ng BaP/M3 and a deposition rate of 40% from 20m3 air inhaled per day, the daily intake would be 400 ng of BaP.
Tobacco/Cigarette Smoking - Tobacco alone accounts for 30% of total morality due to cancer every year. More than 70 PAH compounds have been analyzed in cigarette smoke. Smokers have eight times more probability of cancer attack than non smoker.In developing countries approximately 30% smokers are young in the age group to 10-29 year. About 30-40% of them fall victim of premature death than expected life.The average total BaP content in the main stream
13
smoke of 1 cigarette was 35 ng before 1960 and 18 ng in 1978-1979. Modern low tar cigarettes deliver 10 nag BaP. The concentration of BaP in a room extremely polluted with cigarette smoke was 22 ng/m3 (WHO 1587).
Drinking Water- Examination of number of drinking a range from 0.1 to 23.4 µg/l, while for other PAHs the concentration were between 0.001 to 0.01µg/l.
Food- American sources indicate an intake of total PAHs from food in order of 1.6-16 g per day. The contents of BaP in various processed food was repeatedly found to measure up to 50 µg/kg.
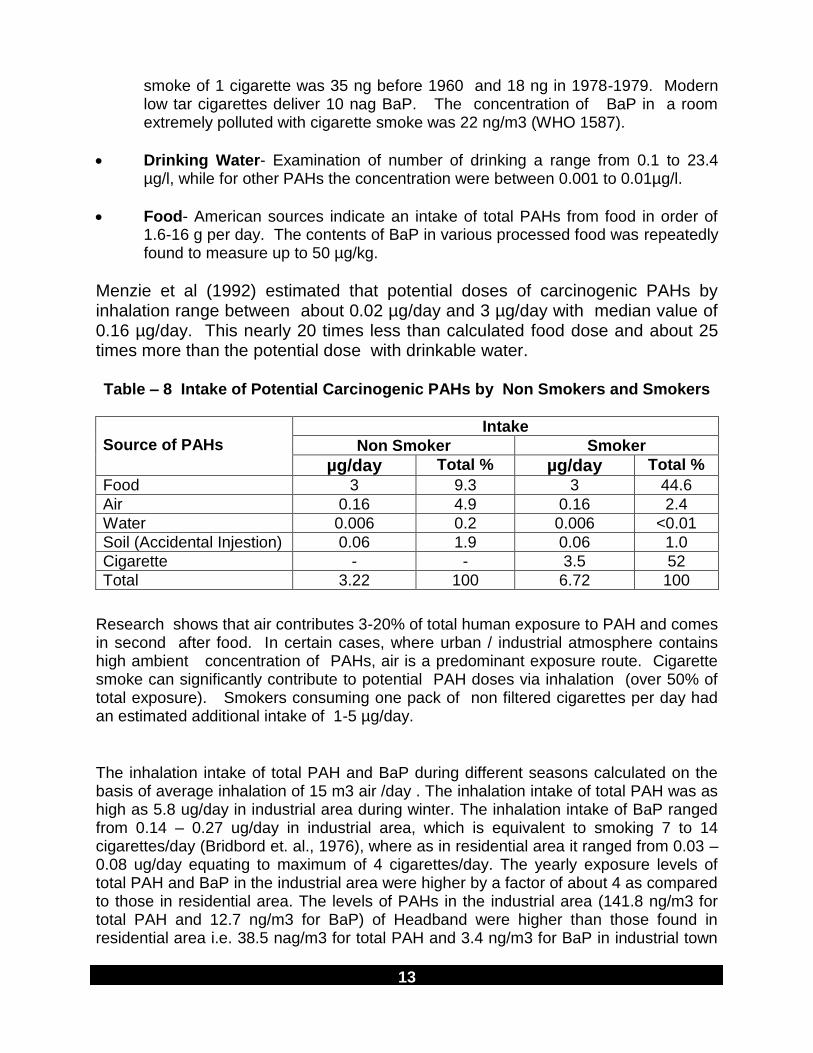
Menzie et al (1992) estimated that potential doses of carcinogenic PAHs by inhalation range between about 0.02 µg/day and 3 µg/day with median value of 0.16 µg/day. This nearly 20 times less than calculated food dose and about 25 times more than the potential dose with drinkable water. Table – 8 Intake of Potential Carcinogenic PAHs by Non Smokers and Smokers
Source of PAHs
Intake
Non Smoker Smoker
µg/day Total % µg/day Total %
Food 3 9.3 3 44.6
Air 0.16 4.9 0.16 2.4
Water 0.006 0.2 0.006 <0.01
Soil (Accidental Injestion) 0.06 1.9 0.06 1.0
Cigarette - - 3.5 52
Total 3.22 100 6.72 100
Research shows that air contributes 3-20% of total human exposure to PAH and comes in second after food. In certain cases, where urban / industrial atmosphere contains high ambient concentration of PAHs, air is a predominant exposure route. Cigarette smoke can significantly contribute to potential PAH doses via inhalation (over 50% of total exposure). Smokers consuming one pack of non filtered cigarettes per day had an estimated additional intake of 1-5 µg/day.
The inhalation intake of total PAH and BaP during different seasons calculated on the basis of average inhalation of 15 m3 air /day . The inhalation intake of total PAH was as high as 5.8 ug/day in industrial area during winter. The inhalation intake of BaP ranged from 0.14 – 0.27 ug/day in industrial area, which is equivalent to smoking 7 to 14 cigarettes/day (Bridbord et. al., 1976), where as in residential area it ranged from 0.03 – 0.08 ug/day equating to maximum of 4 cigarettes/day. The yearly exposure levels of total PAH and BaP in the industrial area were higher by a factor of about 4 as compared to those in residential area. The levels of PAHs in the industrial area (141.8 ng/m3 for total PAH and 12.7 ng/m3 for BaP) of Headband were higher than those found in residential area i.e. 38.5 nag/m3 for total PAH and 3.4 ng/m3 for BaP in industrial town
14
of Kokolla in Finland. The total PAH concentration in Mumbai city at Saki Naka was 38.8 nag/m3 and that at IIT was 24.5 ng/m3 with individual PAH species concentration ranging from 1-13 nag/m3. The total PAH fraction as percentage of particulate (i.e. associated with respirable particulates) under 10 um aerodynamic diameter) at Saki Naka was 2.5 times than observed at IIT site. At the IIT site, primarily vehicular emission alone with cooking fuel emission are likely contributors while industrial oil burning is additional contributor at Saki Naka accounting for higher concentration of Pyrene, Benzo(a)anthracene, Chrysene.
ROUTE OF EXPOSURE OF PAHS
Breathing air containing PAHs in the workplace of coking coal, tar and asphalt production plants, smoke houses and municipal incinerators.
Breathing air containing PAHs from cigarette smoke, wood smoke, vehicle exhaust and asphalt
Coming in contact with air, water or soil , near hazardous waste site.
Eating contaminated cereals, flour,. Bread, vegetables, fruits, meats.
Drinking contaminated water or milk.
Nursing infants of mothers living near hazardous waste sites may be exposed to PAHs through their mother's milk.
3.0 SIGNIFICANCE OF MONITORING PAHS IN THE ENVIRONMENT
& THEIR EFFECTS ON HUMAN HEALTH PAHs are hydrophobic compounds and their persistence in the environment is mainly due to their low water solubility and electro-chemical stability. Evidence suggest that the lipophilicity, environmental persistence and genotoxicity of PAHs increase as the molecular size of the PAHs increases up to four or five fused benzene rings (Cerniglia , 1992). According to Hartwell 185 more than 200 compounds are tested as possible carcinogens. Among these 25% have been found tumerogenic and about 30% of these were PAH (S.I. Lomb et al , 1980) have reported that BaP is a definite carcinogen with an LD50 of 24 micrograms. Many natural and anthropogenic source of PAHs in combination with global transport phenomenon result in the world-wide distribution of these compounds. About 500 PAHs have been detected in air, but most measurements have been made on BaP. At present, no limit of PAHs either in air or in water environment has been prescribed in India. Also there is not any provision of granting consent based upon these compounds in the effluent and emissions from the stationary and mobile sources. Measurement of PAHs is helpful in assessing the existing level of PAHs in source emissions, ambient air, effluents, surface water, sludge/sediment. This will help in the development of data bank of PAHs levels in water and air, formulation and development of standards for

15
ambient air quality, surface water, source emissions and effluents, granting consent based on PAHs to the relevant sources, identification and record of sources of PAHs and formulations of abatement and control strategies of PAHs in the environment. 3.1 Relative Potencies of Certain Mixtures: Concentrations of BaP in natural petroleum crudes, retorted shale oils, coal-derived liquids and other sources are quite variable. It is estimated that 19 per 10,0000 exposed people may die from cancer of the respiratory tract as a result of spending a life time in ambient air containing an average level of BaP 1 ng per m3 mixed with all the other PAH from coke, oven and cigarette smoke emission. Relative potencies of certain mixtures are given below in Table -11 .
Table 11 : Relative Potencies of Certain Mixtures
Mixture Relative potency of mixture
Petrol exhaust 0.736
Roofing tar 0.145
Smokeless coal 0.368
Smoky coal 1.026
Wood smoke 0.759
For example, the BaP content of wood smoke has been estimated to range between 1 and 29 [mg BaP/g of mixture] (Ward 1999). Inserting all quantities into the above equation leads to a unit risk for wood smoke in the range of (0.07-1.9) x 10-7 [µg/m3]-1. If the BaP content of other mixtures are known the unit risk can be estimated in a similar way.
3.2 PAHs as Potential Carcinogens : Evidence that mixtures of PAHs are carcinogenic to human comes primarily from occupational studies of workers following inhalation and dermal exposure. No data are available for human for the oral route of exposure. In the past, chimneysweepers and tar-workers were dermally exposed to substantial amounts of PAHs and PAHs caused skin cancer in many of these workers. Coke -oven workers, coal-gas workers and employees in aluminium production plants provide sufficient evidence of role of inhaled, PAHs in the induction of lung cancer. As per USEPA report (1984) extensive epidemiological studies of coke oven workers , it was found that workers exposed to coke oven emissions were at an increased risk of cancer. A dose-response relationship was established in terms of both length of employment and intensity of exposure according to work area at the top or side of the coke oven. The relative risk of lung, trachea and bronchus cancer mortality in 1975 was 6.94 among Allegheny County, Pennsylvania coke oven workers who had been employed 5 or more years through 1953 and worked full time topside at the coke

16
ovens. By comparison, side oven workers employed more than 5 years and followed through 1975 had a relative risk of 1.91, while non oven workers employed more than 5 years had a relative risk of 1.11. Sakable et al. (1975) observed a significant (P < 0.05) excess of lung cancer deaths (lung cancer mortality ratio of 2.37) among retired iron and steel coke oven workers in Japan when compared to expected which was derived from general population statistics. Mutagenicity tests on the complex mixture of solvent-extracted organics of coke oven emissions were positive in bacteria. A complex mixture from the coke oven collecting main was mutagenic in bacteria and mammalian cells in vitro. In addition, a number of components identified in coke oven emissions are recognised as mutagens and/or carcinogens. A number of approaches are used to estimate the human lifetime respiratory cancer death due to a continuous exposure of 1 µg/m3 of the Benzene soluble organics (BSO) extracted from the particulate phase of CTPV from coke ovens emissions. Using a Weilbull type model it is estimated that the risk due to a 1 µg/m3 unit exposure ranges from 1.30 x 10⁻⁸ for the 95% lower-bound zero lag-time assumption to 1.05 x 10-
3 for the 95% upper-bound 15 year lag-time assumption. Using a multistage-type model, the maximum likelihood estimates for the risk due to unit exposure range from 1.76 x 10⁻⁶ for the zero lag-time case of 6.29 x 10⁻⁴ for the 15 year lag-time case. Some PAHs are classified as potent carcinogens. The benzo (a) pyrene is referred to as “ one of the most potent carcinogens known” in a recent publication by Sutherland et al (1995). PAHs are highly lipid-soluble and are absorbed by the lungs and gut of mammals. PAHs may penetrate into the bronchial epithelium cells where metabolism takes places.The carcinogenicity of individual PAC requires metabolic activations and conversion into their corresponding ultimate carcinogenic metabolites which are responsible for DNA alkylation and the initiation step in the complex mechanism, associated with chemically induced cancer.The PAH epoxide metabolites are products of P-450 catalysed reactions and one particular is enzyme P.450 01 A1 plays an important role in metabolite activation of several carcinogenic PAH (Harris et al. 1988; Dipple & Bigger, 1991). PAHs are metabolised via the mixed -function oxidase system with oxidation as the first step. The resultant epoxides or phenols may go through detoxification reactions. Some epoxides can be further oxidized to diol-epoxide. These compounds are thought to be ultimate carcinogens. BaP is metabolised to approximately 20 primary and secondary oxidized metabolites. Several of these can induce mutations transform cells and /or bind to cellular macromolecules. A number of PAH have been shown to be mutagenic in bacterial systems and in vitro cell lines and in vivo by sister chromatid exchange. Sufficient evidence for activity in short-term test exist for six PAHs benz(a)anthracne, benzo)(a)pyrene, Cyclepenta(cd) pyrene dibenz(a,c) anthracene, dibenz(a,h) anthracene and 1-methylpenanthrene. According to Hartwell more than 200 compounds are tested as possible carcinogens. Among these 25% have been found tumerogenic and about 30% of these were PAH. Lomb et al have reported that Bap is a definite carcinogen with an LD50 of 24
17
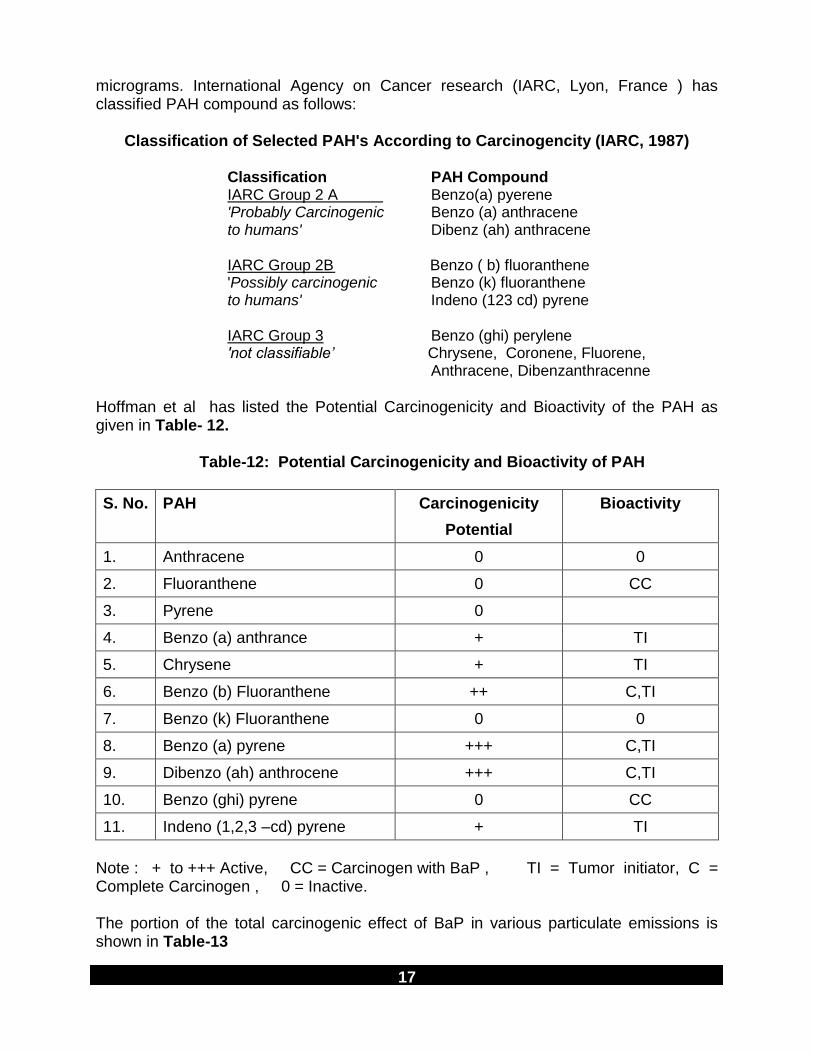
micrograms. International Agency on Cancer research (IARC, Lyon, France ) has classified PAH compound as follows:
Classification of Selected PAH's According to Carcinogencity (IARC, 1987)
Classification PAH Compound IARC Group 2 A Benzo(a) pyerene 'Probably Carcinogenic Benzo (a) anthracene to humans' Dibenz (ah) anthracene IARC Group 2B Benzo ( b) fluoranthene 'Possibly carcinogenic Benzo (k) fluoranthene to humans' Indeno (123 cd) pyrene IARC Group 3 Benzo (ghi) perylene 'not classifiable’ Chrysene, Coronene, Fluorene, Anthracene, Dibenzanthracenne
Hoffman et al has listed the Potential Carcinogenicity and Bioactivity of the PAH as given in Table- 12. Table-12: Potential Carcinogenicity and Bioactivity of PAH
S. No. PAH Carcinogenicity
Potential
Bioactivity
1. Anthracene 0 0
2. Fluoranthene 0 CC
3. Pyrene 0
4. Benzo (a) anthrance + TI
5. Chrysene + TI
6. Benzo (b) Fluoranthene ++ C,TI
7. Benzo (k) Fluoranthene 0 0
8. Benzo (a) pyrene +++ C,TI
9. Dibenzo (ah) anthrocene +++ C,TI
10. Benzo (ghi) pyrene 0 CC
11. Indeno (1,2,3 –cd) pyrene + TI
Note : + to +++ Active, CC = Carcinogen with BaP , TI = Tumor initiator, C = Complete Carcinogen , 0 = Inactive. The portion of the total carcinogenic effect of BaP in various particulate emissions is shown in Table-13
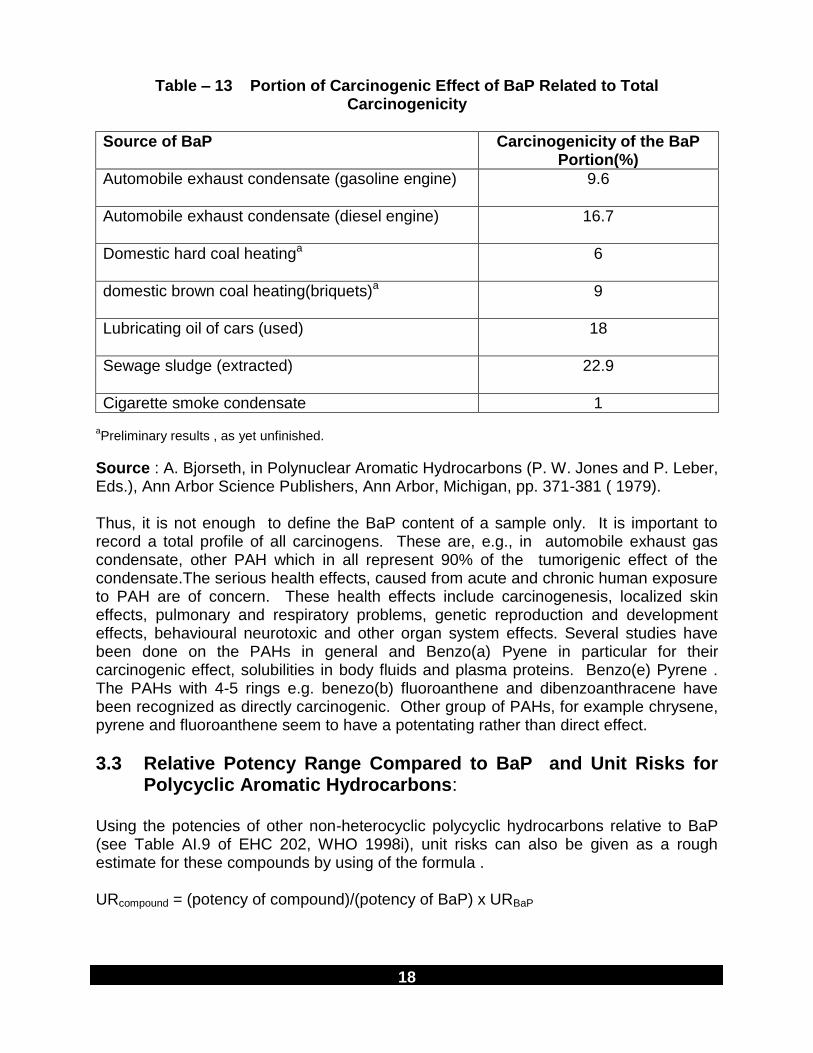
18
Table – 13 Portion of Carcinogenic Effect of BaP Related to Total Carcinogenicity
Source of BaP Carcinogenicity of the BaP Portion(%)
Automobile exhaust condensate (gasoline engine)
9.6
Automobile exhaust condensate (diesel engine)
16.7
Domestic hard coal heatinga
6
domestic brown coal heating(briquets)a
9
Lubricating oil of cars (used)
18
Sewage sludge (extracted)
22.9
Cigarette smoke condensate 1
aPreliminary results , as yet unfinished.
Source : A. Bjorseth, in Polynuclear Aromatic Hydrocarbons (P. W. Jones and P. Leber, Eds.), Ann Arbor Science Publishers, Ann Arbor, Michigan, pp. 371-381 ( 1979). Thus, it is not enough to define the BaP content of a sample only. It is important to record a total profile of all carcinogens. These are, e.g., in automobile exhaust gas condensate, other PAH which in all represent 90% of the tumorigenic effect of the condensate.The serious health effects, caused from acute and chronic human exposure to PAH are of concern. These health effects include carcinogenesis, localized skin effects, pulmonary and respiratory problems, genetic reproduction and development effects, behavioural neurotoxic and other organ system effects. Several studies have been done on the PAHs in general and Benzo(a) Pyene in particular for their carcinogenic effect, solubilities in body fluids and plasma proteins. Benzo(e) Pyrene . The PAHs with 4-5 rings e.g. benezo(b) fluoroanthene and dibenzoanthracene have been recognized as directly carcinogenic. Other group of PAHs, for example chrysene, pyrene and fluoroanthene seem to have a potentating rather than direct effect.
3.3 Relative Potency Range Compared to BaP and Unit Risks for Polycyclic Aromatic Hydrocarbons:
Using the potencies of other non-heterocyclic polycyclic hydrocarbons relative to BaP (see Table AI.9 of EHC 202, WHO 1998i), unit risks can also be given as a rough estimate for these compounds by using of the formula . URcompound = (potency of compound)/(potency of BaP) x URBaP
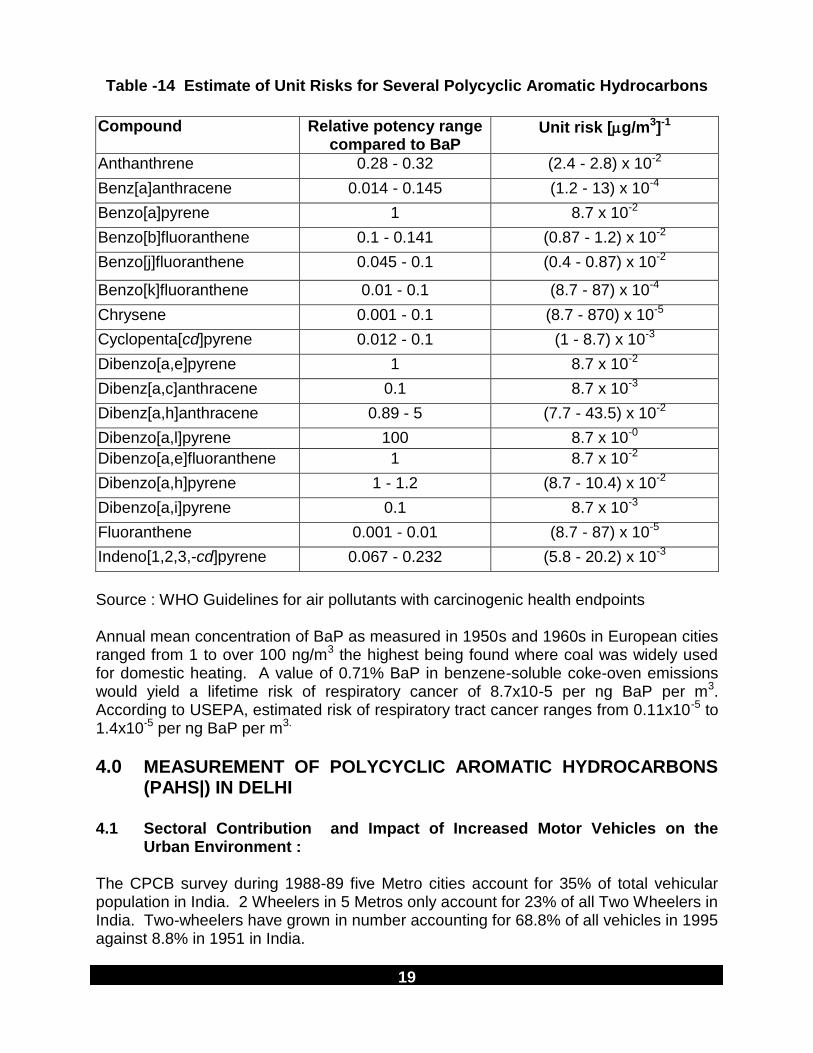
19
Table -14 Estimate of Unit Risks for Several Polycyclic Aromatic Hydrocarbons
Compound Relative potency range
compared to BaP Unit risk [g/m3]-1
Anthanthrene 0.28 - 0.32 (2.4 - 2.8) x 10-2
Benz[a]anthracene 0.014 - 0.145 (1.2 - 13) x 10-4
Benzo[a]pyrene 1 8.7 x 10⁻²
Benzo[b]fluoranthene 0.1 - 0.141 (0.87 - 1.2) x 10-2
Benzo[j]fluoranthene 0.045 - 0.1 (0.4 - 0.87) x 10-2
Benzo[k]fluoranthene 0.01 - 0.1 (8.7 - 87) x 10-4
Chrysene 0.001 - 0.1 (8.7 - 870) x 10-5
Cyclopenta[cd]pyrene 0.012 - 0.1 (1 - 8.7) x 10-3
Dibenzo[a,e]pyrene 1 8.7 x 10⁻²
Dibenz[a,c]anthracene 0.1 8.7 x 10⁻³
Dibenz[a,h]anthracene 0.89 - 5 (7.7 - 43.5) x 10-2
Dibenzo[a,l]pyrene 100 8.7 x 10-0
Dibenzo[a,e]fluoranthene 1 8.7 x 10⁻²
Dibenzo[a,h]pyrene 1 - 1.2 (8.7 - 10.4) x 10-2
Dibenzo[a,i]pyrene 0.1 8.7 x 10⁻³
Fluoranthene 0.001 - 0.01 (8.7 - 87) x 10-5
Indeno[1,2,3,-cd]pyrene 0.067 - 0.232 (5.8 - 20.2) x 10-3
Source : WHO Guidelines for air pollutants with carcinogenic health endpoints Annual mean concentration of BaP as measured in 1950s and 1960s in European cities ranged from 1 to over 100 ng/m3 the highest being found where coal was widely used for domestic heating. A value of 0.71% BaP in benzene-soluble coke-oven emissions would yield a lifetime risk of respiratory cancer of 8.7x10⁻⁵ per ng BaP per m3. According to USEPA, estimated risk of respiratory tract cancer ranges from 0.11x10⁻⁵ to 1.4x10⁻⁵ per ng BaP per m3.
4.0 MEASUREMENT OF POLYCYCLIC AROMATIC HYDROCARBONS (PAHS|) IN DELHI
4.1 Sectoral Contribution and Impact of Increased Motor Vehicles on the
Urban Environment : The CPCB survey during 1988-89 five Metro cities account for 35% of total vehicular population in India. 2 Wheelers in 5 Metros only account for 23% of all Two Wheelers in India. Two-wheelers have grown in number accounting for 68.8% of all vehicles in 1995 against 8.8% in 1951 in India.
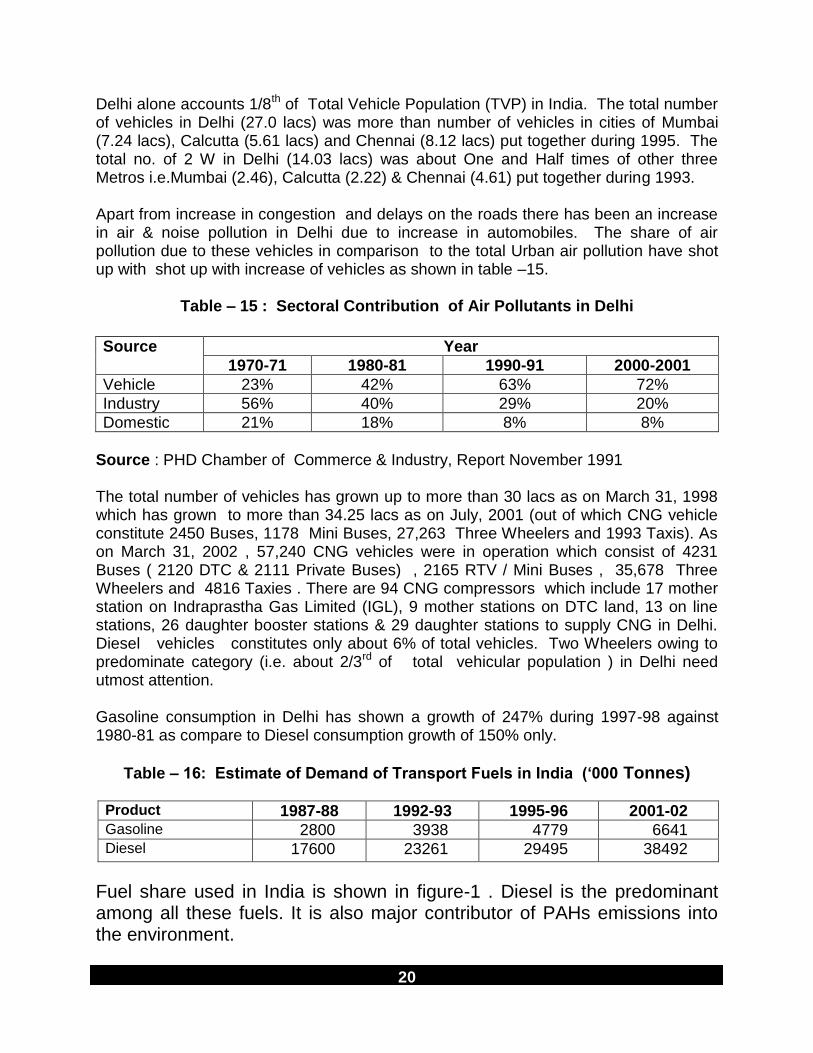
20
Delhi alone accounts 1/8th of Total Vehicle Population (TVP) in India. The total number of vehicles in Delhi (27.0 lacs) was more than number of vehicles in cities of Mumbai (7.24 lacs), Calcutta (5.61 lacs) and Chennai (8.12 lacs) put together during 1995. The total no. of 2 W in Delhi (14.03 lacs) was about One and Half times of other three Metros i.e.Mumbai (2.46), Calcutta (2.22) & Chennai (4.61) put together during 1993. Apart from increase in congestion and delays on the roads there has been an increase in air & noise pollution in Delhi due to increase in automobiles. The share of air pollution due to these vehicles in comparison to the total Urban air pollution have shot up with shot up with increase of vehicles as shown in table –15.
Table – 15 : Sectoral Contribution of Air Pollutants in Delhi
Source Year
1970-71 1980-81 1990-91 2000-2001
Vehicle 23% 42% 63% 72%
Industry 56% 40% 29% 20%
Domestic 21% 18% 8% 8%
Source : PHD Chamber of Commerce & Industry, Report November 1991 The total number of vehicles has grown up to more than 30 lacs as on March 31, 1998 which has grown to more than 34.25 lacs as on July, 2001 (out of which CNG vehicle constitute 2450 Buses, 1178 Mini Buses, 27,263 Three Wheelers and 1993 Taxis). As on March 31, 2002 , 57,240 CNG vehicles were in operation which consist of 4231 Buses ( 2120 DTC & 2111 Private Buses) , 2165 RTV / Mini Buses , 35,678 Three Wheelers and 4816 Taxies . There are 94 CNG compressors which include 17 mother station on Indraprastha Gas Limited (IGL), 9 mother stations on DTC land, 13 on line stations, 26 daughter booster stations & 29 daughter stations to supply CNG in Delhi. Diesel vehicles constitutes only about 6% of total vehicles. Two Wheelers owing to predominate category (i.e. about 2/3rd of total vehicular population ) in Delhi need utmost attention. Gasoline consumption in Delhi has shown a growth of 247% during 1997-98 against 1980-81 as compare to Diesel consumption growth of 150% only.
Table – 16: Estimate of Demand of Transport Fuels in India (‘000 Tonnes)
Product 1987-88 1992-93 1995-96 2001-02 Gasoline 2800 3938 4779 6641 Diesel 17600 23261 29495 38492
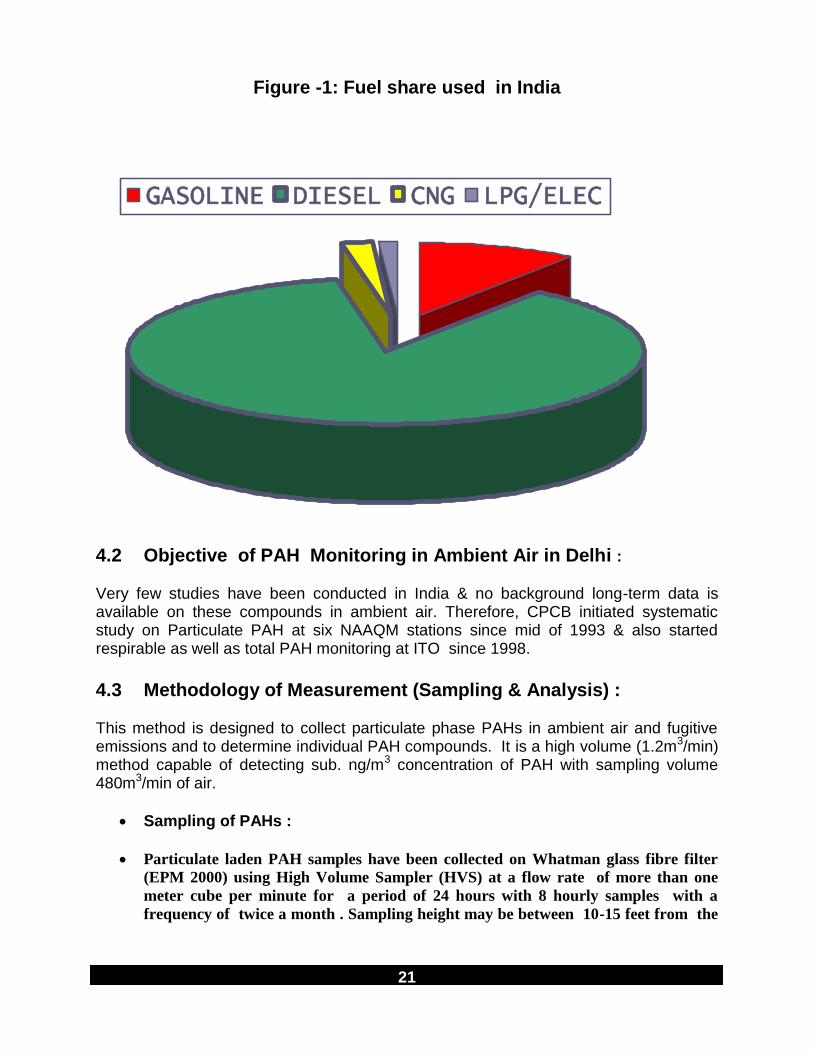
Fuel share used in India is shown in figure-1 . Diesel is the predominant among all these fuels. It is also major contributor of PAHs emissions into the environment.
21
Figure -1: Fuel share used in India
4.2 Objective of PAH Monitoring in Ambient Air in Delhi : Very few studies have been conducted in India & no background long-term data is available on these compounds in ambient air. Therefore, CPCB initiated systematic study on Particulate PAH at six NAAQM stations since mid of 1993 & also started respirable as well as total PAH monitoring at ITO since 1998.
4.3 Methodology of Measurement (Sampling & Analysis) : This method is designed to collect particulate phase PAHs in ambient air and fugitive emissions and to determine individual PAH compounds. It is a high volume (1.2m3/min) method capable of detecting sub. ng/m3 concentration of PAH with sampling volume 480m3/min of air.
Sampling of PAHs :
Particulate laden PAH samples have been collected on Whatman glass fibre filter
(EPM 2000) using High Volume Sampler (HVS) at a flow rate of more than one
meter cube per minute for a period of 24 hours with 8 hourly samples with a
frequency of twice a month . Sampling height may be between 10-15 feet from the
GASOLINE DIESEL CNG LPG/ELEC
22
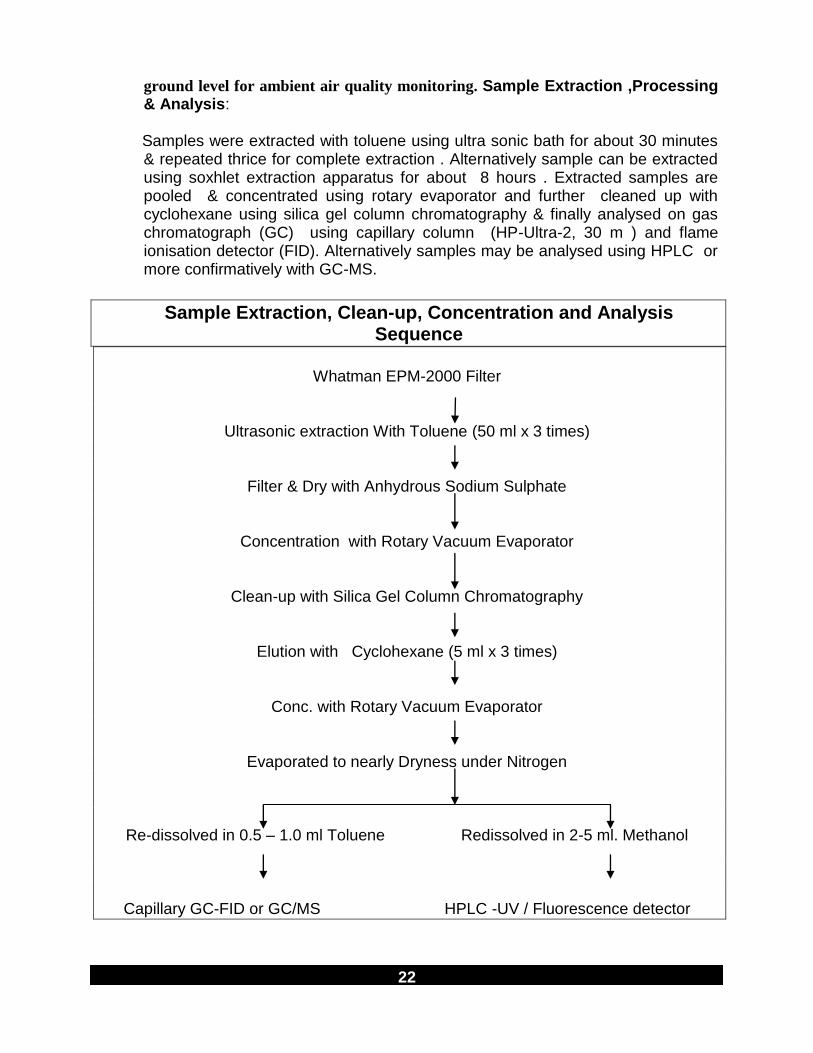
ground level for ambient air quality monitoring. Sample Extraction ,Processing & Analysis:
Samples were extracted with toluene using ultra sonic bath for about 30 minutes
& repeated thrice for complete extraction . Alternatively sample can be extracted using soxhlet extraction apparatus for about 8 hours . Extracted samples are pooled & concentrated using rotary evaporator and further cleaned up with cyclohexane using silica gel column chromatography & finally analysed on gas chromatograph (GC) using capillary column (HP-Ultra-2, 30 m ) and flame ionisation detector (FID). Alternatively samples may be analysed using HPLC or more confirmatively with GC-MS.
Sample Extraction, Clean-up, Concentration and Analysis Sequence
Whatman EPM-2000 Filter
Ultrasonic extraction With Toluene (50 ml x 3 times)
Filter & Dry with Anhydrous Sodium Sulphate
Concentration with Rotary Vacuum Evaporator
Clean-up with Silica Gel Column Chromatography
Elution with Cyclohexane (5 ml x 3 times)
Conc. with Rotary Vacuum Evaporator
Evaporated to nearly Dryness under Nitrogen
Re-dissolved in 0.5 – 1.0 ml Toluene Redissolved in 2-5 ml. Methanol
Capillary GC-FID or GC/MS HPLC -UV / Fluorescence detector
23
5.0 RESULTS & DISCUSSION
5.1 Particulate PAH at 6 NAAQM stations :
Particulate PAH are being monitored at 6 NAAQM stations in Delhi on monthly basis since year 1993. 15 PAH compounds measured, using GC-FID technique in CPCB laboratory, are : Naphthalene, Phenanthrene, Anthracene, Fluoranthene, Pyrene, Benzo(a)anthracene, Chrysene, Benzo(b)fluoranthene, Benzo(k)fluoranthene, Benzo(e)pyrene, Benzo(a)pyrene, Perylene, Indeno(cd)pyrene, Dibenzo(ah)anthracene, Benzo(ghi)perylene. The summary of the data i.e. location wise annual trend of TPAH conc. with minimum & maximum values of TPAH (particulate phase) measured at 6 NAAQM stations namely Siri Fort, Ashok Vihar, Janak Puri, Nizamuddin, Shahdara, Sahazada Bagh during the study period 1993-2000 are given in Table-17. Monthly & seasonal variations in TPAH conc. during the study period (1993-2000) are shown in Table –18 and Figure:2 - 4. Year wise annual mean TPAH conc. ranges between 18 ng/m3 (during 1999) and 38 ng/m3 (during year 1997). PAHs levels were slowly increasing from year 1993 till 1997 & thereafter going down year after year , which may be due to improvement in fuel quality, phasing out of old vehicles & stricter emission norms (Euro I & II) vis a vis improvement in engine technology. Season wise higher TPAH levels have been observed during winter season ranging between 22 and 44 ng/m3 (except during monsoon 1997 i.e. 53 ng/m3). Monsoon & Summer (ranging between 8 and 24 ng/m3) have recorded comparatively low TPAH levels , which may be due to washout during rainy season & photolysis during sunlight in Summer season. Annual mean concentration of individual PAH compounds are given in Table -19 and Figure - 6. Maximum annual mean concentration was found during 1997 for Indeno(cd)pyrene (8.4 ng/m3) followed by Benzo(b+k)fluoranthane (6.3ng/m3) & Benzo(e)pyrene (5.4 ng/m3). Benzo(ghi)perylene was also found higher (4.0 ng/m3) during 1998. For rest of compounds concentration was observed below 4.0 ng/m3 during whole study period. Location wise annual mean concentration profile of Benzo(a)pyrene during 1993-2001 is given in Figure- 5. Naphthalene was not detected due to its high volatility.
Table –17 Total PAHs Concentrations (ng/m3) in Delhi
Year Locations Minimum Maximum Average Std.Dev.
1993 Siri Fort 22.7 34.6 28.1 4.6
Ashok Vihar 2.9 35.7 14.1 12.6
Nizzamuddin 11.3 32.4 21.0 9.1
Janak Puri 6.6 25.8 16.3 9.2
Shahdra 9.7 42.4 23.2 12.7
Shazada Bagh 20.0 41.6 30.9 10.2
Average 1993
12.2
35.4
22.3
9.7
24
Year Locations Minimum Maximum Average Std.Dev.
1994 Siri Fort 13.5 30.2 22.5 6.0
Ashok Vihar 5.1 58.0 27.2 17.2
Nizzamuddin 7.8 49.6 29.8 14.0
Janak Puri 6.1 39.7 20.1 12.5
Shahdra 3.0 56.3 29.2 18.4
Shazada Bagh 8.6 49.9 28.6 15
Average 1994 7.4 47.3 26.2 13.9
1995 Siri Fort 9.1 31.7 19.3 8.0
Ashok Vihar 5.1 47.6 25.2 14.3
Nizzamuddin 13.4 30.8 20.8 6.3
Janak Puri 8.0 40.9 24.0 12.0
Shahdra 9.2 56.0 30.2 16.1
Shazada Bagh 8.7 60.2 36.5 18.6
Average 1995 8.9 44.5 26.0 12.5
1996 Siri Fort 7.4 31.7 18.0 8.0
Ashok Vihar 8.0 47.6 26.6 14.1
Nizzamuddin 12.9 60.3 33.2 17.4
Janak Puri 5.9 43.5 22.7 12.4
Shahdra 13.3 75.2 41.1 18.5
Shazada Bagh 13.0 56.8 36.0 16.2
Average 1996 10.1 52.5 29.6 14.4
1997 Siri Fort 7.7 49.6 23.9 14.0
Ashok Vihar 10.2 52.2 34.6 15.1
Nizzamuddin 10.8 49.8 31.5 15.0
Janak Puri 5.0 60.3 29.3 17.5
Shahdra 26.7 94.8 50.8 23.0
Shazada Bagh 14.7 93.1 51.3 28.6
Average 1997 12.5 66.6 36.9 18.9
1998 Siri Fort 8.5 46.2 22.0 13.0
Ashok Vihar 6.4 44.1 22.2 11.3
Nizzamuddin 5.8 61.8 25.0 15.0
Janak Puri 8.2 70.0 25.8 18.4
Shahdra 14.6 82.9 40.3 20.9
Shazada Bagh 11.4 79.5 35.4 21.6
Average 1998 9.2 64.1 28.4 16.7
1999 Siri Fort 2.5 18.5 9.0 4.5
Ashok Vihar 4.1 44.0 17.2 11.2
Nizzamuddin 6.6 35.7 18.7 7.0
Janak Puri 4.1 58.7 16.3 14.7
Shahdra 6.2 41.6 19.9 10.1
Shazada Bagh 10.5 52.5 25.9 12.0
Average 1999 5.7 41.8 17.8 10.0
2000 Siri Fort 6.1 27.2 15.2 6.5
Ashok Vihar 6.4 35.9 19.4 9.5
Nizzamuddin 13.4 30.8 20.8 6.3
25
Year Locations Minimum Maximum Average Std.Dev.
Janak Puri 8.5 53.3 17.1 13.2
Shahdra 6.3 49.6 25.9 15.5
Shazada Bagh 5.2 43.5 23.6 14
Average 2000 7.7 40.1 20.3 10.8
Table – 18 : Total Polycyclic Aromatic Hydrocarbons ( ng / m3 ) in Ambient Air in Delhi.
Period Year 1993
Year 1994
Year 1995
Year 1996
Year 1997
Year 1998
Year 1999
Year 2000
Jan - 40 46 42 30 64 19 21
Feb - 32 37 35 31 48 19 28
Mar - - 24 26 29 34 15 29
Apr - - 16 17 13 24 13 14
May - 8 7 10 14 25 16 14
Jun - - 11 14 17 12 11 9
Jul 13 - 15 17 58 13 15 18
Aug 13 12 19 22 51 13 16 11
Sep 22 14 27 31 49 19 17 15
Oct 19 22 39 42 58 26 26 23
Nov 33 26 45 48 49 33 26 39
Dec 33 39 48 51 54 35 22 25
Minimum 12 7 7 10 11 9 6 9
Maximum 35 40 50 53 69 64 42 39
Average 22 24 28 30 38 29 18 21
Std. 10 13 15 14 20 17 10 9
Monsoon 16 13 20 23 53 15 16 15
Winter 28 32 43 44 44 41 22 27
Summer - 8 14 17 18 24 14 17
26
Figure – 2: Total Polycyclic Aromatic Hydrocarbons in Ambient Air in Delhi.
0
10
20
30
40
50
60
70
80Ja
n
Feb
Mar
Apr
May Jun
Jul
Aug
Sep Oct
Nov
Dec
Min
imum
Max
imum
Ave
rage
Std
M
onsoon
Win
ter
Sum
mer
Co
nc.
in n
g.
/ m
3
Year1993 Year1994 Year 1995 Year1996 Year1997 Year 1998 Year 1999 Year 2000
Figure – 3: Annual Trend of Total Polycyclic Aromatic Hydrocarbons in Ambient
Air in Delhi (1993-2000)
0
10
20
30
40
50
60
70
80
Minimum Maximum Average Monsoon Winter Summer
Range ------>
Co
nc.
in n
g.
/ m3
Year1993 Year1994 Year 1995 Year1996 Year1997 Year 1998 Year 1999 Year 2000
27
Fig – 4 : SEASONAL VARIATION OF TOTAL POLY AROMATIC HYDROCARBONS (PAHs)IN AMBIENT AIR OF DELHI
0
10
20
30
40
50
60
1993 1994 1995 1996 1997 1998 1999 2000
Co
nc. (n
g/m
3)
Monsoon Winter Summer
Fig- 5 : Annual Mean Variation of Benzo (a) Pyrene Levels in
Delhi.
0.0
1.0
2.0
3.0
4.0
5.0
6.0
Avg 93 Avg 94 Avg 95 Avg 96 Avg 97 Avg 98 Avg 99 Avg 2000
<----- Yearly Average ----->
Co
nc
. (n
g /
m 3
)
AV SF NIZ JP SH SB
28
Table- 19 : Annual Average Values (ng/m3 ) of PAHs Compounds in Ambient Air in Delhi
Polycyclic Aromatic Hydrocarbons (PAHs)
Year 1993
Year 1994
Year 1995
Year 1996
Year 1997
Year 1998
Year 1999
Year 2000
Phenenthrene 0.5 0.7 0.6 0.9 0.9 0.6 0.5 0.2
Anthracene 0.7 1.1 0.6 0.8 1.4 0.2 0.3 0.5
Fluoranthene 1.0 1.1 0.6 1.9 1.6 1.6 1.1 0.9
Pyrene 1.0 2.1 1.7 2.0 2.9 1.8 1.3 0.7
Benzo(A)Anthracene 2.3 2.6 3.1 3.1 3.7 2.3 1.8 1.1
Chrysene+ Tp 1.6 2.1 2.6 2.7 2.8 3.5 1.9 2.1
Benzo(B+K)Fluroanthene 2.9 2.7 3.4 3.6 6.3 2.6 1.0 3.5
Benzo (E) Pyrene 2.6 2.7 3.4 2.9 5.4 3.8 2.2 2.8
Benzo(A)Pyrene 2.0 2.7 3.4 2.5 2.3 3.5 1.9 2.8
Perylene 1.6 2.3 1.9 3.0 3.0 2.1 1.4 2.5
Indeno(Cd) Pyrene 1.9 1.8 2.4 3.0 8.4 0.9 1.0 2.7
Dibenzo(Ah) Anthracene 2.1 2.2 2.1 1.7 1.7 1.8 1.3 2.6
Benzo(Ghi) Perylene 2.1 2.4 2.5 2.2 2.2 4.0 2.2 2.4
Figure –6: Annual Average Individual Polycyclic Aromatic Hydrocarbons in Ambient Air in Delhi
0.0
1.0
2.0
3.0
4.0
5.0
6.0
7.0
8.0
9.0
PH
EN
ENTH
REN
E
ANTH
RA
CENE
FLU
ORA
NTH
EN
E
PYREN
E
BEN
ZO(a
)ANTH
RAC
ENE
CHR
YSEN
E+
TP
BEN
ZO(b
+k)F
LUR
OAN
THEN
E*
BEN
ZO (e
) PYR
EN
EB
EN
ZO(a
)PYRENE
PERYLE
NE
IND
EN
O(c
d) P
YR
EN
E
DIB
EN
ZO(a
h) A
NTH
RA
CEN
E
BEN
ZO(g
hi) P
ER
YLE
NE
Co
nc.
in n
g.
/ m
3
Year1993 Year1994 Year 1995 Year1996 Year1997 Year 1998 Year 1999 Year 2000
29
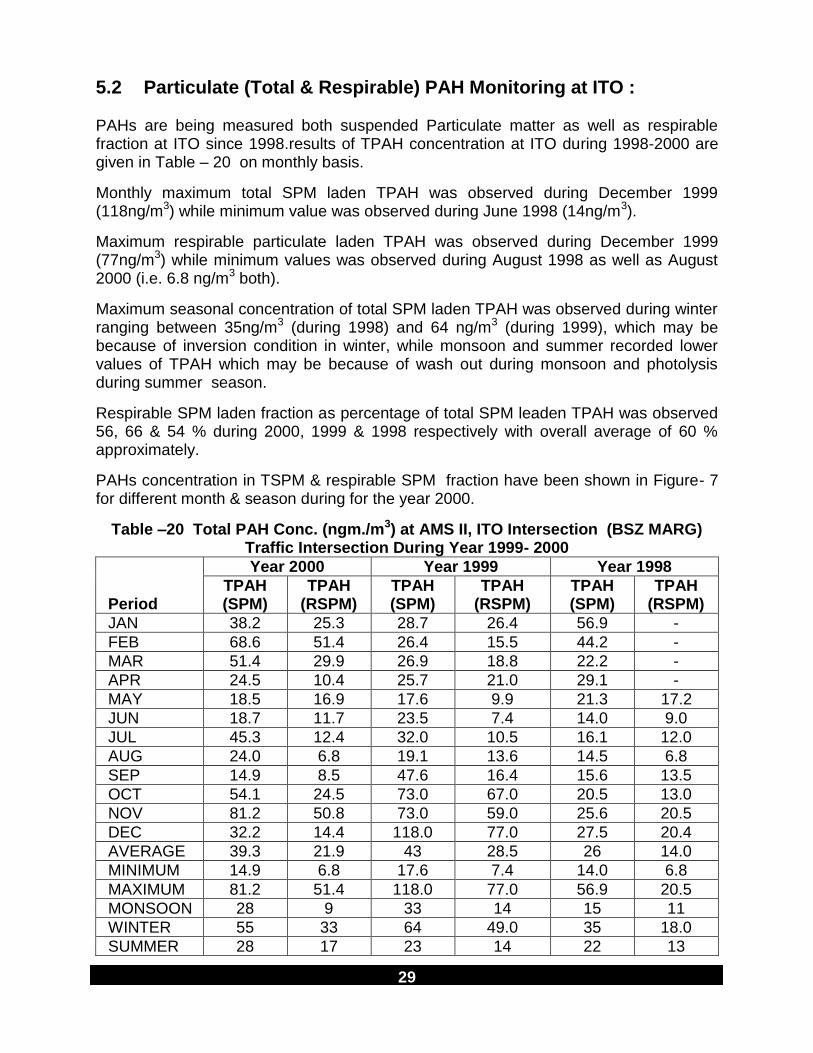
5.2 Particulate (Total & Respirable) PAH Monitoring at ITO : PAHs are being measured both suspended Particulate matter as well as respirable fraction at ITO since 1998.results of TPAH concentration at ITO during 1998-2000 are given in Table – 20 on monthly basis.
Monthly maximum total SPM laden TPAH was observed during December 1999 (118ng/m3) while minimum value was observed during June 1998 (14ng/m3).
Maximum respirable particulate laden TPAH was observed during December 1999 (77ng/m3) while minimum values was observed during August 1998 as well as August 2000 (i.e. 6.8 ng/m3 both).
Maximum seasonal concentration of total SPM laden TPAH was observed during winter ranging between 35ng/m3 (during 1998) and 64 ng/m3 (during 1999), which may be because of inversion condition in winter, while monsoon and summer recorded lower values of TPAH which may be because of wash out during monsoon and photolysis during summer season.
Respirable SPM laden fraction as percentage of total SPM leaden TPAH was observed 56, 66 & 54 % during 2000, 1999 & 1998 respectively with overall average of 60 % approximately.
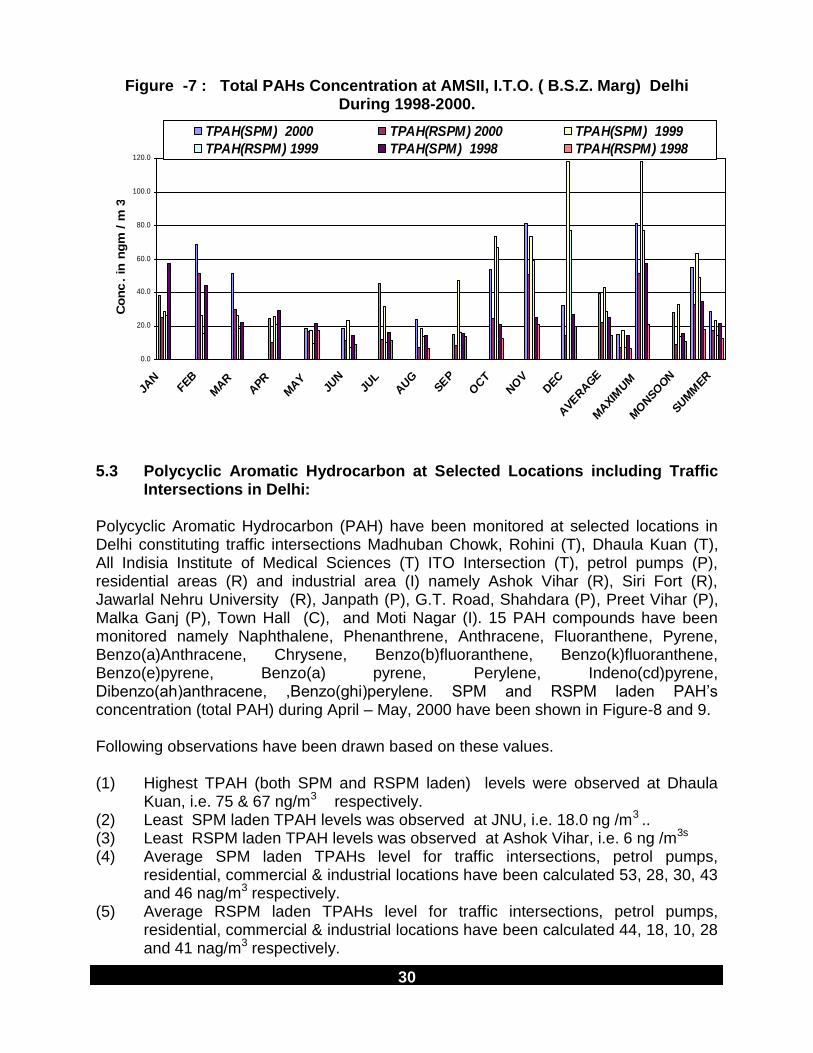
PAHs concentration in TSPM & respirable SPM fraction have been shown in Figure- 7 for different month & season during for the year 2000.
Table –20 Total PAH Conc. (ngm./m3) at AMS II, ITO Intersection (BSZ MARG) Traffic Intersection During Year 1999- 2000
Period
Year 2000 Year 1999 Year 1998
TPAH (SPM)
TPAH (RSPM)
TPAH (SPM)
TPAH (RSPM)
TPAH (SPM)
TPAH (RSPM)
JAN 38.2 25.3 28.7 26.4 56.9 -
FEB 68.6 51.4 26.4 15.5 44.2 -
MAR 51.4 29.9 26.9 18.8 22.2 -
APR 24.5 10.4 25.7 21.0 29.1 -
MAY 18.5 16.9 17.6 9.9 21.3 17.2
JUN 18.7 11.7 23.5 7.4 14.0 9.0
JUL 45.3 12.4 32.0 10.5 16.1 12.0
AUG 24.0 6.8 19.1 13.6 14.5 6.8
SEP 14.9 8.5 47.6 16.4 15.6 13.5
OCT 54.1 24.5 73.0 67.0 20.5 13.0
NOV 81.2 50.8 73.0 59.0 25.6 20.5
DEC 32.2 14.4 118.0 77.0 27.5 20.4
AVERAGE 39.3 21.9 43 28.5 26 14.0
MINIMUM 14.9 6.8 17.6 7.4 14.0 6.8
MAXIMUM 81.2 51.4 118.0 77.0 56.9 20.5
MONSOON 28 9 33 14 15 11
WINTER 55 33 64 49.0 35 18.0
SUMMER 28 17 23 14 22 13
30
Figure -7 : Total PAHs Concentration at AMSII, I.T.O. ( B.S.Z. Marg) Delhi During 1998-2000.
0.0
20.0
40.0
60.0
80.0
100.0
120.0
JAN
FEB
MAR
APR
MAY
JUN
JUL
AUG
SEP
OCT
NOV
DEC
AVE
RAGE
MAXIM
UM
MONSO
ON
SUMM
ER
Co
nc
. in
ng
m /
m 3
TPAH(SPM) 2000 TPAH(RSPM) 2000 TPAH(SPM) 1999
TPAH(RSPM) 1999 TPAH(SPM) 1998 TPAH(RSPM) 1998
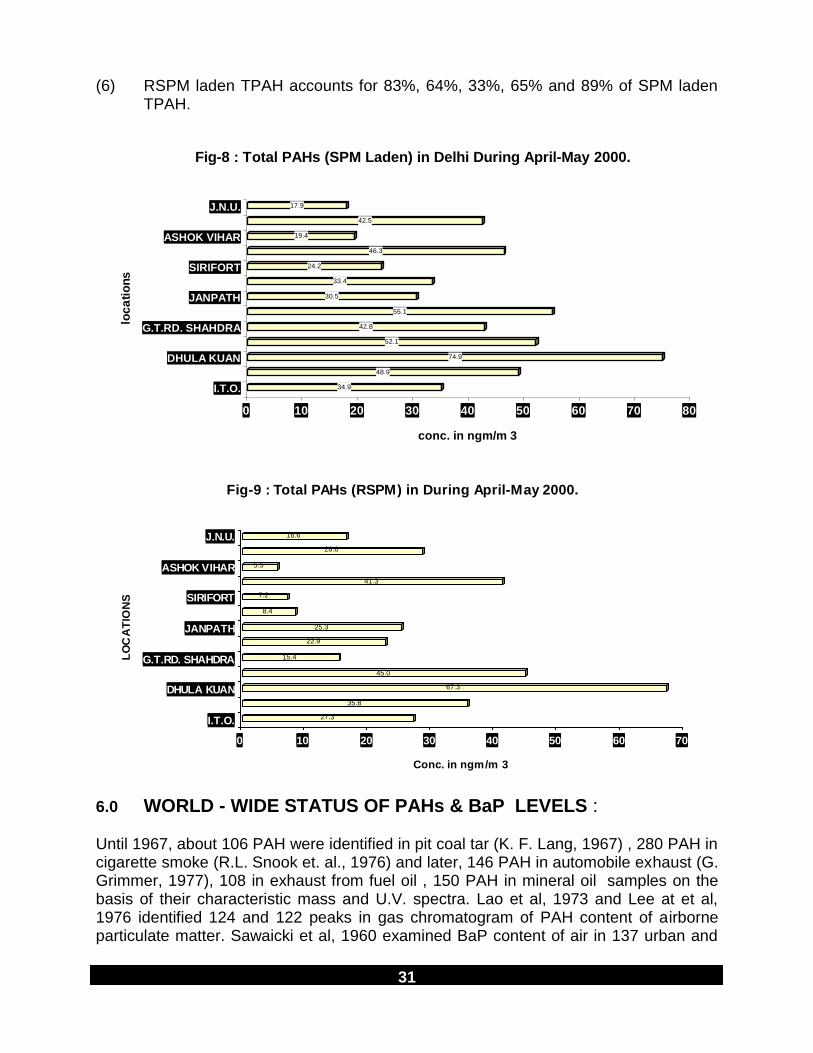
5.3 Polycyclic Aromatic Hydrocarbon at Selected Locations including Traffic
Intersections in Delhi: Polycyclic Aromatic Hydrocarbon (PAH) have been monitored at selected locations in Delhi constituting traffic intersections Madhuban Chowk, Rohini (T), Dhaula Kuan (T), All Indisia Institute of Medical Sciences (T) ITO Intersection (T), petrol pumps (P), residential areas (R) and industrial area (I) namely Ashok Vihar (R), Siri Fort (R), Jawarlal Nehru University (R), Janpath (P), G.T. Road, Shahdara (P), Preet Vihar (P), Malka Ganj (P), Town Hall (C), and Moti Nagar (I). 15 PAH compounds have been monitored namely Naphthalene, Phenanthrene, Anthracene, Fluoranthene, Pyrene, Benzo(a)Anthracene, Chrysene, Benzo(b)fluoranthene, Benzo(k)fluoranthene, Benzo(e)pyrene, Benzo(a) pyrene, Perylene, Indeno(cd)pyrene, Dibenzo(ah)anthracene, ,Benzo(ghi)perylene. SPM and RSPM laden PAH‟s concentration (total PAH) during April – May, 2000 have been shown in Figure-8 and 9. Following observations have been drawn based on these values. (1) Highest TPAH (both SPM and RSPM laden) levels were observed at Dhaula
Kuan, i.e. 75 & 67 ng/m3 respectively. (2) Least SPM laden TPAH levels was observed at JNU, i.e. 18.0 ng /m3 .. (3) Least RSPM laden TPAH levels was observed at Ashok Vihar, i.e. 6 ng /m3s (4) Average SPM laden TPAHs level for traffic intersections, petrol pumps,
residential, commercial & industrial locations have been calculated 53, 28, 30, 43 and 46 nag/m3 respectively.
(5) Average RSPM laden TPAHs level for traffic intersections, petrol pumps, residential, commercial & industrial locations have been calculated 44, 18, 10, 28 and 41 nag/m3 respectively.
31
(6) RSPM laden TPAH accounts for 83%, 64%, 33%, 65% and 89% of SPM laden TPAH.
34.9
48.9
74.9
52.1
42.8
55.1
30.5
33.4
24.2
46.3
19.4
42.5
17.9
0 10 20 30 40 50 60 70 80
conc. in ngm/m 3
I.T.O.
DHULA KUAN
G.T.RD. SHAHDRA
JANPATH
SIRIFORT
ASHOK VIHAR
J.N.U.
loc
ati
on
s
Fig-8 : Total PAHs (SPM Laden) in Delhi During April-May 2000.
27.3
35.8
67.3
45.0
15.4
22.9
25.3
8.4
7.2
41.3
5.5
28.6
16.6
0 10 20 30 40 50 60 70
Conc. in ngm/m 3
I.T.O.
DHULA KUAN
G.T.RD. SHAHDRA
JANPATH
SIRIFORT
ASHOK VIHAR
J.N.U.
LO
CA
TIO
NS
Fig-9 : Total PAHs (RSPM) in During April-May 2000.
6.0 WORLD - WIDE STATUS OF PAHs & BaP LEVELS : Until 1967, about 106 PAH were identified in pit coal tar (K. F. Lang, 1967) , 280 PAH in cigarette smoke (R.L. Snook et. al., 1976) and later, 146 PAH in automobile exhaust (G. Grimmer, 1977), 108 in exhaust from fuel oil , 150 PAH in mineral oil samples on the basis of their characteristic mass and U.V. spectra. Lao et al, 1973 and Lee at et al, 1976 identified 124 and 122 peaks in gas chromatogram of PAH content of airborne particulate matter. Sawaicki et al, 1960 examined BaP content of air in 137 urban and
32
non urban areas of the U.S. in large cities, the highest levels of BaP occurred during summer. Concentration of BaP in the air of non urban areas ranged from 0.01 to 1.9 ng/m3, while concentration in Urban areas ranged from 0.1 to 61.0 ng/m3.Gorden et.al.,1976, reported the annual geometric mean concentration of 15 PAH in air samples collected from 13 areas in Los Angeles, to be 10 g ng/m3, BaP accounted for only 4.2% of the total PAH. In USA in the 1970s the annual figure of BaP in urban areas without coke-oven was less than 1 ng/m3, In several European cities in the 1960s the annual average concentration of BaP was higher than 100 ng/m3. However the concentration of BaP in large cities of UK such as London have fallen to only few percent of former value over past 30 years as a result of controls on smoke emission and the virtual disappearance of the open coal fire for domestic heating purposes. Kuniko,1988, measured the BaP and PAH in air borne particulates near a high way in Tokyo, Japan during Dec. 22-21, 1984 within 60m radium from a crossing point of two
high ways. The SPM concentration was 15 to 396 g/m3. The concentration of BaP and B(ghi)P were 3.46-15.0g and 3.83-15.21 ng/m3. The BaP concentration in precipitated dust was 149-130 ng/g. Takada et al, 1991, have identified 63 PAH in street
dust in Tokyo, Japan. The sum of these PAH was in the range of 3.20 g/g (residential street to 8.16 µg/g Heavily trafficked street). Table – 21 PAH Concentrations in Urban Air Since the Mid-1970s (Selected Cities
in the World)
A. Molecular Weight B. Human Carcinogenicity according to IARC. Group 2A: Possibly carcinogenic Group 3 : not classifiable C. Yearly geometic mean of quarterly geometric means for all areas. D. Mean value in Summer (left column) and Winter. E. Minimum – Maximum value f seven Season means.. Range of means at five sites. G. Median value in summer (left column) and winter. H. Annual average I. Mean. J. CHR reported but should include TR (GC peaks can not be resolved).K. Isomer not specified L. Minimum – Maximum value of two years seasonal means combined at five sites (Min. during Monsoon and Max. during Winter season)
City Country
Number of samples
samples Period
LossAngles^CUSA78
Feb.-Jan.1974-75
NewJersey^DUSA
350
1981-1983
La Plata^EArgentina4
Jun.-Jan.1984-1986
Calcutta^FIndia100
Jan.-Feb.1984
Osaka^GJapan23
Nov.-Nov.1977-1978
Wien^DAustria
50
Aug.-Aug.1982-1983
Berlin^Hgermany
500
Feb.-Jan.1882-1983
Athens^IGreece302
1984-1985
Stocholm^DSweden541980-1983
ZegrabYugoslavia891977-1983
Delhi ^LIndia
250Mar.-Feb.1989-1991
PAHNAME
MW^A IARC^ BCLASS
PHEN 178 3 0.2-2.4 11-21 110/129 112/197 1.1/2.5
ANTH 178 3 0.02-0.5 2.5-5.5 110/129 23/47 0.3/0.2 8.8-22.5
FLU 202 3 03 11-26 37/36 52/94 30 1.5 1.3/5.9 34 11.7- 24.1
PYR 202 3 05 0.2/2.2 0.3/4.9 20-44 25/30 55/95 33 SeeBaA 1.3/7.7 11.3-33.5
BaFL 216 3 1.8-6.3 6.0/7.8
BghiF 226 3 0.2/1.2 8.1/17 1.3/5.3
CPP 226 3 0.04/0.5 33/19 1.0/1.9
BaA 228 2A 0.2 0.1/1.0 0.3/1.6 20-66 8.6/15 5.1/16 27 0.9/2.7 13 9.4-31.0
CHR 228 3 0.6 0.4/2.8 0.1/1.4 22-60 8.7/22 4.4^J 1.8/3.7^K 13.3-25.2^K
TRI 228 3 22-60 SeeCHR SeeCHR SeeCHR
BjFA 252 2B 0.2 0.1/0.9 22-60 10/30 SeeBkFA SeeBkF A
BbFA 252 2B 0.5 0.2/1.2 109-200 6.4-14^K 13 4.2 14 14.6-29.9^K
BkFA 252 2B 0.2 0.1/0.6 3.9 3.3/5.0 8 SeeBkFA
BeP 252 3 0.9 0.1/3.4 48-182 4.6/13 2.6/4.2 14.5-30.9
BaP 252 2A 0.5 0.2/1.0 0.1-2.3 30-120 5.7/12 3.9/15 8.3 2.9 1.1/1.9 10 12.3-23.1
PERY 252 3 0.1 0.04/0.1 4.45-8.35 1.0/3.8 0.8 0.3/0.3 15.0-26.8
IP 276 2B 1.3 0.4/2.0 0.3 4.5/13 7.5 1.8/3.4 11
BghiP 276 3 3.3 0.4/1.8 0.9 34-141 3.3/7.6 8.5/20 9.3 1.3 4.7/7.7 13.4-32.4
ATR 276 3 0.2 0.1 1.0/4.0 3.1 0.4/0.6
DbacA 278 3 0.04/0.1 0.03-0.3 8.6-41K 0.6/2.2
COR 300 3 2.1 0.3/1.0 0.4 6.3/15 6.8 3.1/5.2
33
(Source: Tyagi, S.K. (1994). Methodological aspects of measuring polycyclic aromatic hydrocarbons (PAHs) in the urban atmosphere, Int. Chem. Environ Res. Vol. 3 & 4 : 165-176)
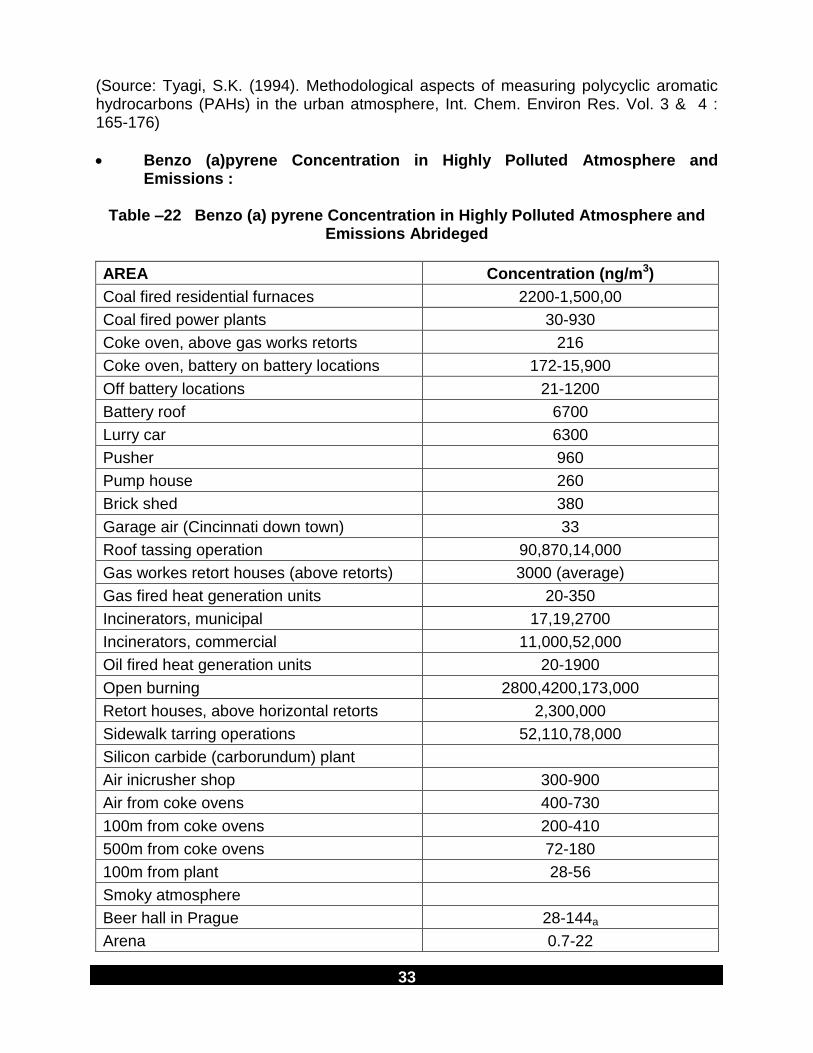
Benzo (a)pyrene Concentration in Highly Polluted Atmosphere and Emissions :
Table –22 Benzo (a) pyrene Concentration in Highly Polluted Atmosphere and
Emissions Abrideged
AREA Concentration (ng/m3)
Coal fired residential furnaces 2200-1,500,00
Coal fired power plants 30-930
Coke oven, above gas works retorts 216
Coke oven, battery on battery locations 172-15,900
Off battery locations 21-1200
Battery roof 6700
Lurry car 6300
Pusher 960
Pump house 260
Brick shed 380
Garage air (Cincinnati down town) 33
Roof tassing operation 90,870,14,000
Gas workes retort houses (above retorts) 3000 (average)
Gas fired heat generation units 20-350
Incinerators, municipal 17,19,2700
Incinerators, commercial 11,000,52,000
Oil fired heat generation units 20-1900
Open burning 2800,4200,173,000
Retort houses, above horizontal retorts 2,300,000
Sidewalk tarring operations 52,110,78,000
Silicon carbide (carborundum) plant
Air inicrusher shop 300-900
Air from coke ovens 400-730
100m from coke ovens 200-410
500m from coke ovens 72-180
100m from plant 28-56
Smoky atmosphere
Beer hall in Prague 28-144a
Arena 0.7-22
34
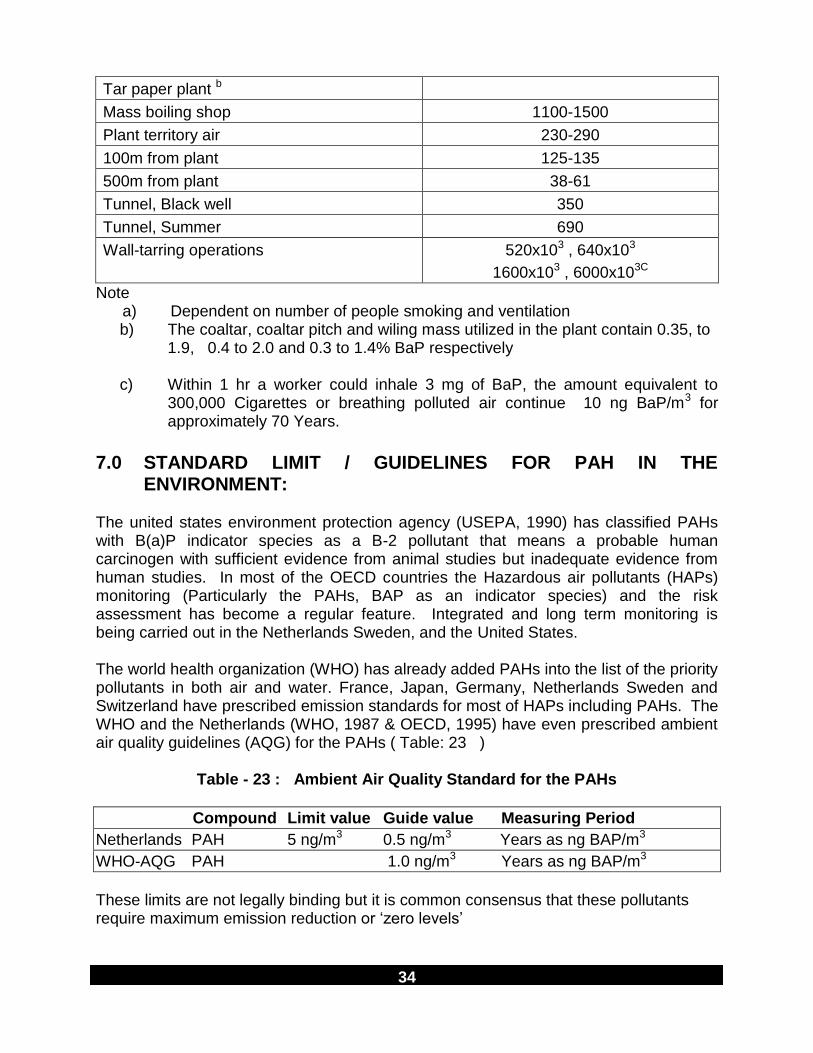
Tar paper plant b
Mass boiling shop 1100-1500
Plant territory air 230-290
100m from plant 125-135
500m from plant 38-61
Tunnel, Black well 350
Tunnel, Summer 690
Wall-tarring operations 520x103 , 640x103
1600x103 , 6000x103C
Note a) Dependent on number of people smoking and ventilation
b) The coaltar, coaltar pitch and wiling mass utilized in the plant contain 0.35, to 1.9, 0.4 to 2.0 and 0.3 to 1.4% BaP respectively
c) Within 1 hr a worker could inhale 3 mg of BaP, the amount equivalent to
300,000 Cigarettes or breathing polluted air continue 10 ng BaP/m3 for approximately 70 Years.
7.0 STANDARD LIMIT / GUIDELINES FOR PAH IN THE
ENVIRONMENT: The united states environment protection agency (USEPA, 1990) has classified PAHs with B(a)P indicator species as a B-2 pollutant that means a probable human carcinogen with sufficient evidence from animal studies but inadequate evidence from human studies. In most of the OECD countries the Hazardous air pollutants (HAPs) monitoring (Particularly the PAHs, BAP as an indicator species) and the risk assessment has become a regular feature. Integrated and long term monitoring is being carried out in the Netherlands Sweden, and the United States. The world health organization (WHO) has already added PAHs into the list of the priority pollutants in both air and water. France, Japan, Germany, Netherlands Sweden and Switzerland have prescribed emission standards for most of HAPs including PAHs. The WHO and the Netherlands (WHO, 1987 & OECD, 1995) have even prescribed ambient air quality guidelines (AQG) for the PAHs ( Table: 23 )
Table - 23 : Ambient Air Quality Standard for the PAHs
Compound Limit value Guide value Measuring Period
Netherlands PAH 5 ng/m3 0.5 ng/m3 Years as ng BAP/m3
WHO-AQG PAH 1.0 ng/m3 Years as ng BAP/m3
These limits are not legally binding but it is common consensus that these pollutants require maximum emission reduction or „zero levels‟
35
Proposed New European Union Ambient Limits for PAH :
Proposed new European Union ambient limits for PAH indicator parameter i.e. Benzo(a)pyrene is 6.0 ng/m3 for meeting on Ist January 2010. European Commission requires action plan to be developed to measure the concentration of Benzo(a)pyrene in ambient air & also to monitor other relevant PAH‟s at limited number of sites. Other PAH compounds should include Benzo(a)pyrene, Benzo(b)flouranthene, Benzo(i)flouranthene, Benzo(k)flouranthene, Indeno(cd) pyrene , Dibenzo(ah)anthracene & Flouranthene. European Commission directive also recommends to set long term objective for containing the levels of these parameters. According WHO (1987) , no safe level can be recommended for BaP due to its carcinogenicity. Complete removal of PAH from the environment is impossible, they can only be controlled. Therefore standard have to be set up. The primary basis for setting up such standards is the does-effect relationship, this can be fully demonstrated in PAH carcinogenesis and the result is extrapolated to man. On the basis of such evaluation, the USSR Ministry of Health set up the maximum allowable concentration (MAC) for BaP and it is recommended by FAO/WHO “ joint Expert Committee”. The MAC for Bap in the atmospheric air is proposal is 15 µg/100m3 for air of industrial working zones and 0.1 µg/100m3 in the atmospheric air. MAC for other PAHs are still to be set up. WHO guidelines for drinking water (1984) have given PAH standard for water. In water of acceptable purity, the concentration of six representative PAH viz Fluoranthene, Benzo (b)fluoranthene, Benzo(k)fluoranthene. Benzo (a)pyrene, Benzo (ghi) perylene and Indeno (1,2,3 cd) pyrene should not collectively exceed 0,2 µg/lit this limit for Bap is 0.01 µg/lit as reported by Harrision et al. In the new European drinking water guideline (98/83/EC) also special attention is given to Benzo(a) pyrene by setting a threshold limit of 10 ng/l for this single compound. Owing to its carcinogenicity no safe level of PAHs can be recommended. There is no known cancer threshold for B(a)P the most thoroughly studied PAH. (WHO, 1987). However The USEPA has offered an upper bound lifetime cancer risk estimate of 62 per 100000 exposed people per µg benzene soluble coke-oven emission per m3 ambient air. They are public health concern because they are spread over large urban population. The guidelines values for B(a)P corresponding to an excess lifetime cancer risk of 10-5 was estimated as 0.7mg/litre in Guideline for drinking water quality (WHO, 1998).
8.0 PROPOSED AMBIENT LIMITS FOR PAH IN INDIA : An expert working group was constituted to propose Ambient Air Quality Standards for Benzene and BaP for 2005, 2010. The meeting of the expert working group on ambient air quality standards (Benzene and BaP ) was held on March 27, 2002 at CPCB, Parivesh Bhawan, Delhi-32. Detailed deliberations were made by the experts on existing levels as monitored in ambient air in India, prominent source of these pollutant, international standards / guidelines. Finally following recommendations were made
36
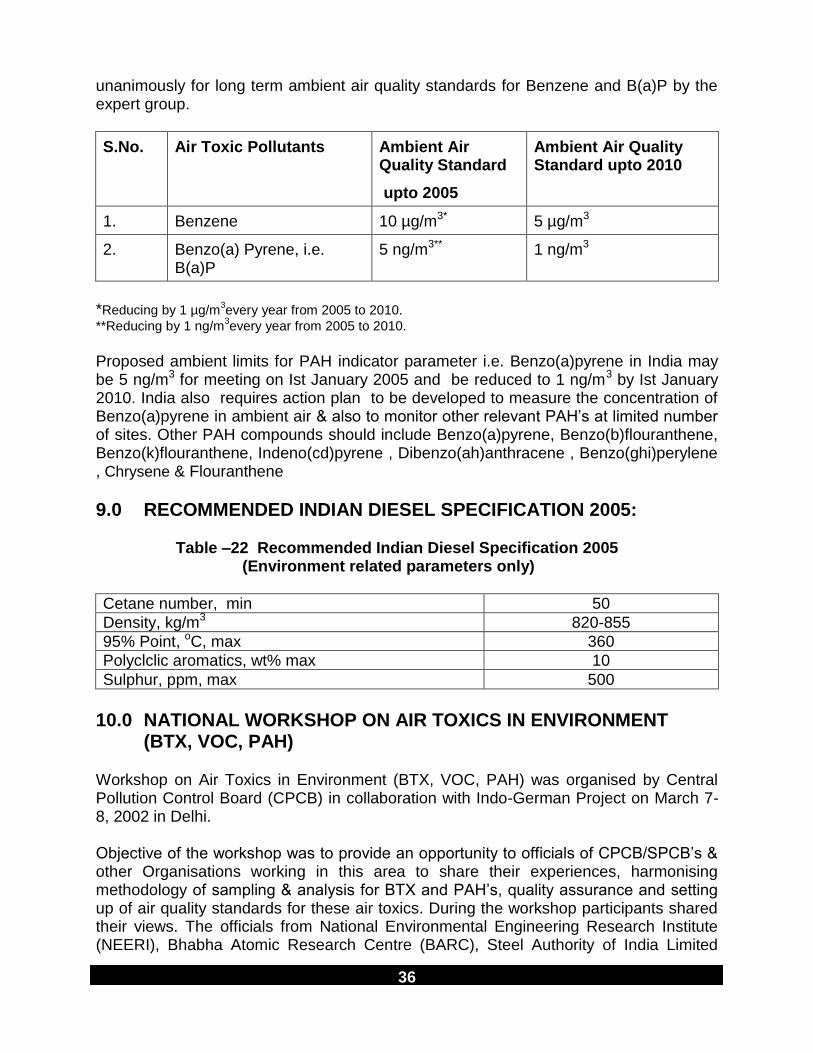
unanimously for long term ambient air quality standards for Benzene and B(a)P by the expert group.
S.No. Air Toxic Pollutants Ambient Air Quality Standard
upto 2005
Ambient Air Quality Standard upto 2010
1. Benzene 10 µg/m3* 5 µg/m3
2. Benzo(a) Pyrene, i.e. B(a)P
5 ng/m3** 1 ng/m3
*Reducing by 1 µg/m
3every year from 2005 to 2010.
**Reducing by 1 ng/m3every year from 2005 to 2010.
Proposed ambient limits for PAH indicator parameter i.e. Benzo(a)pyrene in India may be 5 ng/m3 for meeting on Ist January 2005 and be reduced to 1 ng/m3 by Ist January 2010. India also requires action plan to be developed to measure the concentration of Benzo(a)pyrene in ambient air & also to monitor other relevant PAH‟s at limited number of sites. Other PAH compounds should include Benzo(a)pyrene, Benzo(b)flouranthene, Benzo(k)flouranthene, Indeno(cd)pyrene , Dibenzo(ah)anthracene , Benzo(ghi)perylene , Chrysene & Flouranthene 9.0 RECOMMENDED INDIAN DIESEL SPECIFICATION 2005: Table –22 Recommended Indian Diesel Specification 2005 (Environment related parameters only)
Cetane number, min 50
Density, kg/m3 820-855
95% Point, oC, max 360
Polyclclic aromatics, wt% max 10
Sulphur, ppm, max 500
10.0 NATIONAL WORKSHOP ON AIR TOXICS IN ENVIRONMENT (BTX, VOC, PAH) Workshop on Air Toxics in Environment (BTX, VOC, PAH) was organised by Central Pollution Control Board (CPCB) in collaboration with Indo-German Project on March 7-8, 2002 in Delhi. Objective of the workshop was to provide an opportunity to officials of CPCB/SPCB‟s & other Organisations working in this area to share their experiences, harmonising methodology of sampling & analysis for BTX and PAH‟s, quality assurance and setting up of air quality standards for these air toxics. During the workshop participants shared their views. The officials from National Environmental Engineering Research Institute (NEERI), Bhabha Atomic Research Centre (BARC), Steel Authority of India Limited
37
(SAIL)- Research & Development, Centre for Occupational & Environmental Health, Lok Nayak Jaiprakash Hospital (LNJP) , Patel Chest Institute, Indian Toxicological Research Centre (ITRC), Tata Energy Research Institute(TERI), National Thermal Power Corporation (NTPC), Jawaharlal Nehru University (JNU), Hindustan Organic Chemicals Limited (HOCL), Indo-German Project, State Pollution Control Boards (SPCBs) and Central Pollution Control Board participated in the workshop and numbers of papers on above themes were presented. From the discussion held during presentations the following issues emerged:
Identification of Air Toxics to be monitored (BTX, VOC, PAH, Dioxin & Furans).
Selection of methods for monitoring.
Sampling (strategy and techniques)
Analysis (Processing and Measurement).
Preparation of manual for sampling and analysis.
Standardisation / Validation of selected method involving various labs/ organisations.
Sampling programme : Frequency, Location and Duration of sampling /monitoring.
Quality Assurance/ Quality Control Programme
With in lab/ Internal
Between Labs / External
Data management
Strengthening of SPCB‟s/ PCC‟s laboratories.
Instrumentation and infrastructure facilities
Training
Ambient Air quality standards (Present 2005, 2010)
Short term (24 hrly)
Long term (annual mean, running annual mean)
Methodology for preparation of inventory of air toxics.
Prevention and control option of air toxics
The issues were deliberated by a panel group comprising rexperts from CPCB, Indo-German Project, SES-JNU, LNJP, BARC, NEERI, SAIL- R&D, HOCL.
Three inter - organisational working group of experts have been constituted to work on different aspects as listed above to formulate the various guidelines .

38
Workshop Photographs:
39
11.0 REFERENCES 1. Anon (1999), Diesel emission and lung cancer. Epidemiology and Quantitative Risk Assessment, Health Effect Institute, Massa chusetts, 10pp.
2. Carter Brandon and Kristen Hemrnann (1995), The cost of inaction , valuing
the economy wide cost of environmental degradation in India. Asia Environment Division, World Bank, Washington, DC, October 17 Mimeo.
3. Dipple A.C. and Bigger C.A.H. (1991). Mechanism of action of food associated
PAHs. Ind. Chemical Carcinogens, 182 : 41-163.
4. Gorden R.J. (1976), Distribution of airborn PAHs throughout Los Angeles, Environ. Sci. Technol. 10 : 371.
5. Hariss M. (1988). Role of the 4-5 s-binding protein in the induction of aryl
hydrocarbon hydrozylase in the rat. Carcinogenesis. 9 : 1475-1479.
6. Herlan A., (1977), Hyg. Abt 1 Orig. Reihe B : 165- 174.
7. Kaden D.A. (1979). Mutagenecity of soot and associated PAH to Salmonella typhimurium cancer Res. 39 : 4152-4159.
8. Kuniko Sugo, (1988), PAH in vicinity of a highway Tokyo to Kanyo. Kanyo
Kenyku Kenkyusho Nenpo 61-64 (Jpn.)
9. Lang K. F. and Eigen I. (1967). Fortschr Chem. Forsch, B: 91.
10. Lao, R.C., Thomas., Oja H. and Dubois L., (1973). Application of GC-MS data processer combination to the analysis of PAH in airborn pollutants. J. Anal. Chem., 45 : 908.
11. Lee M.L. Novotny M., and Bartle, K.D., (1976). GC/MS and NMR determination
of PAH in airborn particulates, J. Anal. Chem. 48 : 1976.
12. Sawicki E., Elbert W.C., Hauser T.R., Fox F.T., and Stanley T. W. (1960), Bap content of the air of Am. Communities. Am. Ind. Hyg. Assoc., 21 : 443.
13. Snook L. R., Severson R. F. Higman H.C., Arrendale, R.F. and Chortyk O. t. ,
(1976). PAHs of tobacco smoke : Isolation and identification, Beitr. Tabakforsch, 8 : 250.
14. Takada H., Onda T., Harada M. and Ogura, (1991), Distribution and sources of
PAHs in street dust from the Tokyo metropoliton area. The Sci. Total Environ. 107 : 45-69.
40
15. Tyagi, S.K. (1993). Studies on air borne PAHs in Delhi. Ph.D. Thesis, Meerut University , Meerut , India.
16. Tyagi, S.K. (1994). Methodological aspects of measuring Polycyclic
hydrocarbons (PAHs) in the urban atmosphere, Int. Chem. Environ Res. Vol. 3 & 4 : 165-176.
17. U.S. National Academy of Science (NAS), (1972). Committee on Biological Effect
of Atmospheric Pollutant : Particulate POM, Washington D.C. National Research Council, NAS Press, Washington, USA.
18. USEPA, (1982), Review of natural ambient air quality standards for particular
matter, Report No. PA-450/582-001.
19. WHO (1987), Air Quality Guidelines for Europe, Regional Office for Europe, Copenhagen, Denmark.
20. Wornat M.J. (1990). The relationship between mutagenicity and chemical
composition of PAHs from coal pyrolysis. Envir. Health Perspect. 84 : 193- 201
21. Harrison, R.M., Smith, D.T.J., Luhana, L., 1996. Source apportionment of
atmospheric polycyclic aromatic hydrocarbons collected from an urban location in Birmingham, UK. Environmental Science and Technology 30, 825-832.
22. Khalili, N.R., Scheff, P.A., Holsen, T.M., 1995. PAH source fingerprints for coke
ovens, diesel and gasoline engines, highway tunnels and wood combustion emission. Atmospheric Environment 29, 533-542.
23. Li, C.K., Kamens, R.M., 1993. The use of polycyclic aromatic hydrocarbons as
source signatures in receptor modelling. Atmospheric Environment 27A, 523-529 24. Raiyani, C.V., Shah, S.H., Desai, N.M., Venkaiah, K., Patel, J.S., Parikh, D.J.
Kashyap, S.K. 1993a. Characterzation and problems of indoor pollution due to cooking stove smoke. Atmospheric Environment 27A, 1643-1655.
25. Parmod Kulkarni, Chandra Venkataraman. Atmospheric polycyclic aromatic
hydrocarbons in Mumbai, India. Atmospheric Environment 34 (2000), 2785- 2790.
26. Joop H. van Wijnen, et.al. Exposure to Polycyclic Aromatic Hydrocarbons
among Dutch Childern. Environmental Health Perspectives, volume 104, Number 5, May 1996, 530-534.
27. Grimmer G., (1997), Analysis of automobile Condensates In: Air Pollution and
cancer in man. U Mohr., D. Schmahl and L. Jomalis (Editors).
41
28. Bridbord, K., J.F. Finklea, J.K. Wagoner, J.B. Morgan and P. Caplan. 1976. Human exposure to polycyclic aromatic hydrocarbons. In carcinogeneses of comprehensive surgery; Vol. 1 - polynuclear aromatic hydrocarbons: Chemistry, metabolism and carcinogeneses. Ed R.I. Freudenthal and P.W. Jones. Raven Press, New York. Pp 319-324.
29. Baker j.E. and Eisenreich S.J., (1990), Environ. Sci. Technol. 24, 342.
30. Lamb S.I., Petrowski C. , Kaplan I.R., and Simoneit, BRT (1980) . Organic Compounds in urban atmosphere. J. Air Pollut Control Assoc, 30, 1098.
31. Kuniko Sugo, (19880, Pah in vicinity of a highway Tokyo to Kanyo. Kanyo
Kenyku Kenkyusho Nenpo 61-64 (Jpn.). 32. Hoff R.M. and Chan K.W. , (1987), Environ. Sci. Technol. 21, 556. 33. Takada H. Onda T. Harada M. and Ogura, (1991), Distribution and sources of
PAHs in street dust from the Tokyo metropolitan area. The Sci. Total Environ. 107, 45-69.
34. Mc Veety B.D. , and Hites R.A., (1998), Atmos. Environ.,22, 511. 35. Nielson T. , (1985), Environ. Sci. Technol. 18, 157. 36. Atkinson, R., Arey J., Zielinska, B., Winer A. M. and Pitts J. N. Jr. (1987) . In :
Short-Term Bioassays in the Analysis of complex Environmental Mixtures, V, Shahbeg S., Sandhu S. et. al. (Eds), Plenum Poblishing Corp. 1.
37. Lang K. F. and Eigen I. (1967), Fortschr chem.. Forsch, B, 91. 38. Snook l. R. , Severson R. F. Higman H.C., Arrendale, R.F. and Chortyk O.T.
(1976), PAHs of Tabacoo smoke : Isolation and identification , Beitr. Tabakforsch, 8, 250.
39. Lao, R.C. ,Thomas R.S. , Oja H. and Dubois L., (1973), Application of GC-MS
data processe combination to the analysis of PAH in airborn pollutants. J. Anal. Chemistry, 45, 908.
40. Lee. M.L. Novotny M. , and Bartle, K.D., (1976), GC-MS and NMR determination
of PAH in airborne particulates, J. Anal. Chem. 48, 1976.
41. Sawicki E., Elbert W.C., Hauser T.R., Fox F.T., and Stanely T. W. (1960), BaP content of the air of Am. Communities. Am. Ind. Hyg. Assoc., 21, 443.
42 Gorden R.J. (1976), Distribution of airborne PAHs throughout Los Angeles,
Environ. Sci. Technol. 10 : 371. 43. USEPA (1984) final Report Entitled “ Carcinogen assessment of coke oven
emissions ” EPA-600/6-82-003F.