10 Stock market Indices
14
Stock market indices
-
Upload
sonali-subhadarshini -
Category
Data & Analytics
-
view
117 -
download
0
Transcript of 10 Stock market Indices
Stock market indices
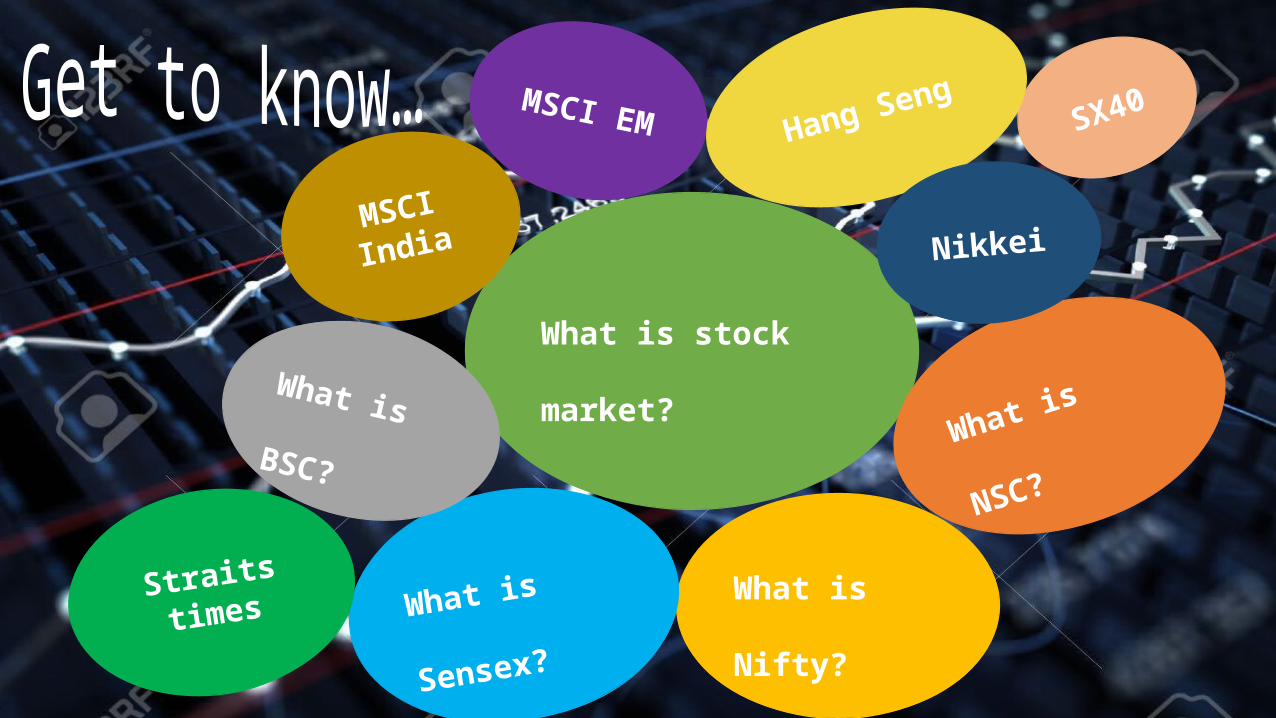
What is stock market?
What is Nifty?What is Sensex?
What is NSC?What is BSC?
MSCI India
MSCI EM SX40Hang Seng
Nikkei
Straits times
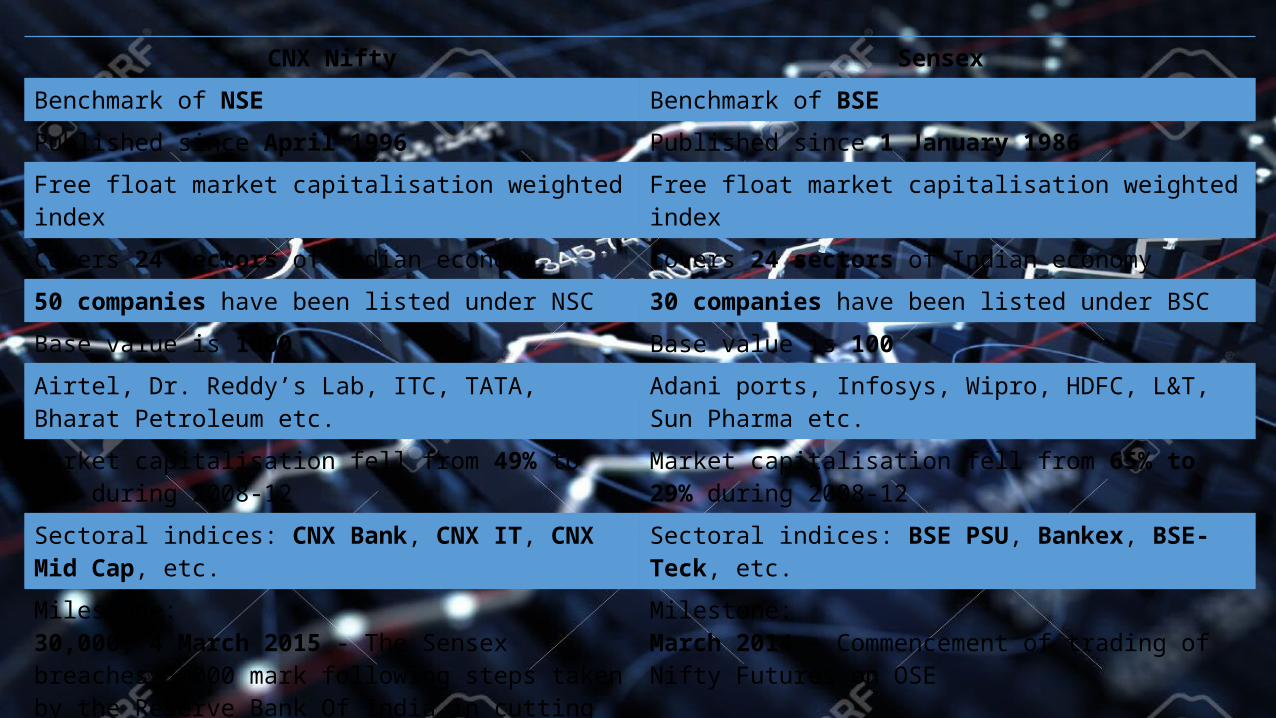
CNX Nifty Sensex
Benchmark of NSE Benchmark of BSE
Published since April 1996 Published since 1 January 1986
Free float market capitalisation weighted index Free float market capitalisation weighted index
Covers 24 sectors of Indian economy Covers 24 sectors of Indian economy
50 companies have been listed under NSC 30 companies have been listed under BSC
Base value is 1000 Base value is 100
Airtel, Dr. Reddy’s Lab, ITC, TATA, Bharat Petroleum etc. Adani ports, Infosys, Wipro, HDFC, L&T, Sun Pharma etc.
Market capitalisation fell from 49% to 25% during 2008-12 Market capitalisation fell from 65% to 29% during 2008-12
Sectoral indices: CNX Bank, CNX IT, CNX Mid Cap, etc. Sectoral indices: BSE PSU, Bankex, BSE-Teck, etc.
Milestone:30,000, 4 March 2015 - The Sensex breaches 30000 mark following steps taken by the Reserve Bank Of India in cutting the repo rates
Milestone: March 2014 - Commencement of trading of Nifty Futures on OSE
Major fall: 24 Aug 2015 - 490.95 Points (meltdown in Chinese stock market)16 Aug 2013 - 234.45 Points (because of Rupee depreciation)
Major fall: 11 February 2016 - 807.07 points24 August 2015 - 1,624.51 points6 January 2015 - 854.86 points
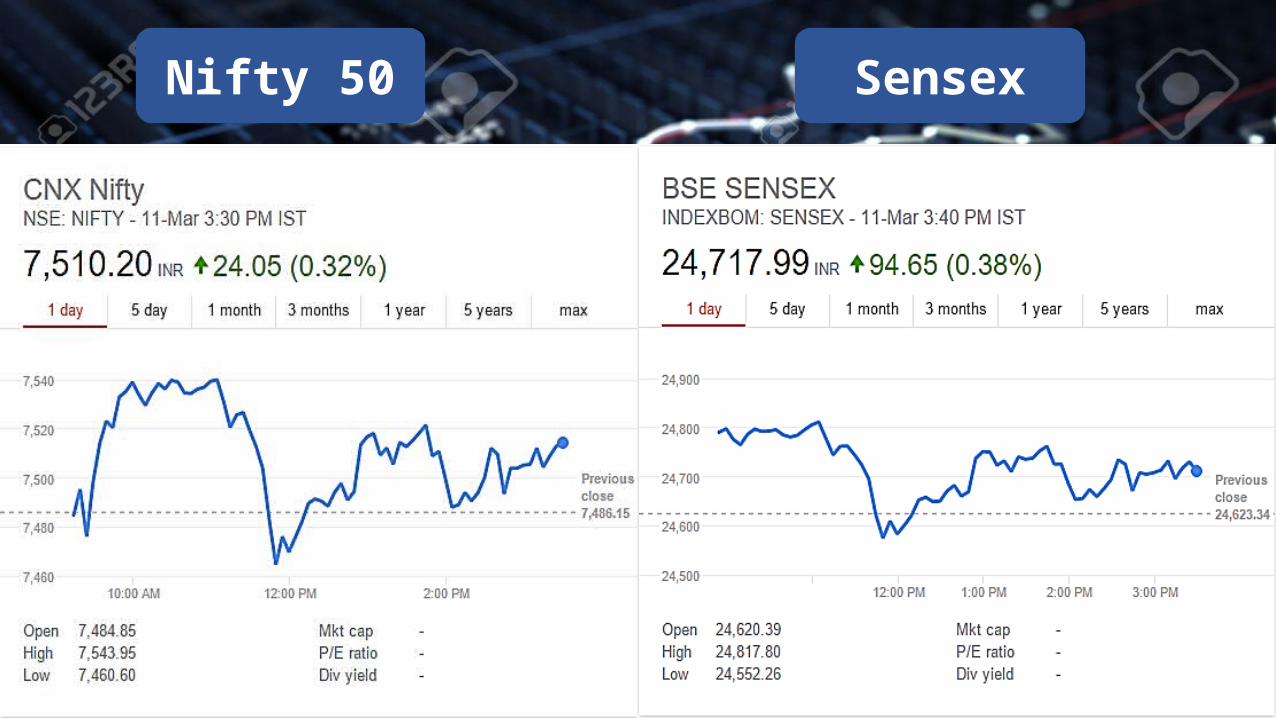
Nifty 50 Sensex
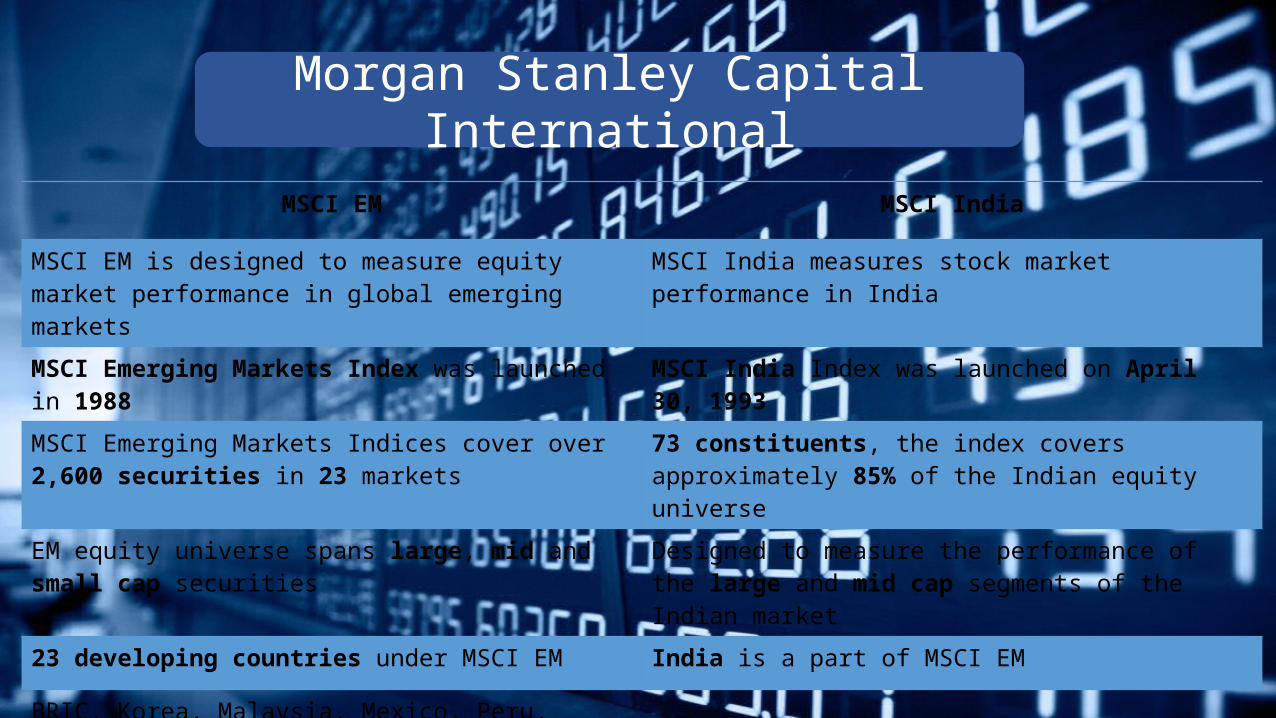
MSCI EM MSCI India
MSCI EM is designed to measure equity market performance in global emerging markets
MSCI India measures stock market performance in India
MSCI Emerging Markets Index was launched in 1988 MSCI India Index was launched on April 30, 1993
MSCI Emerging Markets Indices cover over 2,600 securities in 23 markets
73 constituents, the index covers approximately 85% of the Indian equity universe
EM equity universe spans large, mid and small cap securities Designed to measure the performance of the large and mid cap segments of the Indian market
23 developing countries under MSCI EM India is a part of MSCI EM
BRIC, Korea, Malaysia, Mexico, Peru, Philippines, etc.
Morgan Stanley Capital International
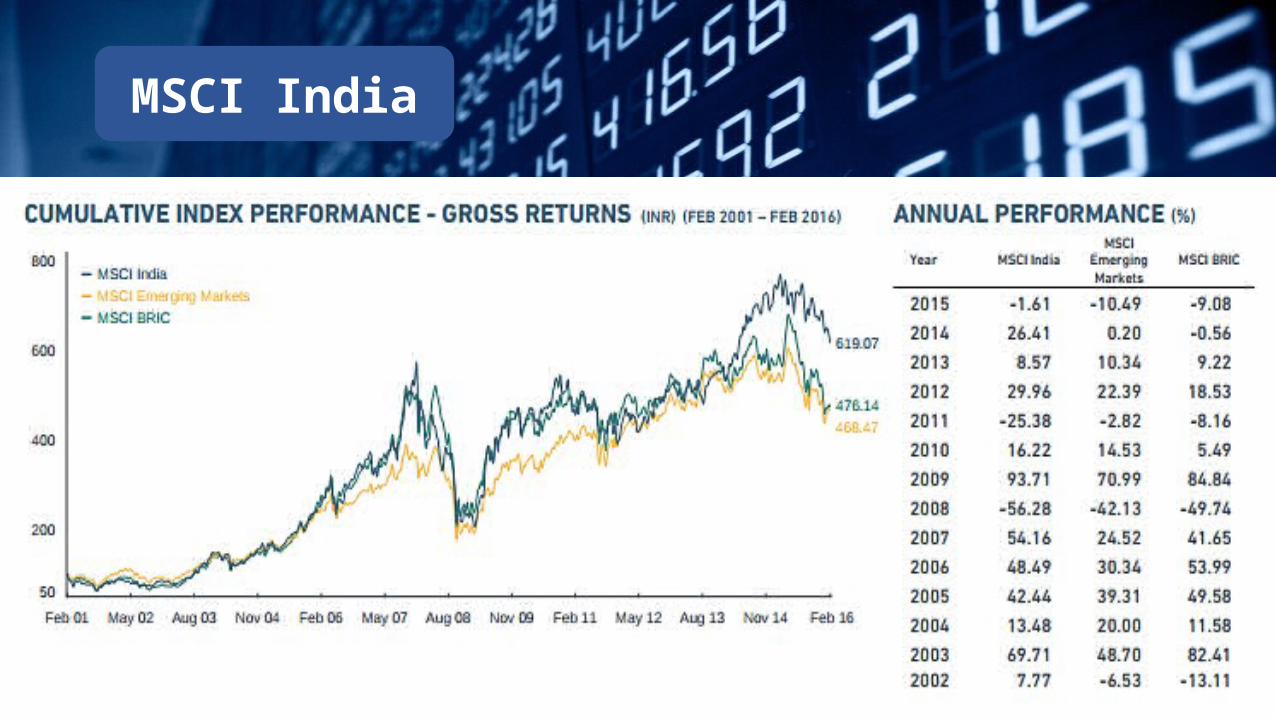
MSCI India
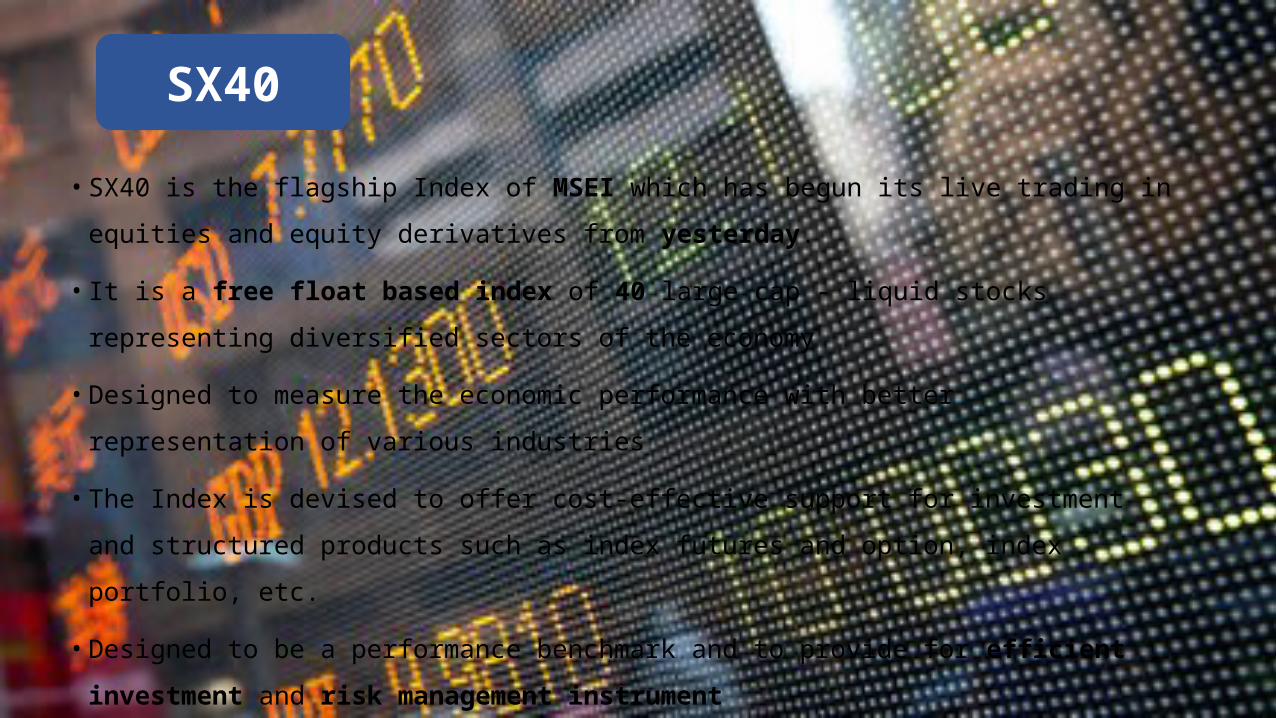
• SX40 is the flagship Index of MSEI which has begun its live trading in equities and equity
derivatives from yesterday.
• It is a free float based index of 40 large cap - liquid stocks representing diversified sectors of
the economy
• Designed to measure the economic performance with better representation of various
industries
• The Index is devised to offer cost-effective support for investment and structured products
such as index futures and option, index portfolio, etc.
• Designed to be a performance benchmark and to provide for efficient investment and risk
management instrument
SX40
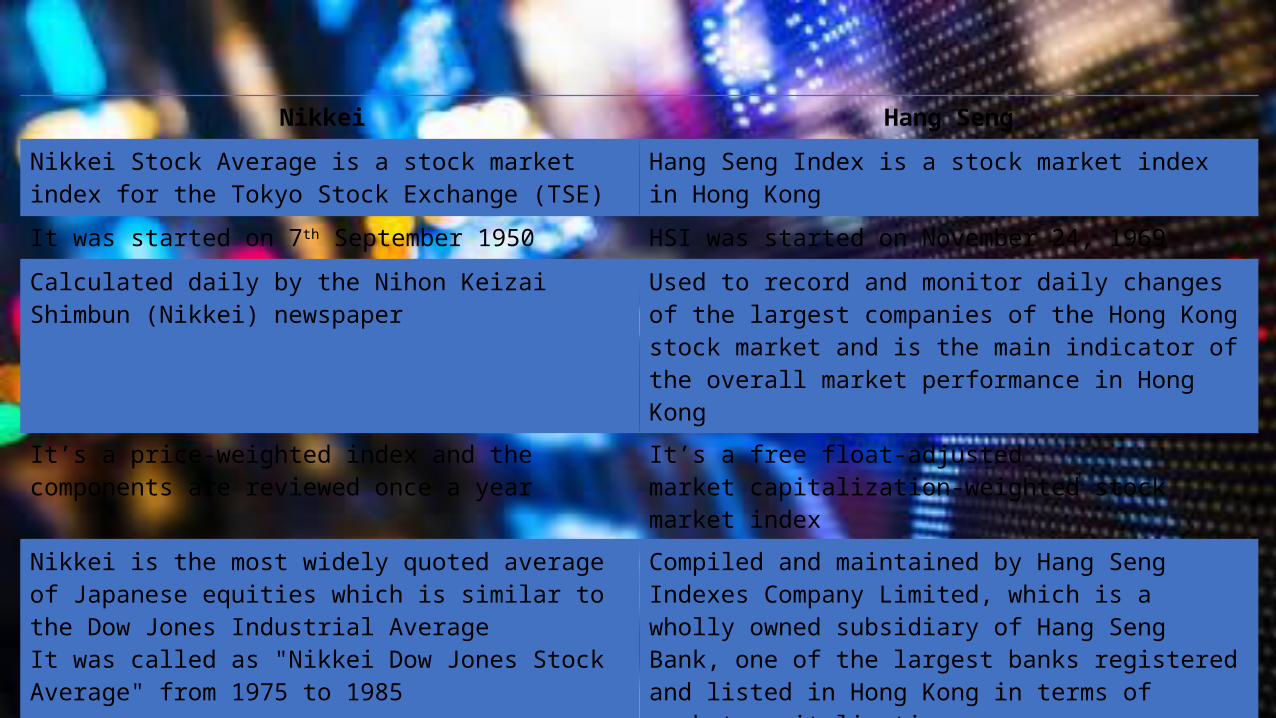
Nikkei Hang Seng
Nikkei Stock Average is a stock market index for the Tokyo Stock Exchange (TSE)
Hang Seng Index is a stock market index in Hong Kong
It was started on 7th September 1950 HSI was started on November 24, 1969
Calculated daily by the Nihon Keizai Shimbun (Nikkei) newspaper
Used to record and monitor daily changes of the largest companies of the Hong Kong stock market and is the main indicator of the overall market performance in Hong Kong
It’s a price-weighted index and the components are reviewed once a year
It’s a free float-adjusted market capitalization-weighted stock market index
Nikkei is the most widely quoted average of Japanese equities which is similar to the Dow Jones Industrial AverageIt was called as "Nikkei Dow Jones Stock Average" from 1975 to 1985
Compiled and maintained by Hang Seng Indexes Company Limited, which is a wholly owned subsidiary of Hang Seng Bank, one of the largest banks registered and listed in Hong Kong in terms of market capitalisation
The Nikkei 225 is comprised of 225 stocks There are 50 HSI constituent stocks in total
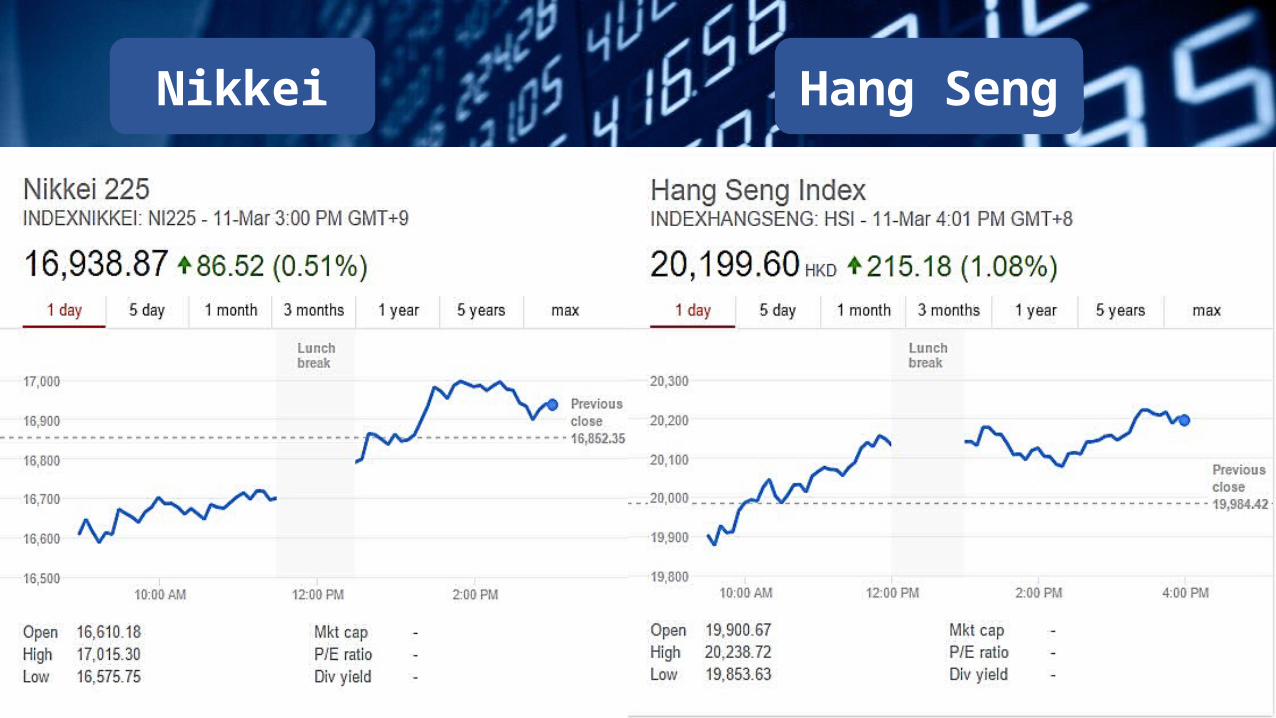
Nikkei Hang Seng
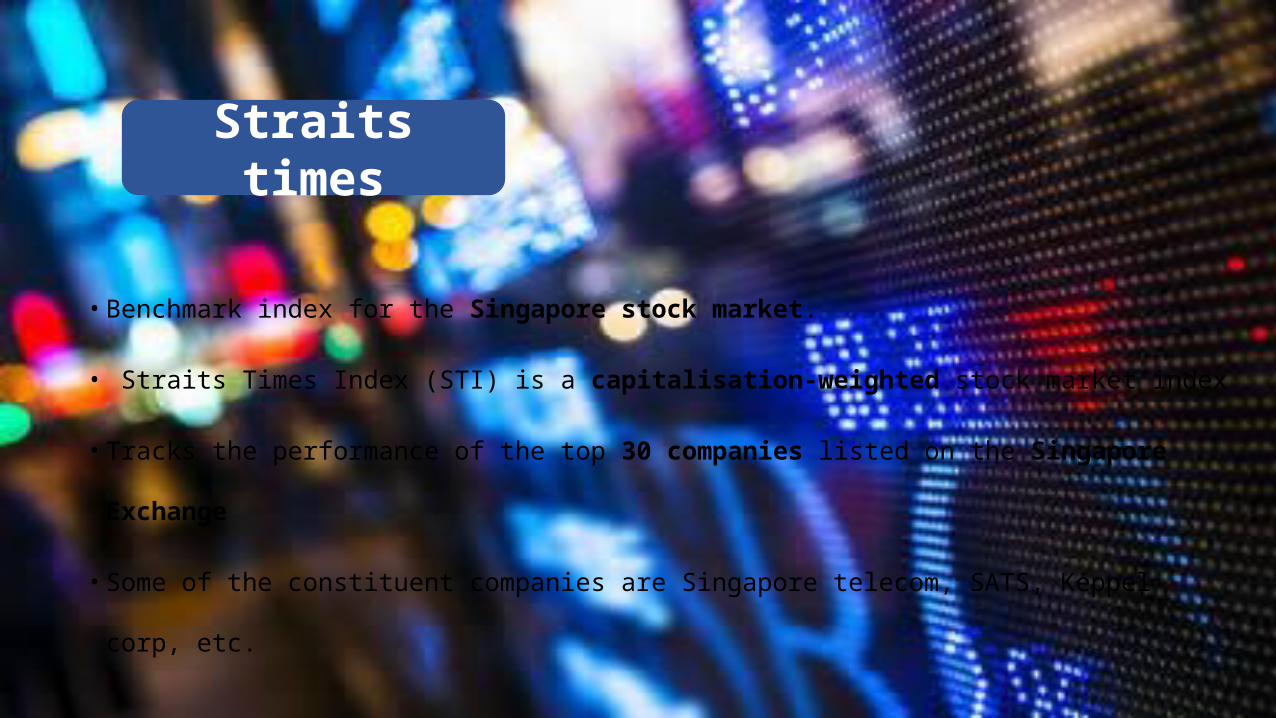
• Benchmark index for the Singapore stock market.
• Straits Times Index (STI) is a capitalisation-weighted stock market index
• Tracks the performance of the top 30 companies listed on the Singapore Exchange
• Some of the constituent companies are Singapore telecom, SATS, Keppel corp, etc.
Straits times
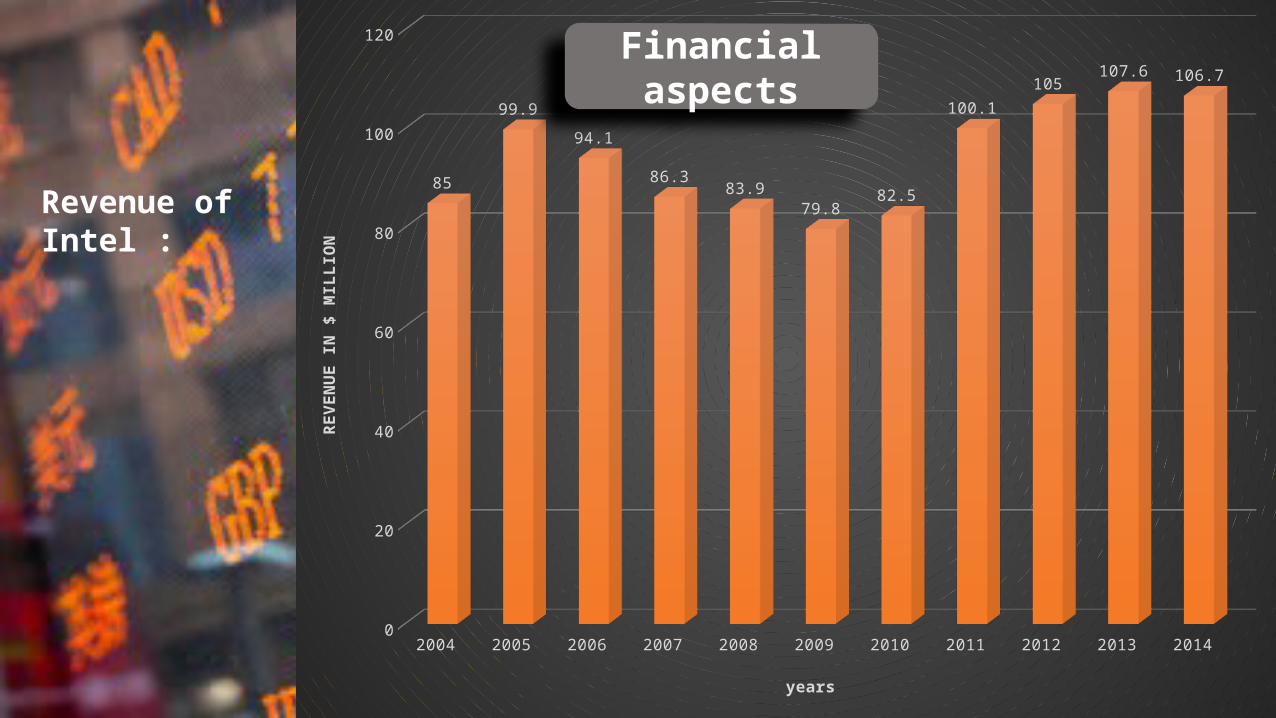
2004 2005 2006 2007 2008 2009 2010 2011 2012 2013 20140
20
40
60
80
100
120
85
99.9
94.1
86.383.9
79.882.5
100.1105
107.6 106.7
years
REVE
NUE
IN $
MIL
LIO
N
Revenue of Intel :
Financial aspects
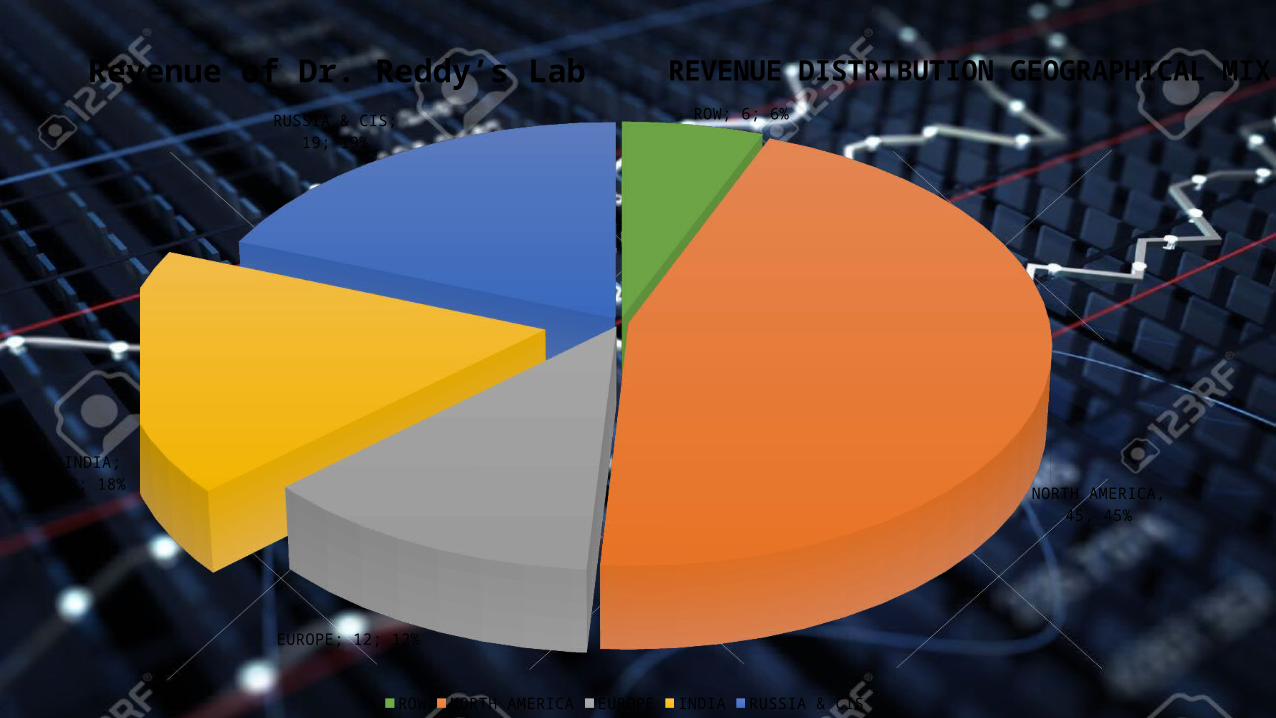
ROW; 6; 6%
NORTH AMERICA, 45, 45%
EUROPE; 12; 12%
INDIA; 18; 18%
RUSSIA & CIS; 19; 19%
REVENUE DISTRIBUTION GEOGRAPHICAL MIX
ROW NORTH AMERICA EUROPE INDIA RUSSIA & CIS
Revenue of Dr. Reddy’s Lab
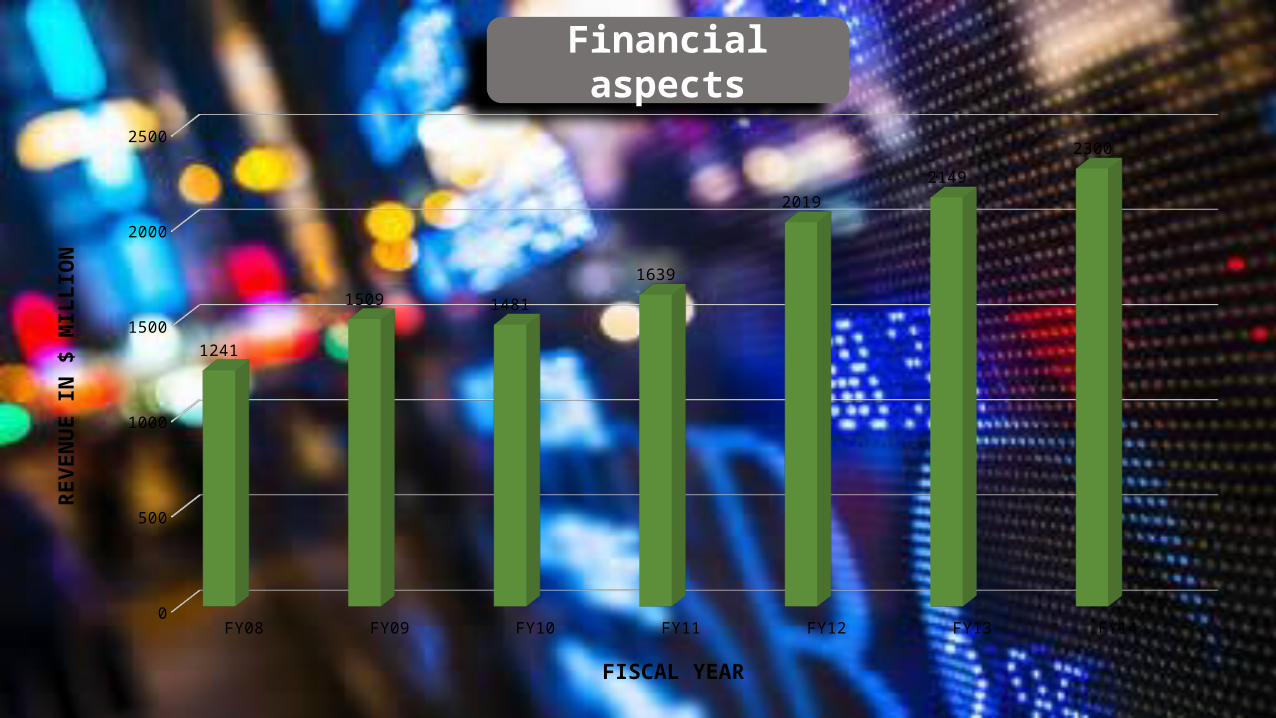
Financial aspects
FY08 FY09 FY10 FY11 FY12 FY13 FY140
500
1000
1500
2000
2500
1241
1509 1481
1639
2019
2149
2300
FISCAL YEAR
REVE
NU
E IN
$ M
ILLI
ON

Thank You
Stock market is a device for transferring money from the impatient to the patient…