10 - SMALL CATCHMENT HYDRODYNAMIC MODELLING:...
10
- 101 - 10 - SMALL CATCHMENT HYDRODYNAMIC MODELLING: COMPARING THREE MODELLING APPROACHES Ahmed Nasr 1 and Paul Hynds 1 1 School of Civil and Structural Engineering, Dublin Institute of Technology, Bolton St, Dublin, Ireland Abstract Many parts of Ireland have recently experienced the wettest winter on record, bringing the issues of flooding, flood prediction, and flood management into sharp focus. Widespread flooding, occurring at the small catchment scale, has been associated with serious economic and human health implications. Moreover, hydrometric monitoring in Ireland and further afield is increasingly focused on larger catchments and river basins, resulting in decreasing data availability and modelling capabilities with respect to smaller (and often flashier) catchments. Accordingly, the current study sought to quantify the key water balance components and overall hydrodynamic behaviours in a number of hydrologically diverse small (<30km 2 ) catchments via the use of three conceptual approaches, namely the Hydrologiska Byrans Vattenavdelning (HBV), Nedbor-Afstromnings (NAM) and updated Soil Moisture Accounting And Routing (SMART) models. Rainfall and evaporation data represented the primary model inputs, with river flow data used to calibrate and validate the models. Data records ranged from 19 to 39 years. Model performance was assessed and compared using the Nash-Sutcliff criterion (Reff) and Coefficient of Determination (R 2 ). The SMART model outperformed the HBV and NAM models in all four study catchments, with Reff values ranging from 0.58 - 0.84 in calibrated models, and from 0.50 - 0.76 in validated models; lowest model efficiencies were associated with the urban Frankfort catchment for all three modelling approaches (Reff 0.54 - 0.58). Model results indicate that adjacent catchments may contribute to overland flow within small urban catchments during low-frequency, high intensity rainfall events, thus highlighting a modelling limitation. Overall, model efficiencies were adjudged to be moderate; while low (baseflow) and moderate flows were accurately simulated, the magnitude of high flows and flood events were systematically underestimated. It is considered that the structure of many existing hydrological models may not be suitable for small catchment modelling due to their conception, development and frequent use within larger catchments. Typically, model efficiency was seen to increase in concurrence with increasing catchment size, even at the small (<30km 2 ) scale. Accordingly, caution is advised when selecting and interpreting small catchment hydrological models, particularly with respect to modelling high flows and/or flood forecasting. It is recommended that a range of models be tested in order that the most suitable model for individual small catchments be identified and optimised for future use. 1. INTRODUCTION Improving our understanding of the hydrodynamics of small Irish river catchments is of paramount importance in addressing a range of water resources management challenges including municipal and commercial water supply, flood risk management, and water quality. Small catchments are frequently characterised by proportionately high levels of (geological and hydrological) heterogeneity, thus flow pathways may be sensitive to prevailing local climactic conditions and primary physical catchment characteristics. Typically, the hydrological catchment pathways are delineated into surface flow (runoff) and sub-surface flow, with subsurface flow comprising lateral soil water flow (interflow) and groundwater flow (baseflow). In the case of Irish catchments underlain by consolidated bedrock aquifers, the groundwater flow component has been further subdivided into three distinct components, namely shallow groundwater flow, discrete fault (conduit) flow and deep groundwater flow (RPS, 2008). A framework for catchment hydrodynamic analyses in Irish catchments has been developed (Jennings et al., 2007; Archbold et al., 2010), and comprises five primary pathways for transport of
Transcript of 10 - SMALL CATCHMENT HYDRODYNAMIC MODELLING:...
- 101 -
10 - SMALL CATCHMENT HYDRODYNAMIC MODELLING:
COMPARING THREE MODELLING APPROACHES Ahmed Nasr1 and Paul Hynds1
1 School of Civil and Structural Engineering, Dublin Institute of Technology, Bolton St, Dublin,
Ireland
Abstract
Many parts of Ireland have recently experienced the wettest winter on record, bringing the issues of flooding, flood prediction, and flood management into sharp focus. Widespread flooding, occurring at the small catchment scale, has been associated with serious economic and human health implications. Moreover, hydrometric monitoring in Ireland and further afield is increasingly focused on larger catchments and river basins, resulting in decreasing data availability and modelling capabilities with respect to smaller (and often flashier) catchments. Accordingly, the current study sought to quantify the key water balance components and overall hydrodynamic behaviours in a number of hydrologically diverse small (<30km2) catchments via the use of three conceptual approaches, namely the Hydrologiska Byrans Vattenavdelning (HBV), Nedbor-Afstromnings (NAM) and updated Soil Moisture Accounting And Routing (SMART) models. Rainfall and evaporation data represented the primary model inputs, with river flow data used to calibrate and validate the models. Data records ranged from 19 to 39 years. Model performance was assessed and compared using the Nash-Sutcliff criterion (Reff) and Coefficient of Determination (R2). The SMART model outperformed the HBV and NAM models in all four study catchments, with Reff values ranging from 0.58 - 0.84 in calibrated models, and from 0.50 - 0.76 in validated models; lowest model efficiencies were associated with the urban Frankfort catchment for all three modelling approaches (Reff 0.54 - 0.58). Model results indicate that adjacent catchments may contribute to overland flow within small urban catchments during low-frequency, high intensity rainfall events, thus highlighting a modelling limitation. Overall, model efficiencies were adjudged to be moderate; while low (baseflow) and moderate flows were accurately simulated, the magnitude of high flows and flood events were systematically underestimated. It is considered that the structure of many existing hydrological models may not be suitable for small catchment modelling due to their conception, development and frequent use within larger catchments. Typically, model efficiency was seen to increase in concurrence with increasing catchment size, even at the small (<30km2) scale. Accordingly, caution is advised when selecting and interpreting small catchment hydrological models, particularly with respect to modelling high flows and/or flood forecasting. It is recommended that a range of models be tested in order that the most suitable model for individual small catchments be identified and optimised for future use. 1. INTRODUCTION Improving our understanding of the hydrodynamics of small Irish river catchments is of paramount importance in addressing a range of water resources management challenges including municipal and commercial water supply, flood risk management, and water quality. Small catchments are frequently characterised by proportionately high levels of (geological and hydrological) heterogeneity, thus flow pathways may be sensitive to prevailing local climactic conditions and primary physical catchment characteristics. Typically, the hydrological catchment pathways are delineated into surface flow (runoff) and sub-surface flow, with subsurface flow comprising lateral soil water flow (interflow) and groundwater flow (baseflow). In the case of Irish catchments underlain by consolidated bedrock aquifers, the groundwater flow component has been further subdivided into three distinct components, namely shallow groundwater flow, discrete fault (conduit) flow and deep groundwater flow (RPS, 2008). A framework for catchment hydrodynamic analyses in Irish catchments has been developed (Jennings et al., 2007; Archbold et al., 2010), and comprises five primary pathways for transport of
- 102 -
precipitation to surface water: (i) overland flow, (ii) interflow, (iii) shallow groundwater flow, (iv) discrete fault or conduit flow, and (v) deep groundwater flow. Recent studies of the pathways actively contributing to stream flow in an Irish setting have considered four primary contributors: overland flow (runoff), interflow, shallow groundwater flow and deep groundwater flow (Mockler et al., 2013; O’Brien et al., 2013). Under the auspices of this conceptual approach, overland flow and interflow agree with the widely used (international) definitions, whereas shallow groundwater and deep groundwater have been more explicitly defined. The shallow groundwater zone comprises the transmissive upper portion of the fractured-bedrock aquifer, characterised by extensive weathering and an increased frequency and concentration of water bearing fractures. The deep groundwater zone is represented by the less transmissive section of the aquifer, below this upper layer (O’Brien et al., 2013). Quantification of these hydrological pathways in a small catchment is significantly influenced by both the physical catchments characteristics (e.g. aquifer type, land cover, drainage), and spatio-temporal meteorological distributions (rainfall and evapotranspiration) (Peters, 1994). Mathematical modelling techniques attempt to estimate water flux between the four primary catchment pathways (runoff, interflow, shallow groundwater and deep groundwater) at varying temporal scales, typically undertaken via data-driven or numerical modelling approaches to catchment water balance quantification. However, appropriate data are frequently unavailable due to the inherent difficulties associated with flow monitoring within the various catchment pathways, and particularly those in the subsurface. Potentially suitable hydrological models vary considerably with respect to a number of features including conceptual structure, parameter estimation methods, and spatio-temporal model resolution (Nasr & Bruen, 2006). Nasr & Bruen (2006) have previously examined the efficacy of three distinct hydrological models for quantifying diffuse phosphorus pollution in three Irish agricultural catchments. Study findings highlighted the ease with which simple empirical hydrological models can be managed in comparison to conceptual hydrological models. Conversely, empirical models were typically unable to accurately elucidate catchment dynamics. The Hydrologiska Byrans Vattenavdelning Model (HBV) (Steele-Dunne et al., 2008), the Nedbør-Afstrømnings Model (NAM) (DHI, 2009), and the Soil Moisture Accounting and Routing for Transport (SMART) (Mockler et al., 2016) are examples of three conceptual hydrological models which, amongst others, have been previously employed in Irish catchments, albeit more typically in larger (>30 km2) catchments and basins. Accordingly, the current paper seeks to assess the performance of the aforementioned three conceptual models in simulating the hydrological behaviour of four distinct small Irish catchments.
2. STUDY CATCHMENT SELECTION An initial assessment of potentially suitable small catchments for hydrological model assessment was undertaken with two overarching conditions: (1) an available record length >10 years; and (2) catchments were not nested within tidally or anthropogenically influenced large catchments. Additionally, it was considered essential that selected catchments be representative of the complex physical settings (i.e. diverse aquifer type, landuse, and drainage) which influence the hydrodynamic behaviours of small Irish catchments. A significant proportion of surface water catchments are characterised by heterogeneous groundwater flow regimes, thus comprising diverse aquifer (and subsoil) types with respect to both lithology and productivity (RPS, 2008). Accordingly, dominant aquifer type, soil drainage group and landuse/land cover classification were employed as the primary criterion for final study catchment selection. Analysis of collated data led to selection of four small catchments for the current study, namely, Frankfort (Co Dublin), Ballygoly (Co Louth), Rochfort (Co Westmeath), and Ballyhaunis (Co Mayo) catchments, associated with hydrometric Station numbers 06030, 09011, 25034 and 30020, respectively (Figure 1; Table 1). Based upon the developed catchment selection procedure, the four catchments are characterised by a diverse range of aquifer types (PI, LI, and Rkc), CORINE land cover usage categories (231, 112, and 412), and soil drainage groups (Poorly Drained, Well Drained, and Made/Urban Fabric) (Table 1). The Ballygoly and Frankfort catchments have previously been studied in the development of the Flow Duration Model

- 103 -
(Bree et al., 2010). Catchment details pertaining to hydrometric and rain-gauge stations (i.e. primary data sources) are presented in Table 2.
Table 1: Area, dominant aquifer type, soil/subsoil type and land cover/landuse associated with
selected small catchments
Station
Number
Catchment
Name
Area
(km2)
Dominant
Aquifer Type*
Dominant Soil
Drainage
Group
Dominant
Land
Cover/
Landuse**
09011 Frankfort 5.46 PI Made 112
06030 Ballygoly 10.40 PI Poorly Drained 412/231
25034 Rochfort 10.77 LI Well Drained 231
30020 Ballyhaunis 21.41 Rkc Peat/Well Drained
231/412
* PI: Poor Aquifer - Generally Unproductive except for Local Zones; LI: Locally Important Aquifer - Moderately Productive only in Local Zones; Rkc: Regionally important karstified aquifer dominated by conduit flow. ** 231: Pasture; 112: Discontinuous Urban Fabric; 412: Peat Bogs.
Figure 1: Selected study catchment locations shown on the GSI aquifer importance map of the
Republic of Ireland
- 104 -
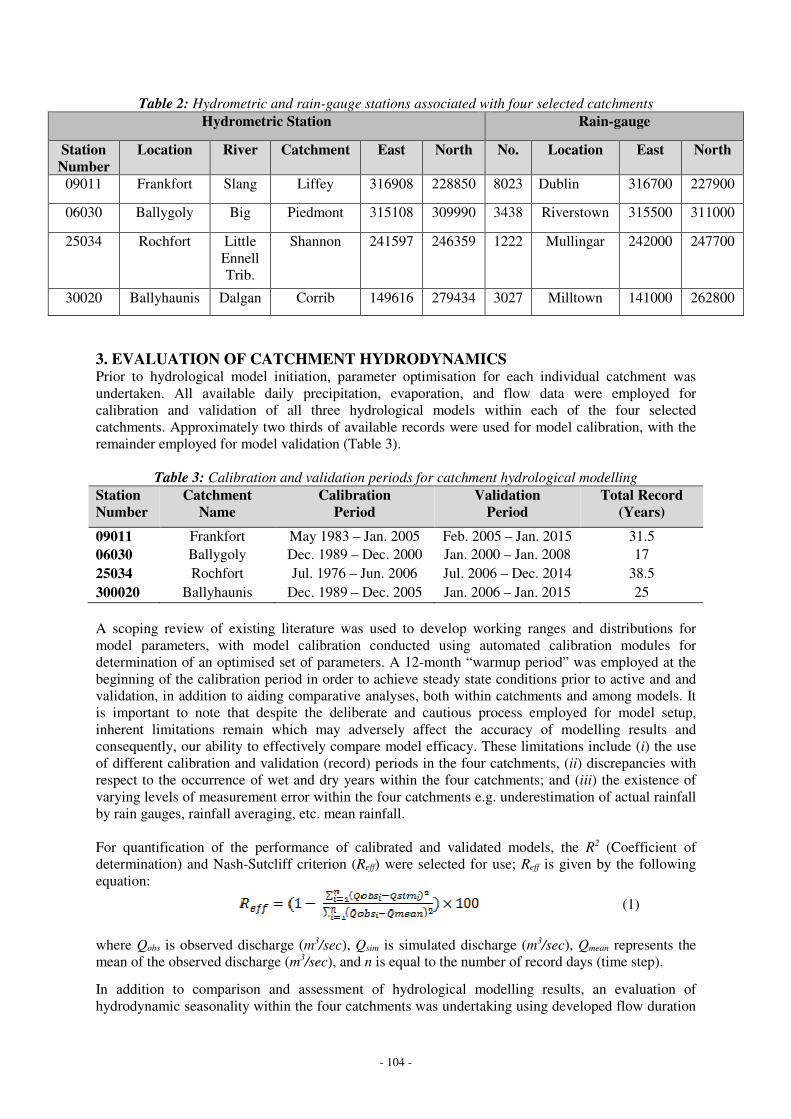
Table 2: Hydrometric and rain-gauge stations associated with four selected catchments
Hydrometric Station Rain-gauge
Station
Number Location River Catchment East North No. Location East North
09011 Frankfort Slang Liffey 316908 228850 8023 Dublin 316700 227900
06030 Ballygoly Big Piedmont 315108 309990 3438 Riverstown 315500 311000
25034 Rochfort Little Ennell Trib.
Shannon 241597 246359 1222 Mullingar 242000 247700
30020 Ballyhaunis Dalgan Corrib 149616 279434 3027 Milltown 141000 262800
3. EVALUATION OF CATCHMENT HYDRODYNAMICS Prior to hydrological model initiation, parameter optimisation for each individual catchment was undertaken. All available daily precipitation, evaporation, and flow data were employed for calibration and validation of all three hydrological models within each of the four selected catchments. Approximately two thirds of available records were used for model calibration, with the remainder employed for model validation (Table 3).
Table 3: Calibration and validation periods for catchment hydrological modelling
Station
Number
Catchment
Name
Calibration
Period
Validation
Period
Total Record
(Years)
09011 Frankfort May 1983 – Jan. 2005 Feb. 2005 – Jan. 2015 31.5 06030 Ballygoly Dec. 1989 – Dec. 2000 Jan. 2000 – Jan. 2008 17 25034 Rochfort Jul. 1976 – Jun. 2006 Jul. 2006 – Dec. 2014 38.5 300020 Ballyhaunis Dec. 1989 – Dec. 2005 Jan. 2006 – Jan. 2015 25 A scoping review of existing literature was used to develop working ranges and distributions for model parameters, with model calibration conducted using automated calibration modules for determination of an optimised set of parameters. A 12-month “warmup period” was employed at the beginning of the calibration period in order to achieve steady state conditions prior to active and and validation, in addition to aiding comparative analyses, both within catchments and among models. It is important to note that despite the deliberate and cautious process employed for model setup, inherent limitations remain which may adversely affect the accuracy of modelling results and consequently, our ability to effectively compare model efficacy. These limitations include (i) the use of different calibration and validation (record) periods in the four catchments, (ii) discrepancies with respect to the occurrence of wet and dry years within the four catchments; and (iii) the existence of varying levels of measurement error within the four catchments e.g. underestimation of actual rainfall by rain gauges, rainfall averaging, etc. mean rainfall. For quantification of the performance of calibrated and validated models, the R2 (Coefficient of determination) and Nash-Sutcliff criterion (Reff) were selected for use; Reff is given by the following equation:
(1)
where Qobs is observed discharge (m3/sec), Qsim is simulated discharge (m3/sec), Qmean represents the mean of the observed discharge (m3/sec), and n is equal to the number of record days (time step).
In addition to comparison and assessment of hydrological modelling results, an evaluation of hydrodynamic seasonality within the four catchments was undertaking using developed flow duration
- 105 -
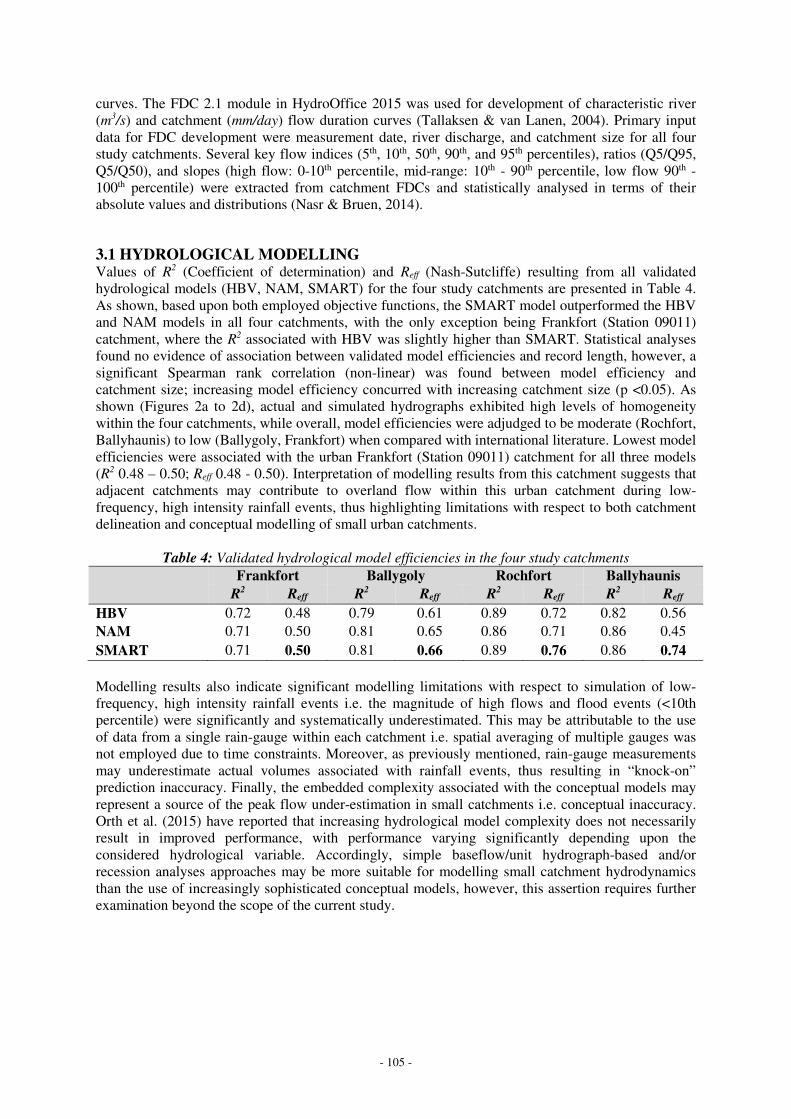
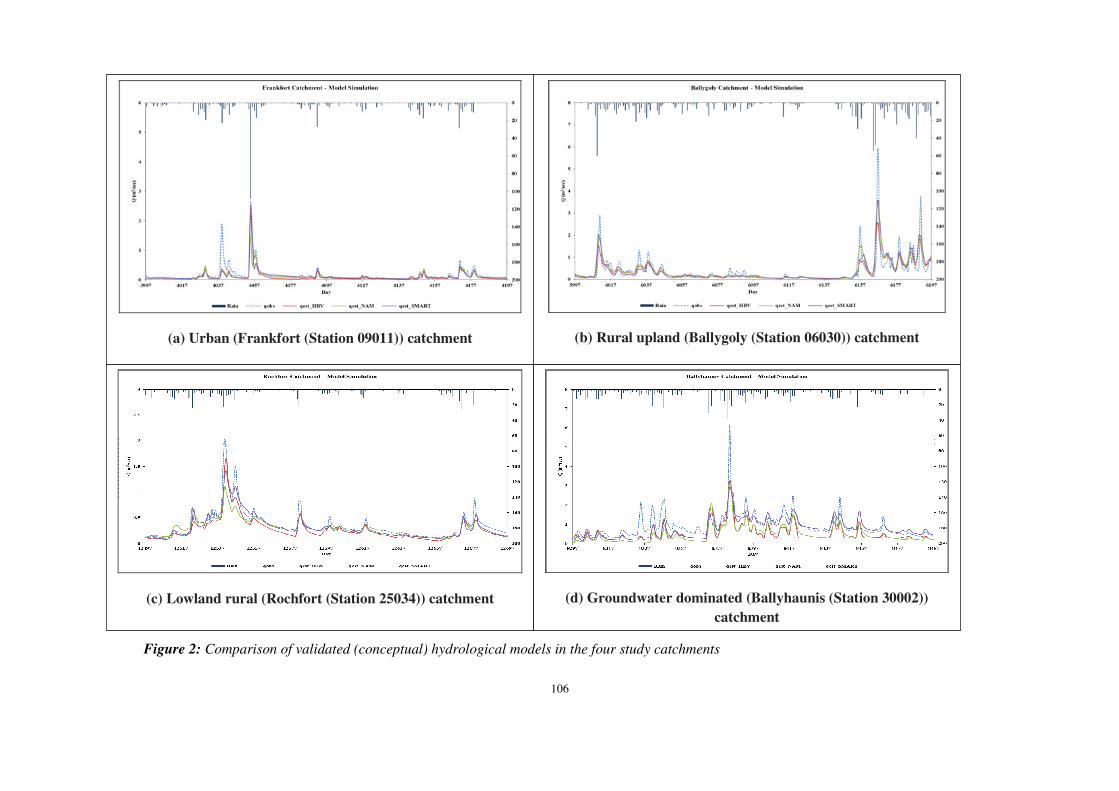
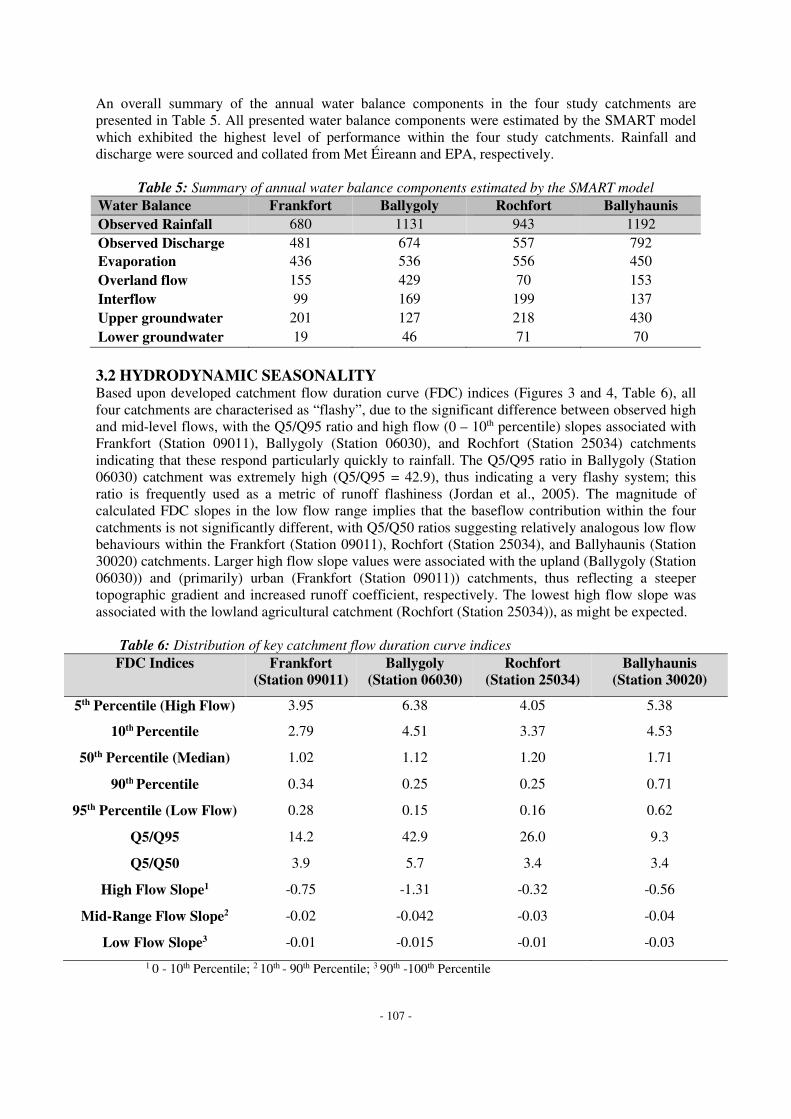
curves. The FDC 2.1 module in HydroOffice 2015 was used for development of characteristic river (m3/s) and catchment (mm/day) flow duration curves (Tallaksen & van Lanen, 2004). Primary input data for FDC development were measurement date, river discharge, and catchment size for all four study catchments. Several key flow indices (5th, 10th, 50th, 90th, and 95th percentiles), ratios (Q5/Q95, Q5/Q50), and slopes (high flow: 0-10th percentile, mid-range: 10th - 90th percentile, low flow 90th - 100th percentile) were extracted from catchment FDCs and statistically analysed in terms of their absolute values and distributions (Nasr & Bruen, 2014). 3.1 HYDROLOGICAL MODELLING Values of R2 (Coefficient of determination) and Reff (Nash-Sutcliffe) resulting from all validated hydrological models (HBV, NAM, SMART) for the four study catchments are presented in Table 4. As shown, based upon both employed objective functions, the SMART model outperformed the HBV and NAM models in all four catchments, with the only exception being Frankfort (Station 09011) catchment, where the R2 associated with HBV was slightly higher than SMART. Statistical analyses found no evidence of association between validated model efficiencies and record length, however, a significant Spearman rank correlation (non-linear) was found between model efficiency and catchment size; increasing model efficiency concurred with increasing catchment size (p <0.05). As shown (Figures 2a to 2d), actual and simulated hydrographs exhibited high levels of homogeneity within the four catchments, while overall, model efficiencies were adjudged to be moderate (Rochfort, Ballyhaunis) to low (Ballygoly, Frankfort) when compared with international literature. Lowest model efficiencies were associated with the urban Frankfort (Station 09011) catchment for all three models (R2 0.48 – 0.50; Reff 0.48 - 0.50). Interpretation of modelling results from this catchment suggests that adjacent catchments may contribute to overland flow within this urban catchment during low-frequency, high intensity rainfall events, thus highlighting limitations with respect to both catchment delineation and conceptual modelling of small urban catchments.
Table 4: Validated hydrological model efficiencies in the four study catchments
Frankfort Ballygoly Rochfort
(Station 25034)
Ballyhaunis
(Station 30020) R2 Reff R2 Reff R2 Reff R2 Reff
HBV 0.72 0.48 0.79 0.61 0.89 0.72 0.82 0.56 NAM 0.71 0.50 0.81 0.65 0.86 0.71 0.86 0.45 SMART 0.71 0.50 0.81 0.66 0.89 0.76 0.86 0.74 Modelling results also indicate significant modelling limitations with respect to simulation of low-frequency, high intensity rainfall events i.e. the magnitude of high flows and flood events (<10th percentile) were significantly and systematically underestimated. This may be attributable to the use of data from a single rain-gauge within each catchment i.e. spatial averaging of multiple gauges was not employed due to time constraints. Moreover, as previously mentioned, rain-gauge measurements may underestimate actual volumes associated with rainfall events, thus resulting in “knock-on” prediction inaccuracy. Finally, the embedded complexity associated with the conceptual models may represent a source of the peak flow under-estimation in small catchments i.e. conceptual inaccuracy. Orth et al. (2015) have reported that increasing hydrological model complexity does not necessarily result in improved performance, with performance varying significantly depending upon the considered hydrological variable. Accordingly, simple baseflow/unit hydrograph-based and/or recession analyses approaches may be more suitable for modelling small catchment hydrodynamics than the use of increasingly sophisticated conceptual models, however, this assertion requires further examination beyond the scope of the current study.
106
Figure 2: Comparison of validated (conceptual) hydrological models in the four study catchments
(a) Urban (Frankfort (Station 09011)) catchment
(d) Groundwater dominated (Ballyhaunis (Station 30002))
catchment
(b) Rural upland (Ballygoly (Station 06030)) catchment
(c) Lowland rural (Rochfort (Station 25034)) catchment
- 107 -
An overall summary of the annual water balance components in the four study catchments are presented in Table 5. All presented water balance components were estimated by the SMART model which exhibited the highest level of performance within the four study catchments. Rainfall and discharge were sourced and collated from Met Éireann and EPA, respectively.
Table 5: Summary of annual water balance components estimated by the SMART model
Water Balance
Components (mm)
Frankfort
(Station 9011)
Ballygoly
(Station 6030)
Rochfort
(Station 25034)
Ballyhaunis
(Station 30020) Observed Rainfall 680 1131 943 1192 Observed Discharge 481 674 557 792 Evaporation 436 536 556 450 Overland flow 155 429 70 153 Interflow 99 169 199 137 Upper groundwater 201 127 218 430 Lower groundwater 19 46 71 70
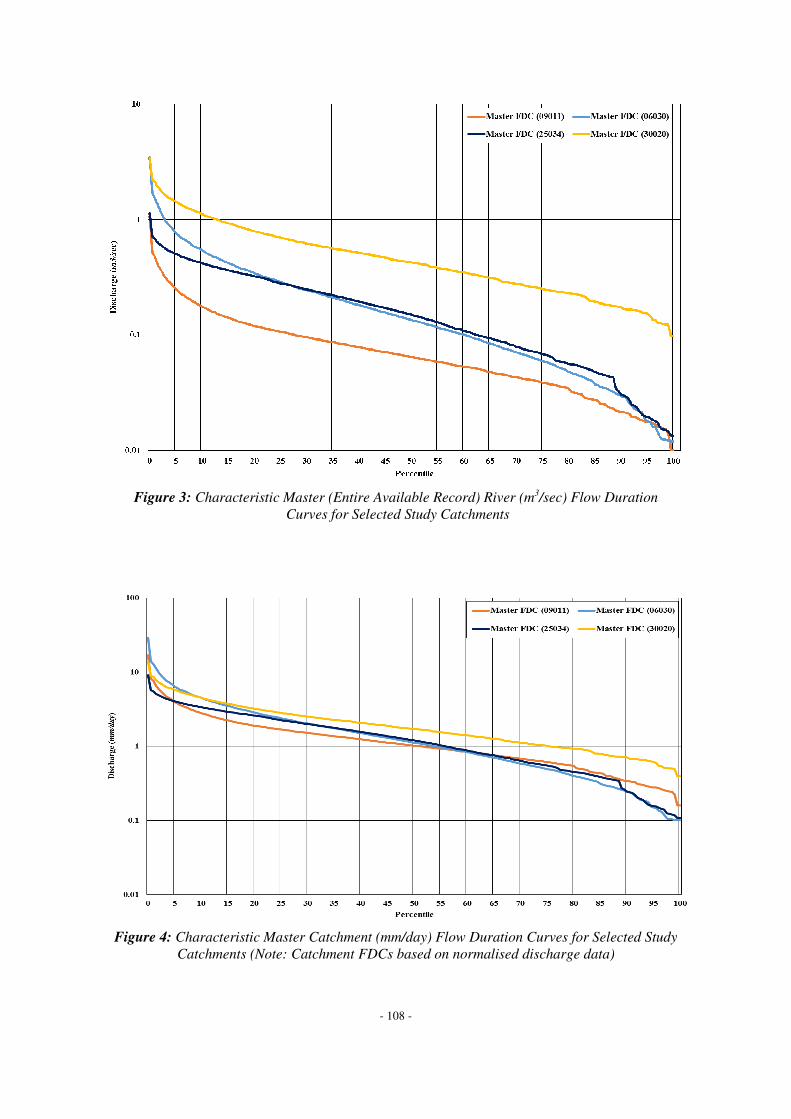
3.2 HYDRODYNAMIC SEASONALITY Based upon developed catchment flow duration curve (FDC) indices (Figures 3 and 4, Table 6), all four catchments are characterised as “flashy”, due to the significant difference between observed high and mid-level flows, with the Q5/Q95 ratio and high flow (0 – 10th percentile) slopes associated with Frankfort (Station 09011), Ballygoly (Station 06030), and Rochfort (Station 25034) catchments indicating that these respond particularly quickly to rainfall. The Q5/Q95 ratio in Ballygoly (Station 06030) catchment was extremely high (Q5/Q95 = 42.9), thus indicating a very flashy system; this ratio is frequently used as a metric of runoff flashiness (Jordan et al., 2005). The magnitude of calculated FDC slopes in the low flow range implies that the baseflow contribution within the four catchments is not significantly different, with Q5/Q50 ratios suggesting relatively analogous low flow behaviours within the Frankfort (Station 09011), Rochfort (Station 25034), and Ballyhaunis (Station 30020) catchments. Larger high flow slope values were associated with the upland (Ballygoly (Station 06030)) and (primarily) urban (Frankfort (Station 09011)) catchments, thus reflecting a steeper topographic gradient and increased runoff coefficient, respectively. The lowest high flow slope was associated with the lowland agricultural catchment (Rochfort (Station 25034)), as might be expected.
Table 6: Distribution of key catchment flow duration curve indices
FDC Indices Frankfort
(Station 09011)
Ballygoly
(Station 06030)
Rochfort
(Station 25034)
Ballyhaunis
(Station 30020)
5th Percentile (High Flow) 3.95 6.38 4.05 5.38
10th Percentile 2.79 4.51 3.37 4.53
50th Percentile (Median) 1.02 1.12 1.20 1.71
90th Percentile 0.34 0.25 0.25 0.71
95th Percentile (Low Flow) 0.28 0.15 0.16 0.62
Q5/Q95 14.2 42.9 26.0 9.3
Q5/Q50 3.9 5.7 3.4 3.4
High Flow Slope1 -0.75 -1.31 -0.32 -0.56
Mid-Range Flow Slope2 -0.02 -0.042 -0.03 -0.04
Low Flow Slope3 -0.01 -0.015 -0.01 -0.03
1 0 - 10th Percentile; 2 10th - 90th Percentile; 3 90th -100th Percentile
- 108 -
Figure 3: Characteristic Master (Entire Available Record) River (m3/sec) Flow Duration
Curves for Selected Study Catchments
Figure 4: Characteristic Master Catchment (mm/day) Flow Duration Curves for Selected Study
Catchments (Note: Catchment FDCs based on normalised discharge data)
- 109 -
4. CONCLUSIONS The main conclusions garnered from conceptual modelling of the four selected small catchments in the current study are;
� Hydrological modelling likely represents the most effective tool for simulating flow pathways in small catchments when necessary data are available;
� As expected, small catchments with poor subsurface drainage characteristics were found to exhibit a flashier response to rainfall events;
� Efficiency of conceptual hydrological models were shown to improve approximately linearly with catchment size, even within the <30km2 range, likely due to increased “buffering” (averaging) of catchment heterogeneity in concurrence with increasing spatial extent;
� High flows were found to be poorly simulated in small catchments by conceptual hydrological models, while low and medium flows were reasonably well simulated;
� The majority of existing hydrological models have been developed and tested to effectively simulate large catchment hydrodynamics, and thus do not perform well in small flashy catchments characterised by unique behaviours;
� Seasonal behaviours of small catchment hydrodynamics may be predicted based upon parallel consideration of validated models and physical catchment characteristics;
� Catchment instrumentation is critical in the medium to long-term for provision of necessary data leading to an increased understanding (and ability to predict and/or manage) of small catchment hydrodynamics in Ireland.
ACKNOWLEDGEMENTS
The authors would like to acknowledge the Environmental Protection Agency for study funding (Analysis and Modelling of the Hydrological Behaviour of Small Irish Catchments) as part of the EPA Research Programme 2014-2020 (2014-W-DS-15).
REFERENCES
• Archbold, M., Bruen, M., Deakin, J., Doody, D., Flynn, R., Kelly-Quinn, M., Misstear, B., Ofterdinger, U., 2010, Contaminant movement and attenuation along pathways from the land surface to aquatic receptors – A Review. Environmental Protection Agency, Johnstown Castle Estate, Co. Wexford, Ireland.
• Bree, T., MacCárthaigh, M., Quinn, R., O’Rourke, F., Fitzpatrick, J. Walsh, R., Mills, P. and Lennon, M., 2010, Estimation of flow for un-gauged catchments. Paper presented to the Institution of Engineers of Ireland.
• DHI, 2009, MIKE 11: A Modelling System for Rivers and Channels - Reference Manual. MIKE By DHI.
• Jennings, S., Elsaesser, B., Baker, G., Bree, T., Daly, D., Fitzpatrick, J., Glasgow, G., Hunter-Williams, T., 2007, An integrated approach to quantifying groundwater and surface water contributions of stream flow. Proceedings of the Irish National Hydrology Conference.
• Mockler, E., O’Loughlin, F., Bruen, M., 2016, Understanding hydrological flow paths in conceptual catchment models using uncertainty and sensitivity analysis. Computer and Geosciences 90B, 66-77.
• Mockler, E., Packham, I., Bruen, M., 2013, Pulling it all together: information from FSU and EPA datasets in parameterising hydrology in the pathways catchment management tool. Proceedings of the Irish National Hydrology Conference, pp. 63-76.
• Nasr, A., Bruen, M., 2014, Statistical analysis of river low flows in support of water resources management planning in the Shannon International River Basin District. Proceedings of the Irish National Hydrology Conference, 2014, pp 78-89.

- 110 -
• Nasr, A., Bruen, M., 2006, Eutrophication from agricultural sources: a comparison of SWAT, HSPF and SHETRAN/GOPC phosphorus models for three Irish catchments. Environmental Protection Agency, Johnstown Castle Estate, Co. Wexford, Ireland.
• O’Brien, R.J., Misstear, B.D., Gill, L.W., Deakin, J.L., Flynn, R., 2013, Developing an integrated hydrograph separation and lumped modelling approach to quantifying hydrological pathways in Irish river catchments. J. of Hydrol. 486, 259-270.
• Orth, R., Staudinger, M., Senevirantne, S.I., Seibert, J., Zappa, M., 2015, Does model performance improve with complexity? A case study with three hydrological models. J. of Hydrol. 523, 147-159.
• Peters, N.E., 1994, Hydrologic studies. In Moldan, B. and Černý, J. (Eds), Biogeochemistry of small catchments: a tool for environmental research. John Wiley & Sons Ltd.
• RPS, 2008, Further Characterisation Study: An integrated approach to quantifying groundwater and surface water contributions of stream flow. Report prepared for Southwestern River Basin District, Ireland.
• Steele-Dunne, S., Lynch, P., McGrath, R., Semmler, T., Wang, S., Hannifin, J., Nolan, P., 2008, The impacts of climate change on hydrology in Ireland. J. of Hydrol. 356, 28-45.
• Tallaksen, L.M., van Lanen, H.A., 2004, Hydrological Drought - Processes and Estimation Methods for Streamflow and Groundwater. Developments in Water Sciences 48, 580p.