10. Optimizing Fertilizer Use within the Context of...
11
10. Optimizing Fertilizer Use within the Context of Integrated Soil Fertility Management in Mozambique Ricardo Maria 1 [email protected], Janete Americano 1 , Jossias Matusso 2 and Cláudio Gundana 3 1 Instituto de Investigação Agrária de Moçambique (IIAM), Av. Das FPLM No. 2698, Caixa Postal 3658, Maputo, Mozambique 2 Agência de Desenvolvimento de Manica (ADEM), Rua 16 de Junho, nr 217, Chimoio, Mozambique 3 Africa Fertilizer Agrobusiness Partnership (AFAP), P.O. Box 1218, Maputo, Mozambique 10.1 Introduction Inadequate soil fertility is an important constraint to crop production in Mozambique. Soil pH is mostly moderate but high sand content and low soil organic matter commonly contribute to low nutrient availability and low available soil water holding capacity. Most crop production is by smallholders who are poor and unable to invest much in the use of inputs. Their severe financial constraint requires that they obtain high rates of return on their small investments and the investment must have a low rate of risk. A farmer typically faces different choices in fertilizer use and needs to choose the crop-nutrient-rate combinations that are expected to be most profitable with a low risk. Such decisions need to be based on solid information derived from field research. The Instituto de Investigação Agrária de Moçambique (IIAM) therefore partnered with national agricultural research organizations of 12 other countries under the AGRA funded project Optimizing Fertilizer Recommendations in Africa (OFRA) with management support from CABI and technical and scientific support from the University of Nebraska-Lincoln. This partnership improved the field research derived information base needed for optimizing fertilizer use, applied the information to develop easy to use decision tools (FOTs) for three broad recommendation domains in Mozambique, and provided training to research and extension personnel for advising farmers on fertilizer use optimization. 10.2 Agricultural systems of Mozambique Agriculture in Mozambique is practised mainly by smallholder farmers with less than 5 hectares of crop production. There are over 3 million smallholder family farms which is 99% of all farms accounting for 95% of the cultivated land. About 25% of 36 million hectares of arable land Fertilizer Use Optimization in Sub-Saharan Africa (2017) Charles S. Wortmann and Keith Sones (eds). Published by CABI. Table 10.1: Characteristics of agro-ecological zones (AEZ) of Mozambique AEZ Location Altitude m Mean rainfall mm Mean temperature o C Dominant soils R1 Maputo, south of Gaza 0-500 <800 >24 Arenosols, Nitisols R2 Coastal region and southern Sabi River valley 0-500 <1000 >24 Arenosols, Fluvisols R3 Central and northern Gaza and east of Inhambane 0-500 <800 >24 Arenosols, Lixisols R4 Central medium altitude areas 200-1000 1000-1200 22-24 Ferralsols, Luvisols R5 Sofala and Zambézia areas 0-500 1000-1400 >24 Arenosols, Fluvisols R6 Zambezi Valley and south of Tete 0-500 400-600 >24 Fluvisols, Lixisols R7 Zambézia, Nampula, Tete, Niassa and Cabo Delgado 0-500 <1200 <24 Lixisols, Leptosols, Arenosols R8 Coastal zone of Zambézia, Niassa and Manica 0-500 800-1200 <24 Lixisols, Luvisols R9 Northern Cabo Delgado 400-1000 >1000 <22 Arenosols R10 High altitudes of Zambézia, Niassa and Manica >800 >1000 <22 Arenosols 125
Transcript of 10. Optimizing Fertilizer Use within the Context of...

10. Optimizing Fertilizer Use within the Context of Integrated Soil Fertility Management in Mozambique Ricardo Maria1 [email protected], Janete Americano1, Jossias Matusso2 and Cláudio Gundana3 1 Instituto de Investigação Agrária de Moçambique (IIAM), Av. Das FPLM No. 2698, Caixa Postal 3658, Maputo, Mozambique2Agência de Desenvolvimento de Manica (ADEM), Rua 16 de Junho, nr 217, Chimoio, Mozambique3Africa Fertilizer Agrobusiness Partnership (AFAP), P.O. Box 1218, Maputo, Mozambique
10.1 IntroductionInadequate soil fertility is an important constraint to crop production in Mozambique. Soil pH is mostly moderate but high sand content and low soil organic matter commonly contribute to low nutrient availability and low available soil water holding capacity. Most crop production is by smallholders who are poor and unable to invest much in the use of inputs. Their severe financial constraint requires that they obtain high rates of return on their small investments and the investment must have a low rate of risk. A farmer typically faces different choices in fertilizer use and needs to choose the crop-nutrient-rate combinations that are expected to be most profitable with a low risk. Such decisions need to be based on solid information derived from field research. The Instituto de Investigação Agrária de Moçambique (IIAM) therefore partnered with
national agricultural research organizations of 12 other countries under the AGRA funded project Optimizing Fertilizer Recommendations in Africa (OFRA) with management support from CABI and technical and scientific support from the University of Nebraska-Lincoln. This partnership improved the field research derived information base needed for optimizing fertilizer use, applied the information to develop easy to use decision tools (FOTs) for three broad recommendation domains in Mozambique, and provided training to research and extension personnel for advising farmers on fertilizer use optimization.
10.2 Agricultural systems of MozambiqueAgriculture in Mozambique is practised mainly by smallholder farmers with less than 5 hectares of crop production. There are over 3 million smallholder family farms which is 99% of all farms accounting for 95% of the cultivated land. About 25% of 36 million hectares of arable land
Fertilizer Use Optimization in Sub-Saharan Africa (2017) Charles S. Wortmann and Keith Sones (eds). Published by CABI.
Table 10.1: Characteristics of agro-ecological zones (AEZ) of Mozambique
AEZ Location Altitude m Mean rainfall mm
Mean temperature oC
Dominant soils
R1 Maputo, south of Gaza 0-500 <800 >24 Arenosols, NitisolsR2 Coastal region and southern Sabi
River valley0-500 <1000 >24 Arenosols,
FluvisolsR3 Central and northern Gaza and
east of Inhambane0-500 <800 >24 Arenosols, Lixisols
R4 Central medium altitude areas 200-1000 1000-1200 22-24 Ferralsols, LuvisolsR5 Sofala and Zambézia areas 0-500 1000-1400 >24 Arenosols,
FluvisolsR6 Zambezi Valley and south of Tete 0-500 400-600 >24 Fluvisols, LixisolsR7 Zambézia, Nampula, Tete, Niassa
and Cabo Delgado0-500 <1200 <24 Lixisols, Leptosols,
ArenosolsR8 Coastal zone of Zambézia,
Niassa and Manica0-500 800-1200 <24 Lixisols, Luvisols
R9 Northern Cabo Delgado 400-1000 >1000 <22 ArenosolsR10 High altitudes of Zambézia,
Niassa and Manica>800 >1000 <22 Arenosols
125

is currently under cultivation. However, mean cereal yields, including maize, are below 0.7 t/ha due to low soil fertility, drought, pests and disease. Smallholder agriculture makes little use of inputs, mechanization and irrigation to enable both the expansion and intensification of production. Average fertilizer use for crop land is only about 2 kg/ha and most smallholders use no fertilizer. Maize, lowland rice, cassava and bean are the priority crops of smallholders.
10.2.1 Agro-ecological zones (AEZ)Mozambique has diverse farming systems associated with ten agro-ecological zones (AEZs) (Figure 10.1; Table 10.1) of which annual rainfall and elevation are important determinants (Figure 10.2). The most productive soils are Fluvisols such as in the valleys of the Zambezi, Incomate and Limpopo rivers. Sandy Arenosols are the dominant soil type covering approximately 28% of the country. Lixisols and Luvisols are important in medium altitude
R9
R10
R6
R7
R4
R5
R8
R2
R2
R3
R1
0 250 500125 Km
R10
R10
R7
R10R5 Warm/Semiarid
Warm/Subhumid
Cool/Semiarid
Warm/Semiarid
Cool/Subhumid
Tropical
Subtropical
Warm/Arid
Water
Figure 10.1: Agro-ecological zones of Mozambique overlain on climatic zonation of HarvestChoice.
Figure 10.2: Elevations of Mozambique.
126

areas, and cover 23 and 5% of total land area, respectively. These soils are heavily weathered with sandy surface layers and an accumulation of clay in the subsurface layer. Ferralsols and Acrisols are common in high rainfall plateau areas and generally have low soil pH, low nutrient availability and high P sorption capacity due to high aluminium content. Leptosols, Acrisols and Ferralsols cover 9, 8 and 7% of the land area.
10.2.2 Soil fertility management in MozambiqueShifting cultivation with no nutrient application is common in Mozambique. Manure is applied when available, mostly for vegetables and other high value crops, and especially in central and southern Mozambique where livestock production is significant. Expansion of crop production has resulted in less use of fallow periods and increased cultivation of marginal land that is often highly erodible. Significant deforestation has occurred. Burning of vegetative material after clearing fallow land and burning of crop residues is common. Soil nutrient depletion is relatively great with cassava and maize compared with other crops. Estimated nutrient depletion (kg/ha/yr) for all of Mozambique, including from erosion, is estimated at 34, 6 and 25 for N, P and K, respectively.The Ministry of Agriculture and Food Security (MASA) and agriculture development organizations have initiated a voucher subsidy programme to enable increased fertilizer use. Efficient fertilizer use, however, has been constrained by inadequate soil information and fertilizer recommendations. Fertilizer availability is generally limited to N:P:K 12:24:12 and urea. Therefore, the application of some nutrients which result in little or no profit reduce the profit potential of fertilizer use. Soil test results and nutrient-need prediction tools such as the Nutrient Management Support System (NuMaSS) (http://www.ctahr.hawaii.edu/sm-crsp/program_areas/AnnRepPY10/numass/AnnualReportNuMaSSUnivHawaii2006_2007a.pdf) and Phosphorus Decision Support System (PDSS) (http://www2.ctahr.hawaii.edu/tpss/research_extension/soliresearch/pdss.html) indicate widespread occurrence of N and
P deficiencies, as is common throughout sub-Saharan Africa. A critical level for soil exchangeable potassium (K) of 0.2 meq/100 g of soil or 80 ppm appears appropriate for Mozambique. Typical soil K levels in Mozambique range from 0.26 to 0.98 meq/100 g soil for Arenosols and Acrisols, respectively, with other soil types having intermediate levels.
10.2.3 Diagnosis of nutrient deficienciesTrials were conducted for maize, sorghum and soybean in the Manica and Burwe areas under OFRA in 2014-15. The mean yield increases for maize and sorghum over 14 variety-site combinations were 81, 22 and 18% for applied N, P and S, respectively, and the mean yield increases for soybean over four sites were 38 and 16% for applied P and S. The trials included a diagnostic treatment of N+P+S+Mg+Zn+B which was comparable to an N+P+S treatment. No N was applied in the soybean trials. The diagnostic treatment was as likely to result in yield losses as gains and the average increase due to the diagnostic treatment was -8% of soybean and 1% for cereals, neither of which was significantly different from zero. The results support other diagnoses of N and P deficiencies but also S deficiency and indicate that application of other secondary and micro nutrients is not likely to be profitable.
10.3 Fertilizer use optimization in MozambiqueNormally farmers wish to maximize profit from fertilizer use. Farmers with adequate financial resources may strive to maximize profit per hectare resulting from fertilizer use. However, most farmers in Mozambique are very poor
0.0
0.5
1.0
1.5
2.0
2.5
3.0
0 5 10 15 20 25
Yiel
d, t/
ha
P rate, kg/ha
Maize CowpeaBean Soybean
Figure 10.3: Examples of crop nutrient response curves determined from crop response functions for applied P in mid-altitude areas of Mozambique.
127

and have the financial resources to use little if any fertilizer. These poor farmers need to obtain very high net returns on their small investments in fertilizer use. Therefore, fertilizer use optimization in this chapter refers to maximizing profit from fertilizer use according to the farmer’s agronomic and economic situation. The nature of crop response to applied nutrients, over a large number of trials, is usually curvilinear to a plateau as illustrated most clearly by cowpea and pigeonpea response to P in mid-altitude areas of Mozambique (Figure 10.3). The soybean P response is relatively large and has not reached the yield plateau with 25 kg/ha of P applied. Maize and bean responses to P were small in this AEZ. These responses are mathematically represented by the equation Y = a – bcr where Y is yield, a is yield at the plateau for application of that nutrient, b is the maximum yield increase due to application of the concerned nutrient, c is a determinant of the response curve, and r is the nutrient application rate. As P rates increase, the yield increase per additional kg of applied P decreases. In all cases, the yield increase per kg/ha of P applied is relatively great at lower compared with higher P rates. Greater net returns to Mozambique metical (MZM) invested in fertilizer use are expected with lower compared with higher P application rates.
Another consideration in optimizing fertilizer use for high profit is that the profit potential is greater for some nutrients applied to one or more crops compared with other crop-nutrient combinations. An example is given from areas of less than 900 masl (Figure 10.4). On the horizontal x-axis, the amount of money (MZM) invested in a nutrient applied to a crop is given. On the vertical y-axis, the net return to nutrient application is given. Each curve represents a crop-nutrient combination. Because the figure represents economics of fertilizer use, the fertilizer costs and crop values influence the magnitude and shape of response. Throughout this chapter, the current subsidized fertilizer cost of MZM 1500 per 50 kg bag was used irrespective of the actual cost. Grain prices used were MZM 15/kg for maize and sorghum, 30 for cowpea and soybean, and 40 for bean and pigeonpea. When the curves are steep, the net return for the amount invested is high. Several crop-nutrient curves are very steep initially offering potential for very high rates of return at low application rates including for N applied to maize and bean, P applied to soybean and pigeonpea, and K applied to pigeonpea. As application rates increase, slopes become less steep and some other options, such as N applied to soybean and P applied to cowpea and bean, become competitive options. Some
Figure 10.4: Net return to investment in the application of a nutrient to a crop in areas at <900 masl in Mozambique with the cost of using 50 kg urea, TSP, NPK 12-24-12, and NPS 12-24-0-6 being MZM 1500. Commodity values (MZM/kg) used were 15 for maize and sorghum; 30 for cowpea and soybean; 40 for bean and pigeonpea.
128
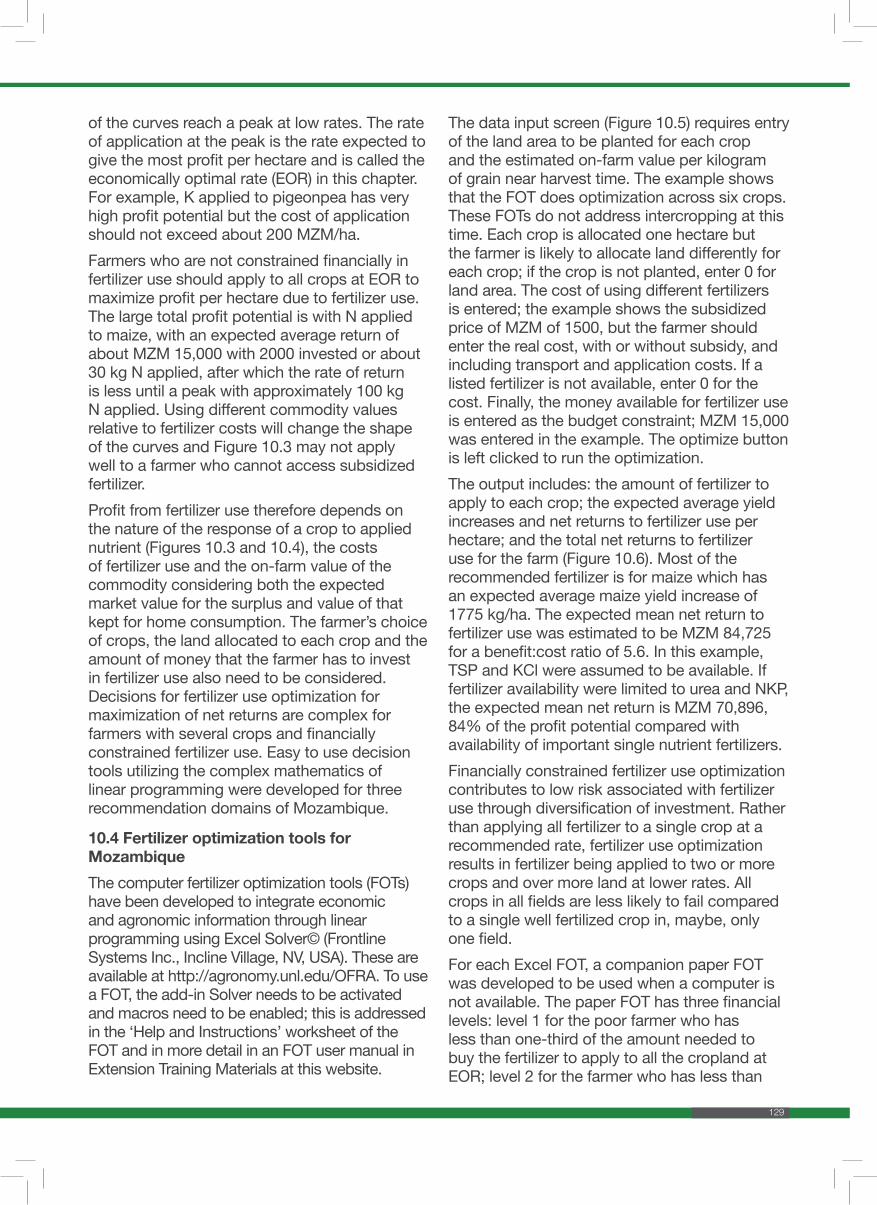
of the curves reach a peak at low rates. The rate of application at the peak is the rate expected to give the most profit per hectare and is called the economically optimal rate (EOR) in this chapter. For example, K applied to pigeonpea has very high profit potential but the cost of application should not exceed about 200 MZM/ha. Farmers who are not constrained financially in fertilizer use should apply to all crops at EOR to maximize profit per hectare due to fertilizer use. The large total profit potential is with N applied to maize, with an expected average return of about MZM 15,000 with 2000 invested or about 30 kg N applied, after which the rate of return is less until a peak with approximately 100 kg N applied. Using different commodity values relative to fertilizer costs will change the shape of the curves and Figure 10.3 may not apply well to a farmer who cannot access subsidized fertilizer. Profit from fertilizer use therefore depends on the nature of the response of a crop to applied nutrient (Figures 10.3 and 10.4), the costs of fertilizer use and the on-farm value of the commodity considering both the expected market value for the surplus and value of that kept for home consumption. The farmer’s choice of crops, the land allocated to each crop and the amount of money that the farmer has to invest in fertilizer use also need to be considered. Decisions for fertilizer use optimization for maximization of net returns are complex for farmers with several crops and financially constrained fertilizer use. Easy to use decision tools utilizing the complex mathematics of linear programming were developed for three recommendation domains of Mozambique.
10.4 Fertilizer optimization tools for MozambiqueThe computer fertilizer optimization tools (FOTs) have been developed to integrate economic and agronomic information through linear programming using Excel Solver© (Frontline Systems Inc., Incline Village, NV, USA). These are available at http://agronomy.unl.edu/OFRA. To use a FOT, the add-in Solver needs to be activated and macros need to be enabled; this is addressed in the ‘Help and Instructions’ worksheet of the FOT and in more detail in an FOT user manual in Extension Training Materials at this website.
The data input screen (Figure 10.5) requires entry of the land area to be planted for each crop and the estimated on-farm value per kilogram of grain near harvest time. The example shows that the FOT does optimization across six crops. These FOTs do not address intercropping at this time. Each crop is allocated one hectare but the farmer is likely to allocate land differently for each crop; if the crop is not planted, enter 0 for land area. The cost of using different fertilizers is entered; the example shows the subsidized price of MZM of 1500, but the farmer should enter the real cost, with or without subsidy, and including transport and application costs. If a listed fertilizer is not available, enter 0 for the cost. Finally, the money available for fertilizer use is entered as the budget constraint; MZM 15,000 was entered in the example. The optimize button is left clicked to run the optimization. The output includes: the amount of fertilizer to apply to each crop; the expected average yield increases and net returns to fertilizer use per hectare; and the total net returns to fertilizer use for the farm (Figure 10.6). Most of the recommended fertilizer is for maize which has an expected average maize yield increase of 1775 kg/ha. The expected mean net return to fertilizer use was estimated to be MZM 84,725 for a benefit:cost ratio of 5.6. In this example, TSP and KCl were assumed to be available. If fertilizer availability were limited to urea and NKP, the expected mean net return is MZM 70,896, 84% of the profit potential compared with availability of important single nutrient fertilizers.Financially constrained fertilizer use optimization contributes to low risk associated with fertilizer use through diversification of investment. Rather than applying all fertilizer to a single crop at a recommended rate, fertilizer use optimization results in fertilizer being applied to two or more crops and over more land at lower rates. All crops in all fields are less likely to fail compared to a single well fertilized crop in, maybe, only one field.For each Excel FOT, a companion paper FOT was developed to be used when a computer is not available. The paper FOT has three financial levels: level 1 for the poor farmer who has less than one-third of the amount needed to buy the fertilizer to apply to all the cropland at EOR; level 2 for the farmer who has less than
129

Figure 10.6: An image of the output screen for a fertilizer optimization tool.
Elevation >1400<900 m
Producer Name:Prepared By:
Date Prepared:
CropArea
Planted (Ha)*
Expected Grain
Value/kg †Maize 1 20Cowpea 1 30Bean 1 40Sorghum 1 20Soybean 1 30Pigeon Pea 1 40 Total 6
Fertilizer Product N P2O5 K2O S Costs/50 kg bag ¶*
Urea 46% 0% 0% 0% 1500Triple super phosphate, TSP 0% 46% 0% 0% 1500NPK 12% 24% 12% 0% 1500Blank 0% 0% 0% 0% 0Optional 23% 20% 0% 6% 1500
Amount available to invest in fertilizer 15000
Crop Urea TSP NPK OptionalMaize 117 4 0 0 48Cowpea 0 38 0 0 0Bean 33 36 0 0 0Sorghum 19 36 0 0 0Soybean 0 65 0 0 52Pigeon Pea 0 51 0 0 0 0 0 0 0 0Total fertilizer needed 170 230 0 0 100
Crop Yield Increases Net Returns
Maize 1,772 30,348Cowpea 161 3,691Bean 390 13,513Sorghum 355 5,435Soybean 866 22,476Pigeon Pea 270 9,261 0 0
Total net returns to investment in fertilizer
© 2016, The Board of Regents of the University of Nebraska. All rights reserved.
Acknowledgements: IIAM; funding support from the Alliance for a Green Revolution in Africa - Soil Health Programme; technical support from CABI and the University of Nebraska-Lincoln.
For information, contact: Ricardo Maria [email protected]
Total Expected Net Returns to Fertilizer
Credits: Ricardo Maria, IIAM; and Charles Wortmann, Jim Jansen, and Matthew Stockton, University of Nebraska-Lincoln.
84,724
xxx
August 18, 2016xxx
Fertilizer Selection and Prices
Crop Selection and Prices
Budget Constraint
Fertilizer Optimization
Expected Average Effects per Ha
Application Rate - kg/Ha
Figure 10.5: An image of the input screen for a fertilizer optimization tool.
Elevation >1400<900 m
Producer Name:Prepared By:
Date Prepared:
CropArea
Planted (Ha)*
Expected Grain
Value/kg †Maize 1 20Cowpea 1 30Bean 1 40Sorghum 1 20Soybean 1 30Pigeon Pea 1 40 Total 6
Fertilizer Product N P2O5 K2O S Costs/50 kg bag ¶*
Urea 46% 0% 0% 0% 1500Triple super phosphate, TSP 0% 46% 0% 0% 1500NPK 12% 24% 12% 0% 1500Blank 0% 0% 0% 0% 0Optional 23% 20% 0% 6% 1500
Amount available to invest in fertilizer 15000
Crop Urea TSP NPK OptionalMaize 117 4 0 0 48Cowpea 0 38 0 0 0Bean 33 36 0 0 0Sorghum 19 36 0 0 0Soybean 0 65 0 0 52Pigeon Pea 0 51 0 0 0 0 0 0 0 0Total fertilizer needed 170 230 0 0 100
Crop Yield Increases Net Returns
Maize 1,772 30,348Cowpea 161 3,691Bean 390 13,513Sorghum 355 5,435Soybean 866 22,476Pigeon Pea 270 9,261 0 0
Total net returns to investment in fertilizer
© 2016, The Board of Regents of the University of Nebraska. All rights reserved.
Acknowledgements: IIAM; funding support from the Alliance for a Green Revolution in Africa - Soil Health Programme; technical support from CABI and the University of Nebraska-Lincoln.
For information, contact: Ricardo Maria [email protected]
Total Expected Net Returns to Fertilizer
Credits: Ricardo Maria, IIAM; and Charles Wortmann, Jim Jansen, and Matthew Stockton, University of Nebraska-Lincoln.
84,724
xxx
August 18, 2016xxx
Fertilizer Selection and Prices
Crop Selection and Prices
Budget Constraint
Fertilizer Optimization
Expected Average Effects per Ha
Application Rate - kg/Ha
130

Table 10.2: Example of a paper fertilizer use optimizer toolMozambique Fertilizer Use Optimizer Tool: >1300 m elevation, May 2016
The below assumes:Calibration measurement is with an Agua Vumba water bottle lid (CAP); contains 8 ml, 5.6 g urea, 8g NPK, 9.6 g NPS, and 10.4 g TSP.Plant spacing: maize at 75 x 30 cm; cowpea, bean and soybean with 60 cm row spacing; pigeonpea with 75 cm row spacing.Grain values per kg (MZM): 15 for maize and sorghum; 30 for cowpea and soybean; 40 for bean and pigeonpea.50 kg of fertilizer use costs (MZM): 1500 for urea, TSP, NPK 12-24-12, and NPS 23-20-0-6.Application rates are in kg/ha.
Level 1 financial ability.Maize point apply 90 kg NPS (1 CAP for 5.7 plants) and 65 kg NPK (1 CAP for 5 plants) at planting; topdress
50 kg urea (1 CAP for 6.2 plants)Sorghum band apply 60 kg NPS (1 CAP for 2.1 m)
Soybean band apply 38 kg TSP applied at planting (1 CAP for 3.9 m)
Level 2 financial ability.Maize point apply 153 kg NPS (1 CAP for 3.3 plants) and 160 kg NPK (1 CAP for 6.2 plants) at planting; and
topdress 50 kg urea (1 CAP for 4.4 plants)Sorghum band apply 25 kg urea (1 CAP for 3 m) and 49 kg of TSP at planting (1 CAP for 2.4 m); topdress 25 kg
urea (1 CAP for 3 m)Cowpea band apply 36 kg TSP applied at planting (1 CAP for 4.1 m)
Soybean band apply 77 kg TSP applied at planting (1 CAP for 1.9 m)
Level 3 financial ability (maximize profit per acre).Maize point apply 200 kg NPS (1 CAP for 2.6 plants), 84 kg TSP (1 CAP for 5.6 plants) and 150 kg NPK (1
CAP for 6.2 plants); topdress 82 kg urea (1 CAP for 3.6 plants)Sorghum band apply 100 kg of NPK at planting (1 CAP for 1.1 m); topdress 50 kg urea (1 CAP for 1.5 m)
Bean band apply 29 kg urea (1 CAP for 3.2 m) and 49 kg TSP at planting (1 CAP for 3 m)
Cowpea band apply 56 kg TSP applied at planting (1 CAP for 2.6 m)
Soybean band apply 129 kg TSP applied at planting (1 CAP for 1.1 m)
two-thirds of the money to apply fertilizer to all cropland at EOR; and level 3 is for the farmer with enough money to apply fertilizer to some cropland at EOR. Fertilizer use options within financial levels have similar profit potential. The paper FOT requires some assumptions: the volume of measuring units to be used by farmers in calibration; plant spacing for each crop; the fertilizer use costs per 50 kg bag; and the expected commodity values on farm at harvest, considering the value of both home consumption and for market.The paper FOT advises on the 4Rs of fertilizer use including the right type, rate, time and method of application. It also advises on calibration to help the farmer to adjust his/her eyes and feel to the rate of application, that is a water bottle lid full of fertilizer is sufficient for
so many metres of band application or so many plants. In using the paper FOT for >1300 m (Table 10.2), first consider the farmer’s financial ability for fertilizer use. If the farmer has little money, begin with financial level 1, which has options for only maize, sorghum and soybean as fertilizer use options for bean and cowpea were not profitable enough to fit into this category. For example, the level 1 recommendation for maize is: “point apply 90 kg NPS (1 CAP for 5.7 plants) and 65 kg NPK (1 CAP for 5 plants) at planting; topdress 50 kg urea (1 CAP for 6.2 plants)”. Therefore, the farmer should use NPS, NPK and urea. The NPS and NPK should be applied at planting. One Agua Vumba brand 8 ml bottle cap of NPS is sufficient for 5.7 plants and one cap of NPK is sufficient for 5 plants. Urea should be topdress
131

applied at 40 kg/ha which requires 1 cap for 6.2 plants.
10.5 Fertilizer use in an integrated nutrient management frameworkOptimization of fertilizer requires good agronomic practices such as for variety selection, planting and control of weeds, insect pests and diseases. Some practices such as manure application or intercropping, and soil test results, may have implications for the optimal fertilizer rate. These are not considered in the FOTs which are for sole crop production and assume that soil N and P availability is sufficiently low for profitable response to nutrient application. Therefore, these factors are considered as a second step in the fertilizer use optimization decision process using a one-page decision guide (Table 10.3). The use of green manure and the application of manure calls for adjustment of fertilizer rates. The fertilizer substitution value varies with the quality of manure. Poultry and dairy
manure are expected to have greater fertilizer substitution value than farmyard manure which has had much exposure to the weather and is mixed with soil. Other practices with fertilizer substitution value include bringing material such as tree prunings into the field, rotations and intercropping. Soil test information should be considered. When soil test information is not available, soil test P should be considered low and fertilizer P applied according to the FOT recommendations. If soil test P by Mehlich 3 is above 18 ppm, do not apply fertilizer P to that field until soil test P is found to be below this level. If soil test K is found to be < 0.25 cmol/kg or <100 ppm, apply K even if not recommended by the FOT. As an example, “For each 1 t of fresh leguminous leafy tree prunings applied (e.g. gliricidia, leucaena, sesbania, senna)”, the urea, TSP or DAP, or NPK rate can be reduced from the FOT recommendation for the field by 10, 1 and 6 kg/ha, respectively. The prunings may be from alleys within the field, field boundary areas, or nearby treelots.
Table 10.3: Fertilizer use in an ISFM frameworkMozambique: Fertilizer rate adjustment for ISFM practices and soil test information
ISFM practice Urea DAP or TSP NPK 10-20-10+6S Fertilizer reduction, % or kg/ha
N P KEarly incorporation of a green legume manure (mucuna, crotalaria and lablab)
57 kg 3 kg 11 kg
For each 1 t of fresh leguminous leafy tree prunings applied (e.g. gliricidia, leucaena, sesbania, senna)
10 kg 1 kg 6 kg
Farmyard manure per 1 t of dry material 2 kg 1 kg 1 kgResidual value of FYM applied for the previous crop, per 1 t 1 kg 0.4 kg 0.4 kgDairy or poultry manure, per 1 t dry material 24 kg 7 kg 14 kgResidual value of dairy and poultry manure applied for the previous crop, per 1 t
5 kg 1.4 kg 3 kg
Compost, per 1 t/ha dry wt 20 kg 1 kg 20 kgDoubled-up legume-technology (pigeonpea) In the second year of rotation a mean reduction of 50 kg urea Cereal-bean intercropping Increase DAP/TSP by 18 kg/ha, but no change in N and K
compared with sole cereal fertilizerCereal-other legume (effective in N fixation) intercropping
Increase DAP/TSP by 20 kg/kg, reduce urea by 30 kg/ha, and no change in K compared with sole cereal fertilizer
If Mehlich III P >18 ppm Do not apply P If soil test K < 0.25 cmol/kg Apply 20 kg/ha KCl
132

Table 10.4a: High elevation >1300 m. Response functions, expected yield increases (t/ha) for crop-nutrients, and OFRA economically optimal rate (EOR) to maximize profit per hectare compared to current or recent (REC) recommendations. P2O5 = P x 2.29; K2O = K x 1.2. Some functions have zero response because of lack of response or lack of information.
Response coefficients, Yield = a – bcr;r = elemental nutrient rate, kg/ha
Yield increases due to incremental increases in elemental nutrient rate
Recommended nutrient rate
Crop Nutrient a b c 0-30 30-60 60-90 90-120 EOR† RECt/ha t/ha kg/ha
Maize N 5.100 2.600 0.973 1.456 0.641 0.282 0.124 100 58
Bean N 0.429 0.031 0.798 0.031 0.000 0.000 0.000 7
Sorghum N 4.07 0.730 0.964 0.487 0.162 0.054 0.018 49 70
0-5 5-10 10-15 15-20Maize P 2.90 1.600 0.972 0.212 0.184 0.159 0.138 40 11
Cowpea P 1.5299 0.371 0.720 0.299 0.058 0.011 0.002 10
Bean P 0.429 0.031 0.798 0.021 0.007 0.002 0.001 3
Soybean P 1.457 0.607 0.883 0.281 0.151 0.081 0.043 22
Sorghum P 4.047 0.651 0.856 0.352 0.162 0.074 0.034 15 13
Maize K 4.863 0.563 0.896 0.238 0.137 0.079 0.046 26 10
Cowpea K 1.563 0.081 0.898 0.034 0.020 0.011 0.007 16
Soybean K 0.837 0.019 0.908 0.007 0.004 0.003 0.002 0
Maize S 2.510 0.577 0.738 0.451 0.099 0.022 0.005 14†EOR was determined with the cost of using 50 kg urea, TSP and NPK 12-24-12 MZM 1500. Commodity values (MZM/kg) used were: 15 for maize and sorghum; 30 for cowpea and soybean; 40 for bean and pigeonpea.
10.6 Crops addressed by region for optimized fertilizer useThe crops and nutrients addressed by OFRA are given in column 1-2 of Tables 10.4a-c. The response coefficients a, b and c for the response equation Y = a - bcr are reported in column 3-5. The effects on changes in nutrient rates on yield increases are reported in column 6-9. The elemental nutrient application rates at EOR and as recommended (REC) are given in column 10-11. The information in this chapter does not apply to drier areas of Mozambique represented by light green in Figure 10.2 with the exception of valley soils. It is also not likely to apply to sandy soils unless these have been amended over the years through application of much organic material.Land area at >1300 masl is small in Mozambique (Figure 10.2) and is in AEZ R10 (Figure 10.1). Results of field research indicate a mean response of maize to N and P of up to 2.6 and 1.6 t/ha, respectively, and corresponding sorghum yield increases. Mean maize responses
to K and S were >0.5 t/ha (Table 10.4a). Available bean research results for this zone were few with low yields and low responses to applied nutrients. Mean soybean and cowpea response to P were 0.6 and 0.37, respectively, but mean response to K was less than 0.1 t/ha. Most land in the 900 to 1300 masl range is also in AEZ R10.The mean response of maize to N and P was 1.79 and 0.32 t/ha, respectively (Table 10.4b). Bean is an important crop in this zone and mean response to applied N was 0.29 t/ha with an N EOR of 22. All crops had mean responses to P that were economical.Most crop production in Mozambique occurs at <900 masl (Table 10.4c) and the recommendations best apply to AEZ R4, R5, R7, R8 and R9 (Figure 10.1). The mean response of maize to N and P was 1.94 and 0.37 t/ha, respectively. Bean and soybean had profitable responses to N and all crops had economic responses to P. Maize had profitable responses to K and S in all zones. Pigeonpea response to K was profitable in the <1300 masl areas.
133

Fertilizer use recommendations (REC) have not been available for most crops. The EOR were determined using the current subsidized fertilizer prices. The N EOR was high and low compared with REC for maize and sorghum, respectively. The P EOR for maize was high or similar
compared with REC. The EOR were determined for numerous crop-nutrient combinations for which REC are unavailable. The EOR would be less for farmers lacking access to subsidized fertilizer.
Table 10.4b: Mid-elevation (900-1300 masl)
Response coefficients, Yield = a – bcr;r = elemental nutrient rate, kg/ha
Yield increases due to incremental increases in elemental nutrient rate
Recommended nutrient rate
Crop Nutrient a b c 0-30 30-60 60-90 90-120 EOR† REC
t/ha t/ha kg/haMaize N 2.85 1.794 0.972 1.029 0.439 0.187 0.080 86 58
Bean N 0.84 0.293 0.862 0.290 0.003 0.000 0.000 22
Soybean N 1.13 0.046 0.929 0.041 0.004 0.000 0.000 0
0-5 5-10 10-15 15-20Maize P 2.69 0.322 0.929 0.099 0.069 0.048 0.033 12 11
Cowpea P 1.53 0.371 0.72 0.299 0.058 0.011 0.002 9
Bean P 0.88 0.058 0.869 0.029 0.014 0.007 0.004 10
Soybean P 2.09 0.867 0.895 0.369 0.212 0.122 0.070 6
Pigeonpea P 2.54 0.487 0.758 0.365 0.091 0.023 0.006 27
Maize K 4.08 0.097 0.900 0.040 0.02003 0.014 0.008 10 13
Pigeonpea K 2.53 0.127 0.666 0.110 0.014 0.002 0.000 10
Maize S 2.55 0.400 0.761 0.298 0.0706 0.019 0.005 13
Table 10.4c: Lower elevation, <900 m elevation.
Response coefficients, Yield = a – bcr;r = elemental nutrient rate, kg/ha
Yield increases due to incremental increases in elemental nutrient rate
Recommended nutrient rate
Crop Nutrient a b c 0-30 30-60 60-90 90-120 EOR† REC
t/ha Yield increase, t/ha kg/haMaize N 3.436 1.942 0.973 1.088 0.478 0.211 0.093 90 58
Bean N 0.838 0.290 0.862 0.290 0.003 0.000 0.000 23
Soybean N 2.828 0.473 0.977 0.238 0.118 0.059 0.029 69
0-5 5-10 10-15 15-20Maize P 2.967 0.368 0.917 0.129 0.084 0.054 0.035 14 11
Cowpea P 1.880 0.288 0.898 0.120 0.070 0.041 0.024 17
Bean P 0.88 0.200 0.869 0.101 0.050 0.025 0.012 15
Soybean P 2.774 0.408 0.865 0.210 0.102 0.049 0.024 18
Pigeonpea P 2.64 0.332 0.849 0.185 0.082 0.036 0.016 17
Maize K 3.317 0.113 0.940 0.030 0.022 0.016 0.012 10 13
Pigeonpea K 2.53 0.127 0.666 0.110 0.014 0.002 0.000 10
Maize S 3.014 0.047 0.750 0.036 0.009 0.002 0.000 5
134

10.7 AcknowledgementsOFRA activities were funded by AGRA and implementation was managed by CABI. Several IIAM research teams contributed to OFRA activities in Mozambique and we are grateful to
farmers who cooperated in field research. We are grateful for the scientific and technical support of Professor Charles Wortmann of the University of Nebraska-Lincoln and Dr KC Kaizzi of the National Agricultural Research Organization of Uganda.
135