10 Lr Nokia Appendix 04 Wcdma Ran Kpi
219
WCDMA RAN, Rel. RU50, Operating Documentation, Issue 01 WCDMA RAN Key Performance Indicators DN05191189 Issue 08 Approval Date 2014-03-05
-
Upload
aaron-perkins -
Category
Documents
-
view
310 -
download
37
description
WCDMA
Transcript of 10 Lr Nokia Appendix 04 Wcdma Ran Kpi

WCDMA RAN, Rel. RU50,Operating Documentation,Issue 01
WCDMA RAN KeyPerformance Indicators DN05191189Issue 08Approval Date 2014-03-05

The information in this document is subject to change without notice and describes only the productdefined in the introduction of this documentation. This documentation is intended for the use ofNokia Solutions and Networks customers only for the purposes of the agreement under which thedocument is submitted, and no part of it may be used, reproduced, modified or transmitted in anyform or means without the prior written permission of Nokia Solutions and Networks. The documen-tation has been prepared to be used by professional and properly trained personnel, and the cus-tomer assumes full responsibility when using it. Nokia Solutions and Networks welcomes customercomments as part of the process of continuous development and improvement of the documenta-tion.
The information or statements given in this documentation concerning the suitability, capacity, orperformance of the mentioned hardware or software products are given "as is" and all liability aris-ing in connection with such hardware or software products shall be defined conclusively and finallyin a separate agreement between Nokia Solutions and Networks and the customer. However,Nokia Solutions and Networks has made all reasonable efforts to ensure that the instructions con-tained in the document are adequate and free of material errors and omissions. Nokia Solutionsand Networks will, if deemed necessary by Nokia Solutions and Networks, explain issues whichmay not be covered by the document.
Nokia Solutions and Networks will correct errors in this documentation as soon as possible. IN NOEVENT WILL Nokia Solutions and Networks BE LIABLE FOR ERRORS IN THIS DOCUMENTA-TION OR FOR ANY DAMAGES, INCLUDING BUT NOT LIMITED TO SPECIAL, DIRECT, INDI-RECT, INCIDENTAL OR CONSEQUENTIAL OR ANY LOSSES, SUCH AS BUT NOT LIMITED TOLOSS OF PROFIT, REVENUE, BUSINESS INTERRUPTION, BUSINESS OPPORTUNITY OR DA-TA,THAT MAY ARISE FROM THE USE OF THIS DOCUMENT OR THE INFORMATION IN IT.
This documentation and the product it describes are considered protected by copyrights and otherintellectual property rights according to the applicable laws.
NSN is a trademark of Nokia Solutions and Networks. Nokia is a registered trademark of NokiaCorporation. Other product names mentioned in this document may be trademarks of their respec-tive owners, and they are mentioned for identification purposes only.
Copyright © Nokia Solutions and Networks 2014. All rights reserved
f Important Notice on Product Safety This product may present safety risks due to laser, electricity, heat, and other sources of
danger.
Only trained and qualified personnel may install, operate, maintain or otherwise handlethis product and only after having carefully read the safety information applicable to thisproduct.
The safety information is provided in the Safety Information section in the “Legal, Safetyand Environmental Information” part of this document or documentation set.
Nokia Solutions and Networks is continually striving to reduce the adverse environmental effects ofits products and services. We would like to encourage you as our customers and users to join us inworking towards a cleaner, safer environment. Please recycle product packaging and follow therecommendations for power use and proper disposal of our products and their components.
If you should have questions regarding our Environmental Policy or any of the environmental ser-vices we offer, please contact us at Nokia Solutions and Networks for any additional information.
WCDMA RAN Key Performance Indicators
2 DN05191189 Issue: 08

Table of ContentsThis document has 219 pages
Summary of changes................................................................... 13
1 Introduction to WCDMA RAN Key Performance Indicators......... 161.1 Overview of WCDMA RAN key performance indicators.............. 161.1.1 Structure of key performance indicators...................................... 161.1.2 Classification of key performance indicators ...............................171.1.3 Network and user key performance indicators.............................181.1.4 Summary of different KPI viewpoints........................................... 181.2 Calls in WCDMA RAN..................................................................211.2.1 Definition of call from the WCDMA RAN perspective...................211.2.2 Call Setup Success rates (CSSR) in NSN-based WCDMA RAN.261.2.3 Call Success Rates (CSR) in NSN-based WCDMA RAN............ 281.3 Resource usage in NSN-based WCDMA RAN............................ 291.3.1 Principles for resource reservation related to services................ 291.3.2 RAB Setup and Access Complete Rates..................................... 291.3.3 RAB Success Rates.....................................................................301.3.4 Packet Session/HSPA Setup Success Rates...............................301.3.5 Packet Session/HSPA Success Rates.........................................301.3.6 Packet Session/R99 Setup Success Rates................................. 311.3.7 Packet Session/R99 Success Rates............................................311.4 Different KPI levels.......................................................................311.4.1 Principles of using defined UMTS architecture............................ 321.4.2 Principles of using defined QoS architecture............................... 321.4.3 Access network level KPIs........................................................... 321.4.4 RNC function level KPIs...............................................................331.4.5 Transport Resource Manager level KPIs..................................... 341.4.6 Access point-level KPIs................................................................351.5 System Program Report...............................................................361.5.1 Principles of System Program Report ......................................... 361.5.2 System Program Report content..................................................36 2 Terms and definitions................................................................... 47 3 Available WCDMA RAN key performance indicators...................50 4 Available Key Performance Indicators per Formula.....................644.1 Access network level....................................................................644.1.1 Access network level indicators for accessibility..........................644.1.1.1 Call Setup Success Ratio (CSSR) [%]......................................... 644.1.1.2 LCS Setup [%]..............................................................................714.1.1.3 RRC Setup Complete Ratio [%]................................................... 724.1.1.4 RRC Setup and Access Complete Ratio [%]............................... 724.1.1.5 RAB Setup and Access Complete Ratio [%]................................75
WCDMA RAN Key Performance Indicators
Issue: 08 DN05191189 3

4.1.1.6 RAB Setup and Access Complete Ratio, Multi-RAB Services [%]...77
4.1.1.7 HS-FACH Setup Success Ratio................................................... 784.1.1.8 Serving Radio Network Subsystem Accessibility Ratio [%]......... 794.1.2 Access network level indicators for retainability...........................854.1.2.1 Call Success Ratio (CSR) [%]......................................................854.1.2.2 RRC Success Ratio [%]............................................................... 854.1.2.3 RRC Connection releases [#].......................................................864.1.2.4 RAB Success Ratio [%]................................................................874.1.2.5 Packet Session Success Ratio (SSR) [%]................................... 944.1.2.6 RAB Success Ratio, Multi-RAB Services [%]...............................964.1.2.7 HS-FACH Success Ratio [%]....................................................... 964.1.3 Access network level indicators for usage................................... 974.1.3.1 CS service duration [minutes]...................................................... 974.1.3.2 PS duration [minutes]...................................................................984.1.3.3 CS service duration before call drop [minutes]............................ 994.1.3.4 PS service duration before call drop [minutes]...........................1014.1.3.5 PS service volume before RAB drop [Mbit/ Dropped RAB]........1034.1.3.6 Erlang [Erlang]........................................................................... 1074.1.3.7 Requested SRNS Relocation Attempt Numbers [Integer Number]..
1084.1.3.8 Requested Handover Attempt Numbers [Integer Number]........ 1094.1.4 Access network level indicators for mobility............................... 1124.1.4.1 Intra System Hard Handover Success Ratio [%]........................1124.1.4.2 Inter System Hard Handover Success Ratio [%]........................1134.1.4.3 Inter System Hard Handover Drop Ratio [%]..............................1174.2 RNC function level..................................................................... 1214.2.1 RNC function level indicators for accessibility............................1214.2.1.1 Packet Session Setup Success Ratio (SSSR) [%].....................1214.2.2 RNC function level indicators for retainability.............................1274.2.2.1 Packet Session Success Ratio (SSR) [%]................................. 1274.2.3 RNC function level indicators for usage..................................... 1344.2.3.1 Requested RRC Connection Attempt Numbers [Integer Number]...
1344.2.3.2 Requested Service Attempt Numbers [Integer Number]............1354.2.3.3 Requested Packet Session Attempt Numbers [Integer Number].....
1404.2.3.4 Requested SRNS Relocation Attempt Numbers [Integer Number]..
1434.2.3.5 Requested Handover Attempt Numbers [Integer Number]........ 1464.2.3.6 Requested state transition numbers.......................................... 1504.2.3.7 Capacity restrictions...................................................................1504.2.3.8 Logical Resource Availability [%]............................................... 1514.2.3.9 User Resource Reservation Numbers [Integer Number]........... 1524.2.3.10 Allocated Capacity [Mbit/s].........................................................1574.2.3.11 Soft Handover Overhead [%]..................................................... 1644.2.3.12 Radio layer (MAC or IP) Data Volumes [Mbit]............................165
WCDMA RAN Key Performance Indicators
4 DN05191189 Issue: 08

4.2.3.13 Average Radio Layer (RLC, MAC or FP) Throughput [Mbit/s]... 1674.2.4 RNC function level indicators for mobility...................................1704.2.4.1 Intra RNC Inter frequency HO Success Ratio [%]......................1704.3 Transport Resource Manager level............................................ 1714.3.1 Transport Resource Manager level indicators for accessibility.. 1714.3.1.1 Transmission Resource Accessibility Ratio [%]......................... 1724.3.2 Transport Resource Manager level indicators for usage............1734.3.2.1 Reserved AAL2 bandwidth [%].................................................. 1744.3.2.2 Reserved IP bandwidth [%]........................................................1744.3.2.3 IP Based RAN logical Interface data volume [Mbit]................... 1784.3.2.4 ATM Based RAN logical Interface data volume [Mbit]................1794.3.2.5 Average ATM layer throughput per RAN logical interface [Mbit/s]...
1814.3.2.6 ATM layer traffic load [%]........................................................... 1834.3.2.7 IP layer traffic load......................................................................1844.4 Access point level...................................................................... 1854.4.1 Access point level indicators for usage...................................... 1854.4.1.1 Radio Load [dBm]...................................................................... 1854.4.1.2 Logical Resource Availability [%]............................................... 1894.4.1.3 HW Resources [%].....................................................................1914.4.1.4 User Resource Reservation Numbers [Integer Number]........... 1954.4.1.5 HSPA Scheduler resource utilization [%]................................... 1974.4.1.6 Radio layer (MAC or FP) Data Volumes [Mbit]...........................1984.4.1.7 Average Radio Layer (MAC) Throughput [Mbit/s]...................... 2024.4.1.8 Active Throughput [Mbit/s]......................................................... 2034.4.2 Access point level indicators for mobility....................................2064.4.2.1 Soft Handover Success Rate [%]...............................................2064.4.2.2 HSPA Serving Cell Change Success Rate [%].......................... 2084.4.3 Access point level indicators for integrity................................... 2104.4.3.1 NRT Retransmission Ratio [%]...................................................2104.4.3.2 Block Error Ratio (BLER) [%]..................................................... 2134.4.3.3 Radio interface transmission utilization [%]................................2184.4.3.4 Radio interface quality................................................................218
WCDMA RAN Key Performance Indicators
Issue: 08 DN05191189 5

List of FiguresFigure 1 KPI viewpoints.................................................................................... 19Figure 2 General UMTS Architecture............................................................... 22Figure 3 QoS Architecture................................................................................ 23Figure 4 Service Access Points offered by the Access Stratum.......................24Figure 5 Iu and Uu User plane..........................................................................25Figure 6 Iu and Uu Control plane .....................................................................25
WCDMA RAN Key Performance Indicators
6 DN05191189 Issue: 08

List of TablesTable 1 WCDMA RAN KPIs related to System Program Report.....................37Table 2 Available KPIs in WCDMA RAN......................................................... 50Table 3 Voice Call Setup Success Ratio (CSSR)............................................64Table 4 Voice Call Setup Success Ratio (RRC+CU).......................................65Table 5 UDI Call Setup Success Ratio (CSSR).............................................. 66Table 6 Streaming Call Setup Success Ratio (CSSR).................................... 67Table 7 Packet Service Setup Success Ratio (CSSR)....................................68Table 8 Packet Session Setup Success Ratio (SSSR)................................... 70Table 9 LCS Setup and Access Complete Ratio.............................................71Table 10 RRC Connection setup Success Ratio...............................................72Table 11 RRC Setup and Access Complete Ratio, from Network Perspective.72Table 12 RRC Setup and Access Complete Ratio............................................ 73Table 13 Registration Success..........................................................................74Table 14 RAB Setup and Access Complete Ratio for Voice............................. 75Table 15 RAB Setup and Access Complete Ratio for UDI................................ 75Table 16 RAB Setup and Access Complete Ratio for Streaming......................76Table 17 RAB Setup and Access Complete Ratio for NRT Service..................76Table 18 Multi RAB setup and access Success Ratio.......................................77Table 19 HS-FACH Setup Success ratio...........................................................78Table 20 Relocation Success in Target RNC for CS......................................... 79Table 21 Relocation Success in Target RNC for PS......................................... 79Table 22 Incoming Inter System HHO Success in Target RNC for CS............. 80Table 23 Incoming Inter System Hard Handover Success Rate in Target RNC
for PS .................................................................................................80Table 24 SRNS Relocation prep Success Rate UE not involved CS................ 81Table 25 SRNS Relocation prep Success Rate UE not involved PS................ 82Table 26 SRNS Relocation UE involved CS Success Rate (HHO)...................82Table 27 SRNS Relocation UE involved PS Success Rate (HHO)................... 83Table 28 Incoming LTE PS ISHO preparation Success Ratio...........................83Table 29 Outgoing LTE PS ISHO Preparation Success Rate........................... 84Table 30 Incoming LTE PS ISHO Relocation Complete Success Ratio............84Table 31 RRC Success Ratio............................................................................85Table 32 RRC connection releases with LTE redirection.................................. 86Table 33 RAB Success Ratio, Voice (CSR)...................................................... 87Table 34 RAB Success Ratio, Voice (CSR) (re-establishment included).......... 88Table 35 RAB Success Ratio, RT Services Excluding Voice, User perspective...
89Table 36 RAB Success ratio, UDI (CSR).......................................................... 90Table 37 RAB Success Ratio, Streaming (CSR)...............................................91
WCDMA RAN Key Performance Indicators
Issue: 08 DN05191189 7

Table 38 RAB Success Ratio, NRT Services, from Network Perspective.........92Table 39 RAB Success Ratio, NRT Services.................................................... 93Table 40 Packet Session Success Ratio...........................................................94Table 41 Multi RAB Success Ratio....................................................................96Table 42 HS-FACH Success Ratio....................................................................96Table 43 Voice, Minutes.................................................................................... 97Table 44 UDI, Minutes.......................................................................................97Table 45 NRT RAB duration..............................................................................98Table 46 NRT Sessions duration.......................................................................99Table 47 Minutes per Drop Voice...................................................................... 99Table 48 Minutes per Drop UDI.......................................................................100Table 49 PS RAB minutes per drop................................................................ 101Table 50 PS DCH minutes per drop................................................................ 102Table 51 Iu-PS data volume per drop - ATM based........................................ 103Table 52 Iu-PS data volume per drop - IP based............................................ 104Table 53 HSDPA received data per PS RAB drop including PCH.................. 105Table 54 HSDPA received data per PS RAB drop excluding PCH................. 106Table 55 Average CS Erlang...........................................................................107Table 56 Incoming Inter RNC HHO Attempts for CS.......................................108Table 57 Incoming Inter RNC HHO Attempts for PS.......................................109Table 58 ISHO Attempts RT............................................................................109Table 59 ISHO Attempts NRT..........................................................................110Table 60 Outgoing LTE PS ISHO Preparation Attempts..................................111Table 61 Intra System Hard Handover Success Ratio.................................... 112Table 62 GSM Inter System RT Hard Handover Success Ratio..................... 113Table 63 GSM Inter System NRT Hard Handover Success Ratio...................115Table 64 LTE ISHO Success ratio................................................................... 116Table 65 GSM ISHO Drop Rate RT.................................................................117Table 66 GSM ISHO Drop Rate NRT.............................................................. 118Table 67 LTE ISHO Drop Rate........................................................................ 120Table 68 HSDPA Resource Accessibility for NRT Traffic................................ 121Table 69 HSDPA Resource Accessibility for RT Traffic...................................122Table 70 HSDPA Setup Success Ratio........................................................... 123Table 71 HSUPA Resource Accessibility for NRT Traffic................................ 124Table 72 HSUPA Resource Accessibility for RT Traffic...................................125Table 73 HSUPA Setup Success Ratio........................................................... 126Table 74 R99 Setup Success Ratio.................................................................126Table 75 HSDPA Resource Retainability for NRT Traffic................................ 127Table 76 HSDPA Resource Retainability for RT Traffic...................................128Table 77 HSDPA Success Ratio..................................................................... 129
WCDMA RAN Key Performance Indicators
8 DN05191189 Issue: 08

Table 78 HSUPA resource Retainability for NRT Traffic..................................130Table 79 HSUPA Resource Retainability for RT Traffic...................................131Table 80 HSUPA Success Ratio..................................................................... 132Table 81 R99 Success Ratio........................................................................... 133Table 82 Registration Attempts....................................................................... 134Table 83 RRC Setup Attempts........................................................................ 134Table 84 RAB Attempts Voice......................................................................... 135Table 85 RAB Attempts UDI............................................................................135Table 86 RAB Attempts Streaming..................................................................136Table 87 RAB Attempts PS Interactive and Background................................ 137Table 88 Multi RAB attempts...........................................................................137Table 89 Short Message Service Attempts for idle mode UEs........................138Table 90 Intra RNC Inter frequency HO Success Rate RT............................. 138Table 91 NAS BHCA....................................................................................... 139Table 92 Incoming Location Service Attempts................................................ 139Table 93 Packet Session attempts.................................................................. 140Table 94 R99 Packet Session Attempts.......................................................... 141Table 95 HSDPA attempts...............................................................................141Table 96 HSUPA attempts...............................................................................142Table 97 HS-FACH session attempts..............................................................142Table 98 SRNS Relocation UE not involved CS Attempts.............................. 143Table 99 SRNS Relocation UE not involved PS Attempts.............................. 143Table 100 Incoming Inter System HHO Attempts (CS)..................................... 144Table 101 Incoming Inter System Change Attempts (PS).................................145Table 102 Incoming LTE PS ISHO preparation requests.................................. 145Table 103 Soft HO Update Attempts, RT.......................................................... 146Table 104 Soft HO Update Attempts, NRT........................................................146Table 105 Intra System Hard Handover Attempts.............................................147Table 106 Intra RNC HHO Attempts for CS...................................................... 148Table 107 HSDPA Serving Cell Change Attempts............................................ 148Table 108 HSUPA Serving Cell Change Attempts............................................ 149Table 109 Intra RNC Inter frequency HO Attempts NRT...................................149Table 110 Number of state transitions...............................................................150Table 111 Mass event handler duration............................................................ 150Table 112 Iu Availability.....................................................................................151Table 113 Iur Availability................................................................................... 151Table 114 Peak number of HSPA users in RNC .............................................. 152Table 115 Peak number of HSDPA users in RNC.............................................153Table 116 Peak number of HSUPA users in RNC.............................................153Table 117 Peak number of RRC Connected Mode Users in RNC.................... 154
WCDMA RAN Key Performance Indicators
Issue: 08 DN05191189 9

Table 118 Maximum number of Voice calls per RNC........................................155Table 119 Average number of active PS users................................................. 155Table 120 Maximum number of users in HS-FACH state..................................156Table 121 Average Allocated Uplink Dedicated Channel Capacity for CS Voice in
Controlling RNC................................................................................157Table 122 Average Allocated Uplink Dedicated Channel Capacity for Data Calls
in Controlling RNC............................................................................158Table 123 Average Allocated Downlink Dedicated Channel Capacity for CS
Voice in Controlling RNC.................................................................. 159Table 124 Average Allocated Downlink Dedicated Channel Capacity for Data
Calls in Controlling RNC...................................................................161Table 125 HS-DSCH selections........................................................................ 162Table 126 E-DCH selections............................................................................. 163Table 127 Soft Handover Overhead in CRNC...................................................164Table 128 HSUPA MAC-es data volume at RNC.............................................. 165Table 129 HSDPA MAC-d data volume at RNC................................................166Table 130 Iu-PS peak throughput......................................................................167Table 131 Average NRT DCH DL Throughput.................................................. 167Table 132 Average NRT HS-DSCH DL Throughput..........................................168Table 133 Average MAC-d flow throughput...................................................... 169Table 134 HSUPA MAC-es average throughput at RNC.................................. 169Table 135 Intra RNC Inter frequency HO Success Rate RT............................. 170Table 136 Intra RNC Inter frequency HO Success Rate NRT...........................171Table 137 AAL2 connection reservation success rate...................................... 172Table 138 IP Route Accessibility for outgoing traffic......................................... 172Table 139 IP Route Accessibility for incoming iub traffic...................................173Table 140 AAL2 path average reserved bandwidth.......................................... 174Table 141 Max Reserved IP based route bandwidth.........................................174Table 142 IP based Iub Uplink maximum reservation rate at Flexi BTS........... 175Table 143 IP based Iub Uplink maximum reservation rate at Ultrasite BTS .....176Table 144 IP based Iub Uplink maximum reservation rate at Flexi BTS - VLAN.....
176Table 145 IP based Iub Uplink maximum reservation rate at Ultrasite BTS -
VLAN................................................................................................ 177Table 146 Outgoing IP route traffic volume....................................................... 178Table 147 Incoming IP route traffic volume....................................................... 178Table 148 ATM interface based incoming Data Volume (RNC side).................179Table 149 ATM interface based outgoing Data Volume (RNC side)................. 180Table 150 ATM interface based average throughput for outgoing traffic (RNC
side)..................................................................................................181Table 151 ATM interface based average throughput for incoming traffic (RNC
side)..................................................................................................182
WCDMA RAN Key Performance Indicators
10 DN05191189 Issue: 08

Table 152 ATM VCC specific incoming traffic load............................................183Table 153 ATM VCC specific outgoing traffic load............................................ 183Table 154 Average outgoing IP route traffic utilization...................................... 184Table 155 Noise floor of the System................................................................. 185Table 156 Average Uplink R99 Load.................................................................186Table 157 Average HSUPA Uplink Load........................................................... 187Table 158 Average R99 Downlink Load............................................................ 188Table 159 Average HSPA Downlink Load......................................................... 189Table 160 Cell Availability................................................................................. 189Table 161 Cell Availability, excluding blocked by user state (BLU)................... 190Table 162 Average ratio of utilized CE for DL in BTS....................................... 191Table 163 Average ratio of utilized CE for UL in BTS....................................... 191Table 164 Base Band Usage Ratio Licensing - Uplink CE - Mean....................192Table 165 Base Band Usage Ratio Licensing - Downlink CE - Mean............... 192Table 166 Average ratio of utilized R99 CE for DL in BTS................................193Table 167 Average ratio of utilized R99 CE for UL in BTS................................193Table 168 Average HSDPA Processing Sets Utilization ratio............................194Table 169 Average HSUPA Processing Sets Utilization ratio............................194Table 170 Peak number of HSDPA users in WBTS.......................................... 195Table 171 Peak number of HSUPA users in WBTS.......................................... 196Table 172 Average number of active users with MIMO.....................................196Table 173 Average number of active DC HSDPA users....................................197Table 174 E-DCH 2ms TTI utilization................................................................ 197Table 175 HSDPA received data.......................................................................198Table 176 Iub data volume DL in BTS...............................................................199Table 177 Iub data volume UL in BTS...............................................................199Table 178 HSDPA MAC-d data volume at BTS.................................................200Table 179 HS-FACH data volume downlink...................................................... 201Table 180 HS-FACH data volume uplink...........................................................201Table 181 HSDPA MAC-d average net throughput at BTS............................... 202Table 182 Active HS-DSCH end user throughput ............................................ 202Table 183 Active HS-DSCH cell throughput......................................................203Table 184 Active HSUPA cell throughput.......................................................... 204Table 185 Average HSUPA user throughput.....................................................205Table 186 Soft Handover Success Ratio...........................................................206Table 187 Soft Handover Success Rate RT......................................................207Table 188 Soft Handover Success Rate NRT................................................... 208Table 189 HSDPA Serving Cell Change Success Rate.................................... 208Table 190 HSUPA Serving Cell Change Success Rate.................................... 209Table 191 NRT DCH DL Efficiency....................................................................210
WCDMA RAN Key Performance Indicators
Issue: 08 DN05191189 11

Table 192 HSDPA MAC-hs efficiency................................................................211Table 193 HARQ not acknowledged Ratio - Mean Value..................................212Table 194 Voice RB UL BLER...........................................................................213Table 195 Real Time Radio Bearer (AMR excluded) UL BLER........................ 213Table 196 Non Real Time Radio Bearer UL BLER............................................214Table 197 HSUPA MAC-e BLER.......................................................................215Table 198 HSUPA HARQ not acknowledged Ratio...........................................216Table 199 Voice RB DL BLER...........................................................................216Table 200 Real Time Radio Bearer (AMR excluded) DL BLER........................ 217Table 201 CPC efficiency.................................................................................. 218Table 202 Average reported CQI...................................................................... 218
WCDMA RAN Key Performance Indicators
12 DN05191189 Issue: 08

Summary of changesChanges between document issues are cumulative. Therefore, the latest documentissue contains all changes made to previous issues.
Release-specific information on key performance indicator (KPI) targets has beenremoved. Only the latest versions of KPI formulas are documented. For more informationsee WCDMA RAN, Rel. RU30, Changes document.
In release RAN04, this document appeared with the DN00279399 code. This code wasreplaced in RAS05/RAS05.1 with the current DN05191189 because of major changes inthe document structure in the NED online view. The document is no longer maintainedwith the old code.
Please note that our issue numbering system is changing. For more information, seeGuide to WCDMA RAN operating documentation.
g Flexi Direct content is on Flexi Direct RU40 level, and is not valid for RU50.
Changes between issues 07D (2014-01-10, RU40) and 08 (2014-03-05, RU50)
• New KPIs are listed in the following table:
KPI ID
KPI name
RNC_5500a LTE ISHO Success ratio
RNC_5501a LTE ISHO Drop Rate
RNC_5502a Outgoing LTE PS ISHO Preparation Success Rate
RNC_5503a Outgoing LTE PS ISHO Preparation Attempts
• Modified KPIs are listed in the following table:
KPI ID
Formula updated Description ofmodifications
RNC_5021b No "Note" field has beenupdated.
RNC_5050b No "Note 1" field has beenupdated.
RNC_300h No "Name", "Abbreviation" and"Description" fields have beenupdated.
WCDMA RAN Key Performance Indicators Summary of changes
Issue: 08 DN05191189 13

KPI ID
Formula updated Description ofmodifications
RNC_301f No "Name", "Abbreviation" and"Description" fields have beenupdated.
RNC_302e No "Name", "Abbreviation" and"Description" fields have beenupdated.
RNC_303e No "Name", "Abbreviation" and"Description" fields have beenupdated.
• Removed KPIs are listed in the following table:
KPI ID
KPI name
RNC_941b Iu-PS GTP average input traffic rate in RNC
RNC_5027a Iu-PS GTP total input traffic in RNC
Changes between issues 07C (2013-11-21,RU40) and 07D (2014-01-10, RU40)
Updated the KPI ID versioning description in subchapter Structure of key performanceindicators to clarify the relationship between the KPI documentation and NetActReporting Suite (for example, for RNC_706, the documentation started with b-versionand a-version has not been documented).
#unique_3/unique_3_Connect_42_GUID-45D99576-AF73-4397-9FE9-5BAA616C21E7has been updated. #unique_4/unique_4_Connect_42_OCT1751249111 has beenupdated.
• New KPI is listed in the following table:
KPI ID
KPI name
Status
RNC_5093b Voice Call Setup Success Ratio(RRC+CU)
New
• Modified KPI is listed in the following table:
KPI ID
Formula updated
Description of modifications
RNC_5078a No “Description” field has been updated.
Summary of changes WCDMA RAN Key Performance Indicators
14 DN05191189 Issue: 08

Changes between issues 07B (2013-09-09, RU40) and 07C (2013-11-21, RU40)
• Modified KPI is listed in the following table:
KPI ID
Formula updated
Description of modifications
RNC_5486a No “Description” field has been updated and“Note” field has been added.
WCDMA RAN Key Performance Indicators Summary of changes
Issue: 08 DN05191189 15

1 Introduction to WCDMA RAN KeyPerformance Indicators
1.1 Overview of WCDMA RAN key performanceindicatorsKey performance indicators (KPIs) are a set of selected indicators used for measuringthe current network performance and trends. KPIs highlight the key factors of networkmonitoring and warn in time of potential problems. KPIs are also used for prioritizing thecorrective actions.
The KPIs described here are the basic network level KPIs for the radio network based onWCDMA access technology (WCDMA RAN). The identification of each defined KPIshould represent this technology. However, because of practical and historical reasonsthe KPI IDs follow the rule used in NSN main reporting tool (NetAct Reporting Suite).Each defined KPI has a unique KPI ID that follows the format RNC_xxxxy, where xxxxyrepresents a given unique ID number. For more details, see Structure of KeyPerformance Indicators.
g There are also other KPIs in the NetAct Reporting Suite that use the ID formatRNC_xxxxy. Only the KPIs that are defined in this document are recognized bythe WCDMA RAN release RU40.
All KPIs described here are based on performance counters. The main focus is onformulas. However, some typical values for KPIs are given.
Some of the key performance indicators (KPI) are not yet available in the officialreporting tools.
For more information on available KPIs, see Available WCDMA RAN key performanceindicators.
1.1.1 Structure of key performance indicators
All the items described for each KPI are based on a common template. The templateincludes the following items:
• KPI name: The official name of the KPI.• KPI abbreviation: An abbreviation of the KPI name.• KPI ID: The WCDMA RAN ID of the KPI. The following format is used for the KPI ID:
RNC_xxxy, where xxxy is the unique number and y is the NetAct Reporting Suiteversion.Only one KPI version at a time is found in the document. From the perspective of thisdocument, what matters is the current version used in the NetAct Reporting Suite. Itshould be noted that NetAct Reporting Suite versioning always starts with version a.However, this might not always be the case for the document, the documentation fora KPI can also start from a later version (for example, b-version).
• Description: The official description of the KPI.• Note (1-n): Note fields related to the generic KPI description.
Introduction to WCDMA RAN Key PerformanceIndicators
WCDMA RAN Key Performance Indicators
16 DN05191189 Issue: 08

• Measurement: The description includes a reference to the measurement in question,for example, M1001: Service Level.
• KPI summarization formula: The formula given in counter numbers.• KPI formula with short names: The formula given in short names.• Formula note: Note related to the KPI formula.• KPI class: Each KPI belongs to a KPI class. The main classes are accessibility,
retainability, usage, integrity, and mobility. There can also be additional classificationrelated to each main class. For more information, see Classification of keyperformance indicators.
• Unit: The unit of the KPI. The possible values are # (stands for the previously used‘integer number’), E (stands for the previously used Erlang), minutes, minutes perdrop, percentage, dBm, cell/s, kbps, Mbit and Mbps (stands for previously usedMbit/s).
• Typical values: The defined typical values in accepted (=live) networks for the KPI.See System Program Report.
• Object Summary Levels: Summary levels of the reported objects. These levels arebased on the targets for the RAN measurements that provide the counters belongingto the KPI.
– There are different targets for Radio and Transport measurements.– Possible radio measurement values from the smallest to the largest are: RB
(Radio Bearer), Cell, LCG (Local Cell Group), Cluster of Cells, BTS (BaseStation), RNC, Area, City, and Network.
– Possible transport measurement values for ATM-based transport from thesmallest to the largest are: VCC (Virtual Channel Connection), RNC, andNetwork.
– Possible transport measurement values for IP-based transport from the smallestto the largest are: IP Route, RNC and Network.
• Object Summary Level notes: This field describes the potential problems for thegiven Object Summary Level.
• Time Summary Levels: Summary levels on reporting timescale. Based on thecollection periods for the RAN measurement(s). The possible values are: Hour, Day,and Week.
• Time Summary Level notes: This field states the potential problems for the givenTime Summary Level.
1.1.2 Classification of key performance indicators
The KPIs are first grouped into four different levels. They are the following:
• Access network• RNC function• Transport Resource Manager• Access point
For more information on the KPI levels, see Different KPI levels.
Under each level, the KPIs are grouped into the following categories:
• Accessibility• Retainability
WCDMA RAN Key Performance Indicators Introduction to WCDMA RAN Key PerformanceIndicators
Issue: 08 DN05191189 17

• Usage• Mobility• Integrity
The KPIs are grouped according to these categories in each release. Each KPIdescription also includes the KPI class.
Within a class there can be certain KPIs that include an additional classification.
UsageThere are the following additional classifications for the Usage category:
• Resource capacity-based KPIs• Resource availability-based KPIs• HW resource-based KPIs• Resource allocation KPIs• Load-based KPIs• Throughput-based KPIs• Transmission load-based KPIs• Duration-based KPIs
MobilityThere are no additional classes but for each KPI it should be considered whether the KPIis related to the source and/or target cell.
IntegrityThere is the following additional class for the Integrity category:
• Error rate-based KPIs• Radio Interference based KPIs
1.1.3 Network and user key performance indicators
There are some KPIs defined for the same issue but from two different viewpoints, thatis, network and user viewpoints.
For such KPIs the differentiation is done in the KPI Name, for example, RRC Setup andAccess Complete Ratio, from network perspective.
1.1.4 Summary of different KPI viewpoints
The following figure illustrates the different KPI viewpoints.
Introduction to WCDMA RAN Key PerformanceIndicators
WCDMA RAN Key Performance Indicators
18 DN05191189 Issue: 08

Figure 1 KPI viewpoints
USER KPIs
KPIClass
Accessibility
Retainability
Mobility
Integrity
Usage
Retainability
Accessibility
KPI�Class NETWORK KPIs
RRC�signaling�related�to�a�UE
L3�signaling�related�to�a�UE
L3�Signaling�Measurements[14], [15]
RRC�Signaling�Measurement
KPIOutcome
RAB�Success�orFailure�Rate
RAB/HSDPASuccess�orFailure�Rate
RB�Quality
[2]
PC�related�to�a�UE
HC�related�to�a�UE
PS,�RM�related�to�a�UE
[4],�[5],�[6]
[2], [3], [17]
[2],�[3],�[7],�[17],�[20]
[8], [11], [12] [26]
[2], [3], [7]
availability
amounts
Measured�error�ratesEfficiency
TargetCell
Call�/RAB/HSPASuccess�Rate
UsageInterfaceAvailability
Plannederrorrates
Call�/RAB/HSPASuccess�RateRNS�ChangeSuccess�Rate
SourceCell
User Allocations
RB/AAL2/IP Allocations
Cell/lu-PS Traffic
RB/lub/ATM/IP Throughput
Resource�availability
Cell�Power�levels
Transport�capacityload
Allocations
Allocations
Throughput
WCELL
CE
Power
Capacity
User
Data
Logical�resource
HW�resource
Radio
Transport
[21]�[22]
[3]�[10]�[24]
[8]�[11]�[16]�[23]�[25]
[1]
[13]
[1]
[9]
HO�Success�orFailure�Rate
The numbers in the center part of the figure stand for the following RAN measurements:
[1] Cell Resource
[2] Service Level
[3] Traffic
[4] Intra System HHO
[5] Soft HO
[6] Inter System HHO
[7] LCS
WCDMA RAN Key Performance Indicators Introduction to WCDMA RAN Key PerformanceIndicators
Issue: 08 DN05191189 19

[8] Radio Connection Performance Measurement RLC AM
[9] AAL2 Resource Res.
[10] AAL2 Path CAC Res.
[11] HSDPA in WBTS
[12] Radio Connection Performance Measurement OLPC
[13] WBTS HW Resource Measurement
[14] L3 Signaling at Iu Measurement
[15] L3 Signaling at Iur Measurement
[16] IU-PS Performance
[17] Packet Call Measurement
[18] Cell Throughput Measurement
[19] DSP Performance in RNC (until RAS06)
[20] L3 Relocation Signaling Measurement
[21] RNC Capacity Usage Measurement
[22] DSP Performance in DSP Service Statistics
[23] Frame Protocol in WBTS
[24] RNC IP CAC Measurement
[25] IP Route Measurement
[26] Radio Connection Performance Measurement UEQ
The two pyramids in the figure illustrate the two perspectives: the network perspective,and the user perspective, that is, the distinction between network and user KPIs.
• In the upper pyramid you can see the RAN functionalities and the related RANstatistical measurements from the user equipment (UE) perspective.
• The lower (inverted) pyramid shows the RAN functionalities and the related RANstatistical measurements from the network perspective.
The column on the left shows the classification of the KPIs (KPI Class).
In the center part (column), you can see the related RAN measurements. The KPIs arebased on the counters found in the RAN measurements. The reference mark for ameasurement, for example, Cell Resource [1] indicates that a KPI has been defined forthat measurement. The KPI with the required information is described in thisdocumentation set. For counter (and detailed measurement) descriptions ofmeasurements 1-8, 12, 14-18, 20-21 and 26, see RNC Counters - RNW Part. For
Introduction to WCDMA RAN Key PerformanceIndicators
WCDMA RAN Key Performance Indicators
20 DN05191189 Issue: 08

information on measurements 9-10, 19, 22 and 24-25, see RNC Counters - Transportand HW Part. For information on measurement numbers 11, 13 and 23, see WBTSCounters.
In the center part, you can also see the contradictions inside the KPI classes (thedifferent angles in a pyramid layer):
• Usage
– The availability of resources versus the allocation of the available resources.– The load of allocated resources versus the gain (throughput).– The data amounts versus the gain (throughput).
• Mobility
– Handover in the Source Cell versus the Target Cell
• Integrity
– Planned error rates versus achieved error rates
The right column shows the KPI outcome, that is, the issues that the KPI indicates.
• Amount of statistical data related to the defined KPIs and classes: When you godown the pyramid, the amount of data increases.
• Importance of each KPI and KPI class: The top of each pyramid represents the mostessential data.
• Visibility of KPIs in monitoring: The top layers of a pyramid become visible before thelower layers.
1.2 Calls in WCDMA RANThe 3GPP specifications define the 'call' as follows: 'a logical association betweenseveral users (this could be connection oriented or connectionless)'. This definition is notuseful when you are measuring the call setup and releases in the (RAN part of the)network and/or user perspective. Therefore, you must further define the overall andUTRAN-related 3GPP definitions to be able to make call-related key performanceindicators (KPI).
1.2.1 Definition of call from the WCDMA RAN perspective
The general UMTS architecture defined by 3GPP places RAN (and BSS) in the AccessDomain and it functions as a part of the Access Stratum. The NSS and packet core(PaCo) belong to the Core Network Domain (through the underlaying Serving NetworkDomain) and their functions are part of the Serving Stratum.
WCDMA RAN Key Performance Indicators Introduction to WCDMA RAN Key PerformanceIndicators
Issue: 08 DN05191189 21

Figure 2 General UMTS Architecture
HomeNetworkDomain
USIMDomain
MobileEquipment
Domain
AccessNetworkDomain
UserEquipment Domain
CoreNetworkDomain
InfrastructureDomain
ServingNetworkDomain
TransitNetworkDomain
Cu Uu lu
[Zu]
[Yu]
The Access Domain and Core Network Domain form the Infrastructure Domain. TheMobile Terminal (MT) and USIM form the User Equipment (UE) and the UE Domain.
The interface (reference point) between the Access and Serving Network Domain isdefined as Iu. The interface (reference point) between the UE and the InfrastructureDomain is defined as Uu (=UMTS Radio Interface). There is a direct interface betweenthe UE and Infrastructure Domain. The 'interface' is handled by sending messages overthe Access Stratum, but the messages are treated transparently by RAN. There themessages are on the 'Non-Access Stratum' from the RAN perspective.
The Access Stratum is defined as follows: 'The access stratum provides services relatedto the transmission of data over the radio interface and the management of the radiointerface to the other parts of UMTS'.
The Serving Stratum (that is transparent to RAN) consists of protocols and functionsneeded to route and transmit data/information (user or network-generated) from thesource to the destination.
Because the Access Stratum is under the Serving Stratum, everything that occursbetween the source and destination (the UEs and/or Servers) is transparent to RAN.Therefore, in RAN, you are restricted to the visible services and their relationships tocalls made in the Service Stratum.
The Network Services are found in the generic QoS architecture in the 3GPPspecifications about QoS.
Introduction to WCDMA RAN Key PerformanceIndicators
WCDMA RAN Key Performance Indicators
22 DN05191189 Issue: 08

Figure 3 QoS Architecture
CNGateway
CNEDGENODE
End-to-End�Service
UMTS�Bearer�ServiceExternal
Bearer�Service
Radio AccessBearer�Service
CN�BearerService
RAN AccessBearer�Service
BackboneBearer�Service
TE/MT LocalBearer�Service
RadioBearer�Service
PhysicalBearer�Service
Physical�RadioBearer�Service
TE MT RAN TE
UMTS
The services defined (from top-down) are End-to-End, UMTS Bearer, Radio AccessBearer (RAB), Radio Bearer (RB) and physical bearer services. The services that arevisible (and handled) by the RAN are the RAB, RB, and physical bearer services. TheRAB provides services in the Iu interface and the RB (and physical bearer) providesservices in the Uu interface. The QoS Architecture includes the parameters for theservices and the mappings between the services. The defined parameters help to findthe relationships of the call to each service (layer). The defined calls (and how they arederived from the QoS parameters) are as follows:
• Voice: Traffic Class = Conversational; Source Statistics Descriptor = Voice. Otherparameters are not relevant.
• UDI: Traffic Class = Conversational; Source Statistics Descriptor = Unknown. Otherparameters are not relevant.
• Streaming 'call': Traffic Class = Streaming. Other parameters are not relevant.
t The streaming 'call' can be asked by both core domains.
• Packet 'call': Traffic Class = Interactive or Background. Other parameters are notrelevant.
There can be more than one call, for example, RAB for one user (UE).
The 3GPP specifications about Access Stratum define how RAN provides the services.
WCDMA RAN Key Performance Indicators Introduction to WCDMA RAN Key PerformanceIndicators
Issue: 08 DN05191189 23

Figure 4 Service Access Points offered by the Access Stratum
NAS
UE
GC Nt DC
AS
GC Nt DC
UE-Uu
NAS
Edge�node
GC Nt DC
AS
GC Nt DC
CN-Iu
RAN
GC Nt DC
IF-Uu
RNC�Functions
GC Nt DC
RAN-IuUu�Svcs:e.g.,�RRC
Iu�Svcs:e.g.,RANAP
Infrastructure�SideUser�Equipment�Side
=�SAPs
The services are provided through Service Access Points (SAP). From the service (orcall) perspective, the relevant services are (set of operations):
• UE Initiated Connection Establishment• Connection Release• IF Side initiated Radio Access Bearer Establishment• IF Side initiated Radio Access Bearer Release
This means that in addition to RAB and RB, also other factors are relevant. From the callperspective, the connection to RAN is essential, that is, the user needs an access pointto use UTRAN services.
The UTRAN Access Point for UEs (to the SAPs), such as UTRAN Cell, is defined in3GPP specifications about UTRAN. If the UE has access to UTRAN, it has the possibilityto use the reference points (interfaces, see 3GPP specifications about UMTSarchitecture) by using the defined protocols. Likewise, in the SAP division (connectionestablishment/release and RAB establishment/release) there is an important split inmanaging the connection (such as Control plane) and in managing the service (such asUser plane).
Introduction to WCDMA RAN Key PerformanceIndicators
WCDMA RAN Key Performance Indicators
24 DN05191189 Issue: 08

Figure 5 Iu and Uu User plane
Non-Access�Stratum
Radioprotocols
(1)
Radioprotocols
(1)
Iuprotocols
(2)
Access�Stratum
UE UTRAN CNRadio(Uu)
Iu
Iuprotocols
(2)
Figure 6 Iu and Uu Control plane
Non-Access�Stratum
Radioprotocols(1)
Radioprotocols(1)
Iuprotocols(2)
Access�Stratum
UE UTRAN CNRadio(Uu)
Iu
Iuprotocols(2)
CM,�MM,GMM,�SM�(3)
CM,�MM,GMM,�SM�(3)
The Control and User plane are handled through protocols that are defined in 3GPPspecifications about UTRAN.
User plane protocolsThese protocols implement the actual radio access bearer service.For example, they carry user data through the access stratum.
Control plane protocolsThese protocols control the radio access bearers and the connectionbetween the UE and the network for different functions (includingrequesting the service, controlling different transmission resources,controlling handovers and streamlining.) A mechanism for thetransparent transfer of NAS messages is also included.
The Radio and Iu protocols:
• Radio interface and Iu interface protocols are found in 3GPP specifications aboutUTRAN.
• CM, MM, GMM, SM: This is an example of a set of NAS control protocols betweenthe UE and CN. There may be different NAS protocol stacks in parallel.
WCDMA RAN Key Performance Indicators Introduction to WCDMA RAN Key PerformanceIndicators
Issue: 08 DN05191189 25

The connection between the UE and a UTRAN Access Point is the Radio Link (RL),defined in 3GPP specifications about UTRAN. If the UE has access to more than oneUTRAN Access points, then it has more than one RLs.
Call definitionThe following definition can be given for a call: The time when the RAB uses RB(s)having non-zero bit rate (signalling RBs are not taken into account). This means thateither dedicated or shared transport channel is allocated for user plane traffic.
From the RAB perspective, this definition means that a RAB and a call can be the samething but alternatively one RAB can handle more than one call.
1.2.2 Call Setup Success rates (CSSR) in NSN-based WCDMARAN
The UE has access to RAN services through the UTRAN Access Point, that is, UTRANCell. It does this by using the (radio) RRC protocol procedure RRC ConnectionEstablishment. The RRC protocol is part of the Radio Interface Protocol architecturedefined by the 3GPP. The RRC protocol procedure RRC Connection Establishment isdescribed in 3GPP specifications about Radio Resource Control.
The first part of the Call Setup Success Rate KPI is the success rate of setting up therelated RRC Connection for the call. When looking at the relationship between the RRCand the required service for the desired call, some problems can be found.
• The setup causes for the RRC do not, in most cases, indicate precisely what kind ofservice/call is to follow.
• The service or call that follows the connection setup is not necessarily set upsimultaneously with the RRC. This means the service or call that uses non-real time(NRT) type of transmission.
Therefore, some additional definitions and assumptions are needed to be able to definethe RRC Setup part of the CSSR KPIs for the following call types:
• Voice: Because the RRC Setup Causes 'Mobile Originated Call Conversational' and'Mobile Terminated Call Conversational' do not specify whether the call attempt isAMR or UDI, we must use these causes in CSSR KPI for both AMR and UDI.
• UDI: See Voice.• Streaming ‘Call’: There are unambiguous setup causes for this.• Packet 'Call': The 3GPP has not clearly defined how to start a packet 'call'. For this
reason, it is extremely difficult to define on the basis of counters all the times when apacket call setup starts. In practice, almost every given cause in the RRC setup canlater result in a packet call setup, if the RRC connection is kept alive. Here, it isconsidered that only clear indications for the following packet calls can be used.Therefore, 'interactive' and 'background' causes have been selected for the RRC partof Packet Call CSSR formulas.
After the RRC Connection (and the RL) are established, the RAN Services (RAB andRB) are still missing from a complete call setup. Some extra definitions are also neededfor the call types Streaming ‘Call’ and Packet 'Call'.
Introduction to WCDMA RAN Key PerformanceIndicators
WCDMA RAN Key Performance Indicators
26 DN05191189 Issue: 08

The reason for this is that even if the RAB Services and the RB Services are initiatedthrough the defined Access Stratum SAP (defined in 3GPP UTRAN specifications aboutUTRAN) with RANAP: RAB ASSIGNMENT REQUEST or RANAP: RELOCATIONREQUEST procedure, it is possible that the RB Service is not needed at this phase. (Theused Iu procedure is defined in the 3GPP specifications on the UTRAN Iu interfaceRANAP signalling, and RANAP is defined in the 3GPP specifications on Radio InterfaceProtocol architecture).
In other words, there is no data to transmit/receive. So, the RB is set up with any trafficcarrying capability.
Therefore, for Streaming ‘Calls’ and Packet 'Calls' you – in principle - should not followthe service setup in the CSSR KPIs, but the Packet session setup success rates (SSSR)for Streaming and Packet (packet session is defined in 3GPP specifications about radiotransmission technologies). When the session is set up, it means that there is data to bereceived or to be sent. The packet session setup is here considered to be the point whenthe reservation of a transport channel starts. The available transport channels aredefined in the 3GPP specifications about Radio Interface Protocol architecture.
This document gives both CSSR KPIs for all call/service types and a common SSSR KPIfor all sessions combined. When needed the reporting tools can produce separate SSSRKPIs for each ‘call’ type.
g In multi-vendor networks, some vendors do not use the Source Descriptor Voiceparameter. Other radio access bearer (RAB) parameters, such as bit rate, canbe used to distinguish if the conversational class is Voice.
The basic structure of the proposed CSSR KPIs per call type is as follows:
1. AMR CSSR: (Successful RRC setups (MOC Conversational + MTC Conversational +Emergency Call) * Successful RAB setups for Conversational with Source Descriptor= Voice) / (All RRC setup attempts (MOC Conversational + MTC Conversational +Emergency Call) * All RAB setup attempts for Conversational with Source Descriptor= Voice)
g In multi-vendor networks, some vendors do not use the Source DescriptorVoice parameter. The other radio access bearer (RAB) parameters, such asbit rate, can be used to distinguish if the conversational class is Voice.
2. UDI CSSR: (Successful RRC setups (MOC Conversational + MTC Conversational) *Successful RAB setups for Conversational with Source Descriptor = Unknown) / (AllRRC setup attempts (MOC Conversational + MTC Conversational + Emergency Call)* All RAB setup attempts for Conversational with Source Descriptor = Unknown)
3. Streaming Service CSSR: Streaming Session-based SSSR: (Successful RRC setups(MOC Streaming + MTC Streaming) * Successful Streaming Session setups forStreaming) / (All RRC setup attempts (MOC Streaming + MTC Streaming) * AllStreaming Session setup attempts for Streaming)
4. Packet Service CSSR: (Successful RRC setups (MOC Interactive + MTC Interactive+ MOC Background + MTC Background) * Successful Packet Session setups forInteractive or Background traffic) / (All RRC setup attempts (MOC Interactive + MTCInteractive + MOC Background + MTC Background) * All Packet Session setupattempts for Interactive or Background traffic)
WCDMA RAN Key Performance Indicators Introduction to WCDMA RAN Key PerformanceIndicators
Issue: 08 DN05191189 27

5. Packet Session SSSR: (Successful Packet Session setups for Streaming, Interactiveor Background traffic) / (All Packet Session setup attempts for Streaming, Interactiveor Background traffic)
For full CSSR and SSSR KPI definitions, see Access network level indicators foraccessibility.
For an overview on WCDMA RAN KPIs, see Overview of WCDMA RAN keyperformance indicators.
1.2.3 Call Success Rates (CSR) in NSN-based WCDMA RAN
A call is released by the CN with either RANAP:RAB ASSIGNMENT REQUEST orRANAP: IU RELEASE COMMAND (defined in 3GPP specifications about UTRAN Iuinterface RANAP signalling). The release can be a normal release or a drop.
A call is dropped if one (or more) of the needed parts, such as RAB, RB or RL drops.When we build up CSR KPIs, the following must to be considered:
• The Packet Call drop is different than the other call type drops.• The difference between a normal call release and drop is not always clear.
First of all, the RAB(s), RB and RL for AMR, UDI and Streaming Call calls are so closelytied together that it can be said that if one of these drops, it is visible as a drop in theother two parts. You can quite safely say that all AMR, UDI or Streaming Call drops canbe seen directly by the RAB service drop.
Again, for the Packet 'Call', note that the RAB service can still exist even if the RB and/orRL drops. Therefore, you should follow the Packet Session as the key point for Packet'call' drops similarly to the CSSRs.
This document gives both CSR KPIs for all call/service types and a common SSR KPI forall sessions combined. When needed the reporting tools can produce separate SSRKPIs for each ‘call’ type.
The basic structure of the proposed CSR KPIs per call type is as follows:
1. AMR CSR: 100 - (Abnormal RAB releases for Conversational with Source Descriptor= Voice / All RAB releases for Conversational with Source Descriptor = Voice)
2. UDI CSR: 100 - (Abnormal RAB releases for Conversational with Source Descriptor= Unknown / All RAB releases for Conversational with Source Descriptor =Unknown)
3. Streaming Call CSR: 100 - (Abnormal RAB releases for Streaming / All RAB releasesfor Streaming)
4. Packet 'Call' CSR: 100 – (Abnormal Packet Service releases for Interactive orBackground traffic / All Packet Service releases for Interactive or Background traffic)
5. Session SSR: 100 – (Abnormal Packet Session releases for Interactive orBackground traffic / All Packet Session releases for Interactive or Background traffic)
g Call Drop Rate (CDR) = 1 - CSR
For full CSR KPI definitions, see Access network level indicators for retainability.
For an overview on WCDMA RAN KPIs, see Overview of WCDMA RAN keyperformance indicators.
Introduction to WCDMA RAN Key PerformanceIndicators
WCDMA RAN Key Performance Indicators
28 DN05191189 Issue: 08

For typical values for WCDMA RAN KPIs, see Available WCDMA RAN key performanceindicators.
1.3 Resource usage in NSN-based WCDMA RANThe basic setup and release of a 'call' from the perspective of WCDMA RANimplemented by NSN was covered in Calls in WCDMA RAN. This helps with definingmeaningful 'call'-based setup success and release KPIs.
As pointed out earlier, the 3GPP specifications are rather vague in regard to establishing,maintaining and releasing the related service(s) – the WCDMA RAN-related Bearerservices illustrated by the figure QoS architecture - for the ‘calls’.
This means that there are (usually) multiple possibilities for handling resources inside a'call'.
The main issues related to WCDMA RAN resource reservation for different Bearerservices are summarized here. They are followed up with the given KPIs later in thedocument.
1.3.1 Principles for resource reservation related to services
Generally speaking there are both similarities and differences in the resource reservationbetween different requested WCDMA RAN services.
The similarities are related to the way the needed resources are established, maintainedand released. Usually the same external and internal procedures are utilized.
The differences are related to the nature of the needed service. RT services constantlyneed resources (bandwidth) whereas the NRT services do not need resources all thetime.
RT Services vs. needed ResourcesThe RT service resources discussed in the KPIs can be related to establishing,maintaining and/or releasing the entire RAB or the ‘Packet Session’, that is, HSPA (HS-DSCH or E-DCH) or R99 (DCH) transport channels for the RB.
g Currently it is not possible to establish ‘Packet Sessions’ for ConversationalTraffic Class (‘Speech’ or ‘UDI’) RABs.
NRT Services vs. needed ResourcesThe NRT service resources discussed in the KPIs can be related to establishing,maintaining and/or releasing the entire RAB or the ‘Packet Session’, that is, HSPA (HS-DSCH or E-DCH) or R99 (DCH) transport channels for the RB.
1.3.2 RAB Setup and Access Complete Rates
The KPIs defined in this document cover the needed reservation procedures of Uu(radio) interface, Access Point (for example, power), BTS function (for example, ChannelElements) and RNC function (for example, Iu user plane) resources.
WCDMA RAN Key Performance Indicators Introduction to WCDMA RAN Key PerformanceIndicators
Issue: 08 DN05191189 29

RT RAB Setup and Access Complete Rate KPIsAt RT RAB setup, all resources are reserved for all needed Bearer Services.
NRT RAB Setup and Access Complete Rate KPIsAt NRT RAB setup, the resources needed for the Radio Access Bearer Service, RANAccess Bearer Service, and the Physical Bearer service are reserved.
The Radio Bearer and the Physical Radio Bearer Services are only established. Noresources are reserved.
1.3.3 RAB Success Rates
The KPIs defined in this document cover the needed release procedures of Uu (radio)interface, Access Point (for example, power), BTS function (for example, ChannelElements) and RNC function (for example, Iu user plane) resources.
RT RAB Success Rate KPIsAt RT RAB release, all resources are released for all needed Bearer Services.
NRT RAB Success Rate KPIsAt NRT RAB release, all resources are released for all needed Bearer Services.
1.3.4 Packet Session/HSPA Setup Success Rates
At Packet Session setup related to HSPA, all the Bearer Services are already available.
The KPIs defined in this document cover the needed reconfiguration procedures of Uu(radio) interface, Access Point (for example, power), BTS function (for example, ChannelElements) and RNC function (for example, HSPA user reservation) resources.
RT HSPA Setup Success Rate KPIsAt RT HSPA-related Packet Session setup, the resources needed for Radio Bearer andPhysical Radio Bearer Services are reconfigured.
NRT HSPA Setup Success Rate KPIsAt NRT HSPA-related Packet Session setup, the resources needed for Radio Bearer andPhysical Radio Bearer Services are reconfigured.
1.3.5 Packet Session/HSPA Success Rates
At Packet Session release related to HSPA, all the Bearer Services will be kept, that is,only reconfigurations related to used HSPA-specific resources are released.
The KPIs defined in this document cover the needed reconfiguration procedures of Uu(radio) interface, Access Point (for example, power), BTS function (for example, ChannelElements) and RNC function (for example, HSPA user release) resources.
Introduction to WCDMA RAN Key PerformanceIndicators
WCDMA RAN Key Performance Indicators
30 DN05191189 Issue: 08

RT HSPA Success Rate KPIsAt RT HSPA-related Packet Session release, the resources needed for Radio Bearer andPhysical Radio Bearer Services are reconfigured.
NRT HSPA Success Rate KPIsAt NRT HSPA-related Packet Session release, the resources needed for Radio Bearerand Physical Radio Bearer Services are reconfigured.
1.3.6 Packet Session/R99 Setup Success Rates
At Packet Session setup related to R99, all Bearer Services are already available.
The KPIs defined in this document cover the needed reconfiguration procedures of Uu(radio) interface, Access Point (for example, power), BTS function (for example, ChannelElements) and RNC function (for example, R99 user reservation) resources.
RT R99 Setup Success Rate KPIsAt RT R99-related Packet Session setup, the resources needed for Radio Bearer andPhysical Radio Bearer Services are reconfigured.
NRT R99 Setup Success Rate KPIsAt NRT R99-related Packet Session setup, the resources needed for Radio Bearer andPhysical Radio Bearer Services are reconfigured.
1.3.7 Packet Session/R99 Success Rates
At Packet Session release related to R99, all Bearer Services will be kept, that is, onlyreconfigurations related to the used R99-specific resources are released.
The KPIs defined in this document cover the needed reconfiguration procedures of Uu(radio) interface, Access Point (for example, power), BTS function (for example, ChannelElements) and RNC function (for example, HSPA user release) resources.
RT R99 Success Rate KPIsAt RT R99-related Packet Session release, the resources needed for Radio Bearer andPhysical Radio Bearer Services are reconfigured.
NRT R99 Success Rate KPIsAt NRT R99-related Packet Session release, the resources needed for Radio Bearer andPhysical Radio Bearer Services are reconfigured.
1.4 Different KPI levelsThe following topics have been discussed in chapters Calls in WCDMA RAN andResource usage in NSN-based WCDMA RAN:
• the basic setup and release of ‘call’ from the perspective of WCDMA RANimplemented by NSN to be able to define meaningful ‘call’-based setup success andsuccess KPIs.
WCDMA RAN Key Performance Indicators Introduction to WCDMA RAN Key PerformanceIndicators
Issue: 08 DN05191189 31

• the basic principles to understand about WCDMA RAN service-related resourcereservation call’ from the perspective of a WCDMA RAN implemented by NSN todefine meaningful ‘service’-based setup success and success KPIs.
In this chapter a KPI leveling view is created in relation to the UMTS and QoSarchitectures presented earlier.
KPI leveling is needed to quickly see the relevant (most important) network levels for KPIfollow-up.
1.4.1 Principles of using defined UMTS architecture
The defined UMTS architecture for Access Network Domain includes external interfacestowards both Mobile Equipment Domain (part of user Equipment Domain) and ServingNetwork Domain (part of Infrastructure Domain as well as the Access Network Domain).
The interface towards Mobile Equipment Domain is called Uu and the interface towardsServing Network Domain is called Iu.
Inside the RAN there is an RNC function that has internal interfaces related to capacityreservation towards the external domain interfaces.
The transport resources (ATM or IP) are not managed directly by the RNC function.Instead they are managed by the Transport resource manager (TRM).
Finally, there is the UTRAN Access point (WCELL) for managing the Radio Link betweenthe UE and UTRAN.
The following are the used KPI leveling principles based on UMTS Architecture view:
• If both of the external interfaces - Uu and Iu -are related to the defined KPI then it ison the highest level from the UMTS architecture perspective.
• If either of the external interfaces - Uu or Iu - are related to the defined KPI then it ison the second level from the UMTS architecture perspective.
• When dealing with RNC function-managed internal interfaces towards either one ofthe external interfaces, the defined KPI is on the third level from the UMTSarchitecture perspective.
• The TRM-related KPIs are found on the fourth level from the UMTS architectureperspective.
• Finally, the UTRAN Access Point (WCELL)-related issues are on the fifth level fromthe UMTS architecture perspective.
1.4.2 Principles of using defined QoS architecture
The needed KPI levels from the UMTS architecture perspective were listed in theprevious section.
The QoS architecture only provides additional details to the needed KPI levels.
1.4.3 Access network level KPIs
The defined access network level-KPIs in this document cover the external interfaces ofthe access network towards either the Uu or Iu interface or both interfaces.
Introduction to WCDMA RAN Key PerformanceIndicators
WCDMA RAN Key Performance Indicators
32 DN05191189 Issue: 08

UMTS architecture view: When the KPIs of this level are used, they follow up actions ofinterest between the Mobile Equipment Domain and/or the Service Network Domain fromthe perspective of the Access Network Domain.
QoS architecture view: When the KPIs of this level are used, they give success ratesrelated to 'call' and LCS services.
‘Calls’ are visible in the defined bearer architecture but the LCS utilizes the control plane.Thus, it is not visible in the bearer architecture.
Furthermore, the KPIs of this level provide additional success rates related to UEnetwork connection, Radio Access Bearer Service(s), incoming Serving Radio Networksubsystem change (SRNS) and outgoing Hard Handovers to either another SRNS (Intra-System or Inter-Frequency HHO) or other radio access system (Inter-System HHO).
Radio Access Bearer Service(s) are visible in the defined bearer architecture but theother access network level KPIs are not visible in the bearer architecture.
The following KPI types are related to this KPI level:
• CSSR KPIs• CSR KPIs• SSSR - for all combined sessions - KPIs• SSR - for all combined sessions - KPIs• LCS setup KPIs• RRC Setup and Access Complete Rate KPIs• RRC Success Rate KPIs• RAB Setup and Access Complete Rate KPIs• RAB Success Rate KPIs• Serving Radio Network Subsystem (SRNS) Accessibility KPIs• CS Service duration KPIs
– CS Service minutes– CS Service minutes until drop– Average CS Erlang
• PS Duration KPIs
– NRT RAB duration– NRT Sessions Duration
• Hard Handover Success Rate KPIs
– ISHO-related found target cell rate in other Access Network– IFHO and ISHO success rates
1.4.4 RNC function level KPIs
The defined KPIs of the RNC function level cover the internal interfaces of the accessnetwork towards either Uu or Iu interface.
UMTS architecture view: When the KPIs of this level are used, they follow up actions ofinterest between either the Mobile Equipment Domain or Service Network Domain fromthe perspective of the Access Network Domain.
WCDMA RAN Key Performance Indicators Introduction to WCDMA RAN Key PerformanceIndicators
Issue: 08 DN05191189 33

QoS architecture view: When the KPIs of this level are used, they give success ratesrelated to Packet Sessions, availability of internal and external logical interfaces,resource request amounts, resource user numbers, reserved capacity numbers andconsumed capacity numbers.
Packet Session(s) are visible in the defined bearer architecture but the other KPIs of theRNC function level are not visible in the bearer architecture.
The following KPI types are related to this KPI level:
• Packet Session Setup Success (SSSR) KPIs• Packet Session Success (SSR) KPIs• Requested RRC Connection attempt number KPIs• Requested Service attempt number KPIs• Requested Packet Session attempt number KPIs• Requested SRNS Relocations• Requested Handover attempt number KPIs• RNC logical resource availability KPIs
– Iu interface Availability– Iur interface Availability
• RNC user resource number KPIs
– HSPA (peak) user numbers– RRC (peak) user numbers
• RNC Iu (and Iur) Interface Capacity KPIs
– Iu-PS data volume– Iu-PS throughput
• RNC BTS interface Capacity KPIs
– Allocated R99 Capacity– HSUPA data volume
• Soft Handover Capacity KPIs
– Soft Handover Overhead
• Hard Handover Capacity KPIs
– Inter System HHO related UE measurement numbers
1.4.5 Transport Resource Manager level KPIs
The defined KPIs of the Transport Resource Manager level in this document cover theexternal and internal transport interfaces of the access network.
UMTS architecture view: When the KPIs of this level are used, they follow up actions ofinterest between the Servicing Network Domain and the Access Network Domain or fullyinside the Access Network Domain.
QoS architecture view: When the KPIs of this level are used, they give availability rates,load levels and data volumes of internal transport services.
Introduction to WCDMA RAN Key PerformanceIndicators
WCDMA RAN Key Performance Indicators
34 DN05191189 Issue: 08
The KPIs of the TRM level are not visible in the bearer architecture.
The following KPI types are related to this KPI level:
• Reserved transport bandwidth KPIs• Available transport bandwidth KPIs• Transport Interface volume KPIs• Transport Interface throughput KPIs• Transport Interface load KPIs
1.4.6 Access point-level KPIs
The defined Access point level KPIs in this document cover the external and internalinterfaces of access network towards Uu interface.
UMTS architecture view: When the KPIs of this level are used, they follow up actions ofinterest between the Mobile Equipment Domain and the Access Network Domain or fullyinside the Access Network Domain.
QoS architecture view: When the KPIs of this level are used, they give availability ratesand reservation numbers of logical or physical resources and RL-specific issues for datavolumes and error rates.
The access point level-KPIs are not visible in the bearer architecture.
The following KPI types are related to this KPI level:
• HW resource KPIs
– Channel Element availability– Channel Element utilization
• Radio Load KPIs
– Access Point noise level– R99 UL and DL load– HSPA DL load– HSPA UL load
• Logical resource Availability KPIs
– Cell Availability– SF blocking rate
• Peak Resource Reservation Numbers• HSPA Scheduler resource utilization KPIs• Soft Handover Success Rate KPIs• Hard Handover Success Rate KPIs
– HSPA serving Cell Change Success
• Radio layer capacity KPIs
– RLC layer throughputs– MAC layer data volumes– MAC layer active data throughput
WCDMA RAN Key Performance Indicators Introduction to WCDMA RAN Key PerformanceIndicators
Issue: 08 DN05191189 35

– FP layer data volumes
• Block Error Rate KPIs
– Service UL and DL– HSDPA efficiency– HSUPA BLER
• Radio interface transmission utilization KPIs
1.5 System Program ReportAll KPIs defined in this document are important basic network level KPIs for a WCDMARAN network. In addition to the KPIs defined in this document there are also variousKPIs needed for additional purposes found in different reporting tools.
When extensive (daily or weekly) follow-up is needed, the number of KPIs needs to bereduced.
For this purpose a System Program report is created on basis of the WCDMA RANrelease.
1.5.1 Principles of System Program Report
The System Program report follows the same structures (KPI levels and KPI classes) asused elsewhere in this document.
All KPIs of the access network level are part of the report.
Only some of the defined KPIs from the other KPI levels are needed for the report.
For the KPIs related to the System Program Report, typical measured values are givenwhen available. The value is either based on the measured performance in the livenetwork or the maximum receivable values measured in a laboratory environment.
1.5.2 System Program Report content
The performance targets given in the following table are the average targets for a cellcluster. Performance of an individual cell may differ from the given values.
g Changes in measurements, calculation formulas, and/or used counters affectthe listed key performance indicator (KPI) values.
g The specified targets are not accurate if the load in the network is too low. Theload in the network is too low if the average number of calls per cell is lowerthan (x) during a busy hour.
g The specified targets are not accurate if the load in the network is higher thanthe planned target load of the network, or if the actual traffic mix differsconsiderably from the plan.
The following table lists the KPIs that are related to System Program Report according toagreed classification.
Introduction to WCDMA RAN Key PerformanceIndicators
WCDMA RAN Key Performance Indicators
36 DN05191189 Issue: 08

Table 1 WCDMA RAN KPIs related to System Program Report
KPI Level
KPI Class
KPI ID
Indicates
Availablesince
LiveNetworkTypicalMeasuredValue
Access network Accessibility RNC_20b RRC Connectionsetup success ratio
RAN1.5.2ED
>=RNC_94e
Access network Accessibility RNC_94e RRC Setup andAccess CompleteRatio, from NetworkPerspective
RAN04 > 98.5 %
Access network Accessibility RNC_154d RRC Setup andAccess CompleteRatio
RAN04 > 99%
Access network Accessibility RNC_219a Registration Success RAN1.5.2ED
>=RNC_94e
Access network Accessibility RNC_565f Voice Call SetupSuccess Ratio(CSSR)
RAN05 > 99.2%
Access network Accessibility RNC_5093b Voice Call SetupSuccess Ratio(RRC+CU)
RU30 EP1 -
Access network Accessibility RNC_30a RAB Setup andAccess CompleteRatio for Voice
RAN1.5.2ED
> 99.6%
Access network Accessibility RNC_566e UDI Call SetupSuccess Ratio(CSSR)
RAN05 > 99%
Access network Accessibility RNC_31a RAB Setup andAccess CompleteRatio for UDI
RAN1.5.2ED
> 99.5%
Access network Accessibility RNC_575d Streaming Call SetupSuccess Ratio(CSSR)
RAN05 > 98%
Access network Accessibility RNC_618a RAB Setup andAccess CompleteRatio for Streaming
RAN1.5.2ED
> 99.5%
Access network Accessibility RNC_576e Packet Service SetupSuccess Ratio(CSSR)
RAN05 > 99.5%
WCDMA RAN Key Performance Indicators Introduction to WCDMA RAN Key PerformanceIndicators
Issue: 08 DN05191189 37

Table 1 WCDMA RAN KPIs related to System Program Report (Cont.)
KPI Level
KPI Class
KPI ID
Indicates
Availablesince
LiveNetworkTypicalMeasuredValue
Access network Accessibility RNC_157a RAB Setup andAccess CompleteRatio for NRT Service
RAN1.5.2ED
> 99.7%
Access network Accessibility RNC_916b Packet Session SetupSuccess Ratio(SSSR)
RAS06 N/A
Access network Accessibility RNC_741b Multi RAB Setup andAccess Success Rate
RAN04 =RNC_575d
Access network Retainability RNC_217f RRC Success Ratio RAN1.5.2ED
> 99.5%
Access network Retainability RNC_231d RAB Success Ratio,Voice (CSR)
RAN1.5.2ED
> 99.5%
Access network Retainability RNC_232e RAB Success Ratio,UDI (CSR)
RAN1.5.2ED
> 99%
Access network Retainability RNC_619b RAB Success Ratio,Streaming (CSR)
RAN1.5.2ED
> 99%
Access network Retainability RNC_736b RAB Success Ratio,NRT Services
RAN04 > 99%
Access network Retainability RNC_615c RAB Success Ratio,NRT Services, fromNetwork Perspective
RAN04 > 95-99 %(dependson inactivitytimersettings,usually 98% isachieved)
Access network Retainability RNC_922b Packet SessionSuccess Ratio (SSR)
RAS06 N/A
Access network Retainability RNC_742b Multi RAB SuccessRate
RAN04 =RNC_619a
Access network Retainability RNC_5434a RAB Success Ratio,Voice (CSR) (re-establishmentincluded)
RU40 N/A
Introduction to WCDMA RAN Key PerformanceIndicators
WCDMA RAN Key Performance Indicators
38 DN05191189 Issue: 08

Table 1 WCDMA RAN KPIs related to System Program Report (Cont.)
KPI Level
KPI Class
KPI ID
Indicates
Availablesince
LiveNetworkTypicalMeasuredValue
Access network Usage/RequestedCapacity
RNC_5068a MTC share ofrequested SMS
RU20 N/A
Access network Usage/RequestedCapacity
RNC_5070a Intra RNC Interfrequency HOAttempts NRT
RU20 N/A
Access network Usage/RequestedCapacity
RNC_5072a SRNS Relocation UEnot involved CSAttempts
RU20 N/A
Access network Usage/RequestedCapacity
RNC_5074a SRNS Relocation UEnot involved PSAttempts
RU20 N/A
Access network Usage/RequestedCapacity
RNC_5078a Incoming InterSystem HHOAttempts (CS)
RU20 N/A
Access network Usage/RequestedCapacity
RNC_5079a Incoming InterSystem ChangeAttempts (PS)
RU20 N/A
Access network Usage/Duration RNC_745a Voice, Minutes RAS05 6)
Access network Usage/Duration RNC_746a UDI, Minutes RAS05 6)
Access network Usage/Duration RNC_737b Minutes per DropVoice
RAS05 > 300minutes
Access network Usage/Duration RNC_738b Minutes per Drop UDI RAS05 > 300minutes
Access Network Usage/Duration RNC_5058a NRT RAB duration RU20 N/A
Access Network Usage/Duration RNC_5059a NRT Sessionsduration
RU20 N/A
Access network Usage/Duration RNC_5082a PS RAB minutes perdrop
RU20 N/A
Access network Usage/Duration RNC_5083a PS DCH minutes perdrop
RU20 N/A
WCDMA RAN Key Performance Indicators Introduction to WCDMA RAN Key PerformanceIndicators
Issue: 08 DN05191189 39

Table 1 WCDMA RAN KPIs related to System Program Report (Cont.)
KPI Level
KPI Class
KPI ID
Indicates
Availablesince
LiveNetworkTypicalMeasuredValue
Access network Mobility RNC_300h GSM Inter System RTHard HandoverSuccess Ratio
RAS05.1 ED > 96%
Access network Mobility RNC_301f GSM Inter SystemNRT Hard HandoverSuccess Ratio
RAS05.1 ED > 85%
Access network Mobility RNC_5500a LTE ISHO Successratio
RU50 N/A
Access network Mobility RNC_302e GSM ISHO DropRate RT
RAS05.1 ED < 0.5%
Access network Mobility RNC_303e GSM ISHO DropRate NRT
RAS05.1 ED < 5%
Access network Mobility RNC_5501a LTE ISHO Drop Rate RU50 N/A
Access network Mobility RNC_5073a SRNS Relocation UEnot involved CSSuccess Rate
RU20 N/A
Access network Mobility RNC_5075a SRNS Relocation UEnot involved PSSuccess Rate
RU20 N/A
Access network Mobility RNC_5076a SRNS Relocation UEinvolved CS SuccessRate (HHO)
RU20 N/A
Access network Mobility RNC_5077a SRNS Relocation UEinvolved PS SuccessRate (HHO)
RU20 N/A
Access network Mobility/Handover RNC_2103a Incoming LTE PSISHO preparationSuccess Ratio
RU40 N/A
Access network Mobility/Handover RNC_5502a Outgoing LTE PSISHO PreparationSuccess Rate
RU50 N/A
Introduction to WCDMA RAN Key PerformanceIndicators
WCDMA RAN Key Performance Indicators
40 DN05191189 Issue: 08

Table 1 WCDMA RAN KPIs related to System Program Report (Cont.)
KPI Level
KPI Class
KPI ID
Indicates
Availablesince
LiveNetworkTypicalMeasuredValue
Access network Mobility/Handover RNC_2104a Incoming LTE PSISHO RelocationComplete SuccessRatio
RU40 N/A
Access network Mobility/Handover RNC_5503a Outgoing LTE PSISHO PreparationAttempts
RU50 N/A
Access network Mobility/Handover RNC_5464a RRC connectionreleases with LTEredirection
RU40 N/A
RNC function Accessibility RNC_914c HSDPA SetupSuccess Ratio
RU10 N/A
RNC function Accessibility RNC_605b HSDPA ResourceAccessibility for NRTTraffic
RAS06 > 97 %
RNC function Accessibility RNC_915c HSUPA SetupSuccess Ratio
RU10 N/A
RNC function Accessibility RNC_913b HSUPA ResourceAccessibility for NRTTraffic
RAS06 N/A
RNC function Accessibility RNC_943b R99 Setup SuccessRatio
RU10 N/A
RNC function Retainability RNC_920b HSDPA SuccessRatio
RU10 N/A
RNC function Retainability RNC_921c HSUPA SuccessRatio
RU10 N/A
RNC function Retainability RNC_944c R99 Success Ratio RU10 N/A
RNC function Usage/RequestedCapacity
RNC_214a RRC Setup Attempts RAN1.5.2ED 1)
RNC function Usage/RequestedCapacity
RNC_218a Registration Attempts RAN1.5.2ED 1)
WCDMA RAN Key Performance Indicators Introduction to WCDMA RAN Key PerformanceIndicators
Issue: 08 DN05191189 41

Table 1 WCDMA RAN KPIs related to System Program Report (Cont.)
KPI Level
KPI Class
KPI ID
Indicates
Availablesince
LiveNetworkTypicalMeasuredValue
RNC function Usage/RequestedCapacity
RNC_5046a Short MessageService Attempts foridle mode UEs
RU10 6)
RNC function Usage/RequestedCapacity
RNC_229a RAB Attempts Voice RAN1.5.2ED 2)
RNC function Usage/RequestedCapacity
RNC_268a RAB Attempts UDI RAN1.5.2ED
2)
RNC function Usage/RequestedCapacity
RNC_617a RAB AttemptsStreaming
RAN1.5.2ED
2)
RNC function Usage/RequestedCapacity
RNC_616a RAB Attempts PSInteractive andBackground
RAN1.5.2ED
2)
RNC function Usage/RequestedCapacity
RNC_930b Packet Sessionattempts
RAS06 2)
RNC function Usage/RequestedCapacity
RNC_740b Multi RAB Attempts RAN1.5.2ED
2)
RNC function Usage/RequestedCapacity
RNC_926b HSDPA Attempts RAN1.5.2ED
2)
RNC function Usage/RequestedCapacity
RNC_928b HSUPA Attempts RAN1.5.2ED
2)
RNC function Usage/RequestedCapacity
RNC_193b Soft HandoverUpdate Attempts, RT
RAN1.5.2ED
3)
RNC function Usage/RequestedCapacity
RNC_194b Soft HandoverUpdate Attempts,NRT
RAN1.5.2ED
3)
RNC function Usage/RequestedCapacity
RNC_298f Inter System HardHandover attempts,RT
RAN1.5.2ED
4)
RNC function Usage/RequestedCapacity
RNC_299e Inter System HardHandover attempts,NRT
RAN1.5.2ED
4)
RNC function Usage/RequestedCapacity
RNC_927a HSDPA Serving CellChange Attempts
RAS06 4)
Introduction to WCDMA RAN Key PerformanceIndicators
WCDMA RAN Key Performance Indicators
42 DN05191189 Issue: 08

Table 1 WCDMA RAN KPIs related to System Program Report (Cont.)
KPI Level
KPI Class
KPI ID
Indicates
Availablesince
LiveNetworkTypicalMeasuredValue
RNC function Usage/RequestedCapacity
RNC_929a HSUPA Serving CellChange Attempts
RAS06 4)
RNC function Usage/RequestedCapacity
RNC_5064a SRNS Relocation UEinvolved CS Attempts(HHO)
RU20 N/A
RNC function Usage/RequestedCapacity
RNC_5065a SRNS Relocation UEinvolved PS Attempts(HHO)
RU20 N/A
RNC function Usage/RequestedCapacity
RNC_5066a Intra RNC Interfrequency HOAttempts RT
RU20 N/A
RNC function Usage/RequestedCapacity
RNC_1906a R99 Packet SessionAttempts
RU20 N/A
RNC function Usage/Requestedcapacity
RNC_5446a Number of statetransitions
RU40 N/A
RNC function Usage/RequestedCapacity
RNC_5475a Incoming LTE PSISHO preparationrequests
RU40 N/A
RNC function Usage/AllocatedCapacity
RNC_164f Average AllocatedUplink DedicatedChannel Capacity forData Calls inControlling RNC
RAN04 5)
RNC function Usage/AllocatedCapacity
RNC_165g Average AllocatedDownlink DedicatedChannel Capacity forData Calls inControlling RNC
RAN04 5)
RNC function Usage/AllocatedCapacity
RNC_614c HS-DSCH Selections RAS05 2)
RNC function Usage/AllocatedCapacity
RNC_923d E-DCH Selections RAS05 2)
RNC function Usage/AllocatedCapacity
RNC_192b Soft HandoverOverhead in CRNC
RAN1.5.2ED
3)
WCDMA RAN Key Performance Indicators Introduction to WCDMA RAN Key PerformanceIndicators
Issue: 08 DN05191189 43
Table 1 WCDMA RAN KPIs related to System Program Report (Cont.)
KPI Level
KPI Class
KPI ID
Indicates
Availablesince
LiveNetworkTypicalMeasuredValue
RNC function Usage/AllocatedCapacity
RNC_5486a Peak number ofHSPA users in RNC
RU40 N/A
RNC function Usage/AllocatedCapacity
RNC_2173a Peak RRC connectedmode users per RNC
RU40 N/A
RNC function Usage/AllocatedCapacity
RNC_5016a Maimum number ofVoice calls per RNC
RU10 N/A
RNC function Usage/Allocatedcapacity
RNC_5227a Averagre number ofactive PS users
RU40 N/A
RNC function Usage/Throughput RNC_280b Average CS Erlang RAN04 6)
RNC function Usage/Throughput RNC_5021b Iu-PS peakthroughput
RU10 5)
RNC function Usage/Throughput RNC_931c HSUPA MAC-es datavolume at RNC
RAS06 5)
RNC function Usage/Throughput RNC_5043a HSDPA MAC-d datavolume at RNC
RU10 5)
RNC function Usage/Duration RNC_5461a Mass event handlerduration
RU40 N/A
RNC function Mobility RNC_5069a Intra RNC Interfrequency HOSuccess Rate RT
RU20 N/A
RNC function Mobility RNC_5071a Intra RNC Interfrequency HOSuccess Rate NRT
RU20 N/A
Access point Usage/ResourceAvailability
RNC_183c Cell Availability RAN05 > 99.9%
Access point Usage/ResourceAvailability
RNC_727a Cell Availability,excluding blocked byuser state (BLU)
RAS05.1 >=RNC_183c
Access point Usage/Throughput RNC_608c WBTS: HSDPAReceived Data
RAS05 7)
Introduction to WCDMA RAN Key PerformanceIndicators
WCDMA RAN Key Performance Indicators
44 DN05191189 Issue: 08

Table 1 WCDMA RAN KPIs related to System Program Report (Cont.)
KPI Level
KPI Class
KPI ID
Indicates
Availablesince
LiveNetworkTypicalMeasuredValue
Access point Usage/Throughput RNC_722d WBTS: Active HS-DSCH MAC-dthroughput, networkperspective
RAS06 8)
Access point Usage/Throughput RNC_1879d Average HSDPA enduser throughput
RU20 N/A
Access point Usage/Throughput RNC_1883c Active HSUPA cellthroughput
RU20 N/A
Access point Usage/Throughput RNC_5460a Average HSUPA userthroughput
RU40 N/A
Access point Usage/Throughput RNC_5462a HS-FACH datavolume downlink
RU40 N/A
Access point Usage/Throughput RNC_5463a HS-FACH datavolume uplink
RU40 N/A
Access point Usage/Duration RNC_5081a HSDPA received dataper drop excludingPCH
RU20 N/A
Access point Usage/Duration RNC_5080a HSDPA received dataper drop includingPCH
RU20 N/A
Access point Mobility RNC_153b Soft HandoverSuccess Rate RT
RAN1.5.2ED
> 96%
Access point Mobility RNC_191b Soft HandoverSuccess Rate NRT
RAN1.5.2ED
> 96%
Access point Mobility RNC_733b HSDPA Serving CellChange SuccessRate
RAS06 > 99%
Access point Mobility RNC_918b HSUPA Serving CellChange SuccessRate
RAS06 N/A
Access point Integrity/Error rates RNC_607d WBTS: HSDPA MAC-hs efficiency
RAS05 N/A
WCDMA RAN Key Performance Indicators Introduction to WCDMA RAN Key PerformanceIndicators
Issue: 08 DN05191189 45

Table 1 WCDMA RAN KPIs related to System Program Report (Cont.)
KPI Level
KPI Class
KPI ID
Indicates
Availablesince
LiveNetworkTypicalMeasuredValue
Access point Integrity/Error rates RNC_917a WBTS: HSDPA MAC-es BLER
RAS06 N/A
Access point Integrity/RadioInterference
RNC_706b Average reported CQI RU10 N/A
References:
1) See RNC Product Description for Maximum number of RRC Connected Mode usersduring Busy Hour (BH).
2) See RNC Product Description for Busy Hour Call Attempts (BHCA).
3) See RNC Product Description for assumed SHO Proportions in relation to establishedcalls.
4) See RNC Product Description for assumed HHO Proportions in relation to establishedcalls.
5) See RNC Product Description for maximum supported throughput.
6) See RNC Product Description for maximum supported Erlang.
7) See BTS Product Description for maximum HSDPA cell-supported throughput.
8) See BTS Product Description for maximum HSDPA user-supported throughput.
Introduction to WCDMA RAN Key PerformanceIndicators
WCDMA RAN Key Performance Indicators
46 DN05191189 Issue: 08

2 Terms and definitionsThe following terms used in the document are defined in 3GPP specifications:
• Call• UE Domain• Uu or UMTS Radio Interface• Access Domain• Iu• Infrastructure Domain• Core Network Domain• Service Domain• Access Stratum• Service Stratum• Network Connection = Radio Resource Control• Network Service = Radio Access Bearer (RAB) Service• RAN Service = Radio Bearer (RB) Service• Service Access Point (SAP)• UTRAN Access Point• Radio link• Packet Session = DCH/HS-DSCH 'live time'• Packet Call = Packet's sending interval
Call-related definitionsCall The combination of the RAB(s), RB and the RL for a UE. It is also
obligatory that the RB is configured to carry user data.
Call Type A call type can be distinguished from the related service, that is, RABparameters. The call types distinguished by this document are Voice,UDI, Streaming Call (DCH), Streaming Session (E-DCH/HS-DSCH)and Packet Session.
In this document, Packet Session is considered to be a Packet Calldescribed in Calls in WCDMA RAN.
CCH Service Common Channel (CCH) Utilization = Data transmitted on RACH orFACH
Mobile StatusRRC State = varies from idle ( = no network connection) to URA_PCHor Cell_PCH (= Network Connection + Network Service) toCELL_FACH (Network Connection + Network Service + 'CCH'Service) to CELL_DCH (Network Connection + Network Service +RAN Service)
Packet ServiceA RAB with RAB QoS parameters: Traffic Class = Interactive orBackground.
WCDMA RAN Key Performance Indicators Terms and definitions
Issue: 08 DN05191189 47

The RRC setup has been done with cause codes: MOC Interactive,MTC Interactive, MOC Background or MTC Background.
Packet SessionA call with RAB/RB QoS parameters: Traffic Class = Interactive orBackground. Here a call refers to the DCH/HS-DSCH/E-DCH livetime, that is, the time the session is active for traffic.
The RRC setup has been done with cause codes: MOC Interactive,MTC Interactive, MOC Background or MTC Background.
In this document, Packet Session is considered to be a Packet 'Call'described in Calls in WCDMA RAN.
Packet 'Call'See Packet Session.
Packet Call Packet's sending interval inside a DCH/HS-DSCH/E-DCH transportchannel with RAB/RB QoS parameters: Traffic Class = Streaming,Interactive or Background. A packet call ends every time there is asilent period in transmission. The session can still be up even if thereis no data sending ongoing.
The RRC setup has been done with the following cause codes: MOCStreaming, MTC Streaming, MOC Interactive, MTC Interactive, MOCBackground or MTC Background.
Streaming 'Call'A call with RAB/RB QoS parameters: Traffic Class = Streaming.
The RRC setup has been done with the following cause codes: MOCStreaming and MTC Streaming.
Streaming ServiceA RAB with RAB QoS parameters: Traffic Class = Streaming.
The RRC setup has been done with the following cause codes: MOCStreaming and MTC Streaming.
Streaming SessionA call with RAB/RB QoS parameters: Traffic Class = Streaming. A callhere means the HS-DSCH/E-DCH 'live time', that is, the time thesession is active for traffic.
The RRC setup has been done with the following cause codes: MOCStreaming and MTC Streaming.
In this document, a Streaming Session is considered to be aStreaming 'Call' described in Calls in WCDMA RAN.
UDI Call A call with RAB/RB QoS parameters: Traffic Class = Conversational;Statistics Source Descriptor = Unknown.
The RRC setup has been done with the following cause codes: MOCConversational or MTC Conversational.
Terms and definitions WCDMA RAN Key Performance Indicators
48 DN05191189 Issue: 08

Voice Call A call with RAB/RB QoS parameters: Traffic Class = Conversational;Statistics Source Descriptor = Voice.
The RRC setup has been done with the following cause codes: MOCConversational, MTC Conversational and Emergency call.
Definitions related to mobilityInter System Change
An Inter System Change covers in addition to ISHO cell re-selectionsbetween systems done by UEs in the idle mode.
Inter System Hard HandoverAn Inter System Hard Handover (ISHO) covers only the cases thatinclude moving a call from a system (for example, 3G) to another (forexample, GSM).
Currently the ISHO KPI in the document refers to HOs between GSMand 3G.
t There are also cases where the CELL_FACH or CELL_PCH states do not havean active radio access bearer (RAB).
WCDMA RAN Key Performance Indicators Terms and definitions
Issue: 08 DN05191189 49

3 Available WCDMA RAN key performanceindicatorsThis section contains a summary of the current understanding of KPIs to be followed in3G radio access networks.
The KPI development work is always ongoing, and therefore the provided formulas andtheir typical values are updated frequently.
Network acceptance targets are not covered here. If a KPI described here is also part ofan acceptance agreement, the acceptance target for the KPI depends on the acceptanceagreement.
Previously, a target value or a reference was available for all documented KPIs. Theapproach has now changed. For information on any typical values or references, see theKPIs in System Program Report.
In the following table you can see all the key performance indicators in WCDMA RAN.
In the table, the following information is given:
• KPI levelThe level of the key performance indicators.
• KPI classThe KPI class and possible additional classification
• KPI IDThe ID of the key performance indicator.
• IndicatesStates what the key performance indicator is used for.
• Original releaseShows the release when the KPI became available.
• Definition updatedShows the release when the KPI was updated.
Table 2 Available KPIs in WCDMA RAN
KPI level
KPI class
KPI ID
Indicates
Originalrelease
Definitionupdated
Access network Accessibility RNC_20b RRC Connection Setup Success Ratio RAN1.5.2ED
RU20
Access network Accessibility RNC_94e RRC Setup and Access CompleteRatio, from Network Perspective
RAN04 RU20
Access network Accessibility RNC_154d RRC Setup and Access CompleteRatio
RAN04 RU20
Access network Accessibility RNC_219a Registration Success RAN1.5.2ED
-
Available WCDMA RAN key performance indicators WCDMA RAN Key Performance Indicators
50 DN05191189 Issue: 08

Table 2 Available KPIs in WCDMA RAN (Cont.)
KPI level
KPI class
KPI ID
Indicates
Originalrelease
Definitionupdated
Access network Accessibility RNC_565f Voice Call Setup Success Ratio(CSSR)
RAN05 RU10
Access Network Accessibility RNC_5093b Voice Call Setup Success Ratio(RRC+CU)
RU30 EP1 RU40
Access network Accessibility RNC_30a RAB Setup and Access CompleteRatio for Voice
RAN1.5.2ED
-
Access network Accessibility RNC_566e UDI Call Setup Success Ratio (CSSR) RAN05 -
Access network Accessibility RNC_31a RAB Setup Access Success Ratio forUDI
RAN1.5.2ED
-
Access network Accessibility RNC_575d Streaming Call Setup Success Ratio(CSSR)
RAN05 -
Access network Accessibility RNC_618a RAB Setup Access Success Ratio forStreaming
RAN1.5.2ED
-
Access network Accessibility RNC_576e Packet Service Setup Success Ratio(CSSR)
RAN05 RU10
Access network Accessibility RNC_157a RAB Setup and Access CompleteRatio for NRT Service
RAN1.5.2ED
-
Access network Accessibility RNC_916b Packet Session Setup Success Ratio(SSSR)
RAS06 RU10
Access network Accessibility RNC_741b Multi RAB Setup and Access SuccessRatio
RAN04 -
Access network Accessibility RNC_544a LCS Setup and Access CompleteRatio
RAN04 -
Access network Accessibility RNC_5008a Relocation Success in Target RNC forCS
RU10 -
Access network Accessibility RNC_5009a Relocation Success in Target RNC forPS
RU10 -
Access network Accessibility RNC_5459a HS-FACH Setup Success ratio RU40 -
Access network Accessibility RNC_5476a HS-FACH Success Ratio RU40 -
Access network Retainability RNC_217f RRC Success Ratio RAN1.5.2ED
RU20
WCDMA RAN Key Performance Indicators Available WCDMA RAN key performance indicators
Issue: 08 DN05191189 51

Table 2 Available KPIs in WCDMA RAN (Cont.)
KPI level
KPI class
KPI ID
Indicates
Originalrelease
Definitionupdated
Access network Retainability RNC_231d RAB Success Ratio, Voice (CSR) RAN1.5.2ED
RU20
Access network Retainability RNC_160e RAB Success Ratio, RT ServicesExcluding Voice, User perspective
RAN1.5.2ED
-
Access network Retainability RNC_232e RAB Success Ratio, UD I(CSR) RAS05.1 RU10,RU20
Access network Retainability RNC_619b RAB Success Ratio, Streaming (CSR) RAS05.1 RU20
Access network Retainability RNC_736b RAB Success Ratio, NRT Services RAN04 RU20
Access network Retainability RNC_615c RAB Success Ratio, NRT Services,from Network Perspective
RAN04 RU20
Access network Retainability RNC_922b Packet Session Success Ratio (SSR) RAS06 RU10
Access network Retainability RNC_742b Multi RAB Success Ratio RAN04 -
Access network Retainability RNC_5434a RAB Success Ratio, Voice (CSR) (re-establishment included)
RU40 -
Access network Usage/Requested Capacity
RNC_5078a Incoming Inter System HHO Attempts(CS)
RU20 -
Access network Usage/Requested Capacity
RNC_5079a Incoming Inter System ChangeAttempts (PS)
RU20 -
Access network Usage/Requested Capacity
RNC_5068a MTC share of requested SMS RU20 -
Access network Usage/Requested Capacity
RNC_5070a Intra RNC Inter frequency HOAttempts NRT
RU20 -
Access network Usage/Requested Capacity
RNC_5072a SRNS Relocation UE not involved CSAttempts
RU20 -
Access network Usage/Requested Capacity
RNC_5074a SRNS Relocation UE not involved PSAttempts
RU20 -
Access Network Usage/Throughput
RNC_280b Average CS Erlang RAN04 -
Access network Usage/Duration
RNC_745a Voice, Minutes RAS05.1ED
-
Available WCDMA RAN key performance indicators WCDMA RAN Key Performance Indicators
52 DN05191189 Issue: 08

Table 2 Available KPIs in WCDMA RAN (Cont.)
KPI level
KPI class
KPI ID
Indicates
Originalrelease
Definitionupdated
Access network Usage/Duration
RNC_746a UDI, Minutes RAS05.1ED
-
Access network Usage/Duration
RNC_737b Minutes per Drop Voice RAS05.1ED
RU20
Access network Usage/Duration
RNC_738b Minutes per Drop UDI RAS05.1ED
RU20
Access Network Usage/Duration
RNC_5050b Iu-PS data volume per drop - ATMbased
RU10 RU20
Access Network Usage/Duration
RNC_5051b Iu-PS data volume per drop - IP based RU10 RU20
Access Network Usage/Duration
RNC_5058a NRT RAB duration RU20 -
Access Network Usage/Duration
RNC_5059a NRT Sessions duration RU20 -
Access network Usage/Duration
RNC_5082a PS RAB minutes per drop RU20 -
Access network Usage/Duration
RNC_5083a PS DCH minutes per drop RU20 -
Access network Mobility RNC_5004a Incoming Inter System HHO Successin Target RNC for CS
RU10 -
Access network Mobility RNC_5030a Incoming Inter System Hard HandoverSuccess Rate in Target RNC for PS
RU10 -
Access network Mobility RNC_168a Intra System Hard Handover SuccessRatio
RAN1.5.2ED
-
Access network Mobility RNC_300h GSM Inter System RT Hard HandoverSuccess Ratio
RAS05.1ED
RU10,RU20
Access network Mobility RNC_301f GSM Inter System NRT HardHandover Success Ratio
RAS05.1ED
RU20
Access network Mobility RNC_5500a LTE ISHO Success ratio RU50 -
Access network Mobility RNC_302e GSM ISHO Drop Rate RT RAS05.1ED
-
WCDMA RAN Key Performance Indicators Available WCDMA RAN key performance indicators
Issue: 08 DN05191189 53
Table 2 Available KPIs in WCDMA RAN (Cont.)
KPI level
KPI class
KPI ID
Indicates
Originalrelease
Definitionupdated
Access network Mobility RNC_303e GSM ISHO Drop Rate NRT RAS05.1ED
-
Access network Mobility RNC_5501a LTE ISHO Drop Rate RU50 -
Access network Mobility RNC_5073a SRNS Relocation UE not involved CSSuccess Rate
RU20 -
Access network Mobility RNC_5075a SRNS Relocation UE not involved PSSuccess Rate
RU20 -
Access network Mobility RNC_5076a SRNS Relocation UE involved CSSuccess Rate (HHO)
RU20 -
Access network Mobility RNC_5077a SRNS Relocation UE involved PSSuccess Rate (HHO)
RU20 -
Access network Mobility/Handover
RNC_2103a Incoming LTE PS ISHO preparationSuccess Ratio
RU40 -
Access network Mobility/Handover
RNC_5502a Outgoing LTE PS ISHO PreparationSuccess Rate
RU50 -
Access network Mobility/Handover
RNC_2104a Incoming LTE PS ISHO RelocationComplete Success Ratio
RU40 -
Access network Mobility/Handover
RNC_5503a Outgoing LTE PS ISHO PreparationAttempts
RU50 -
Access network Mobility/Handover
RNC_5464a RRC connection releases with LTEredirection
RU40 -
RNC function Accessibility RNC_605b HSDPA Resource Accessibility forNRT Traffic
RAN05 RU10
RNC function Accessibility RNC_5000b HSDPA Resource Accessibility for RTTraffic
RU10 -
RNC function Accessibility RNC_914c HSDPA Setup Success Ratio RAS06 RU10
RNC function Accessibility RNC_913b HSUPA Resource Accessibility forNRT Traffic
RAS06 RU10
RNC function Accessibility RNC_5002a HSUPA Resource Accessibility for RTTraffic
RU10 -
RNC function Accessibility RNC_915c HSUPA Setup Success Ratio RAS06 RU10
Available WCDMA RAN key performance indicators WCDMA RAN Key Performance Indicators
54 DN05191189 Issue: 08

Table 2 Available KPIs in WCDMA RAN (Cont.)
KPI level
KPI class
KPI ID
Indicates
Originalrelease
Definitionupdated
RNC function Accessibility RNC_943b R99 Setup Success Ratio RAS06 RU10
RNC function Retainability RNC_609a HSDPA Resource Retainability forNRT Traffic
RAN05 RU10
RNC function Retainability RNC_5010a HSDPA Resource Retainability for RTTraffic
RU10 -
RNC function Retainability RNC_920b HSDPA Success Ratio RAS06 RU10
RNC function Retainability RNC_919b HSUPA resource Retainability for NRTTraffic
RAS06 RU10
RNC function Retainability RNC_5012a HSUPA resource Retainability for RTTraffic
RU10 -
RNC function Retainability RNC_921c HSUPA Success Ratio RAS06 RU10
RNC function Retainability RNC_944c R99 Success Ratio RAS06 RU10
RNC function Usage/Requested Capacity
RNC_214a RRC Setup Attempts RAN1.5.2ED
RU20
RNC function Usage/Requested Capacity
RNC_218a Registration Attempts RAN1.5.2ED
-
RNC function Usage/Requested Capacity
RNC_5046a Short Message Service Attempts foridle mode UEs
RU10 -
RNC function Usage/Requested Capacity
RNC_5047a Incoming Location Service Attempts RU10 -
RNC function Usage/Requested Capacity
RNC_229a RAB Attempts Voice RAN1.5.2ED
-
RNC function Usage/Requested Capacity
RNC_268a RAB Attempts UDI RAN1.5.2ED
-
RNC function Usage/Requested Capacity
RNC_617a RAB Attempts Streaming RAN1.5.2ED
-
RNC function Usage/Requested Capacity
RNC_616a RAB Attempts PS Interactive andBackground
RAN1.5.2ED
-
RNC function Usage/Requested Capacity
RNC_930b Packet Session attempts RAS06 -
WCDMA RAN Key Performance Indicators Available WCDMA RAN key performance indicators
Issue: 08 DN05191189 55

Table 2 Available KPIs in WCDMA RAN (Cont.)
KPI level
KPI class
KPI ID
Indicates
Originalrelease
Definitionupdated
RNC function Usage/Requested Capacity
RNC_740b Multi RAB Attempts RAN1.5.2ED
-
RNC function Usage/Requested Capacity
RNC_926b HSDPA Attempts RAN1.5.2ED
-
RNC function Usage/Requested Capacity
RNC_928b HSUPA Attempts RAN1.5.2ED
-
RNC function Usage/Requested Capacity
RNC_193b Soft Handover Update Attempts, RT RAN1.5.2ED
RU10
RNC function Usage/Requested Capacity
RNC_194b Soft Handover Update Attempts, NRT RAN1.5.2ED
RU10
RNC function Usage/Requested Capacity
RNC_743a Intra System Hard Handover attempts RAN1.5.2ED
-
RNC function Usage/Requested Capacity
RNC_298f Inter System Hard Handover attempts,RT
RAN1.5.2ED
RU10,RU20
RNC function Usage/Requested Capacity
RNC_299e Inter System Hard Handover attempts,NRT
RAN1.5.2ED
RU20
RNC function Usage/Requested Capacity
RNC_927a HSDPA Serving Cell Change Attempts RAS06 -
RNC function Usage/Requested Capacity
RNC_929a HSUPA Serving Cell Change Attempts RAS06 -
RNC function Usage/Requested Capacity
RNC_5064a SRNS Relocation UE involved CSAttempts (HHO)
RU20 -
RNC function Usage/Requested Capacity
RNC_5065a SRNS Relocation UE involved PSAttempts (HHO)
RU20 -
RNC function Usage/Requested Capacity
RNC_5066a Intra RNC Inter frequency HOAttempts RT
RU20 -
RNC function Usage/Requested capacity
RNC_5446a Number of state transitions RU40 -
RNC function Usage/Requested capacity
RNC_5448a NAS BHCA RU40 -
RNC function Usage/Requested capacity
RNC_5456a HS-FACH session attempts RU40 -
Available WCDMA RAN key performance indicators WCDMA RAN Key Performance Indicators
56 DN05191189 Issue: 08

Table 2 Available KPIs in WCDMA RAN (Cont.)
KPI level
KPI class
KPI ID
Indicates
Originalrelease
Definitionupdated
RNC function Usage/Requested Capacity
RNC_1906a R99 Packet Session Attempts RU20 -
RNC function Usage/Requested Capacity
RNC_5475a Incoming LTE PS ISHO preparationrequests
RU40 -
RNC function Usage/Allocated Capacity
RNC_162c Average Allocated Uplink DedicatedChannel Capacity for CS Voice inControlling RNC
RAN1.5.2ED
RU10
RNC function Usage/Allocated Capacity
RNC_163c Average Allocated Downlink DedicatedChannel Capacity for CS Voice inControlling RNC
RAN1.5.2ED
RU10
RNC function Usage/Allocated Capacity
RNC_164f Average Allocated Uplink DedicatedChannel Capacity for Data Calls inControlling RNC
RAN04 -
RNC function Usage/Allocated Capacity
RNC_165g Average Allocated Downlink DedicatedChannel Capacity for Data Calls inControlling RNC
RAN04 -
RNC function Usage/Allocated Capacity
RNC_614c HS-DSCH selections RAS05 -
RNC function Usage/Allocated Capacity
RNC_923d E-DCH selections RAS06 -
RNC function Usage/Allocated Capacity
RNC_192b Soft Handover Overhead in CRNC RAN1.5.2ED
-
RNC function Usage/Allocated Capacity
RNC_5486a Peak number of HSPA users in RNC RU40 -
RNC function Usage/Allocated Capacity
RNC_2173a Peak RRC connected mode users perRNC
RU40 -
RNC function Usage/Allocated Capacity
RNC_5016a Maximum number of Voice calls perRNC
RU10 -
RNC function Usage/Allocated Capacity
RNC_5017a Peak number of HSDPA users in RNC RU10 -
RNC function Usage/Allocated Capacity
RNC_5018a Peak number of HSUPA users in RNC RU10 -
RNC function Usage/Allocated capacity
RNC_5227a Averagre number of active PS users RU40 -
WCDMA RAN Key Performance Indicators Available WCDMA RAN key performance indicators
Issue: 08 DN05191189 57

Table 2 Available KPIs in WCDMA RAN (Cont.)
KPI level
KPI class
KPI ID
Indicates
Originalrelease
Definitionupdated
RNC function Usage/Resource Availability
RNC_728a Iu Availability RAS05.1 -
RNC function Usage/Resource Availability
RNC_729a Iur Availability RAS05.1 -
RNC function Usage/Throughput
RNC_5021b Iu-PS peak throughput RU10 -
RNC function Usage/Throughput
RNC_941b Iu-PS GTP Average input traffic rate inRNC
RAS05.1ED
RU10
RNC function Usage/Throughput
RNC_5027a Iu-PS GTP total input traffic in RNC[Mbit]
RU10 RU10
RNC function Usage/Throughput
RNC_5032a Average NRT DCH DL Throughput RAN05 -
RNC function Usage/Throughput
RNC_5033c Average NRT HS-DSCH DLThroughput
RAN05 RU40
RNC function Usage/Throughput
RNC_5043a HSDPA MAC-d data volume at RNC RU10 -
RNC function Usage/Throughput
RNC_721d Average MAC-d flow throughput RAS06 -
RNC function Usage/Throughput
RNC_952c HSUPA MAC-es average throughput atRNC
RAS06 -
RNC function Usage/Throughput
RNC_931c HSUPA MAC-es data volume at RNC RAS06 -
RNC function Usage/Duration
RNC_5461a Mass event handler duration RU40 -
RNC function Usage/Users RNC_5372a Maximum number of users in HS-FACH state
RU40 -
RNC function Mobility RNC_5069a Intra RNC Inter frequency HO SuccessRate RT
RU20 -
RNC function Mobility RNC_5071a Intra RNC Inter frequency HO SuccessRate NRT
RU20 -
Transport ResourceManager
Accessibility RNC_602a AAL2 connection reservation successrate
RAN05 -
Available WCDMA RAN key performance indicators WCDMA RAN Key Performance Indicators
58 DN05191189 Issue: 08

Table 2 Available KPIs in WCDMA RAN (Cont.)
KPI level
KPI class
KPI ID
Indicates
Originalrelease
Definitionupdated
Transport ResourceManager
Accessibility RNC_5005a IP Route Accessibility RU10 -
Transport ResourceManager
Accessibility RNC_5031a IP Route Accessibility for incoming iubtraffic
RU10 -
Transport ResourceManager
Usage/Allocated Capacity
RNC_601a AAL2 path average reservedbandwidth
RAN05 -
Transport ResourceManager
Usage/Throughput
RNC_950b ATM interface based averagethroughput for outgoing traffic (RNCside)
RAS06 RU10
Transport ResourceManager
Usage/Throughput
RNC_951b ATM interface based averagethroughput for incoming traffic (RNCside)
RAS06 RU10
Transport ResourceManager
Usage/Throughput
RNC_945b ATM interface based outgoing DataVolume (RNC side)
RAS06 RU10
Transport ResourceManager
Usage/Throughput
RNC_946b ATM interface based incoming DataVolume (RNC side)
RAS06 RU10
Transport ResourceManager
Usage/Throughput
RNC_5022a Outgoing IP route traffic volume RU10 -
Transport ResourceManager
Usage/Throughput
RNC_5029a Incoming IP route traffic volume RU10 -
Transport ResourceManager
Usage/Transmission load
RNC_960b ATM VCC specific incoming traffic load RU10 RU20
Transport ResourceManager
Usage/Transmission load
RNC_732b ATM VCC specific outgoing traffic load RAS05.1 RU10
Transport ResourceManager
Usage/Transmission Load
RNC_1909b Max Reserved IP based routebandwidth
RU30 -
Transport ResourceManager
Usage/Transmission Load
RNC_5383a IP based Iub Uplink maximumreservation rate at Flexi BTS
RU30 -
Transport ResourceManager
Usage/Transmission Load
RNC_5384a IP based Iub Uplink maximumreservation rate at Ultrasite BTS
RU30 -
Transport ResourceManager
Usage/Transmission Load
RNC_5385a IP based Iub Uplink maximumreservation rate at Flexi BTS - VLAN
RU30 -
WCDMA RAN Key Performance Indicators Available WCDMA RAN key performance indicators
Issue: 08 DN05191189 59
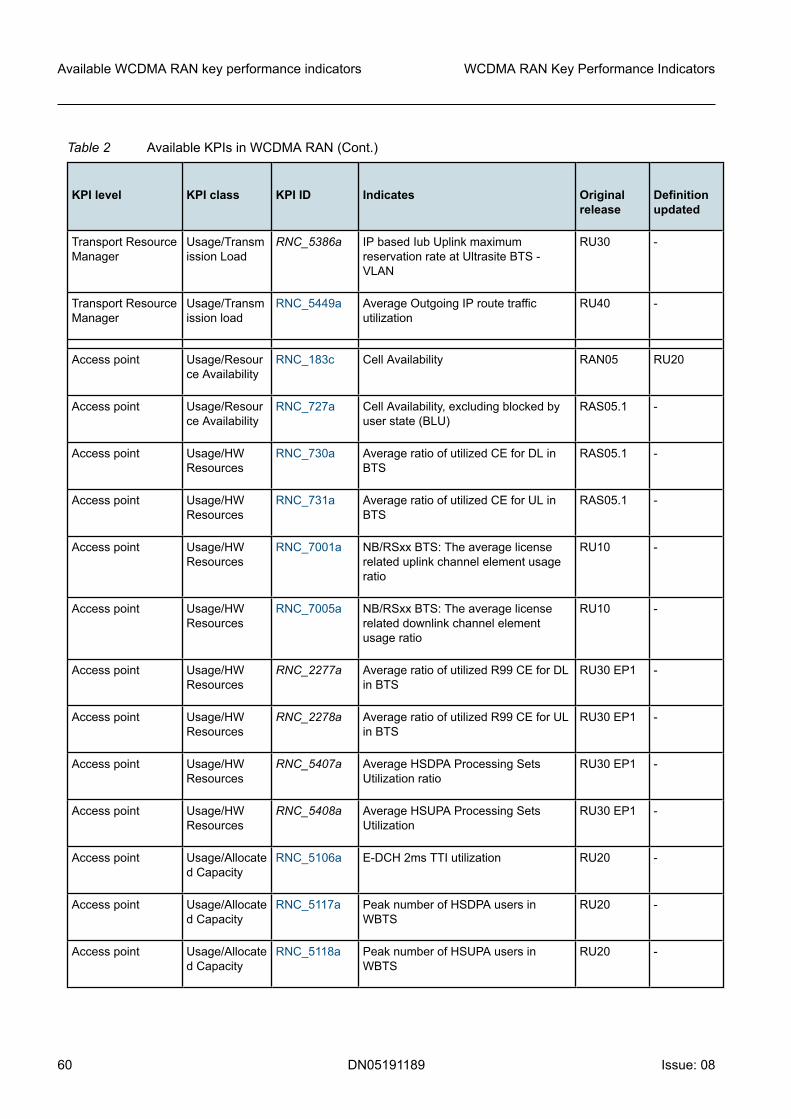
Table 2 Available KPIs in WCDMA RAN (Cont.)
KPI level
KPI class
KPI ID
Indicates
Originalrelease
Definitionupdated
Transport ResourceManager
Usage/Transmission Load
RNC_5386a IP based Iub Uplink maximumreservation rate at Ultrasite BTS -VLAN
RU30 -
Transport ResourceManager
Usage/Transmission load
RNC_5449a Average Outgoing IP route trafficutilization
RU40 -
Access point Usage/Resource Availability
RNC_183c Cell Availability RAN05 RU20
Access point Usage/Resource Availability
RNC_727a Cell Availability, excluding blocked byuser state (BLU)
RAS05.1 -
Access point Usage/HWResources
RNC_730a Average ratio of utilized CE for DL inBTS
RAS05.1 -
Access point Usage/HWResources
RNC_731a Average ratio of utilized CE for UL inBTS
RAS05.1 -
Access point Usage/HWResources
RNC_7001a NB/RSxx BTS: The average licenserelated uplink channel element usageratio
RU10 -
Access point Usage/HWResources
RNC_7005a NB/RSxx BTS: The average licenserelated downlink channel elementusage ratio
RU10 -
Access point Usage/HWResources
RNC_2277a Average ratio of utilized R99 CE for DLin BTS
RU30 EP1 -
Access point Usage/HWResources
RNC_2278a Average ratio of utilized R99 CE for ULin BTS
RU30 EP1 -
Access point Usage/HWResources
RNC_5407a Average HSDPA Processing SetsUtilization ratio
RU30 EP1 -
Access point Usage/HWResources
RNC_5408a Average HSUPA Processing SetsUtilization
RU30 EP1 -
Access point Usage/Allocated Capacity
RNC_5106a E-DCH 2ms TTI utilization RU20 -
Access point Usage/Allocated Capacity
RNC_5117a Peak number of HSDPA users inWBTS
RU20 -
Access point Usage/Allocated Capacity
RNC_5118a Peak number of HSUPA users inWBTS
RU20 -
Available WCDMA RAN key performance indicators WCDMA RAN Key Performance Indicators
60 DN05191189 Issue: 08

Table 2 Available KPIs in WCDMA RAN (Cont.)
KPI level
KPI class
KPI ID
Indicates
Originalrelease
Definitionupdated
Access point Usage/Allocated Capacity
RNC_5113a Average number of active users withMIMO
RU20 -
Access point Usage/Allocated Capacity
RNC_5149a Average number of active DC HSDPAusers
RU20 -
Access point Usage/RadioLoad
RNC_177c Noise floor of the System RAN1.5.2ED
RU20
Access point Usage/RadioLoad
RNC_101c Average Uplink R99 Load RAN1.5.2ED
RU20
Access point Usage/RadioLoad
RNC_102c Average R99 Downlink Load RAN1.5.2ED
-
Access point Usage/RadioLoad
RNC_1180a Average HSUPA Uplink Load RAS06 -
Access point Usage/RadioLoad
RNC_1181a Average HSPA Downlink Load RAS06 -
Access point Usage/Throughput
RNC_5019a Iub data volume DL in BTS RU10 -
Access point Usage/Throughput
RNC_608c HSDPA received data RAN05 RU10
Access point Usage/Throughput
RNC_739d HSDPA MAC-d data volume at BTS RAS06 RU10
Access point Usage/Throughput
RNC_606d HSDPA MAC-d Average netthroughput at BTS
RAN05 RU10
Access point Usage/Throughput
RNC_722d WBTS: Active HS-DSCH MAC-dthroughput, network perspective
RAS06 RU10
Access point Usage/Throughput
RNC_5020a Iub data volume UL in BTS RU10 -
Access point Usage/Throughput
RNC_1879b Average HSDPA end user throughput RU20 -
Access point Usage/Throughput
RNC_1883c Active HSUPA Cell throughput RU20 -
Access point Usage/Throughput
RNC_5460a Average HSUPA user throughput RU40 -
WCDMA RAN Key Performance Indicators Available WCDMA RAN key performance indicators
Issue: 08 DN05191189 61

Table 2 Available KPIs in WCDMA RAN (Cont.)
KPI level
KPI class
KPI ID
Indicates
Originalrelease
Definitionupdated
Access point Usage/Throughput
RNC_5462a HS-FACH data volume downlink RU40 -
Access point Usage/Throughput
RNC_5463a HS-FACH data volume uplink RU40 -
Access point Usage/Duration
RNC_5080a HSDPA received data per dropincluding PCH
RU20 -
Access point Usage/Duration
RNC_5081a HSDPA received data per dropexcluding PCH
RU20 -
Access point Mobility RNC_195a Soft Handover Success Rate RAN1.5.2ED
-
Access point Mobility RNC_153b Soft Handover Success Rate, RT RAN1.5.2ED
-
Access point Mobility RNC_191b Soft Handover Success Rate, NRT RAN1.5.2ED
-
Access point Mobility RNC_733b HSDPA Serving Cell Change SuccessRate
RAS05 -
Access point Mobility RNC_918b HSUPA Serving Cell Change SuccessRate
RAS06 RU10
Access point Integrity RNC_5111a CPC efficiency RU20 -
Access point Integrity/Errorrates
RNC_5035a NRT DCH DL Efficiency RU10 -
Access point Integrity/Errorrates
RNC_607d HSDPA MAC-hs efficiency RAN05 RU20
Access point Integrity/Errorrates
RNC_7063a NB/RSxx BTS: The average ratio ofnot acknowledged HARQ processes
RU10 -
Access point Integrity/Errorrates
RNC_5037a Voice RB UL BLER RU10 -
Access point Integrity/Errorrates
RNC_5036a Real Time Radio Bearer UL BLER RU10 -
Access point Integrity/Errorrates
RNC_5034a Non Real Time Radio Bearer UL BLER RU10 -
Available WCDMA RAN key performance indicators WCDMA RAN Key Performance Indicators
62 DN05191189 Issue: 08

Table 2 Available KPIs in WCDMA RAN (Cont.)
KPI level
KPI class
KPI ID
Indicates
Originalrelease
Definitionupdated
Access point Integrity/Errorrates
RNC_917a HSUPA MAC-es BLER RAS06 -
Access point Integrity/Errorrates
RNC_7070a NB/RSxx BTS: HSUPA HARQ notacknowledged Ratio
RU10 -
Access point Integrity/Errorrates
RNC_5023a Voice DL BLER RU10 -
Access point Integrity/Errorrates
RNC_5024a Real Time Radio Bearer (Voiceexcluded) DL BLER
RU10 -
Access point Integrity/RadioInterference
RNC_706b Average reported CQI RU10 -
For basic information on WCDMA RAN KPIs, see Overview of WCDMA RAN keyperformance indicators.
For more information on different indicators, see the following:
• Access Network level KPIs
– Access network level indicators for accessibility– Access network level indicators for retainability– Access network level indicators for usage– Access network level indicators for mobility
• RNC Function level KPIs
– RNC function level indicators for accessibility– RNC function level indicators for retainability– RNC function level indicators for usage
• Transport Resource Manager level KPIs
– Transport Resource Manager level indicators for accessibility– Transport Resource Manager level indicators for usage
• Access Point level KPIs
– Access point level indicators for usage– Access point level indicators for mobility– Access point level indicators for integrity
WCDMA RAN Key Performance Indicators Available WCDMA RAN key performance indicators
Issue: 08 DN05191189 63

4 Available Key Performance Indicators perFormula
4.1 Access network level4.1.1 Access network level indicators for accessibility
The services and resources related to the KPIs are described in Radio network in the 3Gsystem and UTRAN Resource Model overview in WCDMA RAN System Overview.
For an overview on WCDMA RAN KPIs, see Overview of WCDMA RAN keyperformance indicators.
4.1.1.1 Call Setup Success Ratio (CSSR) [%]
Table 3 Voice Call Setup Success Ratio (CSSR)
KPI name Voice Call Setup Success Ratio (CSSR)
KPI abbreviation CSSR CS Voice
KPI ID RNC_565f
Description AMR Call Setup Success Ratio [%] over the reportingperiod.
Note 1 The RRC request repetitions done by UE after RRC rejectare included in the formula.
Note 2 The occurred cell re-selections are subtracted both from thenumerator and denominator because they are notconsidered as call attempts from mobile end-user point ofview. The UE has made a new RRC connection via anothercell and Attempts-counter is updated in the new cell for thenew attempt.
Measurement M1001: Service Level
KPI formula 100* sum([M1001C22] - [M1001C23] + [M1001C32] -[M1001C33] + [M1001C40] - [M1001C41] - [M1001C562] -[M1001C553] - [M1001C558]) / sum([M1001C22] +[M1001C32] + [M1001C40] - [M1001C573] - [M1001C578] -[M1001C582] - [M1001C562] - [M1001C553] - [M1001C558]- [M1001C617]) * sum([M1001C115]) / sum([M1001C66])
KPI formula with short names 100* sum([MOC_CONV_CALL_ATTS] -[MOC_CONV_CALL_FAILS] + [MTC_CONV_CALL_ATTS] -[MTC_CONV_CALL_FAILS] + [EMERGENCY_CALL_ATTS]- [EMERGENCY_CALL_FAILS] -[RRC_ACC_REL_EMERGENCY] -[RRC_ACC_REL_MO_CONV] -[RRC_ACC_REL_MT_CONV]) /
Available Key Performance Indicators per Formula WCDMA RAN Key Performance Indicators
64 DN05191189 Issue: 08

Table 3 Voice Call Setup Success Ratio (CSSR) (Cont.)
sum([MOC_CONV_CALL_ATTS] +[MTC_CONV_CALL_ATTS] + [EMERGENCY_CALL_ATTS]- [RRC_ATT_REP_MO_CONV] -[RRC_ATT_REP_MT_CONV] -[RRC_ATT_REP_EMERGENCY] -[RRC_ACC_REL_EMERGENCY] -[RRC_ACC_REL_MO_CONV] -[RRC_ACC_REL_MT_CONV] -[RRC_CONN_STP_REJ_EMERG_CALL]) *sum([RAB_ACC_COMP_CS_VOICE]) /sum([RAB_STP_ATT_CS_VOICE])
KPI class Accessibility
Unit Percentage
Typical values > 99.2 %
Object Summary Levels Network, RNC
Time Summary Levels Week, Day, Hour
Table 4 Voice Call Setup Success Ratio (RRC+CU)
KPI name Voice Call Setup Success Ratio (RRC+CU)
KPI abbreviation Voice Call Setup SR (RRC+CU)
KPI ID RNC_5093b
Description Call Setup Success rate including both calls started fromIdle state with RRC procedure and calls started fromCell_PCH state with Cell Update procedure.
Measurement M1001: Service Level
1006: RRC signalling
KPI formula 100*sum([M1001C22] - [M1001C23] + [M1001C32] - [M1001C33] +[M1001C40] - [M1001C41] -[M1001C562] - [M1001C553] - [M1001C558]+[M1006C254]) /sum([M1001C22] + [M1001C32] + [M1001C40] - [M1001C573] - [M1001C578] - [M1001C582] - [M1001C562] - [M1001C553] - [M1001C558] -
WCDMA RAN Key Performance Indicators Available Key Performance Indicators per Formula
Issue: 08 DN05191189 65

Table 4 Voice Call Setup Success Ratio (RRC+CU) (Cont.)
[M1001C617]+[M1006C253]) * sum([M1001C115]) / sum([M1001C66])
KPI formula with short names 100*sum([MOC_CONV_CALL_ATTS] - [MOC_CONV_CALL_FAILS] + [MTC_CONV_CALL_ATTS] - [MTC_CONV_CALL_FAILS] +[EMERGENCY_CALL_ATTS] - [EMERGENCY_CALL_FAILS] -[RRC_ACC_REL_EMERGENCY] - [RRC_ACC_REL_MO_CONV] - [RRC_ACC_REL_MT_CONV]+[CELL_UPDATE_SUCC_CS_CALL]) /sum([MOC_CONV_CALL_ATTS] + [MTC_CONV_CALL_ATTS] + [EMERGENCY_CALL_ATTS] - [RRC_ATT_REP_MO_CONV] - [RRC_ATT_REP_MT_CONV] - [RRC_ATT_REP_EMERGENCY] - [RRC_ACC_REL_EMERGENCY] - [RRC_ACC_REL_MO_CONV] - [RRC_ACC_REL_MT_CONV] - [RRC_CONN_STP_REJ_EMERG_CALL]+[CELL_UPDATE_ATT_CS_CALL]) * sum([RAB_ACC_COMP_CS_VOICE]) / sum([RAB_STP_ATT_CS_VOICE])
KPI class Accessibility
Unit %
Object Summary Levels Network, City, Area, RNC, Cluster of cells, Cell
Time Summary Levels Total; week; weeklyBH; day; dailyBH; hour
Table 5 UDI Call Setup Success Ratio (CSSR)
KPI name UDI Call Setup Success Ratio (CSSR)
KPI abbreviation UDI CSSR
KPI ID RNC_566e
Description UDI Call Setup Success Ratio [%] over the reporting period.
Note 1 The RRC request repetitions done by UE after RRC rejectare included in the formula.
Note 2 The occurred cell re-selections are subtracted both from thenumerator and denominator because they are notconsidered as call attempts from mobile end-user point ofview. The UE has made a new RRC connection via anothercell and Attempts-counter is updated in the new cell for thenew attempt.
Measurement M1001: Service Level
Available Key Performance Indicators per Formula WCDMA RAN Key Performance Indicators
66 DN05191189 Issue: 08

Table 5 UDI Call Setup Success Ratio (CSSR) (Cont.)
KPI formula 100 * sum([M1001C22] - [M1001C23] + [M1001C32] -[M1001C33] - [M1001C553] - [M1001C558]) /sum([M1001C22] + [M1001C32] - [M1001C573] -[M1001C578] - [M1001C553] - [M1001C558]) *sum([M1001C116]) / sum([M1001C67])
KPI formula with short names 100 * sum([MOC_CONV_CALL_ATTS] -[MOC_CONV_CALL_FAILS] + [MTC_CONV_CALL_ATTS] -[MTC_CONV_CALL_FAILS] -[RRC_ACC_REL_MO_CONV] -[RRC_ACC_REL_MT_CONV]) /sum([MOC_CONV_CALL_ATTS] +[MTC_CONV_CALL_ATTS] - [RRC_ATT_REP_MO_CONV]- [RRC_ATT_REP_MT_CONV] -[RRC_ACC_REL_MO_CONV] -[RRC_ACC_REL_MT_CONV]) *sum([RAB_ACC_COMP_CS_CONV]) /sum([RAB_STP_ATT_CS_CONV])
KPI class Accessibility
Unit Percentage
Typical values > 99 %
Object Summary Levels Network, RNC
Time Summary Levels Week, Day, Hour
Table 6 Streaming Call Setup Success Ratio (CSSR)
KPI name Streaming Call Setup Success Ratio (CSSR)
KPI abbreviation Stream CSSR
KPI ID RNC_575d
Description Streaming Call Setup Success Ratio [%] over the reportingperiod.
Note 1 The RRC request repetitions done by UE after RRC rejectare included in the formula.
Note 2 The occurred cell re-selections are subtracted both from thenumerator and denominator because they are notconsidered as call attempts from mobile end-user point ofview. The UE has made a new RRC connection via anothercell and Attempts-counter is updated in the new cell for thenew attempt.
Measurement M1001: Service Level
WCDMA RAN Key Performance Indicators Available Key Performance Indicators per Formula
Issue: 08 DN05191189 67

Table 6 Streaming Call Setup Success Ratio (CSSR) (Cont.)
KPI formula 100 * sum([M1001C24] - [M1001C25] + [M1001C34] -[M1001C35] - [M1001C554] - [M1001C559]) /sum([M1001C24] + [M1001C34] - [M1001C574] -[M1001C579] - [M1001C554] - [M1001C559]) *sum([M1001C117] + [M1001C119]) / sum([M1001C68] +[M1001C70])
KPI formula with short names 100 * sum([MOC_STREA_CALL_ATTS] -[MOC_STREA_CALL_FAILS] +[MTC_STREA_CALL_ATTS] - [MTC_STREA_CALL_FAILS]- [RRC_ACC_REL_MO_STREAMING] -[RRC_ACC_REL_MT_STREAMING]) /sum([MOC_STREA_CALL_ATTS] +[MTC_STREA_CALL_ATTS] -[RRC_ATT_REP_MO_STREAMING] -[RRC_ATT_REP_MT_STREAMING] -[RRC_ACC_REL_MO_STREAMING] -[RRC_ACC_REL_MT_STREAMING]) *sum([RAB_ACC_COMP_CS_STREA] +[RAB_ACC_COMP_PS_STREA]) /sum([RAB_STP_ATT_CS_STREA] +[RAB_STP_ATT_PS_STREA])
KPI class Accessibility
Unit Percentage
Typical values > 98 %
Object Summary Levels Network, RNC
Time Summary Levels Week, Day, Hour
Table 7 Packet Service Setup Success Ratio (CSSR)
KPI name Packet Service Setup Success Ratio (CSSR)
KPI abbreviation CSSR PS NRT
KPI ID RNC_576e
Description Packet Service Setup Success Ratio [%] over the reportingperiod.
Note 1 The RRC request repetitions done by UE after RRC rejectare included in the formula.
Note 2 The occurred cell re-selections are subtracted both from thenumerator and denominator because they are notconsidered as call attempts from mobile end-user point ofview. The UE has made a new RRC connection via anothercell and Attempts-counter is updated in the new cell for thenew attempt.
Available Key Performance Indicators per Formula WCDMA RAN Key Performance Indicators
68 DN05191189 Issue: 08

Table 7 Packet Service Setup Success Ratio (CSSR) (Cont.)
Note 3 In RU10 it was decided that also RRC ConnectionEstablishment requests with 'high priority signaling' areinterpreted as Packet Service requests.
Measurement M1001: Service Level
KPI formula 100 * sum([M1001C26] - [M1001C27] + [M1001C28] -[M1001C29] + [M1001C36] - [M1001C37] + [M1001C38] -[M1001C39] + [M1001C50] - [M1001C51] + [M1001C52] -[M1001C53] - [M1001C560] - [M1001C556] - [M1001C567] -[M1001C555] - [M1001C561] - [M1001C570]) /sum([M1001C26] + [M1001C28] + [M1001C50] +[M1001C36] + [M1001C38] + [M1001C52] - [M1001C580] -[M1001C575] - [M1001C587] - [M1001C576] - [M1001C581]- [M1001C590] - [M1001C560] - [M1001C556] -[M1001C567] - [M1001C555] - [M1001C561] -[M1001C570]) * sum([M1001C120]+[M1001C121])/sum([M1001C71]+[M1001C72])
KPI formula with short names 100 * sum([MOC_INTER_CALL_ATTS] -[MOC_INTER_CALL_FAILS] +[MOC_BACKG_CALL_ATTS] -[MOC_BACKG_CALL_FAILS] + [MTC_INTER_CALL_ATTS]- [MTC_INTER_CALL_FAILS] +[MTC_BACKG_CALL_ATTS] -[MTC_BACKG_CALL_FAILS] +[MOC_HIGH_PRIOR_SIGN_ATTS] -[MOC_HIGH_PRIOR_SIGN_FAILS] +[MTC_HIGH_PRIOR_SIGN_ATTS] -[MTC_HIGH_PRIOR_SIGN_FAILS] -[RRC_ACC_REL_INTERACTIVE] -[RRC_ACC_REL_MO_BACKGROUND] -[RRC_ACC_REL_MO_HIGH_PR_SIGN] -[RRC_ACC_REL_MO_INTERACTIVE] -[RRC_ACC_REL_MT_BACKGROUND] -[RRC_ACC_REL_MT_HIGH_PR_SIGN]) /sum([MOC_INTER_CALL_ATTS] +[MOC_BACKG_CALL_ATTS] +[MOC_HIGH_PRIOR_SIGN_ATTS] +[MTC_INTER_CALL_ATTS] + [MTC_BACKG_CALL_ATTS]+ [MTC_HIGH_PRIOR_SIGN_ATTS] -[RRC_ATT_REP_INTERACTIVE] -[RRC_ATT_REP_MO_INTERACTIVE] -[RRC_ATT_REP_MO_HIGH_PR_SIGN] -[RRC_ATT_REP_MO_BACKGROUND] -[RRC_ATT_REP_MT_BACKGROUND] -[RRC_ATT_REP_MT_HIGH_PR_SIGN] -[RRC_ACC_REL_INTERACTIVE] -[RRC_ACC_REL_MO_BACKGROUND] -[RRC_ACC_REL_MO_HIGH_PR_SIGN] -[RRC_ACC_REL_MO_INTERACTIVE] -[RRC_ACC_REL_MT_BACKGROUND] -[RRC_ACC_REL_MT_HIGH_PR_SIGN]) *sum([RAB_ACC_COMP_PS_INTER]
WCDMA RAN Key Performance Indicators Available Key Performance Indicators per Formula
Issue: 08 DN05191189 69

Table 7 Packet Service Setup Success Ratio (CSSR) (Cont.)
+[RAB_ACC_COMP_PS_BACKG])/sum([RAB_STP_ATT_PS_INTER]+[RAB_STP_ATT_PS_BACKG])
KPI class Accessibility
Unit Percentage
Typical values > 99.5 %
Object Summary Levels Network, RNC
Time Summary Levels Week, Day, Hour
Table 8 Packet Session Setup Success Ratio (SSSR)
KPI name Packet Session Setup Success Ratio (SSSR)
KPI abbreviation Packet Session stp SR
KPI ID RNC_916b
Description Packet Session Setup Success Ratio over the reportingperiod.
Note For differences between Packet Service, Packet Sessionand Packet call, see WCDMA RAN Key PerformanceIndicators.
Measurement M1022: Packet Call
KPI formula 100* sum([M1022C21] + [M1022C22] + [M1022C23] +[M1022C24] + [M1022C25] + [M1022C26] + [M1022C27] +[M1022C28] + [M1022C29] + [M1022C30] + [M1022C31] +[M1022C32]+ [M1022C190] + [M1022C191] + [M1022C192]+ [M1022C193] + [M1022C194] + [M1022C195]) /sum([M1022C3] + [M1022C4] + [M1022C5] + [M1022C6] +[M1022C7] + [M1022C8] + [M1022C181] + [M1022C182] +[M1022C183])
KPI formula with short names 100* sum([HS_E_REQ_HS_E_ALLO_INT] +[HS_E_REQ_HS_E_ALLO_BGR] +[HS_E_REQ_HS_D_ALLO_INT] +[HS_E_REQ_HS_D_ALLO_BGR] +[HS_D_REQ_HS_D_ALLO_INT] +[HS_D_REQ_HS_D_ALLO_BGR] +[HS_E_REQ_D_D_ALLO_INT] +[HS_E_REQ_D_D_ALLO_BGR] +[HS_D_REQ_D_D_ALLO_INT] +[HS_D_REQ_D_D_ALLO_BGR] +[D_D_REQ_D_D_ALLO_INT] +[D_D_REQ_D_D_ALLO_BGR]+[HS_E_REQ_HS_E_ALLO_STRE] +
Available Key Performance Indicators per Formula WCDMA RAN Key Performance Indicators
70 DN05191189 Issue: 08

Table 8 Packet Session Setup Success Ratio (SSSR) (Cont.)
[HS_E_REQ_HS_D_ALLO_STRE] +[HS_D_REQ_HS_D_ALLO_STRE] +[HS_E_REQ_D_D_ALLO_STRE] +[HS_D_REQ_D_D_ALLO_STRE] +[D_D_REQ_D_D_ALLO_STRE]) /sum([PS_ATT_HSDSCH_EDCH_INT] +[PS_ATT_HSDSCH_EDCH_BGR] +[PS_ATT_HSDSCH_DCH_INT] +[PS_ATT_HSDSCH_DCH_BGR] +[PS_ATT_DCH_DCH_INT] + [PS_ATT_DCH_DCH_BGR] +[PS_ATT_HSDSCH_EDCH_STRE] +[PS_ATT_HSDSCH_DCH_STRE] +[PS_ATT_DCH_DCH_STRE])
KPI class Accessibility
Unit Percentage
Object Summary Levels Network, City, Area, RNC, Cluster of cells, Cell
Time Summary Levels Week, Day, Hour
4.1.1.2 LCS Setup [%]
Table 9 LCS Setup and Access Complete Ratio
KPI name LCS Setup and Access Complete Ratio
KPI abbreviation LCS stp and acc CR
KPI ID RNC_544a
Description LCS Setup and Access Complete Ratio [%] over thereporting period. Covers the phase from Location ReportingRequest to Location Control Report.
Measurement M1011: Location Services
KPI formula 100* sum([M1011C0] - [M1011C2]) / sum([M1011C0])
KPI formula with short names 100* sum([NBR_OF_LCS_REQUESTS] -[NBR_OF_FAILED_LOCREQ]) /sum([NBR_OF_LCS_REQUESTS])
KPI class Accessibility
Unit Percentage
Typical values N/A (Not enough experience yet)
Object Summary Levels Network, RNC
WCDMA RAN Key Performance Indicators Available Key Performance Indicators per Formula
Issue: 08 DN05191189 71

Table 9 LCS Setup and Access Complete Ratio (Cont.)
Time Summary Levels Week, Day, Hour
4.1.1.3 RRC Setup Complete Ratio [%]
Table 10 RRC Connection setup Success Ratio
KPI name RRC Connection setup Success Ratio
KPI abbreviation RRC conn stp SR
KPI ID RNC_20b
Description RRC Connection setup success ratio "RRC connectionsetup" means the resource reservation phase, beforesending RRC Connection Setup message to the UE
Note This KPI from RU20 onwards doesn't include RRC / RABsetups based on incoming relocations and hard handovers.These have been moved to the new counters and those arenot used in this KPI.
Measurement 1001: Service Level
KPI formula 100*sum([M1001C1]) / sum([M1001C0] + [M1001C259] -[M1001C260])
KPI formula with short names 100*sum([RRC_CONN_STP_COMP]) /sum([RRC_CONN_STP_ATT] +[RRC_CONN_SETUP_COMP_AFT_DIR] -[RRC_CON_SETUP_COMP_DIRECTED])
KPI class Accessibility
Unit %
Target values OPEN
Object summary levels Network, City, Area, RNC, Cluster of cells, Cell
4.1.1.4 RRC Setup and Access Complete Ratio [%]
Table 11 RRC Setup and Access Complete Ratio, from Network Perspective
KPI name RRC Setup and Access Complete Ratio, from NetworkPerspective
KPI abbreviation RRC stp and acc CR NW
KPI ID RNC_94e
Available Key Performance Indicators per Formula WCDMA RAN Key Performance Indicators
72 DN05191189 Issue: 08

Table 11 RRC Setup and Access Complete Ratio, from Network Perspective (Cont.)
Description RRC Setup and Access Complete Ratio [%] over thereporting period. Covers RRC Setup and Access phases(From RRC Connection Request to RRC Connection SetupComplete).
Note 1 RRC connection is needed also for other purposes than acall (SMS, LU, Detach, etc.).
Note 2 This KPI from RU20 onwards doesn't include RRC / RABsetups based on incoming relocations and hard handovers.These have been moved to the new counters and those arenot used in this KPI.
Measurement M1001: Service Level
KPI formula 100* sum([M1001C8] + [M1001C260]) / sum([M1001C0] +[M1001C259] - [M1001C617])
KPI formula with short names 100* sum([RRC_CONN_ACC_COMP] +[RRC_CON_SETUP_COMP_DIRECTED]) /sum([RRC_CONN_STP_ATT] +[RRC_CONN_SETUP_COMP_AFT_DIR] -[RRC_CONN_STP_REJ_EMERG_CALL])
KPI class Accessibility
Unit Percentage
Typical values > 98.5%
Object Summary Levels Network, City, Area, RNC, Cluster of cells, Cell
Time Summary Levels Week, Day, Hour
Table 12 RRC Setup and Access Complete Ratio
KPI name RRC Setup and Access Complete Ratio
KPI abbreviation RRC stp and acc CR
KPI ID RNC_154d
Description RRC Setup and Access Complete Ratio [%] over thereporting period. Covers RRC Setup and Access phases(From RRC Connection Request to RRC Connection SetupComplete). Note1: RRC connection is needed also for otherpurposes than a call (SMS, LU, Detach, etc.).
Note This KPI from RU20 onwards doesn't include RRC / RABsetups based on incoming relocations and hard handovers.These have been moved to the new counters and those arenot used in this KPI.
WCDMA RAN Key Performance Indicators Available Key Performance Indicators per Formula
Issue: 08 DN05191189 73

Table 12 RRC Setup and Access Complete Ratio (Cont.)
Measurement M1001: Service Level
KPI formula 100* sum([M1001C8] + [M1001C260]) / sum([M1001C0] -[M1001C242] - [M1001C241] + [M1001C259] -[M1001C617])
KPI formula with short names 100* sum([RRC_CONN_ACC_COMP] +[RRC_CON_SETUP_COMP_DIRECTED]) /sum([RRC_CONN_STP_ATT] -[RRC_CONN_SETUP_ATT_REPEAT] -[RRC_CONN_ACC_REL_CELL_RESEL] +[RRC_CONN_SETUP_COMP_AFT_DIR] -[RRC_CONN_STP_REJ_EMERG_CALL])
KPI class Accessibility
Unit Percentage
Typical values > 99 %
Object Summary Levels Network, City, Area, RNC, Cluster of cells, Cell
Time Summary Levels Week, Day, Hour
Table 13 Registration Success
KPI name Registration Success
KPI abbreviation Regist succ
KPI ID RNC_219a
Description Success rate of Registrations
Note Registration means either network entry, change of locationarea or periodical location update.
Measurement M1001: Service Level
KPI formula 100* sum([M1001C46]- [M1001C47]) / sum([M1001C46])
KPI formula with short names 100* sum([REGISTRATION_ATTS]-[REGISTRATION_FAILS]) / sum([REGISTRATION_ATTS])
KPI class Accessibility
Unit Percentage
Typical values OPEN
Object Summary Levels Network, City, Area, RNC, Cluster of cells, Cell
Available Key Performance Indicators per Formula WCDMA RAN Key Performance Indicators
74 DN05191189 Issue: 08

Table 13 Registration Success (Cont.)
Time Summary Levels Total; week; weeklyBH; day; dailyBH; hour
4.1.1.5 RAB Setup and Access Complete Ratio [%]
Table 14 RAB Setup and Access Complete Ratio for Voice
KPI name RAB Setup and Access Complete Ratio for Voice
KPI abbreviation RAB stp and acc CR Voice
KPI ID RNC_30a
Description RAB Setup and Access Complete Ratio [%] for voice callsover the reporting period. Covers RAB Setup and Accessphases (From RAB Assignment Request to Radio BearerSetup Complete).
Note RRC connection is needed before RAB setup in order tomake a call.
Measurement M1001: Service Level
KPI formula 100* sum([M1001C115]) / sum([M1001C66])
KPI formula with short names 100* sum([RAB_ACC_COMP_CS_VOICE]) /sum([RAB_STP_ATT_CS_VOICE])
KPI class Accessibility
Unit Percentage
Typical values > 99.6 %
Object Summary Levels Network, City, Area, RNC, Cluster of cells, Cell
Time Summary Levels Week, Day, Hour
Table 15 RAB Setup and Access Complete Ratio for UDI
KPI name RAB Setup and Access Complete Ratio for UDI
KPI abbreviation RAB stp&acc CR UDI
KPI ID RNC_31a
Description RAB Setup and Access Complete Ratio for CS video callsi.e. UDI.
Note UDI basically means video calls.
Measurement M1001: Service Level
WCDMA RAN Key Performance Indicators Available Key Performance Indicators per Formula
Issue: 08 DN05191189 75

Table 15 RAB Setup and Access Complete Ratio for UDI (Cont.)
KPI formula 100*sum([M1001C116]) / sum([M1001C67])
KPI formula with short names 100*sum([RAB_ACC_COMP_CS_CONV]) /sum([RAB_STP_ATT_CS_CONV])
KPI class Accessibility
Unit Percentage
Typical values > 99.5%
Object Summary Levels Network, RNC
Time Summary Levels Week, Day, Hour
Table 16 RAB Setup and Access Complete Ratio for Streaming
KPI name RAB Setup and Access Complete Ratio for Streaming
KPI abbreviation RAB stp&acc CR for Stream
KPI ID RNC_618a
Description RAB Setup Access success ratio for Streaming calls.
Measurement M1001: Service Level
KPI formula 100*sum([M1001C119] + [M1001C117]) / sum([M1001C70]+ [M1001C68])
KPI formula with short names 100*sum([RAB_ACC_COMP_PS_STREA] +[RAB_ACC_COMP_CS_STREA]) /sum([RAB_STP_ATT_PS_STREA] +[RAB_STP_ATT_CS_STREA])
KPI class Accessibility
Unit Percentage
Typical values > 99.5%
Object Summary Levels Network, RNC
Time Summary Levels Week, Day, Hour
Table 17 RAB Setup and Access Complete Ratio for NRT Service
KPI name RAB Setup and Access Complete Ratio for NRT Service
KPI abbreviation RAB stp&acc CR NRT srv
Available Key Performance Indicators per Formula WCDMA RAN Key Performance Indicators
76 DN05191189 Issue: 08

Table 17 RAB Setup and Access Complete Ratio for NRT Service (Cont.)
KPI ID RNC_157a
Description RAB Setup and Access Complete Ratio [%] for NRTservices over the reporting period. Covers RAB Setup andAccess phases (From RAB Assignment Request to RadioBearer Setup Complete).
Note 1 RRC connection is needed before RAB setup in order tomake a call.
Measurement M1001: Service Level
KPI formula 100* sum([M1001C120] + [M1001C121]) / sum([M1001C71]+ [M1001C72])
KPI formula with short names 100* sum([RAB_ACC_COMP_PS_INTER] +[RAB_ACC_COMP_PS_BACKG]) /sum([RAB_STP_ATT_PS_INTER] +[RAB_STP_ATT_PS_BACKG])
KPI class Accessibility
Unit Percentage
Typical values > 99.7%
Object Summary Levels Network, City, Area, RNC, Cluster of cells, Cell
Time Summary Levels Week, Day, Hour
4.1.1.6 RAB Setup and Access Complete Ratio, Multi-RAB Services [%]
All Multi RAB services
Table 18 Multi RAB setup and access Success Ratio
KPI name CS AMR + PS Multi RAB Setup Success Ratio
KPI abbreviation CSAMR+PS MRAB stp SR
KPI ID RNC_741b
Description Multi RAB (combination "CS AMR + PS NRT) setup successrate. Covers RAB Setup and Access phases (From RABAssignment Request to Radio Bearer Setup Complete).
Note 1 RRC connection is needed before RAB setup in order tomake a call.
Measurement M1001: Service Level
KPI formula 100 * sum( [M1001C701] ) / sum( [M1001C700] )
WCDMA RAN Key Performance Indicators Available Key Performance Indicators per Formula
Issue: 08 DN05191189 77

Table 18 Multi RAB setup and access Success Ratio (Cont.)
KPI formula with short names 100 * sum( [RAB_ACC_COMP_AMR_PSNRT] ) /sum( [RAB_STP_ATT_AMR_PSNRT] )
KPI class Accessibility
Unit Percentage
Typical values OPEN
Object Summary Levels Network, RNC
Time Summary Levels Week, Day, Hour
4.1.1.7 HS-FACH Setup Success Ratio
Table 19 HS-FACH Setup Success ratio
KPI name HS-FACH Setup Success ratio
KPI abbreviation HS-FACH Setup SR
KPI ID RNC_5459a
Description The success ratio of transitions from CELL_DCH or CELL_PCH toEnhanced CELL_FACH.
Note The number of successful transitions from CELL_DCH andCELL_PCH to Enhanced CELL_FACH related to the total numberof transitions attempts from CELL_DCH and CELL_PCH toEnhanced CELL_FACH state.
Measurement 1006: RRC signalling
KPI formula 100*sum([M1006C216]+[M1006C220]) /sum([M1006C215]+[M1006C219])
KPI formula with short names 100*sum([SUCC_DCH_TO_EFACH]+[SUCC_PCH_TO_EFACH]) /sum([ATT_DCH_TO_EFACH]+[ATT_PCH_TO_EFACH])
KPI class Accessibility
Unit %
Object summary levels Network; City; Area; RNC; WBTS; Cluster of cells; Cell
Time summary levels Total; week; weeklyBH; day; dailyBH; hour
Available Key Performance Indicators per Formula WCDMA RAN Key Performance Indicators
78 DN05191189 Issue: 08

4.1.1.8 Serving Radio Network Subsystem Accessibility Ratio [%]
Table 20 Relocation Success in Target RNC for CS
KPI name Relocation Success in Target RNC for CS
KPI abbreviation Reloc succ trg RNC for CS
KPI ID RNC_5008a
Description The Relocation success inside RAN in Target RNC includingboth "UE not involved" (SRNC Relocation) and "UEinvolved" (Inter HHO) cases. The viewpoint is CS andtherefore MSC cases are counted.
Note 1 The incoming CS based relocation cancellations by CN areconsidered as a failed CS relocation in this formula.
Measurement M1009: L3 Relocation
KPI formula 100 * sum([M1009C77] + [M1009C193]) / sum([M1009C26]+ [M1009C142])
KPI formula with short names 100 * sum([SRNS_RELOC_COMPL_RNC_MSC] +[INTER_HHO_COMPL_IN_RNC_MSC]) /sum([SRNS_RELOC_IN_REQ_CONTR_MSC] +[INTER_RNC_HHO_IN_REQ_MSC])
KPI class Accessibility
Unit Percentage
Object Summary Levels Network, RNC
Time Summary Levels Week, Day, Hour
Table 21 Relocation Success in Target RNC for PS
KPI name Relocation Success in Target RNC for PS
KPI abbreviation Reloc succ trg RNC for PS
KPI ID RNC_5009a
Description The Relocation success inside RAN including both "UE notinvolved" (SRNC Relocation) and "UE involved" (Inter HHO)cases. The viewpoint is PS and therefore SGSN cases arecounted.
Note 1 The incoming PS based relocation cancellations by CN areconsidered as a failed PS relocation in this formula.
Measurement M1009: L3 Relocation
WCDMA RAN Key Performance Indicators Available Key Performance Indicators per Formula
Issue: 08 DN05191189 79
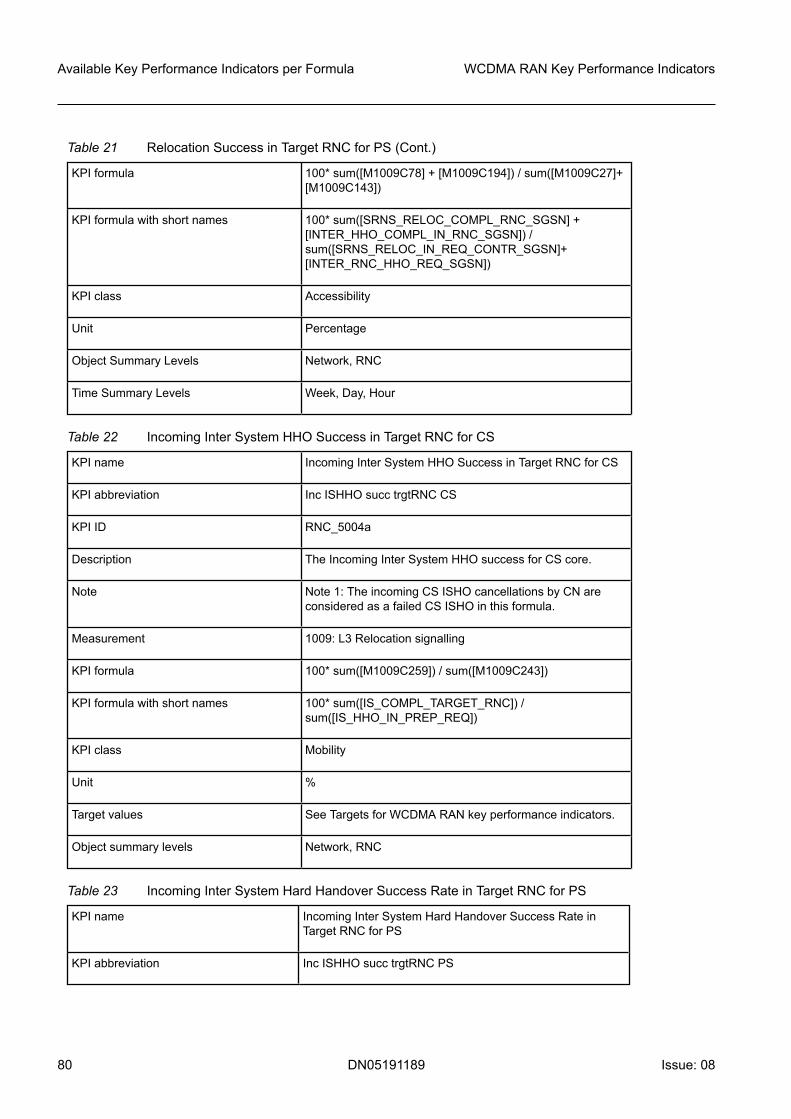
Table 21 Relocation Success in Target RNC for PS (Cont.)
KPI formula 100* sum([M1009C78] + [M1009C194]) / sum([M1009C27]+[M1009C143])
KPI formula with short names 100* sum([SRNS_RELOC_COMPL_RNC_SGSN] +[INTER_HHO_COMPL_IN_RNC_SGSN]) /sum([SRNS_RELOC_IN_REQ_CONTR_SGSN]+[INTER_RNC_HHO_REQ_SGSN])
KPI class Accessibility
Unit Percentage
Object Summary Levels Network, RNC
Time Summary Levels Week, Day, Hour
Table 22 Incoming Inter System HHO Success in Target RNC for CS
KPI name Incoming Inter System HHO Success in Target RNC for CS
KPI abbreviation Inc ISHHO succ trgtRNC CS
KPI ID RNC_5004a
Description The Incoming Inter System HHO success for CS core.
Note Note 1: The incoming CS ISHO cancellations by CN areconsidered as a failed CS ISHO in this formula.
Measurement 1009: L3 Relocation signalling
KPI formula 100* sum([M1009C259]) / sum([M1009C243])
KPI formula with short names 100* sum([IS_COMPL_TARGET_RNC]) /sum([IS_HHO_IN_PREP_REQ])
KPI class Mobility
Unit %
Target values See Targets for WCDMA RAN key performance indicators.
Object summary levels Network, RNC
Table 23 Incoming Inter System Hard Handover Success Rate in Target RNC for PS
KPI name Incoming Inter System Hard Handover Success Rate inTarget RNC for PS
KPI abbreviation Inc ISHHO succ trgtRNC PS
Available Key Performance Indicators per Formula WCDMA RAN Key Performance Indicators
80 DN05191189 Issue: 08

Table 23 Incoming Inter System Hard Handover Success Rate in Target RNC for PS(Cont.)
KPI ID RNC_5030a
Description The Incoming Inter System Hard Handover success rate forPS domain.
Measurement 1001: Service Level
KPI formula 100 - 100* (sum([M1001C45]) / sum([M1001C44] -[M1001C584] - [M1001C564]))
KPI formula with short names 100 - 100* (sum([CELL_CHNG_ORD_FAILS]) /sum([CELL_CHNG_ORD_ATTS] -[RRC_ATT_REP_INTER_RAT_CCO] -[RRC_ACC_REL_INTER_RAT_CCO]))
KPI class Mobility
Unit %
Target values See Targets for WCDMA RAN key performance indicators.
Object summary levels Network, RNC
Table 24 SRNS Relocation prep Success Rate UE not involved CS
KPI name SRNS Relocation prep Success Rate UE not involved CS
KPI abbreviation SRNS Rel UE not inv CS SR
KPI ID RNC_5073a
Description Relocation preparations Success Rate with UE not involvedfor CS domain
Measurement 1009: L3 Relocation signalling
KPI formula 100* sum ([M1009C5]) / sum ([M1009C2])
KPI formula with short names 100* sum ([SRNS_REL_OUT_SUCC_CONTR_MSC]) / sum([SRNS_RELOC_OUT_REQ_CONTR_MSC])
KPI class Mobility
Unit %
Object summary levels Network; City; Area; RNC
Time summary levels Total; week; weeklyBH; day; dailyBH; hour
WCDMA RAN Key Performance Indicators Available Key Performance Indicators per Formula
Issue: 08 DN05191189 81

Table 25 SRNS Relocation prep Success Rate UE not involved PS
KPI name SRNS Relocation prep Success Rate UE not involved PS
KPI abbreviation SRNS Rel UE not inv PS SR
KPI ID RNC_5075a
Description Relocation preparations Success Rate with UE not involvedfor PS domain.
Note Unsuccessful relocations do not lead to a bad userexperience in general. Calls might just stay in the SourceRNC. Canceled relocations are also included in theseunsuccessful cases.
Measurement 1009: L3 Relocation signalling
KPI formula 100* sum ([M1009C6]) / sum ([M1009C3])
KPI formula with short names 100* sum ([SRNS_REL_OUT_SUCC_CONTR_SGSN]) /sum ([SRNS_REL_OUT_REQ_CONTR_SGSN])
KPI class Mobility
Unit %
Object summary levels Network; City; Area; RNC
Time summary levels Total; week; weeklyBH; day; dailyBH; hour
Table 26 SRNS Relocation UE involved CS Success Rate (HHO)
KPI name SRNS Relocation Preparation UE involved CS SuccessRate (HHO)
KPI abbreviation SRNS Rel Pre UE inv CS SR
KPI ID RNC_5076a
Description Relocation preparations Success Rate with UE involved forCS domain.
Note Unsuccessful relocations are do not lead to a bad userexperience in general. Calls might just stay in the SourceRNC. Canceled relocations are also included in theseunsuccessful cases.
Measurement 1009: L3 Relocation signalling
KPI formula 100* sum ([M1009C121]) / sum ([M1009C118])
KPI formula with short names 100* sum ([INTER_RNC_HHO_SUCC_MSC]) / sum([INTER_RNC_HHO_REQ_CONTR_MSC])
Available Key Performance Indicators per Formula WCDMA RAN Key Performance Indicators
82 DN05191189 Issue: 08
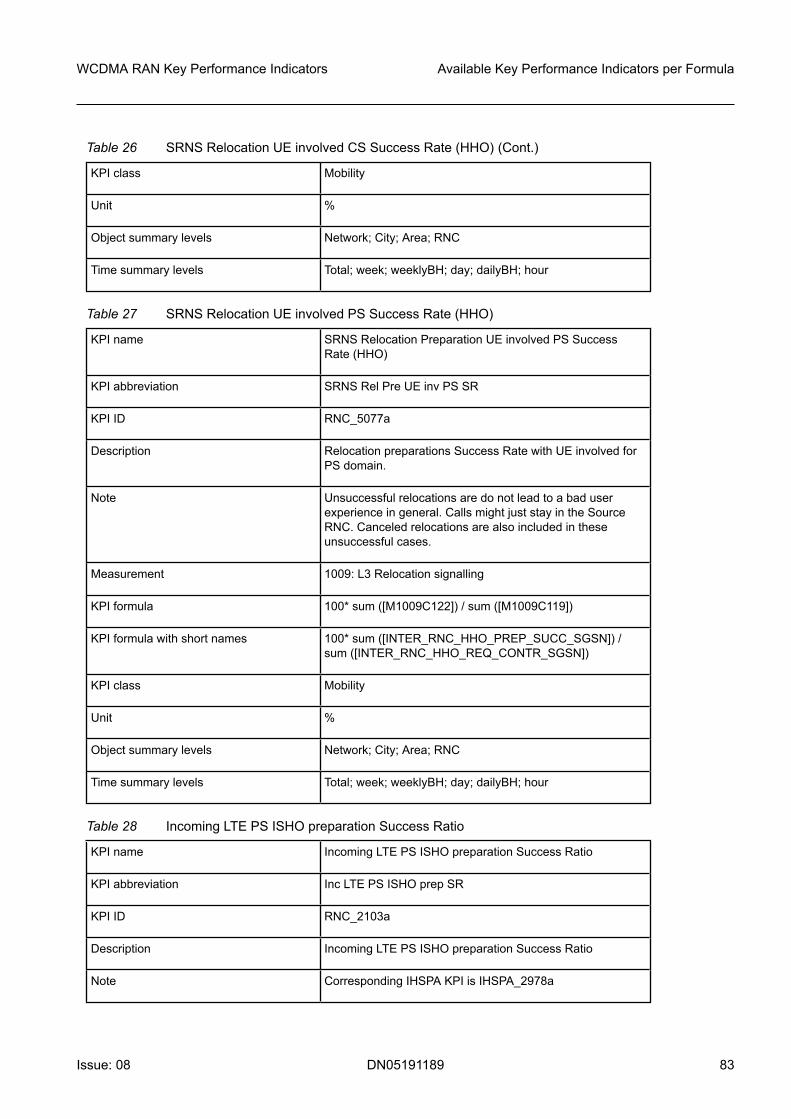
Table 26 SRNS Relocation UE involved CS Success Rate (HHO) (Cont.)
KPI class Mobility
Unit %
Object summary levels Network; City; Area; RNC
Time summary levels Total; week; weeklyBH; day; dailyBH; hour
Table 27 SRNS Relocation UE involved PS Success Rate (HHO)
KPI name SRNS Relocation Preparation UE involved PS SuccessRate (HHO)
KPI abbreviation SRNS Rel Pre UE inv PS SR
KPI ID RNC_5077a
Description Relocation preparations Success Rate with UE involved forPS domain.
Note Unsuccessful relocations are do not lead to a bad userexperience in general. Calls might just stay in the SourceRNC. Canceled relocations are also included in theseunsuccessful cases.
Measurement 1009: L3 Relocation signalling
KPI formula 100* sum ([M1009C122]) / sum ([M1009C119])
KPI formula with short names 100* sum ([INTER_RNC_HHO_PREP_SUCC_SGSN]) /sum ([INTER_RNC_HHO_REQ_CONTR_SGSN])
KPI class Mobility
Unit %
Object summary levels Network; City; Area; RNC
Time summary levels Total; week; weeklyBH; day; dailyBH; hour
Table 28 Incoming LTE PS ISHO preparation Success Ratio
KPI name Incoming LTE PS ISHO preparation Success Ratio
KPI abbreviation Inc LTE PS ISHO prep SR
KPI ID RNC_2103a
Description Incoming LTE PS ISHO preparation Success Ratio
Note Corresponding IHSPA KPI is IHSPA_2978a
WCDMA RAN Key Performance Indicators Available Key Performance Indicators per Formula
Issue: 08 DN05191189 83

Table 28 Incoming LTE PS ISHO preparation Success Ratio (Cont.)
Measurement 1009: L3 Relocation signalling
KPI formula 100*sum([M1009C277]) / sum([M1009C276])
KPI formula with short names 100*sum([LTE_PS_IN_PREP_SUCC]) /sum([LTE_PS_IN_PREP_REQ])
KPI class Mobility / Handover
Unit %
Object summary levels Network, RNC
Time summary levels Total; week; weeklyBH; day; dailyBH; hour
Table 29 Outgoing LTE PS ISHO Preparation Success Rate
KPI name Outgoing LTE PS ISHO Preparation Success Rate
KPI abbreviation Out LTE PS ISHO Prep SR
KPI ID RNC_5502a
Description This KPI shows the outgoing WCDMA -> LTE PS Inter-system Hard Handovers preparation success ratio(RT/NRT).
Measurement 1036: LTE Relocation
KPI formula100*sum([M1036C1]) / sum([M1036C0])
KPI formula with short names100*sum([LTE_PS_ISHO_OUT_PREP_SUCC]) / sum([LTE_PS_ISHO_OUT_PREP_REQ])
KPI class Mobility / Handover
Unit %
Object summary levels Network, City, Area, RNC, Cluster of cells, Cell
Time summary levels Total; week; weeklyBH; day; dailyBH; hour
Table 30 Incoming LTE PS ISHO Relocation Complete Success Ratio
KPI name Incoming LTE PS ISHO relocation complete Success Ratio
KPI abbreviation In LTE PS ISHO rl cmp SR
Available Key Performance Indicators per Formula WCDMA RAN Key Performance Indicators
84 DN05191189 Issue: 08

Table 30 Incoming LTE PS ISHO Relocation Complete Success Ratio (Cont.)
KPI ID RNC_2104a
Description Incoming LTE PS ISHO relocation complete Success Ratio
Note Corresponding IHSPA KPI is IHSPA_2979a
Measurement 1009: L3 Relocation signalling
KPI formula 100*sum([M1009C285]) / sum([M1009C276])
KPI formula with short names 100*sum([LTE_PS_IN_COMPLETE]) /sum([LTE_PS_IN_PREP_REQ])
KPI class Mobility / Handover
Unit %
Object summary levels Network, RNC
Time summary levels Total; week; weeklyBH; day; dailyBH; hour
4.1.2 Access network level indicators for retainability
The services and resources related to the KPIs are described in Radio network in the 3Gsystem and UTRAN Resource Model overview in WCDMA RAN System Overview.
For an overview on WCDMA RAN KPIs, see Overview of WCDMA RAN keyperformance indicators.
4.1.2.1 Call Success Ratio (CSR) [%]
AMR Call Success Ratio (CSR) is the same as RNC_231d. See RAB Success Ratio.
UDI Call Success Ratio (CSR) is the same as RNC_232e. See RAB Success Ratio.
Streaming Call Success Ratio (CSR) is the same as RNC_619a. See RAB SuccessRatio.
Packet Service Success Ratio (CSR) is the same as RNC_736a. See RAB SuccessRatio.
Multi Service Success Ratio (CSR) is the same as RNC_742a. See RAB Success Ratio.
4.1.2.2 RRC Success Ratio [%]
g The normal release counter in the formula includes also the cases when CNhas released the RRC connection with cause ‘unspecified’.
Table 31 RRC Success Ratio
KPI name RRC Success Ratio
WCDMA RAN Key Performance Indicators Available Key Performance Indicators per Formula
Issue: 08 DN05191189 85

Table 31 RRC Success Ratio (Cont.)
KPI abbreviation RRC SR
KPI ID RNC_217f
Description RRC Success Ratio [%] over the reporting period. Covers RRC Active Phaseof a call.
Note The normal release counter in the formula includes also the cases when CNhas released the RRC connection with cause 'unspecified'.
Measurement M1001: Service Level
KPI formula 100-100*sum([M1001C14] + [M1001C15] + [M1001C16] + [M1001C17] +[M1001C18] + [M1001C21] + [M1001C391] +[M1001C689] +[M1001C19]) /sum([M1001C12] + [M1001C13] + [M1001C643] + [M1001C800] +[M1001C642] + [M1001C803] + [M1001C14] + [M1001C15] + [M1001C16] +[M1001C17] + [M1001C18] +[M1001C21] + [M1001C391] + [M1001C689]+[M1001C19])
KPI formula with short names 100-100* sum([RRC_CONN_ACT_REL_P_EMP] +[RRC_CONN_ACT_FAIL_IU] + [RRC_CONN_ACT_FAIL_RADIO] +[RRC_CONN_ACT_FAIL_BTS] + [RRC_CONN_ACT_FAIL_IUR] +[RRC_CONN_ACT_FAIL_RNC] + [RRC_CONN_ACT_FAIL_UE] +[RRC_CONN_ACT_FAIL_TRANS] + [RRC_CONN_ACT_FAIL_CIPH]) /sum([RRC_CONN_ACT_COMP] + [RRC_CONN_ACT_REL_SRNC] +[RRC_CONN_ACT_REL_GANHO] + [RRC_CONN_ACT_REL_HHO] +[RRC_CONN_ACT_REL_INTRA_HHO] + [RRC_CONN_ACT_REL_ISHO] +[RRC_CONN_ACT_REL_P_EMP] + [RRC_CONN_ACT_FAIL_IU] +[RRC_CONN_ACT_FAIL_RADIO] + [RRC_CONN_ACT_FAIL_BTS] +[RRC_CONN_ACT_FAIL_IUR] + [RRC_CONN_ACT_FAIL_RNC] +[RRC_CONN_ACT_FAIL_UE] + [RRC_CONN_ACT_FAIL_TRANS] +[RRC_CONN_ACT_FAIL_CIPH])
KPI class Retainability
Unit %
Typical values > 99.5 %
Object Summary Levels Network, City, Area, RNC, Cluster of cells, Cell
Time Summary Levels Week, Day, Hour
4.1.2.3 RRC Connection releases [#]
Table 32 RRC connection releases with LTE redirection
KPI name RRC connection releases with LTE redirection
KPI abbreviation RRC rel LTE redir
KPI ID RNC_5464a
Available Key Performance Indicators per Formula WCDMA RAN Key Performance Indicators
86 DN05191189 Issue: 08
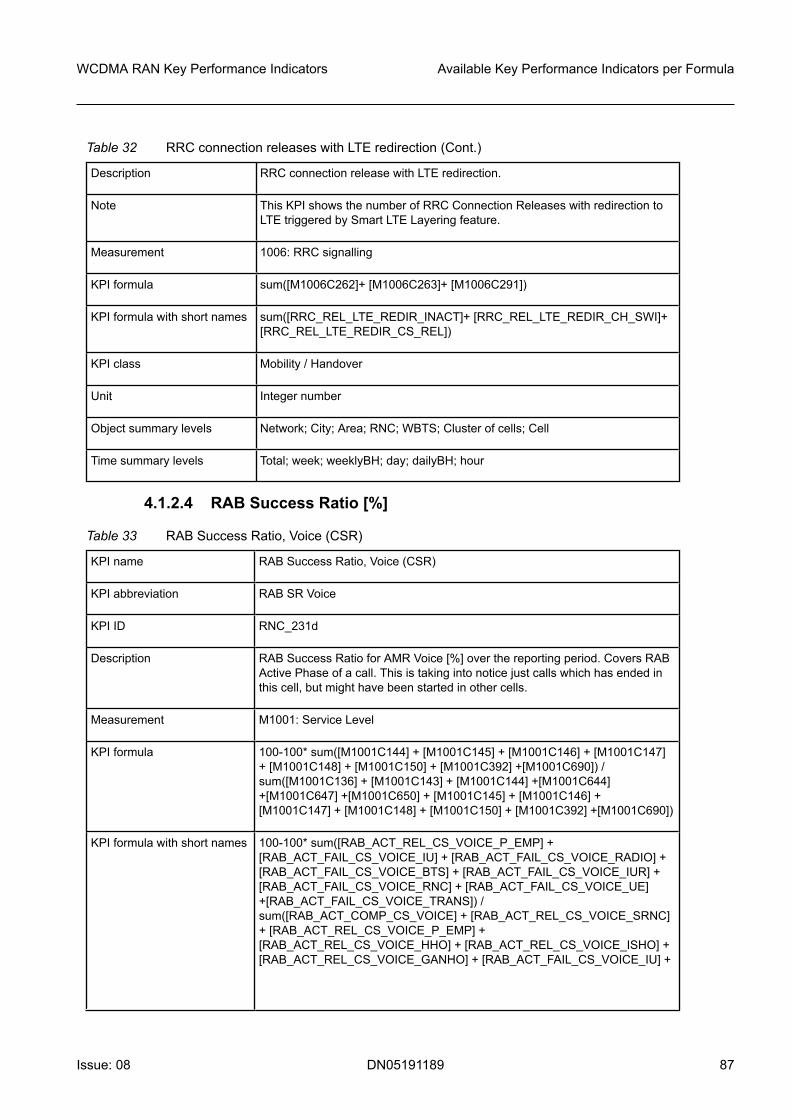
Table 32 RRC connection releases with LTE redirection (Cont.)
Description RRC connection release with LTE redirection.
Note This KPI shows the number of RRC Connection Releases with redirection toLTE triggered by Smart LTE Layering feature.
Measurement 1006: RRC signalling
KPI formula sum([M1006C262]+ [M1006C263]+ [M1006C291])
KPI formula with short names sum([RRC_REL_LTE_REDIR_INACT]+ [RRC_REL_LTE_REDIR_CH_SWI]+[RRC_REL_LTE_REDIR_CS_REL])
KPI class Mobility / Handover
Unit Integer number
Object summary levels Network; City; Area; RNC; WBTS; Cluster of cells; Cell
Time summary levels Total; week; weeklyBH; day; dailyBH; hour
4.1.2.4 RAB Success Ratio [%]
Table 33 RAB Success Ratio, Voice (CSR)
KPI name RAB Success Ratio, Voice (CSR)
KPI abbreviation RAB SR Voice
KPI ID RNC_231d
Description RAB Success Ratio for AMR Voice [%] over the reporting period. Covers RABActive Phase of a call. This is taking into notice just calls which has ended inthis cell, but might have been started in other cells.
Measurement M1001: Service Level
KPI formula 100-100* sum([M1001C144] + [M1001C145] + [M1001C146] + [M1001C147]+ [M1001C148] + [M1001C150] + [M1001C392] +[M1001C690]) /sum([M1001C136] + [M1001C143] + [M1001C144] +[M1001C644]+[M1001C647] +[M1001C650] + [M1001C145] + [M1001C146] +[M1001C147] + [M1001C148] + [M1001C150] + [M1001C392] +[M1001C690])
KPI formula with short names 100-100* sum([RAB_ACT_REL_CS_VOICE_P_EMP] +[RAB_ACT_FAIL_CS_VOICE_IU] + [RAB_ACT_FAIL_CS_VOICE_RADIO] +[RAB_ACT_FAIL_CS_VOICE_BTS] + [RAB_ACT_FAIL_CS_VOICE_IUR] +[RAB_ACT_FAIL_CS_VOICE_RNC] + [RAB_ACT_FAIL_CS_VOICE_UE]+[RAB_ACT_FAIL_CS_VOICE_TRANS]) /sum([RAB_ACT_COMP_CS_VOICE] + [RAB_ACT_REL_CS_VOICE_SRNC]+ [RAB_ACT_REL_CS_VOICE_P_EMP] +[RAB_ACT_REL_CS_VOICE_HHO] + [RAB_ACT_REL_CS_VOICE_ISHO] +[RAB_ACT_REL_CS_VOICE_GANHO] + [RAB_ACT_FAIL_CS_VOICE_IU] +
WCDMA RAN Key Performance Indicators Available Key Performance Indicators per Formula
Issue: 08 DN05191189 87

Table 33 RAB Success Ratio, Voice (CSR) (Cont.)
[RAB_ACT_FAIL_CS_VOICE_RADIO] + [RAB_ACT_FAIL_CS_VOICE_BTS]+ [RAB_ACT_FAIL_CS_VOICE_IUR] + [RAB_ACT_FAIL_CS_VOICE_RNC] +[RAB_ACT_FAIL_CS_VOICE_UE] + [RAB_ACT_FAIL_CS_VOICE_TRANS])
KPI class Retainability
Unit %
Typical values > 99.5 %
Object Summary Levels Network, City, Area, RNC, Cluster of cells, Cell
Time Summary Levels Week, Day, Hour
Table 34 RAB Success Ratio, Voice (CSR) (re-establishment included)
KPI name RAB Success Ratio, Voice (CSR) (re-establishment included)
KPI abbreviation RAB SR Voice, re-est incl
KPI ID RNC_5434a
Description RAB Success Ratio for AMR Voice [%] including RRC Call re-establishmentinto the formula. Successful re-establishments are considered in the sameway as abnormal releases(failures)from end user point of view.
Note This KPI is calculated similarly as RNC_231d "RAB Success Ratio, Voice(CSR)" additionally taking into account RRC Call Re-establishments as"failures" from end user point of view. This KPI is taking into notice just callswhich have successfully reestablished or have ended in this cell, but mighthave been started in other cells.
Measurement 1001: Service Level
1006: RRC signalling
KPI formula 100-100* sum([M1001C144] + [M1001C145] + [M1001C146] + [M1001C147]+ [M1001C148] + [M1001C150] + [M1001C392] + [M1001C690]+[M1006C186]) / sum([M1001C136] + [M1001C143] + [M1001C144] +[M1001C644] + [M1001C647] + [M1001C650] + [M1001C145] + [M1001C146]+ [M1001C147] + [M1001C148] + [M1001C150] + [M1001C392] +[M1001C690]+ [M1006C186])
KPI formula with short names 100-100* sum([RAB_ACT_REL_CS_VOICE_P_EMP] +[RAB_ACT_FAIL_CS_VOICE_IU] + [RAB_ACT_FAIL_CS_VOICE_RADIO] +[RAB_ACT_FAIL_CS_VOICE_BTS] + [RAB_ACT_FAIL_CS_VOICE_IUR] +[RAB_ACT_FAIL_CS_VOICE_RNC] + [RAB_ACT_FAIL_CS_VOICE_UE] +[RAB_ACT_FAIL_CS_VOICE_TRANS]+ [RRC_RE_EST_SUCC_RT]) /sum([RAB_ACT_COMP_CS_VOICE] + [RAB_ACT_REL_CS_VOICE_SRNC]+ [RAB_ACT_REL_CS_VOICE_P_EMP] +[RAB_ACT_REL_CS_VOICE_HHO] + [RAB_ACT_REL_CS_VOICE_ISHO] +[RAB_ACT_REL_CS_VOICE_GANHO] + [RAB_ACT_FAIL_CS_VOICE_IU] +[RAB_ACT_FAIL_CS_VOICE_RADIO] + [RAB_ACT_FAIL_CS_VOICE_BTS]
Available Key Performance Indicators per Formula WCDMA RAN Key Performance Indicators
88 DN05191189 Issue: 08

Table 34 RAB Success Ratio, Voice (CSR) (re-establishment included) (Cont.)
+ [RAB_ACT_FAIL_CS_VOICE_IUR] + [RAB_ACT_FAIL_CS_VOICE_RNC] +[RAB_ACT_FAIL_CS_VOICE_UE] + [RAB_ACT_FAIL_CS_VOICE_TRANS]+[RRC_RE_EST_SUCC_RT])
KPI class Retainability
Unit %
Object summary levels Network, City, Area, RNC, Cluster of cells, Cell
Time summary levels Week, Day, Hour
Table 35 RAB Success Ratio, RT Services Excluding Voice, User perspective
KPI name RAB Success Ratio, RT Services Excluding Voice, User perspective
KPI abbreviation RAB SR RT serv excl V Usr
KPI ID RNC_160e
Description RAB Success Ratio for RT Services Excluding Voice [%] over the reportingperiod. Covers RAB Active Phase of a call.
Measurement M1001: Service Level
KPI formula 100-100*sum([M1001C152]+[M1001C154]+[M1001C170]+[M1001C155]+[M1001C156]+[M1001C157]+[M1001C158] +[M1001C160]+[M1001C161]+[M1001C162]+[M1001C163] +[M1001C164]+[M1001C166]+[M1001C179]+[M1001C180]+[M1001C181]+[M1001C182]+[M1001C184]+[M1001C393] +[M1001C394]+[M1001C396]+[M1001C691]+[M1001C692] + [M1001C693]) /sum([M1001C137]+[M1001C138] +[M1001C140]+[M1001C152]+[M1001C151]+[M1001C154] +[M1001C153]+[M1001C170]+[M1001C169]+[M1001C155] +[M1001C156]+[M1001C157]+[M1001C158]+[M1001C160] +[M1001C161]+[M1001C162]+[M1001C163]+[M1001C164] +[M1001C166]+[M1001C179]+[M1001C180]+[M1001C181] +[M1001C182]+[M1001C184]+[M1001C393]+[M1001C394] +[M1001C396]+[M1001C691]+[M1001C692]+[M1001C693]+[M1001C645]+[M1001C646]+[M1001C648]+[M1001C649] + [M1001C806]+[M1001C807])
KPI formula with short names 100-100*sum([RAB_ACT_REL_CS_CONV_P_EMP] +[RAB_ACT_REL_CS_STREA_P_EMP] +[RAB_ACT_REL_PS_STREA_P_EMP] + [RAB_ACT_FAIL_CS_CONV_IU] +[RAB_ACT_FAIL_CS_CONV_RADIO] + [RAB_ACT_FAIL_CS_CONV_BTS] +[RAB_ACT_FAIL_CS_CONV_IUR] + [RAB_ACT_FAIL_CS_CONV_RNC] +[RAB_ACT_FAIL_CS_STREA_IU] + [RAB_ACT_FAIL_CS_STREA_RADIO] +[RAB_ACT_FAIL_CS_STREA_BTS] + [RAB_ACT_FAIL_CS_STREA_IUR] +[RAB_ACT_FAIL_CS_STREA_RNC] + [RAB_ACT_FAIL_PS_STREA_IU] +[RAB_ACT_FAIL_PS_STREA_RADIO] + [RAB_ACT_FAIL_PS_STREA_BTS]+ [RAB_ACT_FAIL_PS_STREA_IUR] + [RAB_ACT_FAIL_PS_STREA_RNC]+ [RAB_ACT_FAIL_CS_CONV_UE] + [RAB_ACT_FAIL_CS_STREA_UE] +[RAB_ACT_FAIL_PS_STREA_UE] + [RAB_ACT_FAIL_CS_CONV_TRANS] +
WCDMA RAN Key Performance Indicators Available Key Performance Indicators per Formula
Issue: 08 DN05191189 89
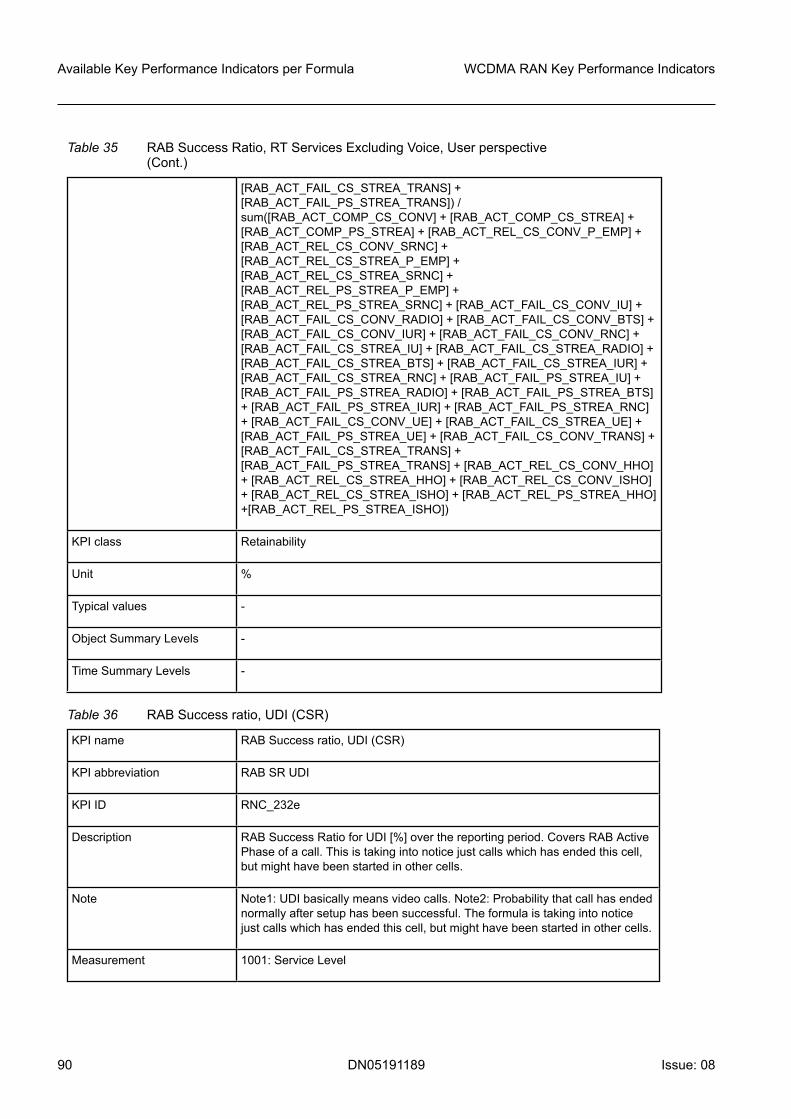
Table 35 RAB Success Ratio, RT Services Excluding Voice, User perspective(Cont.)
[RAB_ACT_FAIL_CS_STREA_TRANS] +[RAB_ACT_FAIL_PS_STREA_TRANS]) /sum([RAB_ACT_COMP_CS_CONV] + [RAB_ACT_COMP_CS_STREA] +[RAB_ACT_COMP_PS_STREA] + [RAB_ACT_REL_CS_CONV_P_EMP] +[RAB_ACT_REL_CS_CONV_SRNC] +[RAB_ACT_REL_CS_STREA_P_EMP] +[RAB_ACT_REL_CS_STREA_SRNC] +[RAB_ACT_REL_PS_STREA_P_EMP] +[RAB_ACT_REL_PS_STREA_SRNC] + [RAB_ACT_FAIL_CS_CONV_IU] +[RAB_ACT_FAIL_CS_CONV_RADIO] + [RAB_ACT_FAIL_CS_CONV_BTS] +[RAB_ACT_FAIL_CS_CONV_IUR] + [RAB_ACT_FAIL_CS_CONV_RNC] +[RAB_ACT_FAIL_CS_STREA_IU] + [RAB_ACT_FAIL_CS_STREA_RADIO] +[RAB_ACT_FAIL_CS_STREA_BTS] + [RAB_ACT_FAIL_CS_STREA_IUR] +[RAB_ACT_FAIL_CS_STREA_RNC] + [RAB_ACT_FAIL_PS_STREA_IU] +[RAB_ACT_FAIL_PS_STREA_RADIO] + [RAB_ACT_FAIL_PS_STREA_BTS]+ [RAB_ACT_FAIL_PS_STREA_IUR] + [RAB_ACT_FAIL_PS_STREA_RNC]+ [RAB_ACT_FAIL_CS_CONV_UE] + [RAB_ACT_FAIL_CS_STREA_UE] +[RAB_ACT_FAIL_PS_STREA_UE] + [RAB_ACT_FAIL_CS_CONV_TRANS] +[RAB_ACT_FAIL_CS_STREA_TRANS] +[RAB_ACT_FAIL_PS_STREA_TRANS] + [RAB_ACT_REL_CS_CONV_HHO]+ [RAB_ACT_REL_CS_STREA_HHO] + [RAB_ACT_REL_CS_CONV_ISHO]+ [RAB_ACT_REL_CS_STREA_ISHO] + [RAB_ACT_REL_PS_STREA_HHO]+[RAB_ACT_REL_PS_STREA_ISHO])
KPI class Retainability
Unit %
Typical values -
Object Summary Levels -
Time Summary Levels -
Table 36 RAB Success ratio, UDI (CSR)
KPI name RAB Success ratio, UDI (CSR)
KPI abbreviation RAB SR UDI
KPI ID RNC_232e
Description RAB Success Ratio for UDI [%] over the reporting period. Covers RAB ActivePhase of a call. This is taking into notice just calls which has ended this cell,but might have been started in other cells.
Note Note1: UDI basically means video calls. Note2: Probability that call has endednormally after setup has been successful. The formula is taking into noticejust calls which has ended this cell, but might have been started in other cells.
Measurement 1001: Service Level
Available Key Performance Indicators per Formula WCDMA RAN Key Performance Indicators
90 DN05191189 Issue: 08

Table 36 RAB Success ratio, UDI (CSR) (Cont.)
KPI formula 100-100* sum([M1001C155] + [M1001C156] + [M1001C157] + [M1001C160]+ [M1001C158] + [M1001C393] + [M1001C152] + [M1001C691]) /sum([M1001C137] + [M1001C151] + [M1001C645] + [M1001C648] +[M1001C152] + [M1001C155] + [M1001C156] + [M1001C157] +[M1001C160] + [M1001C158] + [M1001C393] + [M1001C691])
KPI formula with short names 100-100* sum([RAB_ACT_FAIL_CS_CONV_IU] +[RAB_ACT_FAIL_CS_CONV_RADIO] + [RAB_ACT_FAIL_CS_CONV_BTS]+ [RAB_ACT_FAIL_CS_CONV_RNC] + [RAB_ACT_FAIL_CS_CONV_IUR] +[RAB_ACT_FAIL_CS_CONV_UE] + [RAB_ACT_REL_CS_CONV_P_EMP] +[RAB_ACT_FAIL_CS_CONV_TRANS]) /sum([RAB_ACT_COMP_CS_CONV] + [RAB_ACT_REL_CS_CONV_SRNC]+ [RAB_ACT_REL_CS_CONV_HHO] + [RAB_ACT_REL_CS_CONV_ISHO]+ [RAB_ACT_REL_CS_CONV_P_EMP] + [RAB_ACT_FAIL_CS_CONV_IU]+ [RAB_ACT_FAIL_CS_CONV_RADIO] +[RAB_ACT_FAIL_CS_CONV_BTS] + [RAB_ACT_FAIL_CS_CONV_RNC] +[RAB_ACT_FAIL_CS_CONV_IUR] + [RAB_ACT_FAIL_CS_CONV_UE] +[RAB_ACT_FAIL_CS_CONV_TRANS])
KPI class Retainability
Unit %
Target values > 99 %
Object summary levels Network, RNC
Time summary levels Week, Day, Hour
KPI name RAB Success ratio, UDI (CSR)
Table 37 RAB Success Ratio, Streaming (CSR)
KPI name RAB Success Ratio, Streaming (CSR)
KPI abbreviation RAB SR Streaming
KPI ID RNC_619b
Description RAB Success Ratio for Streaming Services from user perspective over thereporting period. Covers RAB Active Phase of a call.
Note The formula is taking into notice just calls which has ended this cell, but mighthave been started in other cells.
Measurement M1001: Service Level
KPI formula 100-100*sum([M1001C154] + [M1001C170] + [M1001C161] + [M1001C162]+ [M1001C163] + [M1001C164] + [M1001C166] + [M1001C179] +[M1001C180] + [M1001C181] + [M1001C182] + [M1001C184] +[M1001C394] + [M1001C396]+ [M1001C692] + [M1001C693]) /sum([M1001C138] + [M1001C140] + [M1001C154] + [M1001C153]+[M1001C646]+ [M1001C649]+ [M1001C170] + [M1001C169]+ [M1001C806]+
WCDMA RAN Key Performance Indicators Available Key Performance Indicators per Formula
Issue: 08 DN05191189 91

Table 37 RAB Success Ratio, Streaming (CSR) (Cont.)
[M1001C807]+ [M1001C161] + [M1001C162] + [M1001C163] + [M1001C164]+ [M1001C166] + [M1001C179] + [M1001C180] + [M1001C181] +[M1001C182] + [M1001C184] + [M1001C394] + [M1001C396]+[M1001C692]+ [M1001C693])
KPI formula with short names 100-100* sum([RAB_ACT_REL_CS_STREA_P_EMP] +[RAB_ACT_REL_PS_STREA_P_EMP] + [RAB_ACT_FAIL_CS_STREA_IU]+ [RAB_ACT_FAIL_CS_STREA_RADIO] +[RAB_ACT_FAIL_CS_STREA_BTS] + [RAB_ACT_FAIL_CS_STREA_IUR] +[RAB_ACT_FAIL_CS_STREA_RNC] + [RAB_ACT_FAIL_PS_STREA_IU] +[RAB_ACT_FAIL_PS_STREA_RADIO] + [RAB_ACT_FAIL_PS_STREA_BTS]+ [RAB_ACT_FAIL_PS_STREA_IUR] + [RAB_ACT_FAIL_PS_STREA_RNC]+ [RAB_ACT_FAIL_CS_STREA_UE] + [RAB_ACT_FAIL_PS_STREA_UE]+[RAB_ACT_FAIL_CS_STREA_TRANS]+[RAB_ACT_FAIL_PS_STREA_TRANS]) /sum([RAB_ACT_COMP_CS_STREA] + [RAB_ACT_COMP_PS_STREA] +[RAB_ACT_REL_CS_STREA_P_EMP] +[RAB_ACT_REL_CS_STREA_SRNC]+[RAB_ACT_REL_CS_STREA_HHO]+ [RAB_ACT_REL_CS_STREA_ISHO]+[RAB_ACT_REL_PS_STREA_P_EMP] +[RAB_ACT_REL_PS_STREA_SRNC]+ [RAB_ACT_REL_PS_STREA_HHO]+[RAB_ACT_REL_PS_STREA_ISHO]+ [RAB_ACT_FAIL_CS_STREA_IU] +[RAB_ACT_FAIL_CS_STREA_RADIO] +[RAB_ACT_FAIL_CS_STREA_BTS] + [RAB_ACT_FAIL_CS_STREA_IUR] +[RAB_ACT_FAIL_CS_STREA_RNC] + [RAB_ACT_FAIL_PS_STREA_IU] +[RAB_ACT_FAIL_PS_STREA_RADIO] + [RAB_ACT_FAIL_PS_STREA_BTS]+ [RAB_ACT_FAIL_PS_STREA_IUR] + [RAB_ACT_FAIL_PS_STREA_RNC]+ [RAB_ACT_FAIL_CS_STREA_UE] + [RAB_ACT_FAIL_PS_STREA_UE]+[RAB_ACT_FAIL_CS_STREA_TRANS]+[RAB_ACT_FAIL_PS_STREA_TRANS])
KPI class Retainability
Unit %
Typical values > 99%
Object Summary Levels Network, RNC
Time Summary Levels Week, Day, Hour
Table 38 RAB Success Ratio, NRT Services, from Network Perspective
KPI name RAB Success Ratio, NRT Services, from Network Perspective
KPI abbreviation RAB SR NRT serv NW
KPI ID RNC_615c
Description RAB Success Ratio for NRT Services [%] over the reporting period. CoversRAB Active Phase of a call.
Note For NRT RABs pre-emption is not possible.
Available Key Performance Indicators per Formula WCDMA RAN Key Performance Indicators
92 DN05191189 Issue: 08

Table 38 RAB Success Ratio, NRT Services, from Network Perspective (Cont.)
Measurement M1001: Service Level
KPI formula 100-100* sum([M1001C185] +[M1001C186] +[M1001C187] + [M1001C188]+[M1001C190] +[M1001C191] + [M1001C192] +[M1001C193] +[M1001C194]+[M1001C196] + [M1001C398] +[M1001C397] + [M1001C694] +[M1001C695]) / sum([M1001C141] +[M1001C142]) + [M1001C171] +[M1001C801] +[M1001C804] +[M1001C172] +[M1001C802] + [M1001C805]+[M1001C185] +[M1001C186] + [M1001C187] +[M1001C188] +[M1001C190]+[M1001C191] + [M1001C192] + [M1001C193] + [M1001C194] + [M1001C196]+ [M1001C398] +[M1001C397] +[M1001C694] + [M1001C695])
KPI formula with short names 100-100* sum([RAB_ACT_FAIL_PS_INTER_IU] +[RAB_ACT_FAIL_PS_INTER_RADIO] + [RAB_ACT_FAIL_PS_INTER_BTS] +[RAB_ACT_FAIL_PS_INTER_IUR] + [RAB_ACT_FAIL_PS_INTER_RNC] +[RAB_ACT_FAIL_PS_BACKG_IU] + [RAB_ACT_FAIL_PS_BACKG_RADIO] +[RAB_ACT_FAIL_PS_BACKG_BTS] + [RAB_ACT_FAIL_PS_BACKG_IUR] +[RAB_ACT_FAIL_PS_BACKG_RNC] + [RAB_ACT_FAIL_PS_BACKG_UE] +[RAB_ACT_FAIL_PS_INTER_UE] + [RAB_ACT_FAIL_PS_INTER_TRANS] +[RAB_ACT_FAIL_PS_BACKG_TRANS]) /sum([RAB_ACT_COMP_PS_INTER] + [RAB_ACT_COMP_PS_BACKG]) +[RAB_ACT_REL_PS_INTER_SRNC] + [RAB_ACT_REL_PS_INTER_HHO] +[RAB_ACT_REL_PS_INTER_ISHO] + [RAB_ACT_REL_PS_BACKG_SRNC] +[RAB_ACT_REL_PS_BACKG_HHO] + [RAB_ACT_REL_PS_BGR_ISHO] +[RAB_ACT_FAIL_PS_INTER_IU] + [RAB_ACT_FAIL_PS_INTER_RADIO] +[RAB_ACT_FAIL_PS_INTER_BTS] + [RAB_ACT_FAIL_PS_INTER_IUR] +[RAB_ACT_FAIL_PS_INTER_RNC] + [RAB_ACT_FAIL_PS_BACKG_IU] +[RAB_ACT_FAIL_PS_BACKG_RADIO] + [RAB_ACT_FAIL_PS_BACKG_BTS]+ [RAB_ACT_FAIL_PS_BACKG_IUR] + [RAB_ACT_FAIL_PS_BACKG_RNC]+ [RAB_ACT_FAIL_PS_BACKG_UE] + [RAB_ACT_FAIL_PS_INTER_UE] +[RAB_ACT_FAIL_PS_INTER_TRANS] +[RAB_ACT_FAIL_PS_BACKG_TRANS])
KPI class Retainability
Unit Percentage
Typical values > 95-99 % (depends on inactivity timer settings, usually 98 % is achieved)
Object Summary Levels Network, City, Area, RNC, Cluster of cells, Cell
Time Summary Levels Week, Day, Hour
Table 39 RAB Success Ratio, NRT Services
KPI name RAB Success Ratio, NRT Services
KPI abbreviation RAB SR NRT Services
KPI ID RNC_736b
Description RAB Success Ratio for NRT Services [%] from user perspective over thereporting period. Covers RAB Active Phase of a call.
WCDMA RAN Key Performance Indicators Available Key Performance Indicators per Formula
Issue: 08 DN05191189 93

Table 39 RAB Success Ratio, NRT Services (Cont.)
Note 1 For NRT RABs pre-emption is not possible.
Note 2 As the formula is based on active fail counters it means in this case that whenRAB drops in CELL_PCH state that two fail counters are updated. This is takeninto account in the formula (the drops in CELL_PCH subtracted from all drops.
Measurement M1001: Service Level
KPI formula 100-100* sum([M1001C695] +[M1001C694] +[M1001C185] + [M1001C186] +[M1001C187] + [M1001C188] + [M1001C190] + [M1001C191] + [M1001C192]+ [M1001C193] + [M1001C194] + [M1001C196] +[M1001C398] +[M1001C397] - [M1001C594] - [M1001C593]) / sum([M1001C141] +[M1001C142] + [M1001C171] +[M1001C801] +[M1001C804] +[M1001C172] +[M1001C802] +[M1001C805] +[M1001C185] + [M1001C186] + [M1001C187] +[M1001C188] + [M1001C190] + [M1001C191] + [M1001C192] + [M1001C193]+[M1001C194] + [M1001C196] + [M1001C398] + [M1001C397] +[M1001C694]+[M1001C695])
KPI formula with short names 100-100* sum([RAB_ACT_FAIL_PS_BACKG_TRANS] +[RAB_ACT_FAIL_PS_INTER_TRANS] + [RAB_ACT_FAIL_PS_INTER_IU] +[RAB_ACT_FAIL_PS_INTER_RADIO] + [RAB_ACT_FAIL_PS_INTER_BTS] +[RAB_ACT_FAIL_PS_INTER_IUR] + [RAB_ACT_FAIL_PS_INTER_RNC] +[RAB_ACT_FAIL_PS_BACKG_IU] + [RAB_ACT_FAIL_PS_BACKG_RADIO] +[RAB_ACT_FAIL_PS_BACKG_BTS] + [RAB_ACT_FAIL_PS_BACKG_IUR] +[RAB_ACT_FAIL_PS_BACKG_RNC] + [RAB_ACT_FAIL_PS_BACKG_UE] +[RAB_ACT_FAIL_PS_INTER_UE] - [RAB_ACT_FAIL_PS_BACKG_PCH] -[RAB_ACT_FAIL_PS_INT_PCH]) / sum([RAB_ACT_COMP_PS_INTER] +[RAB_ACT_COMP_PS_BACKG] + [RAB_ACT_REL_PS_INTER_SRNC] +[RAB_ACT_REL_PS_INTER_HHO] + [RAB_ACT_REL_PS_INTER_ISHO] +[RAB_ACT_REL_PS_BACKG_SRNC] + [RAB_ACT_REL_PS_BACKG_HHO]+ [RAB_ACT_REL_PS_BGR_ISHO] + [RAB_ACT_FAIL_PS_INTER_IU] +[RAB_ACT_FAIL_PS_INTER_RADIO] + [RAB_ACT_FAIL_PS_INTER_BTS] +[RAB_ACT_FAIL_PS_INTER_IUR] + [RAB_ACT_FAIL_PS_INTER_RNC] +[RAB_ACT_FAIL_PS_BACKG_IU] + [RAB_ACT_FAIL_PS_BACKG_RADIO] +[RAB_ACT_FAIL_PS_BACKG_BTS] + [RAB_ACT_FAIL_PS_BACKG_IUR] +[RAB_ACT_FAIL_PS_BACKG_RNC] + [RAB_ACT_FAIL_PS_BACKG_UE] +[RAB_ACT_FAIL_PS_INTER_UE] + [RAB_ACT_FAIL_PS_INTER_TRANS] +[RAB_ACT_FAIL_PS_BACKG_TRANS])
KPI class Retainability
Unit Percentage
Typical values > 99%
Object Summary Levels Network, City, Area, RNC, Cluster of cells, Cell
Time Summary Levels Week, Day, Hour
4.1.2.5 Packet Session Success Ratio (SSR) [%]
Table 40 Packet Session Success Ratio
KPI name Packet Session Success Ratio
Available Key Performance Indicators per Formula WCDMA RAN Key Performance Indicators
94 DN05191189 Issue: 08

Table 40 Packet Session Success Ratio (Cont.)
KPI abbreviation Packet Session SR
KPI ID RNC_922b
Description The Packet Session Success Ratio for Streaming, Interactive and BackgroundServices.
Note 1 For differences between Packet Service, Packet Session and Packet call, seeRAN KPI Document. The pre-emptions are not considered in formula.
Measurement M1022: Packet Call
KPI formula 100-100* sum([M1022C57] + [M1022C58] + [M1022C59] + [M1022C60] +[M1022C61] + [M1022C62] + [M1022C63] + [M1022C64] + [M1022C65] +[M1022C66] + [M1022C67] + [M1022C68] + [M1022C208] + [M1022C209] +[M1022C210] + [M1022C211] + [M1022C212] + [M1022C213]) /sum([M1022C57] + [M1022C58] + [M1022C59] + [M1022C60] + [M1022C61] +[M1022C62] + [M1022C63] + [M1022C64] + [M1022C65] + [M1022C66] +[M1022C67] + [M1022C68] + [M1022C45] + [M1022C46] + [M1022C47] +[M1022C48] + [M1022C49] + [M1022C50] + [M1022C208] + [M1022C209] +[M1022C210] + [M1022C211] + [M1022C212] + [M1022C213] + [M1022C202] +[M1022C203] + [M1022C204])
KPI formula with short names 100-100* sum([PS_REL_RL_FAIL_HS_E_INT] +[PS_REL_RL_FAIL_HS_E_BGR] + [PS_REL_RL_FAIL_HS_D_INT] +[PS_REL_RL_FAIL_HS_D_BGR] + [PS_REL_RL_FAIL_D_D_INT] +[PS_REL_RL_FAIL_D_D_BGR] + [PS_REL_OTH_FAIL_HS_E_INT] +[PS_REL_OTH_FAIL_HS_E_BGR] + [PS_REL_OTH_FAIL_HS_D_INT] +[PS_REL_OTH_FAIL_HS_D_BGR] + [PS_REL_OTH_FAIL_D_D_INT] +[PS_REL_OTH_FAIL_D_D_BGR] + [PS_REL_RL_FAIL_HS_E_STRE] +[PS_REL_RL_FAIL_HS_D_STRE] + [PS_REL_RL_FAIL_D_D_STRE] +[PS_REL_OTH_FAIL_HS_E_STRE] + [PS_REL_OTH_FAIL_HS_D_STRE] +[PS_REL_OTH_FAIL_D_D_STRE]) / sum([PS_REL_RL_FAIL_HS_E_INT] +[PS_REL_RL_FAIL_HS_E_BGR] + [PS_REL_RL_FAIL_HS_D_INT] +[PS_REL_RL_FAIL_HS_D_BGR] + [PS_REL_RL_FAIL_D_D_INT] +[PS_REL_RL_FAIL_D_D_BGR] + [PS_REL_OTH_FAIL_HS_E_INT] +[PS_REL_OTH_FAIL_HS_E_BGR] + [PS_REL_OTH_FAIL_HS_D_INT] +[PS_REL_OTH_FAIL_HS_D_BGR] + [PS_REL_OTH_FAIL_D_D_INT] +[PS_REL_OTH_FAIL_D_D_BGR] + [PS_REL_NORM_HS_E_INT] +[PS_REL_NORM_HS_E_BGR] + [PS_REL_NORM_HS_D_INT] +[PS_REL_NORM_HS_D_BGR] + [PS_REL_NORM_D_D_INT] +[PS_REL_NORM_D_D_BGR] + [PS_REL_RL_FAIL_HS_E_STRE] +[PS_REL_RL_FAIL_HS_D_STRE] + [PS_REL_RL_FAIL_D_D_STRE] +[PS_REL_OTH_FAIL_HS_E_STRE] + [PS_REL_OTH_FAIL_HS_D_STRE] +[PS_REL_OTH_FAIL_D_D_STRE] + [PS_REL_NORM_HS_E_STRE] +[PS_REL_NORM_HS_D_STRE] + [PS_REL_NORM_D_D_STRE])
KPI class Retainability
Unit Percentage
Object Summary Levels Network, RNC
Time Summary Levels Week, Day, Hour
WCDMA RAN Key Performance Indicators Available Key Performance Indicators per Formula
Issue: 08 DN05191189 95

4.1.2.6 RAB Success Ratio, Multi-RAB Services [%]
All Multi-RAB services
Table 41 Multi RAB Success Ratio
KPI name CS AMR + PS Multi RAB Success Ratio
KPI abbreviation CS AMR + PS Multi RAB SR
KPI ID RNC_742b
Description Multi RAB success rate. The KPI describes the retainability of multi-RABcombination "CS AMR + PS NRT" and covers the RAB Active Phase of a call.
Measurement M1001: Service Level
KPI formula 100 * sum ([M1001C702]) / sum ([M1001C702] + [M1001C703])
KPI formula with short names 100 * sum ([RAB_ACT_COMP_AMR_PSNRT]) / sum([RAB_ACT_COMP_AMR_PSNRT] + [RAB_ACT_FAIL_AMR_PSNRT])
KPI class Retainability
Unit Percentage
Typical values OPEN
Object Summary Levels Network, RNC
Time Summary Levels Week, Day, Hour
4.1.2.7 HS-FACH Success Ratio [%]
Table 42 HS-FACH Success Ratio
KPI name HS-FACH Success Ratio
KPI abbreviation Switches from HS-FACH SR
KPI ID RNC_5476a
Description The success ratio of transitions from Enhanced CELL_FACH to CELL_DCH orCELL_PCH.
Measurement 1006: RRC signalling
KPI formula 100*sum([M1006C218]+[M1006C222]) / sum([M1006C217]+[M1006C221])
KPI formula with short names 100*sum([SUCC_EFACH_TO_DCH]+[SUCC_EFACH_TO_PCH]) /sum([ATT_EFACH_TO_DCH]+[ATT_EFACH_TO_PCH])
KPI class Accessibility
Available Key Performance Indicators per Formula WCDMA RAN Key Performance Indicators
96 DN05191189 Issue: 08
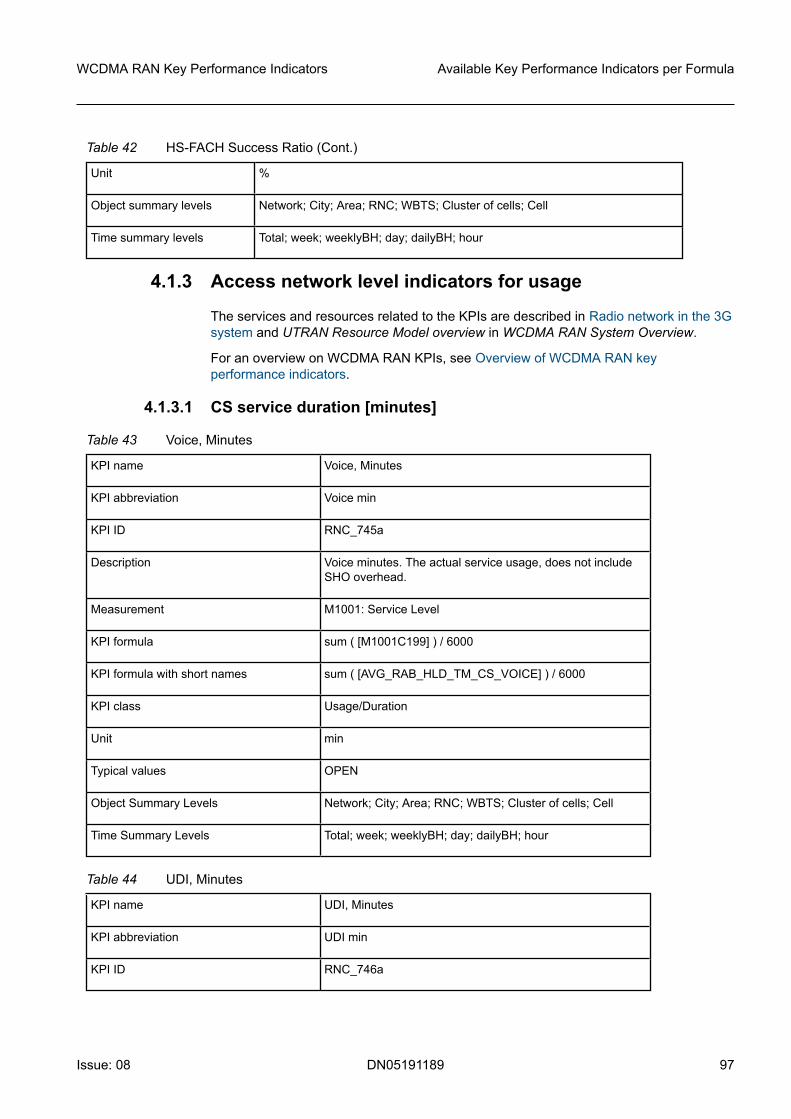
Table 42 HS-FACH Success Ratio (Cont.)
Unit %
Object summary levels Network; City; Area; RNC; WBTS; Cluster of cells; Cell
Time summary levels Total; week; weeklyBH; day; dailyBH; hour
4.1.3 Access network level indicators for usage
The services and resources related to the KPIs are described in Radio network in the 3Gsystem and UTRAN Resource Model overview in WCDMA RAN System Overview.
For an overview on WCDMA RAN KPIs, see Overview of WCDMA RAN keyperformance indicators.
4.1.3.1 CS service duration [minutes]
Table 43 Voice, Minutes
KPI name Voice, Minutes
KPI abbreviation Voice min
KPI ID RNC_745a
Description Voice minutes. The actual service usage, does not includeSHO overhead.
Measurement M1001: Service Level
KPI formula sum ( [M1001C199] ) / 6000
KPI formula with short names sum ( [AVG_RAB_HLD_TM_CS_VOICE] ) / 6000
KPI class Usage/Duration
Unit min
Typical values OPEN
Object Summary Levels Network; City; Area; RNC; WBTS; Cluster of cells; Cell
Time Summary Levels Total; week; weeklyBH; day; dailyBH; hour
Table 44 UDI, Minutes
KPI name UDI, Minutes
KPI abbreviation UDI min
KPI ID RNC_746a
WCDMA RAN Key Performance Indicators Available Key Performance Indicators per Formula
Issue: 08 DN05191189 97

Table 44 UDI, Minutes (Cont.)
Description CS video calls minutes, i.e. UDI minutes. The actual serviceusage, does not include SHO overhead.
Measurement M1001: Service Level
KPI formula sum ( [M1001C201] ) / 6000
KPI formula with short names sum ( [AVG_RAB_HLD_TM_CS_CONV] ) / 6000
KPI class Usage/Duration
Unit min
Typical values OPEN
Object Summary Levels Network; City; Area; RNC; WBTS; Cluster of cells; Cell
Time Summary Levels Total; week; weeklyBH; day; dailyBH; hour
4.1.3.2 PS duration [minutes]
Table 45 NRT RAB duration
KPI name NRT RAB duration
KPI abbreviation NRT RAB dur
KPI ID RNC_5058a
Description The sum of all NRT RABs Duration (that is Services)covering Interactive and Background classes.
Note 1 Complete RAB duration is counted in that cell where RABended, even if RAB started in other cell. The counter namestell about avg values but they in fact are sum values.
Measurement M1001: Service Level
KPI formula sum ([M1001C209] + [M1001C211]) / (100*60)
KPI formula with short names sum ([AVG_RAB_HLD_TM_PS_INTER] +[AVG_RAB_HLD_TM_PS_BACKG]) / (100*60)
KPI class Usage/Duration
Unit min
Object Summary Levels Network, City, Area, RNC, Cluster of cells, Cell
Time Summary Levels Total; week; weeklyBH; day; dailyBH; hour
Available Key Performance Indicators per Formula WCDMA RAN Key Performance Indicators
98 DN05191189 Issue: 08

Table 46 NRT Sessions duration
KPI name NRT Sessions duration
KPI abbreviation NRT ses dur
KPI ID RNC_5059a
Description The sum of all NRT Calls Duration (that is Sessions).Interactive and Background Service time in CELL-DCHstate.
Note 1 Complete call duration is counted in that cell where callended, even if call started in other cell. The counter namestell about avg values but they in fact are sum values.
Measurement M1001: Service Level
KPI formula sum ([M1001C213] + [M1001C215]) / (100*60)
KPI formula with short names sum ([AVG_DCH_HLD_TM_PS_INTER] +[AVG_DCH_HLD_TM_PS_BACKG]) / (100*60)
KPI class Usage/Duration
Unit min
Object Summary Levels Network, City, Area, RNC, Cluster of cells, Cell
Time Summary Levels Total; week; weeklyBH; day; dailyBH; hour
4.1.3.3 CS service duration before call drop [minutes]
Table 47 Minutes per Drop Voice
KPI name Minutes per Drop Voice
KPI abbreviation Min per Drop Voice
KPI ID RNC_737b
Description The average minutes per drop for CS Voice. This is the userperspective, so the pre-emptions and UE causes are alsocounted in as failures.
Measurement M1001: Service Level
KPI formula (sum( [M1001C199] ) /(100*60)) / sum( [M1001C144] +[M1001C145] + [M1001C146] + [M1001C147] +[M1001C148] + [M1001C150] + [M1001C392]+[M1001C690])
WCDMA RAN Key Performance Indicators Available Key Performance Indicators per Formula
Issue: 08 DN05191189 99
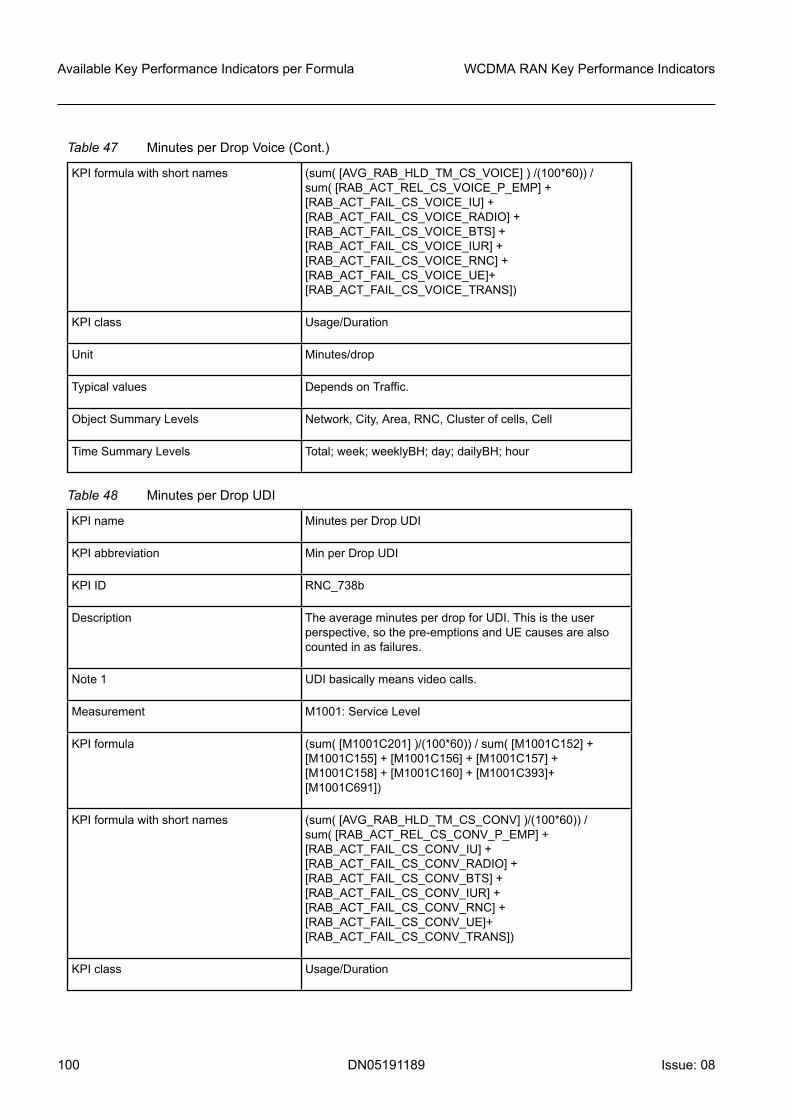
Table 47 Minutes per Drop Voice (Cont.)
KPI formula with short names (sum( [AVG_RAB_HLD_TM_CS_VOICE] ) /(100*60)) /sum( [RAB_ACT_REL_CS_VOICE_P_EMP] +[RAB_ACT_FAIL_CS_VOICE_IU] +[RAB_ACT_FAIL_CS_VOICE_RADIO] +[RAB_ACT_FAIL_CS_VOICE_BTS] +[RAB_ACT_FAIL_CS_VOICE_IUR] +[RAB_ACT_FAIL_CS_VOICE_RNC] +[RAB_ACT_FAIL_CS_VOICE_UE]+[RAB_ACT_FAIL_CS_VOICE_TRANS])
KPI class Usage/Duration
Unit Minutes/drop
Typical values Depends on Traffic.
Object Summary Levels Network, City, Area, RNC, Cluster of cells, Cell
Time Summary Levels Total; week; weeklyBH; day; dailyBH; hour
Table 48 Minutes per Drop UDI
KPI name Minutes per Drop UDI
KPI abbreviation Min per Drop UDI
KPI ID RNC_738b
Description The average minutes per drop for UDI. This is the userperspective, so the pre-emptions and UE causes are alsocounted in as failures.
Note 1 UDI basically means video calls.
Measurement M1001: Service Level
KPI formula (sum( [M1001C201] )/(100*60)) / sum( [M1001C152] +[M1001C155] + [M1001C156] + [M1001C157] +[M1001C158] + [M1001C160] + [M1001C393]+[M1001C691])
KPI formula with short names (sum( [AVG_RAB_HLD_TM_CS_CONV] )/(100*60)) /sum( [RAB_ACT_REL_CS_CONV_P_EMP] +[RAB_ACT_FAIL_CS_CONV_IU] +[RAB_ACT_FAIL_CS_CONV_RADIO] +[RAB_ACT_FAIL_CS_CONV_BTS] +[RAB_ACT_FAIL_CS_CONV_IUR] +[RAB_ACT_FAIL_CS_CONV_RNC] +[RAB_ACT_FAIL_CS_CONV_UE]+[RAB_ACT_FAIL_CS_CONV_TRANS])
KPI class Usage/Duration
Available Key Performance Indicators per Formula WCDMA RAN Key Performance Indicators
100 DN05191189 Issue: 08

Table 48 Minutes per Drop UDI (Cont.)
Unit Minutes/drop
Typical values OPEN
Object Summary Levels Network, City, Area, RNC, Cluster of cells, Cell
Time Summary Levels Total; week; weeklyBH; day; dailyBH; hour
4.1.3.4 PS service duration before call drop [minutes]
Table 49 PS RAB minutes per drop
KPI name PS RAB minutes per drop
KPI abbreviation PS RAB minutes per drop
KPI ID RNC_5082a
Description This KPI shows the average PS RAB holding time forINT&BACK traffic in minutes per one drop. Drops inCell_PCH state are also included.
Note The counters AVG_RAB_HLD_TM_PS_INTER andAVG_RAB_HLD_TM_PS_BACKG in the numerator are infact showing SUM not AVG RAB holding time.
Measurement 1001 - Service Level (RNC)
KPI formula sum([M1001C209]+[M1001C211])/(100*60)/sum([M1001C185]+ [M1001C186]+ [M1001C187]+[M1001C188]+ [M1001C190]+ [M1001C694]+ [M1001C191]+ [M1001C192]+ [M1001C193]+ [M1001C194]+[M1001C196]+ [M1001C398]+ [M1001C695]+[M1001C397])
KPI formula with short names sum([AVE RAB HOLDING TIME FOR PS CALL WITHINTERACTIVE CLASS]+[AVE RAB HOLDING TIME FORPS CALL WITH BACKGROUND CLASS])/(100*60)/sum([RAB ACTIVE FAILURES DUE TO IU FOR PS DATAINTERA]+ [RAB ACTIVE FAILURES DUE TO RADIO INTFOR PS DATA INTERA]+ [RAB ACTIVE FAILURES DUETO BTS FOR PS DATA INTERA]+ [RAB ACTIVE FAILURESDUE TO IUR FOR PS DATA INTERA]+ [RAB ACTIVEFAILURES DUE TO RNC FOR PS DATA INTERA]+ [RABACTIVE FAILURES DUE TO TRANS FOR PS DATAINTERA]+ [RAB ACTIVE FAILURES DUE TO IU FOR PSDATA BACKG] + [RAB ACTIVE FAILURES DUE TO RADIOINT FOR PS DATA BACKG]+ [RAB ACTIVE FAILURESDUE TO BTS FOR PS DATA BACKG]+ [RAB ACTIVEFAILURES DUE TO IUR FOR PS DATA BACKG]+ [RABACTIVE FAILURES DUE TO RNC FOR PS DATA BACKG]+[RAB ACTIVE FAILURES DUE TO UE FOR PS DATA
WCDMA RAN Key Performance Indicators Available Key Performance Indicators per Formula
Issue: 08 DN05191189 101

Table 49 PS RAB minutes per drop (Cont.)
BACKG]+ [RAB ACTIVE FAILURES DUE TO TRANS FORPS DATA BACKG]+ [RAB ACTIVE FAILURES DUE TO UEFOR PS DATA INTERA])
KPI class Usage/Duration
Unit Minutes/drop
Object Summary Levels Network, RNC
Time Summary Levels Total; week; weeklyBH; day; dailyBH; hour
Table 50 PS DCH minutes per drop
KPI name PS DCH minutes per drop
KPI abbreviation PS DCH minutes per drop
KPI ID RNC_5083a
Description This KPI shows active phase (Cell DCH state) of PS RABtime for INT&BACK traffic in minutes per one drop. RABdrops in Cell_PCH state (= drops during user inactivity) areexcluded to show the user experience.
Note The counters AVG_RAB_HLD_TM_PS_INTER andAVG_RAB_HLD_TM_PS_BACKG in the numerator are infact showing SUM not AVG RAB holding time.
Measurement 1001 - Service Level (RNC)
KPI formula "sum([M1001C213]+[M1001C215])/(100*60)/sum([M1001C185]+ [M1001C186]+ [M1001C187]+[M1001C188]+ [M1001C190]+ [M1001C694]+ [M1001C191]+ [M1001C192]+ [M1001C193]+ [M1001C194]+[M1001C196]+ [M1001C398]+ [M1001C695]+[M1001C397]- [M1001C594]- [M1001C593])"
KPI formula with short names "sum([AVERAGE DCH HOLDING TIME FOR PS RAB WITHINTERACTIVE CLASS]+[AVERAGE DCH HOLDING TIMEFOR PS RAB WITH BACKGROUND CLASS])/(100*60)/sum([RAB ACTIVE FAILURES DUE TO IU FOR PS DATAINTERA]+ [RAB ACTIVE FAILURES DUE TO RADIO INTFOR PS DATA INTERA]+ [RAB ACTIVE FAILURES DUETO BTS FOR PS DATA INTERA]+ [RAB ACTIVE FAILURESDUE TO IUR FOR PS DATA INTERA]+ [RAB ACTIVEFAILURES DUE TO RNC FOR PS DATA INTERA]+ [RABACTIVE FAILURES DUE TO TRANS FOR PS DATAINTERA]+ [RAB ACTIVE FAILURES DUE TO IU FOR PSDATA BACKG] + [RAB ACTIVE FAILURES DUE TO RADIOINT FOR PS DATA BACKG]+ [RAB ACTIVE FAILURESDUE TO BTS FOR PS DATA BACKG]+ [RAB ACTIVEFAILURES DUE TO IUR FOR PS DATA BACKG]+ [RAB
Available Key Performance Indicators per Formula WCDMA RAN Key Performance Indicators
102 DN05191189 Issue: 08

Table 50 PS DCH minutes per drop (Cont.)
ACTIVE FAILURES DUE TO RNC FOR PS DATA BACKG]+[RAB ACTIVE FAILURES DUE TO UE FOR PS DATABACKG]+ [RAB ACTIVE FAILURES DUE TO TRANS FORPS DATA BACKG]+ [RAB ACTIVE FAILURES DUE TO UEFOR PS DATA INTERA]- [RAB ACTIVE FAILURES FOR PSDATA BACKGROUND IN PCH STATE]- [RAB ACTIVEFAILURES FOR PS DATA INTERACTIVE IN PCH STATE])
KPI class Usage/Duration
Unit Minutes/drop
Object Summary Levels Network, RNC
Time Summary Levels Total; week; weeklyBH; day; dailyBH; hour
4.1.3.5 PS service volume before RAB drop [Mbit/ Dropped RAB]
Table 51 Iu-PS data volume per drop - ATM based
KPI name Iu-PS data volume per drop - ATM based
KPI abbreviation Iu-PS DV per drop ATMbase
KPI ID RNC_5050b
Description The average Volume per drop for Packet Switched Data.This is the user perspective, so the pre-emptions and UEcauses are also counted in as failures
Note 1 This KPI is valid only for RNCs using ATM based Iu-PSinterface.
Note 2 ATM headers are included in the KPI.
Measurement M1001: Service Level, M530: ATM VC
KPI formula (sum([M530C0] * 53 * 8 / 1 000 000) / sum([M1001C170]+[M1001C179]+ [M1001C180]+ [M1001C181]+[M1001C182]+ [M1001C184]+ [M1001C693]+[M1001C185]+ [M1001C186]+ [M1001C187]+[M1001C188]+ [M1001C190]+ [M1001C694]+ [M1001C191]+ [M1001C192]+ [M1001C193]+ [M1001C194]+[M1001C196]+ [M1001C398]+ [M1001C695]+[M1001C397]- [M1001C594]- [M1001C593]))
KPI formula with short names (sum([IN_TOT_CELLS_VC] * 53 * 8 / 1 000 000) /sum([RAB_ACT_REL_PS_STREA_P_EMP]+[RAB_ACT_FAIL_PS_STREA_IU]+[RAB_ACT_FAIL_PS_STREA_RADIO]+[RAB_ACT_FAIL_PS_STREA_BTS]+[RAB_ACT_FAIL_PS_STREA_IUR]+[RAB_ACT_FAIL_PS_STREA_RNC]+
WCDMA RAN Key Performance Indicators Available Key Performance Indicators per Formula
Issue: 08 DN05191189 103
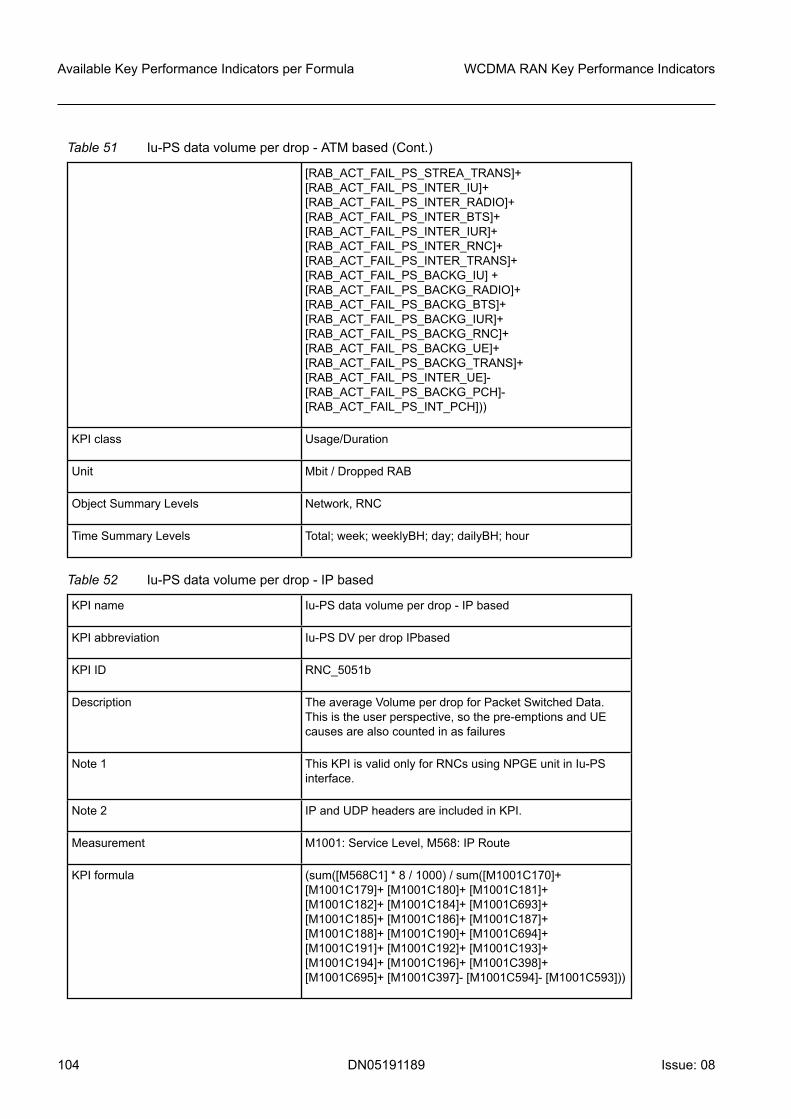
Table 51 Iu-PS data volume per drop - ATM based (Cont.)
[RAB_ACT_FAIL_PS_STREA_TRANS]+[RAB_ACT_FAIL_PS_INTER_IU]+[RAB_ACT_FAIL_PS_INTER_RADIO]+[RAB_ACT_FAIL_PS_INTER_BTS]+[RAB_ACT_FAIL_PS_INTER_IUR]+[RAB_ACT_FAIL_PS_INTER_RNC]+[RAB_ACT_FAIL_PS_INTER_TRANS]+[RAB_ACT_FAIL_PS_BACKG_IU] +[RAB_ACT_FAIL_PS_BACKG_RADIO]+[RAB_ACT_FAIL_PS_BACKG_BTS]+[RAB_ACT_FAIL_PS_BACKG_IUR]+[RAB_ACT_FAIL_PS_BACKG_RNC]+[RAB_ACT_FAIL_PS_BACKG_UE]+[RAB_ACT_FAIL_PS_BACKG_TRANS]+[RAB_ACT_FAIL_PS_INTER_UE]-[RAB_ACT_FAIL_PS_BACKG_PCH]-[RAB_ACT_FAIL_PS_INT_PCH]))
KPI class Usage/Duration
Unit Mbit / Dropped RAB
Object Summary Levels Network, RNC
Time Summary Levels Total; week; weeklyBH; day; dailyBH; hour
Table 52 Iu-PS data volume per drop - IP based
KPI name Iu-PS data volume per drop - IP based
KPI abbreviation Iu-PS DV per drop IPbased
KPI ID RNC_5051b
Description The average Volume per drop for Packet Switched Data.This is the user perspective, so the pre-emptions and UEcauses are also counted in as failures
Note 1 This KPI is valid only for RNCs using NPGE unit in Iu-PSinterface.
Note 2 IP and UDP headers are included in KPI.
Measurement M1001: Service Level, M568: IP Route
KPI formula (sum([M568C1] * 8 / 1000) / sum([M1001C170]+[M1001C179]+ [M1001C180]+ [M1001C181]+[M1001C182]+ [M1001C184]+ [M1001C693]+[M1001C185]+ [M1001C186]+ [M1001C187]+[M1001C188]+ [M1001C190]+ [M1001C694]+[M1001C191]+ [M1001C192]+ [M1001C193]+[M1001C194]+ [M1001C196]+ [M1001C398]+[M1001C695]+ [M1001C397]- [M1001C594]- [M1001C593]))
Available Key Performance Indicators per Formula WCDMA RAN Key Performance Indicators
104 DN05191189 Issue: 08

Table 52 Iu-PS data volume per drop - IP based (Cont.)
KPI formula with short names (sum([IN_DATA_IP_ROUTE] * 8 / 1000) /sum([RAB_ACT_REL_PS_STREA_P_EMP]+[RAB_ACT_FAIL_PS_STREA_IU]+[RAB_ACT_FAIL_PS_STREA_RADIO]+[RAB_ACT_FAIL_PS_STREA_BTS]+[RAB_ACT_FAIL_PS_STREA_IUR]+[RAB_ACT_FAIL_PS_STREA_RNC]+[RAB_ACT_FAIL_PS_STREA_TRANS]+[RAB_ACT_FAIL_PS_INTER_IU]+[RAB_ACT_FAIL_PS_INTER_RADIO]+[RAB_ACT_FAIL_PS_INTER_BTS]+[RAB_ACT_FAIL_PS_INTER_IUR]+[RAB_ACT_FAIL_PS_INTER_RNC]+[RAB_ACT_FAIL_PS_INTER_TRANS]+[RAB_ACT_FAIL_PS_BACKG_IU]+[RAB_ACT_FAIL_PS_BACKG_RADIO]+[RAB_ACT_FAIL_PS_BACKG_BTS]+[RAB_ACT_FAIL_PS_BACKG_IUR]+[RAB_ACT_FAIL_PS_BACKG_RNC]+[RAB_ACT_FAIL_PS_BACKG_UE]+[RAB_ACT_FAIL_PS_BACKG_TRANS]+[RAB_ACT_FAIL_PS_INTER_UE]-[RAB_ACT_FAIL_PS_BACKG_PCH]-[RAB_ACT_FAIL_PS_INT_PCH]))
KPI class Usage/Duration
Unit Mbit / Dropped RAB
Object Summary Levels Network, RNC
Time Summary Levels Total; week; weeklyBH; day; dailyBH; hour
Table 53 HSDPA received data per PS RAB drop including PCH
KPI name HSDPA received data per PS RAB drop including PCH
KPI abbreviation HSDPA rcvd D/drop inc PCH
KPI ID RNC_5080a
Description Amount of data received in NodeB from the RNC in MAC-dPDUs plus amount of Multi-Carrier HSDPA original data senton MAC-ehs PDUs in the primary cell plus amount of Multi-Carrier HSDPA original data sent on MAC-ehs PDUs in thesecondary cell per one drop (including drops in Cell_PCHstate).
Measurement 5000: HSPA in WBTS
5002: Cell Throughput in WBTS
1001: Service Level
WCDMA RAN Key Performance Indicators Available Key Performance Indicators per Formula
Issue: 08 DN05191189 105

Table 53 HSDPA received data per PS RAB drop including PCH (Cont.)
KPI formula sum([M5000C126]+([M5002C128]+[M5002C129])*8) /1000 /sum([M1001C185] +[M1001C186] +[M1001C187]+[M1001C188] +[M1001C190] +[M1001C191]+[M1001C192] +[M1001C193] +[M1001C194]+[M1001C196] +[M1001C397] +[M1001C398]+[M1001C695] +[M1001C694])
KPI formula with short names sum([RECEIVED_HS_MACD_BITS]+([MC_HSDPA_ORIG_DATA_PRI]+[MC_HSDPA_ORIG_DATA_SEC])*8) /1000 /sum([RAB_ACT_FAIL_PS_INTER_IU]+[RAB_ACT_FAIL_PS_INTER_RADIO]+[RAB_ACT_FAIL_PS_INTER_BTS]+[RAB_ACT_FAIL_PS_INTER_IUR]+[RAB_ACT_FAIL_PS_INTER_RNC]+[RAB_ACT_FAIL_PS_BACKG_IU]+[RAB_ACT_FAIL_PS_BACKG_RADIO]+[RAB_ACT_FAIL_PS_BACKG_BTS]+[RAB_ACT_FAIL_PS_BACKG_IUR]+[RAB_ACT_FAIL_PS_BACKG_RNC]+[RAB_ACT_FAIL_PS_INTER_UE]+[RAB_ACT_FAIL_PS_BACKG_UE]+[RAB_ACT_FAIL_PS_BACKG_TRANS]+[RAB_ACT_FAIL_PS_INTER_TRANS])
KPI class Usage/Duration
Unit Mbit / Dropped RAB
Object summary levels Network, City, Area, RNC, Cluster of cells, Cell
Time summary levels Week, Day, Hour
Table 54 HSDPA received data per PS RAB drop excluding PCH
KPI name HSDPA received data per PS RAB drop excluding PCH
KPI abbreviation HSDPA rcvd D/drop exc PCH
KPI ID RNC_5081a
Description Amount of data received in NodeB from the RNC in MAC-dPDUs plus amount of Multi-Carrier HSDPA original data senton MAC-ehs PDUs in the primary cell plus amount of Multi-Carrier HSDPA original data sent on MAC-ehs PDUs in thesecondary cell per one drop (excluding drops in Cell_PCHstate).
Measurement 5000: HSPA in WBTS
5002: Cell Throughput in WBTS
1001: Service Level
Available Key Performance Indicators per Formula WCDMA RAN Key Performance Indicators
106 DN05191189 Issue: 08

Table 54 HSDPA received data per PS RAB drop excluding PCH (Cont.)
KPI formula sum([M5000C126]+ ([M5002C128]+[M5002C129])*8) /1000/ sum([M1001C185] +[M1001C186] +[M1001C187]+[M1001C188] +[M1001C190] +[M1001C694]+[M1001C191] +[M1001C192] +[M1001C193]+[M1001C194] +[M1001C196] +[M1001C398]+[M1001C695] +[M1001C397] -[M1001C594]-[M1001C593])
KPI formula with short names sum([RECEIVED_HS_MACD_BITS]+([MC_HSDPA_ORIG_DATA_PRI]+[MC_HSDPA_ORIG_DATA_SEC])*8) /1000 /sum([RAB_ACT_FAIL_PS_INTER_IU]+[RAB_ACT_FAIL_PS_INTER_RADIO]+[RAB_ACT_FAIL_PS_INTER_BTS]+[RAB_ACT_FAIL_PS_INTER_IUR]+[RAB_ACT_FAIL_PS_INTER_RNC]+[RAB_ACT_FAIL_PS_INTER_TRANS]+[RAB_ACT_FAIL_PS_BACKG_IU]+[RAB_ACT_FAIL_PS_BACKG_RADIO]+[RAB_ACT_FAIL_PS_BACKG_BTS]+[RAB_ACT_FAIL_PS_BACKG_IUR]+[RAB_ACT_FAIL_PS_BACKG_RNC]+[RAB_ACT_FAIL_PS_BACKG_UE]+[RAB_ACT_FAIL_PS_BACKG_TRANS]+[RAB_ACT_FAIL_PS_INTER_UE]-[RAB_ACT_FAIL_PS_BACKG_PCH]-[RAB_ACT_FAIL_PS_INT_PCH])
KPI class Usage/Duration
Unit Mbit / Dropped RAB
Object summary levels Network, City, Area, RNC, Cluster of cells, Cell
Time summary levels Week, Day, Hour
4.1.3.6 Erlang [Erlang]
Table 55 Average CS Erlang
KPI name Average CS Erlang
KPI abbreviation Avg CS erl
KPI ID RNC_280b
Description CS Erlang meaning the CS RAB holding time.
Note 1 This KPI can be used to see the total Erlang volume in Iu-CS and compare the average value to defined performancevalue.
WCDMA RAN Key Performance Indicators Available Key Performance Indicators per Formula
Issue: 08 DN05191189 107

Table 55 Average CS Erlang (Cont.)
Note 2 In the formula all the CS holding time counters has beenweighed to correspond 1 AMR.
Note 3 This KPI is mainly meant for busy hour follow-up.
Measurement M1001: Service Level
KPI formula sum([M1001C199] + [M1001C368] * 64/12.2 + [M1001C370]* 14.4/12.2 + [M1001C372] * 57.6/12.2) /sum(PERIOD_DURATION)*100*60
KPI formula with short names sum([AVG_RAB_HLD_TM_CS_VOICE] +[RAB_HOLD_TIME_CS_CONV_64] * 64/12.2 +[RAB_HOLD_TIME_CS_STREAM_14_4] * 14.4/12.2 +[RAB_HOLD_TIME_CS_STREAM_57_6] * 57.6/12.2) /sum(PERIOD_DURATION)*100*60
KPI class Usage/Throughput
Unit E
Typical values Depends on Traffic.
Object Summary Levels Network, City, Area, RNC, Cluster of cells, Cell
Time Summary Levels Week, Day, Hour
4.1.3.7 Requested SRNS Relocation Attempt Numbers [Integer Number]
Table 56 Incoming Inter RNC HHO Attempts for CS
KPI name SRNS Relocation UE involved CS Attempts (HHO)
KPI abbreviation In Inter RNC HHO att CS
KPI ID RNC_5064a
Description Relocation preparations with UE involved for CS domain.
Measurement M1009 - L3 Relocation signalling (RNC)
KPI formula sum (M1009C118)
KPI formula with short names sum ([INTER_RNC_HHO_REQ_CONTR_MSC])
KPI class Usage/Requested Capacity
Unit Integer number
Object Summary Levels Network, RNC
Time Summary Levels Total; week; weeklyBH; day; dailyBH; hour
Available Key Performance Indicators per Formula WCDMA RAN Key Performance Indicators
108 DN05191189 Issue: 08

Table 57 Incoming Inter RNC HHO Attempts for PS
KPI name SRNS Relocation UE involved PS Attempts (HHO)
KPI abbreviation In Inter RNC HHO Att PS
KPI ID RNC_5065a
Description Relocation preparations with UE involved for PS domain.
Measurement M1009 - L3 Relocation signalling (RNC)
KPI formula sum (M1009C119)
KPI formula with short names sum ([INTER_RNC_HHO_REQ_CONTR_SGSN])
KPI class Usage/Requested Capacity
Unit Integer number
Object Summary Levels Network, RNC
Time Summary Levels Total; week; weeklyBH; day; dailyBH; hour
4.1.3.8 Requested Handover Attempt Numbers [Integer Number]
Table 58 ISHO Attempts RT
KPI name ISHO Attempts RT
KPI abbreviation ISHO att RT
KPI ID RNC_298f
Description Number of RT ISHO attempts that have been started afterISHO measurements.
Note Inter RNC RT ISHO attempt includes cases when UE alsohas any additional NRT service.
Measurement 1010: Inter System Hard Handover
1010: Inter System Hard Handover
KPI formula sum( [M1010C18] + [M1010C22] + [M1010C26] +[M1010C30] + [M1010C34] + [M1010C76] + [M1010C97] +[M1010C137] + [M1010C138] + [M1010C140] +[M1010C139] + [M1010C141] + [M1010C219] +[M1010C196] + [M1010C195] + [M1010C185] +[M1010C215] + [M1010C226] + [M1010C234] -[M1010C229] - [M1010C230])
WCDMA RAN Key Performance Indicators Available Key Performance Indicators per Formula
Issue: 08 DN05191189 109

Table 58 ISHO Attempts RT (Cont.)
KPI formula with short names sum( [IS_HHO_ATT_UL_DCH_Q_RT] +[IS_HHO_ATT_UE_TRX_PWR_RT] +[IS_HHO_ATT_DPCH_PWR_RT] +[IS_HHO_ATT_CPICH_RSCP_RT] +[IS_HHO_ATT_CPICH_ECNO_RT] +[IS_HHO_ATT_IM_IMS_RT] +[IS_HHO_ATT_EMERG_CALL] +[IS_HHO_ATT_LB_PRX_TOT_RT] +[IS_HHO_ATT_LB_PTX_TOT_RT] +[IS_HHO_ATT_LB_RES_LIM_RT] +[IS_HHO_ATT_LB_RSVR_SC_RT] +[IS_HHO_ATT_SB_RT] + [ATT_GANHO_AMR_RT] +[IS_HHO_ATT_LB_CAPA_DL_RT] +[IS_HHO_ATT_LB_CAPA_UL_RT] +[IS_HHO_ATT_UL_DCH_WPS_RT] +[IS_HHO_ATT_DR_AMR_RT] +[ATT_ISHO_CELL_SHUTDOWN_RT] +[ATT_ISHO_CELL_BLOCK_RT] -[IS_HHO_ATT_2ND_BEST_CELL_RT] -[IS_HHO_ATT_3RD_BEST_CELL_RT])
KPI class Usage/Requested Capacity
Unit #
Target values See RNC Product Description for assumed HHOProportions in relation to established calls
Object summary levels Network, City, Area, RNC, Cluster of cells, Cell
Time summary levels Total; week; weeklyBH; day; dailyBH; hour
Table 59 ISHO Attempts NRT
KPI name ISHO Attempts NRT
KPI abbreviation ISHO att NRT
KPI ID RNC_299e
Description Number of NRT ISHO attempts, that have been started afterISHO measurements.
Note Inter RNC NRT ISHO attempt excludes cases when UE alsohas any RT service.
Measurement 1010: Inter System Hard Handover
KPI formula sum( [M1010C56] + [M1010C60] + [M1010C64] +[M1010C68] + [M1010C72] + [M1010C83] + [M1010C145] +[M1010C144] + [M1010C142] + [M1010C143] +
Available Key Performance Indicators per Formula WCDMA RAN Key Performance Indicators
110 DN05191189 Issue: 08

Table 59 ISHO Attempts NRT (Cont.)
[M1010C147] + [M1010C146] + [M1010C148] +[M1010C225] + [M1010C233] - [M1010C231] -[M1010C232])
KPI formula with short names sum( [IS_HHO_ATT_UL_DCH_Q_NRT] +[IS_HHO_ATT_UE_TRX_PWR_NRT] +[IS_HHO_ATT_DL_DPCH_PWR_NRT] +[IS_HHO_ATT_CPICH_RSCP_NRT] +[IS_HHO_ATT_CPICH_ECNO_NRT] +[IS_HHO_ATT_IM_IMS_NRT] +[IS_HHO_ATT_LB_CAPA_DL_NRT] +[IS_HHO_ATT_LB_CAPA_UL_NRT] +[IS_HHO_ATT_LB_PRX_TOT_NRT] +[IS_HHO_ATT_LB_PTX_TOT_NRT] +[IS_HHO_ATT_LB_RES_LIM_NRT] +[IS_HHO_ATT_LB_RSVR_SC_NRT] +[IS_HHO_ATT_SB_NRT] +[ATT_ISHO_CELL_SHUTDOWN_NRT] +[ATT_ISHO_CELL_BLOCK_NRT] -[IS_HHO_ATT_2ND_BEST_CELL_NRT] -[IS_HHO_ATT_3RD_BEST_CELL_NRT])
KPI class Usage/Requested Capacity
Unit #
Target values See RNC Product Description for assumed HHOProportions in relation to established calls
Object summary levels Network, City, Area, RNC, Cluster of cells, Cell
Time summary levels Total; week; weeklyBH; day; dailyBH; hour
Table 60 Outgoing LTE PS ISHO Preparation Attempts
KPI name Outgoing LTE PS ISHO Preparation Attempts
KPI abbreviation Out LTE PS ISHO Prep Att
KPI ID RNC_5503a
Description This KPI shows the outgoing WCDMA -> LTE PS Inter-system Hard Handovers preparation attempts(RT/NRT).
Measurement 1036: LTE Relocation
KPI formulasum([M1036C0])
KPI formula with short namessum([LTE_PS_ISHO_OUT_PREP_REQ])
KPI class Mobility / Handover
WCDMA RAN Key Performance Indicators Available Key Performance Indicators per Formula
Issue: 08 DN05191189 111

Table 60 Outgoing LTE PS ISHO Preparation Attempts (Cont.)
Unit %
Object summary levels Network, City, Area, RNC, Cluster of cells, Cell
Time summary levels Total; week; weeklyBH; day; dailyBH; hour
4.1.4 Access network level indicators for mobility
The services and resources related to the KPIs are described in Radio network in the 3Gsystem and UTRAN Resource Model overviewin WCDMA RAN System Overview.
For an overview on WCDMA RAN KPIs, see Overview of WCDMA RAN keyperformance indicators.
4.1.4.1 Intra System Hard Handover Success Ratio [%]
Table 61 Intra System Hard Handover Success Ratio
KPI name Intra System Hard Handover Success Ratio
KPI abbreviation Intra-Sys HHO SR
KPI ID RNC_168a
Description Intra System Hard Handover Success Ratio [%] for thereporting period in the Source Cell of the Hard Handover.
Measurement M1008: Intra System Handover
KPI formula 100* sum([M1008C6] + [M1008C15] + [M1008C55] +[M1008C59] + [M1008C63] + [M1008C103] + [M1008C107]+ [M1008C111]) / sum([M1008C4] + [M1008C5] +[M1008C13] + [M1008C14] + [M1008C54] + [M1008C58] +[M1008C62] + [M1008C102] + [M1008C106] +[M1008C110])
KPI formula with short names 100* sum([SUCC_HHO_CAUSED_SHO_INCAP_RT] +[SUCC_HHO_SHO_INCAP_NRT] +[SUCC_INTRA_INTRA_HHO_ATT_RT] +[SUCC_INTRA_INTER_HHO_ATT_RT] +[SUCC_INTER_HHO_ATT_RT] +[SUCC_INTRA_INTRA_HHO_ATT_NRT] +[SUCC_INTRA_INTER_HHO_ATT_NRT] +[SUCC_INTER_HHO_ATT_NRT]) /sum([HHO_ATT_CAUSED_SHO_INCAP_RT] +[IMMED_HHO_CSD_SHO_INCAP_RT] +[HHO_ATT_CAUSED_SHO_INCAP_NRT] +[IMMED_HHO_CSD_SHO_INCAP_NRT] +[INTRA_INTRA_HHO_ATT_RT] +[INTRA_INTER_HHO_ATT_RT] + [INTER_HHO_ATT_RT] +[INTRA_INTRA_HHO_ATT_NRT] +[INTRA_INTER_HHO_ATT_NRT] +[INTER_HHO_ATT_NRT])
Available Key Performance Indicators per Formula WCDMA RAN Key Performance Indicators
112 DN05191189 Issue: 08

Table 61 Intra System Hard Handover Success Ratio (Cont.)
KPI class Mobility
Unit Percentage
Typical values > 95 %
Object Summary Levels Network, City, Area, RNC, Cluster of cells, Cell
Time Summary Levels Week, Day, Hour
4.1.4.2 Inter System Hard Handover Success Ratio [%]
Table 62 GSM Inter System RT Hard Handover Success Ratio
KPI name GSM Inter System RT Hard Handover Success Ratio
KPI abbreviation GSM Int sys RT HHO SR
KPI ID RNC_300h
Description Inter System Real Time User Hard Handover Success Ratio[%] from WCDMA->GSM for the reporting period in theSource Cell of the Hard Handover.
Note Note 1: The Real Time and Non Real Time Inter System HOdiffers in nature. Therefore the ISHO KPI is splitted in RTand NRT parts.Note 2: The Multi RAB ISHOs are only updated to RTcounters. This because the NRT RB follows the RTparameters when part of RT + NRT Multi RAB.
Measurement 1010: Inter System Hard Handover
KPI formula100* sum([M1010C19]+[M1010C23]+[M1010C27]+[M1010C31]+[M1010C35]+[M1010C77] + [M1010C98] + [M1010C198]+ [M1010C197]+[M1010C149] + [M1010C150] + [M1010C152] + [M1010C151] + [M1010C153] +[M1010C186] +[M1010C220] +[M1010C228] +[M1010C236])/sum([M1010C18]+[M1010C22]+[M1010C26]+[M1010C30]+[M1010C34]+
WCDMA RAN Key Performance Indicators Available Key Performance Indicators per Formula
Issue: 08 DN05191189 113

Table 62 GSM Inter System RT Hard Handover Success Ratio (Cont.)
[M1010C76] + [M1010C97] + [M1010C196]+ [M1010C195]+[M1010C137] + [M1010C138] + [M1010C140] + [M1010C139] + [M1010C141] +[M1010C185]+[M1010C219] +[M1010C226] +[M1010C234] - [M1010C229] - [M1010C230] )
KPI formula with short names100* sum([SUCC_IS_HHO_UL_DCH_Q_RT]+[SUCC_IS_HHO_UE_TRX_PWR_RT]+[SUCC_IS_HHO_DL_DPCH_PWR_RT]+[SUCC_IS_HHO_CPICH_RSCP_RT]+[SUCC_IS_HHO_CPICH_ECNO_RT]+[SUCC_IS_HHO_IM_IMS_RT] + [SUCC_IS_HHO_EMERG_CALL] + [SUCC_IS_HHO_LB_CAPA_DL_RT]+ [SUCC_IS_HHO_LB_CAPA_UL_RT]+[SUCC_IS_HHO_LB_PRX_TOT_RT] + [SUCC_IS_HHO_LB_PTX_TOT_RT] + [SUCC_IS_HHO_LB_RES_LIM_RT] + [SUCC_IS_HHO_LB_RSVR_SC_RT] + [SUCC_IS_HHO_SB_RT] +[SUCC_IS_HHO_WPS_RT] +[SUCC_GANHO_AMR_RT] +[SUCC_ISHO_CELL_SHUTDOWN_RT] +[SUCC_ISHO_CELL_BLOCK_RT])/sum([IS_HHO_ATT_UL_DCH_Q_RT]+[IS_HHO_ATT_UE_TRX_PWR_RT]+[IS_HHO_ATT_DPCH_PWR_RT]+[IS_HHO_ATT_CPICH_RSCP_RT]+[IS_HHO_ATT_CPICH_ECNO_RT]+[IS_HHO_ATT_IM_IMS_RT] + [IS_HHO_ATT_EMERG_CALL] + [IS_HHO_ATT_LB_CAPA_DL_RT]+ [IS_HHO_ATT_LB_CAPA_UL_RT]+[IS_HHO_ATT_LB_PRX_TOT_RT] + [IS_HHO_ATT_LB_PTX_TOT_RT] + [IS_HHO_ATT_LB_RES_LIM_RT] + [IS_HHO_ATT_LB_RSVR_SC_RT] + [IS_HHO_ATT_SB_RT] +[IS_HHO_ATT_UL_DCH_WPS_RT]+[ATT_GANHO_AMR_RT] +[ATT_ISHO_CELL_SHUTDOWN_RT] +[ATT_ISHO_CELL_BLOCK_RT] - [IS_HHO_ATT_2ND_BEST_CELL_RT] - [IS_HHO_ATT_3RD_BEST_CELL_RT] )
KPI class Mobility
Unit %
Target values > 95 %
Object summary levels Network, City, Area, RNC, Cluster of cells, Cell
Time summary levels Week, Day, Hour
Available Key Performance Indicators per Formula WCDMA RAN Key Performance Indicators
114 DN05191189 Issue: 08

Table 63 GSM Inter System NRT Hard Handover Success Ratio
KPI name GSM Inter System NRT Hard Handover Success Ratio
KPI abbreviation GSM Int sys NRT HHO SR
KPI ID RNC_301f
Description Inter System Non Real Time User Hard Handover SuccessRatio [%] from WCDMA->GSM for the reporting period in theSource Cell of the Hard Handover.
Note Note 1: The Real Time and Non Real Time Inter System HOdiffers in nature. Therefore the ISHO KPI is splitted in RTand NRT parts.Note 2: The Multi RAB ISHOs are only updated to RTcounters. This because the NRT RB follows the RTparameters when part of RT + NRT Multi RAB.
Measurement 1010: Inter System Hard Handover
KPI formula100*sum([M1010C57]+[M1010C61]+[M1010C65]+[M1010C69]+[M1010C73] + [M1010C84] + [M1010C157] + [M1010C156] + [M1010C154] + [M1010C155] + [M1010C159] + [M1010C158] + [M1010C160] +[M1010C227] +[M1010C235])/sum([M1010C56]+[M1010C60]+[M1010C64]+[M1010C68]+[M1010C72] + [M1010C83] + [M1010C145] + [M1010C144] + [M1010C142] + [M1010C143] + [M1010C147] + [M1010C146] + [M1010C148] +[M1010C225] +[M1010C233] - [M1010C231] - [M1010C232])
KPI formula with short names100*sum([SUCC_IS_HHO_UL_DCH_Q_NRT]+[SUCC_IS_HHO_UE_TRX_PWR_NRT]+[SUCC_IS_HHO_DL_DPCH_PWR_NRT]+[SUCC_IS_HHO_CPICH_RSCP_NRT]+[SUCC_IS_HHO_CPICH_ECNO_NRT] + [SUCC_IS_HHO_IM_IMS_NRT] + [SUCC_IS_HHO_LB_CAPA_DL_NRT] + [SUCC_IS_HHO_LB_CAPA_UL_NRT] +
WCDMA RAN Key Performance Indicators Available Key Performance Indicators per Formula
Issue: 08 DN05191189 115
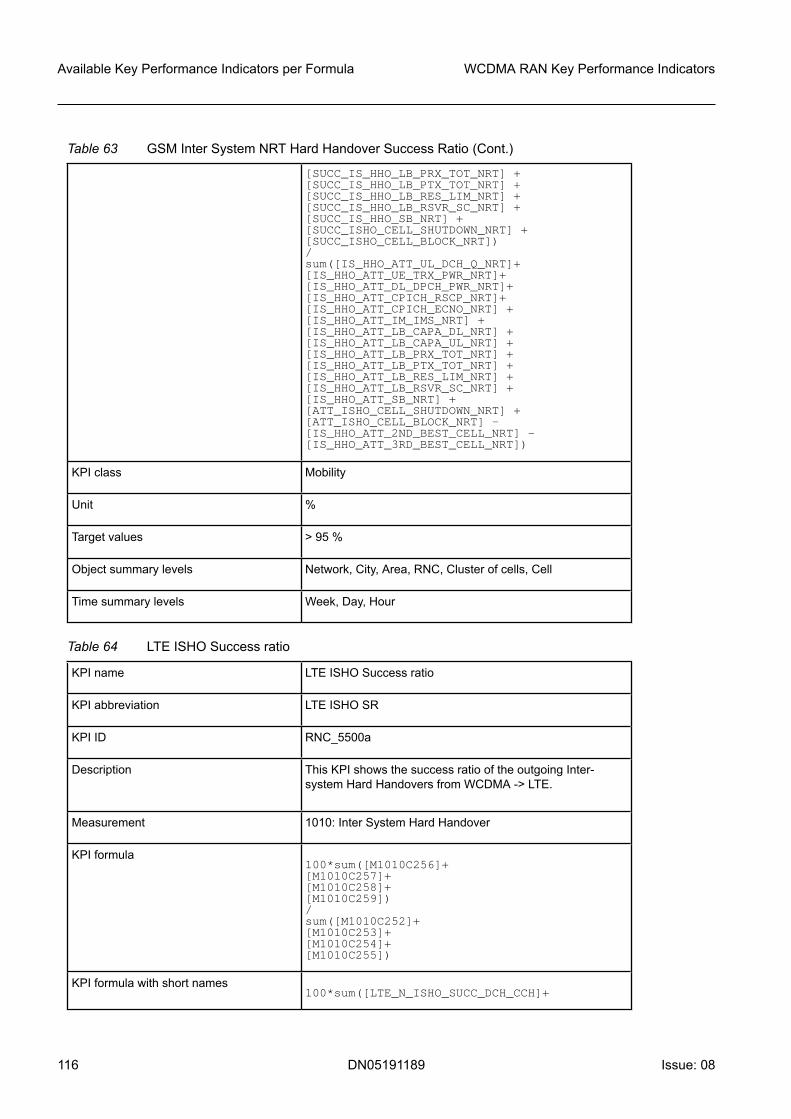
Table 63 GSM Inter System NRT Hard Handover Success Ratio (Cont.)
[SUCC_IS_HHO_LB_PRX_TOT_NRT] + [SUCC_IS_HHO_LB_PTX_TOT_NRT] + [SUCC_IS_HHO_LB_RES_LIM_NRT] + [SUCC_IS_HHO_LB_RSVR_SC_NRT] + [SUCC_IS_HHO_SB_NRT] +[SUCC_ISHO_CELL_SHUTDOWN_NRT] +[SUCC_ISHO_CELL_BLOCK_NRT])/sum([IS_HHO_ATT_UL_DCH_Q_NRT]+[IS_HHO_ATT_UE_TRX_PWR_NRT]+[IS_HHO_ATT_DL_DPCH_PWR_NRT]+[IS_HHO_ATT_CPICH_RSCP_NRT]+[IS_HHO_ATT_CPICH_ECNO_NRT] + [IS_HHO_ATT_IM_IMS_NRT] + [IS_HHO_ATT_LB_CAPA_DL_NRT] + [IS_HHO_ATT_LB_CAPA_UL_NRT] + [IS_HHO_ATT_LB_PRX_TOT_NRT] + [IS_HHO_ATT_LB_PTX_TOT_NRT] + [IS_HHO_ATT_LB_RES_LIM_NRT] + [IS_HHO_ATT_LB_RSVR_SC_NRT] + [IS_HHO_ATT_SB_NRT] +[ATT_ISHO_CELL_SHUTDOWN_NRT] +[ATT_ISHO_CELL_BLOCK_NRT] - [IS_HHO_ATT_2ND_BEST_CELL_NRT] - [IS_HHO_ATT_3RD_BEST_CELL_NRT])
KPI class Mobility
Unit %
Target values > 95 %
Object summary levels Network, City, Area, RNC, Cluster of cells, Cell
Time summary levels Week, Day, Hour
Table 64 LTE ISHO Success ratio
KPI name LTE ISHO Success ratio
KPI abbreviation LTE ISHO SR
KPI ID RNC_5500a
Description This KPI shows the success ratio of the outgoing Inter-system Hard Handovers from WCDMA -> LTE.
Measurement 1010: Inter System Hard Handover
KPI formula100*sum([M1010C256]+[M1010C257]+[M1010C258]+[M1010C259])/ sum([M1010C252]+[M1010C253]+[M1010C254]+[M1010C255])
KPI formula with short names100*sum([LTE_N_ISHO_SUCC_DCH_CCH]+
Available Key Performance Indicators per Formula WCDMA RAN Key Performance Indicators
116 DN05191189 Issue: 08

Table 64 LTE ISHO Success ratio (Cont.)
[LTE_N_ISHO_SUCC_HSPA_DCH]+[LTE_N_ISHO_SUCC_CS_REL]+[LTE_N_ISHO_SUCC_PERIODIC])/ sum([LTE_N_ISHO_ATT_DCH_CCH]+[LTE_N_ISHO_ATT_HSPA_DCH]+[LTE_N_ISHO_ATT_CS_REL]+[LTE_N_ISHO_ATT_PERIODIC])
KPI class Mobility / Handover
Unit %
Object summary levels Network, City, Area, RNC, Cluster of cells, Cell
Time summary levels Total; week; weeklyBH; day; dailyBH; hour
4.1.4.3 Inter System Hard Handover Drop Ratio [%]
Table 65 GSM ISHO Drop Rate RT
KPI name GSM ISHO Drop Rate RT
KPI abbreviation GSM ISHO DR RT
KPI ID RNC_302e
Description GSM ISHO Drop Rate RT, contains real drops, not all failedISHOs.
Note Inter RNC RT ISHO attempt includes cases when UE hasalso any additional NRT service.
Measurement 1010: Inter System Hard Handover
KPI formula100*sum( [M1010C21] + [M1010C25] + [M1010C29] + [M1010C33] + [M1010C37] + [M1010C79] + [M1010C100] + [M1010C173] + [M1010C174] + [M1010C175] + [M1010C176] + [M1010C177] ) /sum( [M1010C18] + [M1010C22] + [M1010C26] + [M1010C30] + [M1010C34] + [M1010C76] + [M1010C97] + [M1010C137] + [M1010C138] + [M1010C140]
WCDMA RAN Key Performance Indicators Available Key Performance Indicators per Formula
Issue: 08 DN05191189 117

Table 65 GSM ISHO Drop Rate RT (Cont.)
+ [M1010C139] + [M1010C141] + [M1010C185]+ [M1010C195]+ [M1010C196]+ [M1010C215]+ [M1010C219]+ [M1010C226]+ [M1010C234]- [M1010C229] - [M1010C230])
KPI formula with short names100*sum( [CON_DRPS_IS_HHO_UL_DCH_Q_RT] + [CON_DRPS_IS_HHO_UE_PWR_RT] + [CON_DRPS_IS_HHO_DL_DPCH_RT] + [CON_DRPS_IS_HHO_RSCP_RT] + [CON_DRPS_IS_HHO_ECNO_RT] + [CON_DRPS_IS_HHO_IM_IMS_RT] + [CON_DRPS_IS_HHO_EMERG_CALL] + [CONDR_IS_HHO_LB_PRX_TOT_RT] + [CONDR_IS_HHO_LB_PTX_TOT_RT] + [CONDR_IS_HHO_LB_RSVR_SC_RT] + [CONDR_IS_HHO_LB_RES_LIM_RT] + [CONDR_IS_HHO_SB_RT] ) /sum( [IS_HHO_ATT_UL_DCH_Q_RT] + [IS_HHO_ATT_UE_TRX_PWR_RT] + [IS_HHO_ATT_DPCH_PWR_RT] + [IS_HHO_ATT_CPICH_RSCP_RT] + [IS_HHO_ATT_CPICH_ECNO_RT] + [IS_HHO_ATT_IM_IMS_RT] + [IS_HHO_ATT_EMERG_CALL] + [IS_HHO_ATT_LB_PRX_TOT_RT] + [IS_HHO_ATT_LB_PTX_TOT_RT] + [IS_HHO_ATT_LB_RES_LIM_RT] + [IS_HHO_ATT_LB_RSVR_SC_RT] + [IS_HHO_ATT_SB_RT] + [IS_HHO_ATT_UL_DCH_WPS_RT]+ [IS_HHO_ATT_LB_CAPA_UL_RT]+ [IS_HHO_ATT_LB_CAPA_DL_RT]+ [IS_HHO_ATT_DR_AMR_RT]+ [ATT_GANHO_AMR_RT]+ [ATT_ISHO_CELL_SHUTDOWN_RT]+ [ATT_ISHO_CELL_BLOCK_RT]- [IS_HHO_ATT_2ND_BEST_CELL_RT] - [IS_HHO_ATT_3RD_BEST_CELL_RT])
KPI class Mobility
Unit %
Target values OPEN
Object summary levels Network, City, Area, RNC, Cluster of cells, Cell
Time summary levels Total; week; weeklyBH; day; dailyBH; hour
Table 66 GSM ISHO Drop Rate NRT
KPI name GSM ISHO Drop Rate NRT
KPI abbreviation GSM ISHO DR NRT
Available Key Performance Indicators per Formula WCDMA RAN Key Performance Indicators
118 DN05191189 Issue: 08

Table 66 GSM ISHO Drop Rate NRT (Cont.)
KPI ID RNC_303e
Description GSM ISHO Drop Rate NRT, contains real drops, not allfailed ISHOs.
Note Inter RNC NRT ISHO attempt excludes cases when UE hasalso any RT service.
Measurement 1010: Inter System Hard Handover
KPI formula100*sum( [M1010C59]+ [M1010C63]+ [M1010C67]+ [M1010C71]+ [M1010C75]+ [M1010C86]+ [M1010C181]+ [M1010C180]+ [M1010C178]+ [M1010C179]+ [M1010C183]+ [M1010C182]+ [M1010C184] ) /sum( [M1010C56] + [M1010C60] + [M1010C64] + [M1010C68] + [M1010C72] + [M1010C83] + [M1010C145] + [M1010C144] + [M1010C142] + [M1010C143] + [M1010C147] + [M1010C146] + [M1010C148] + [M1010C225]+ [M1010C233]- [M1010C231] - [M1010C232])
KPI formula with short names100*sum( [CON_DRPS_IS_HHO_UL_DCH_Q_NRT]+ [CON_DRPS_IS_HHO_TRX_PWR_NRT]+ [CON_DRPS_IS_HHO_DL_DPCH_NRT]+ [CON_DRPS_IS_HHO_RSCP_NRT]+ [CON_DRPS_IS_HHO_ECNO_NRT]+ [CON_DRPS_IS_HHO_IM_IMS_NRT]+ [CONDR_IS_HHO_LB_CAPA_DL_NRT]+ [CONDR_IS_HHO_LB_CAPA_UL_NRT]+ [CONDR_IS_HHO_LB_PRX_TOT_NRT]+ [CONDR_IS_HHO_LB_PTX_TOT_NRT]+ [CONDR_IS_HHO_LB_RES_LIM_NRT]+ [CONDR_IS_HHO_LB_RSVR_SC_NRT]+ [CONDR_IS_HHO_SB_NRT] ) /sum( [IS_HHO_ATT_UL_DCH_Q_NRT] + [IS_HHO_ATT_UE_TRX_PWR_NRT] + [IS_HHO_ATT_DL_DPCH_PWR_NRT] + [IS_HHO_ATT_CPICH_RSCP_NRT] + [IS_HHO_ATT_CPICH_ECNO_NRT] + [IS_HHO_ATT_IM_IMS_NRT] + [IS_HHO_ATT_LB_CAPA_DL_NRT] + [IS_HHO_ATT_LB_CAPA_UL_NRT]
WCDMA RAN Key Performance Indicators Available Key Performance Indicators per Formula
Issue: 08 DN05191189 119
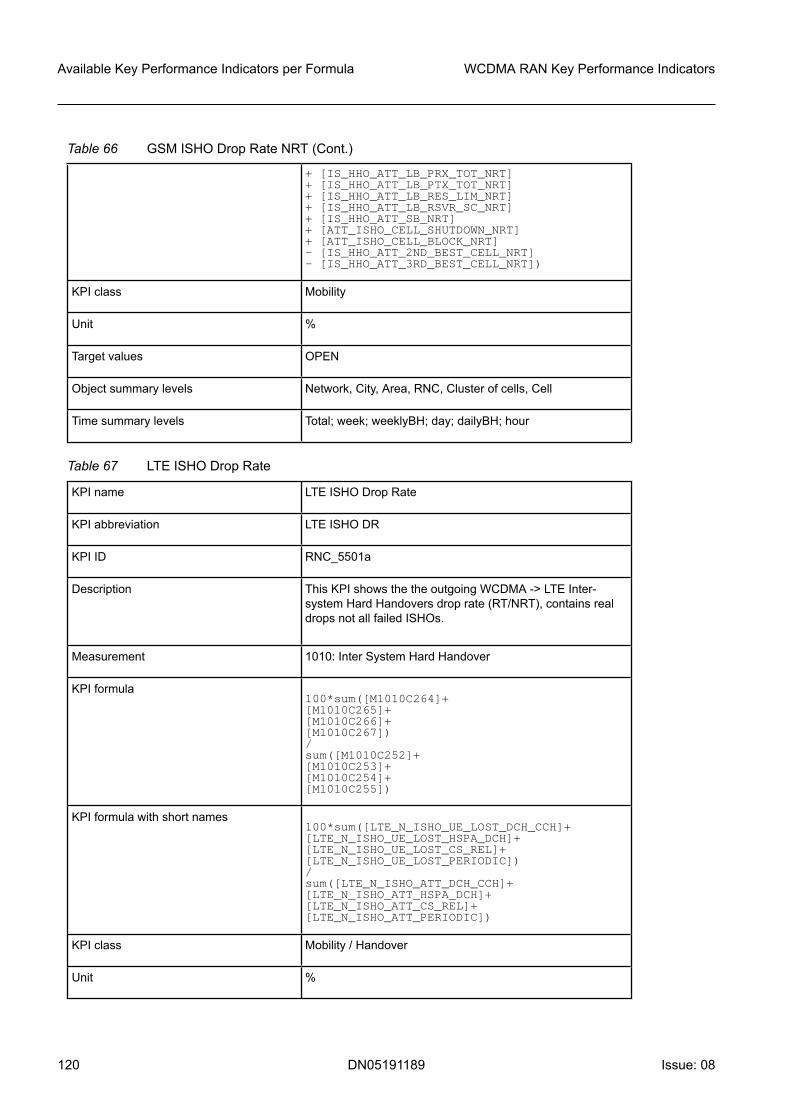
Table 66 GSM ISHO Drop Rate NRT (Cont.)
+ [IS_HHO_ATT_LB_PRX_TOT_NRT] + [IS_HHO_ATT_LB_PTX_TOT_NRT] + [IS_HHO_ATT_LB_RES_LIM_NRT] + [IS_HHO_ATT_LB_RSVR_SC_NRT] + [IS_HHO_ATT_SB_NRT] + [ATT_ISHO_CELL_SHUTDOWN_NRT]+ [ATT_ISHO_CELL_BLOCK_NRT]- [IS_HHO_ATT_2ND_BEST_CELL_NRT] - [IS_HHO_ATT_3RD_BEST_CELL_NRT])
KPI class Mobility
Unit %
Target values OPEN
Object summary levels Network, City, Area, RNC, Cluster of cells, Cell
Time summary levels Total; week; weeklyBH; day; dailyBH; hour
Table 67 LTE ISHO Drop Rate
KPI name LTE ISHO Drop Rate
KPI abbreviation LTE ISHO DR
KPI ID RNC_5501a
Description This KPI shows the the outgoing WCDMA -> LTE Inter-system Hard Handovers drop rate (RT/NRT), contains realdrops not all failed ISHOs.
Measurement 1010: Inter System Hard Handover
KPI formula100*sum([M1010C264]+[M1010C265]+[M1010C266]+[M1010C267]) / sum([M1010C252]+[M1010C253]+[M1010C254]+[M1010C255])
KPI formula with short names100*sum([LTE_N_ISHO_UE_LOST_DCH_CCH]+[LTE_N_ISHO_UE_LOST_HSPA_DCH]+[LTE_N_ISHO_UE_LOST_CS_REL]+[LTE_N_ISHO_UE_LOST_PERIODIC]) / sum([LTE_N_ISHO_ATT_DCH_CCH]+[LTE_N_ISHO_ATT_HSPA_DCH]+[LTE_N_ISHO_ATT_CS_REL]+[LTE_N_ISHO_ATT_PERIODIC])
KPI class Mobility / Handover
Unit %
Available Key Performance Indicators per Formula WCDMA RAN Key Performance Indicators
120 DN05191189 Issue: 08
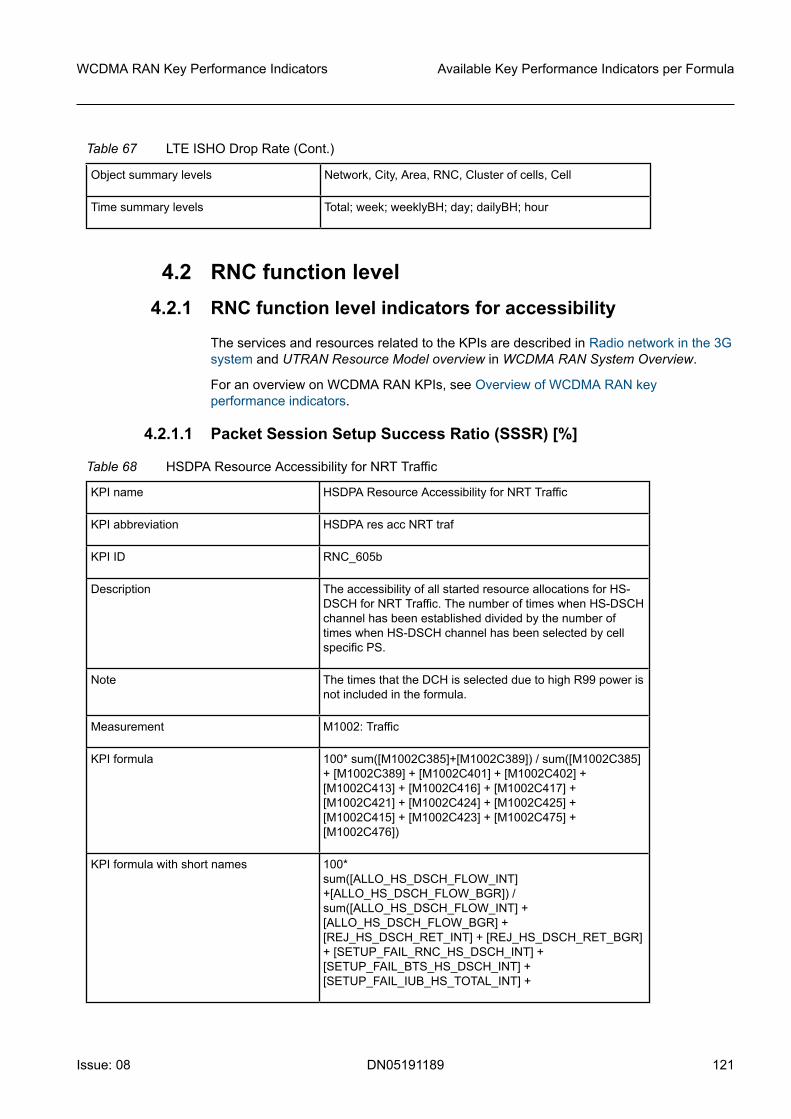
Table 67 LTE ISHO Drop Rate (Cont.)
Object summary levels Network, City, Area, RNC, Cluster of cells, Cell
Time summary levels Total; week; weeklyBH; day; dailyBH; hour
4.2 RNC function level4.2.1 RNC function level indicators for accessibility
The services and resources related to the KPIs are described in Radio network in the 3Gsystem and UTRAN Resource Model overview in WCDMA RAN System Overview.
For an overview on WCDMA RAN KPIs, see Overview of WCDMA RAN keyperformance indicators.
4.2.1.1 Packet Session Setup Success Ratio (SSSR) [%]
Table 68 HSDPA Resource Accessibility for NRT Traffic
KPI name HSDPA Resource Accessibility for NRT Traffic
KPI abbreviation HSDPA res acc NRT traf
KPI ID RNC_605b
Description The accessibility of all started resource allocations for HS-DSCH for NRT Traffic. The number of times when HS-DSCHchannel has been established divided by the number oftimes when HS-DSCH channel has been selected by cellspecific PS.
Note The times that the DCH is selected due to high R99 power isnot included in the formula.
Measurement M1002: Traffic
KPI formula 100* sum([M1002C385]+[M1002C389]) / sum([M1002C385]+ [M1002C389] + [M1002C401] + [M1002C402] +[M1002C413] + [M1002C416] + [M1002C417] +[M1002C421] + [M1002C424] + [M1002C425] +[M1002C415] + [M1002C423] + [M1002C475] +[M1002C476])
KPI formula with short names 100*sum([ALLO_HS_DSCH_FLOW_INT]+[ALLO_HS_DSCH_FLOW_BGR]) /sum([ALLO_HS_DSCH_FLOW_INT] +[ALLO_HS_DSCH_FLOW_BGR] +[REJ_HS_DSCH_RET_INT] + [REJ_HS_DSCH_RET_BGR]+ [SETUP_FAIL_RNC_HS_DSCH_INT] +[SETUP_FAIL_BTS_HS_DSCH_INT] +[SETUP_FAIL_IUB_HS_TOTAL_INT] +
WCDMA RAN Key Performance Indicators Available Key Performance Indicators per Formula
Issue: 08 DN05191189 121

Table 68 HSDPA Resource Accessibility for NRT Traffic (Cont.)
[SETUP_FAIL_RNC_HS_DSCH_BGR] +[SETUP_FAIL_BTS_HS_DSCH_BGR] +[SETUP_FAIL_IUB_HS_TOTAL_BGR] +[SETUP_FAIL_UE_HS_DSCH_INT] +[SETUP_FAIL_UE_HS_DSCH_BGR] +[DCH_SEL_MAX_HSDPA_USERS_INT] +[DCH_SEL_MAX_HSDPA_USERS_BGR])
KPI class Accessibility
Unit Percentage
Typical values OPEN
Object Summary Levels Network; City; Area; RNC; WBTS; Cluster of cells; Cell
Time Summary Levels Week, Day, Hour
Table 69 HSDPA Resource Accessibility for RT Traffic
KPI name HSDPA Resource Accessibility for RT Traffic
KPI abbreviation HSDPA res acc for RT traf
KPI ID RNC_5000b
Description The accessibility of all started resource allocations for HS-DSCH for RT Traffic. The number of times when HS-DSCHchannel has been established divided by the number oftimes when HS-DSCH channel has been selected by cellspecific PS.
Note The times that the DCH is selected due to high R99 power isnot included in the formula.
Measurement M1002: Traffic
KPI formula 100 * sum([M1002C569]) / sum([M1002C569] +[M1002C591] + [M1002C577] + [M1002C581] +[M1002C584] + [M1002C585] + [M1002C583])
KPI formula with short names 100 * sum([ALLO_HS_DSCH_FLOW_STR]) /sum([ALLO_HS_DSCH_FLOW_STR] +[DCH_SEL_MAX_HSDPA_USERS_STR] +[REJ_HS_DSCH_RET_STR] +[SETUP_FAIL_RNC_HS_DSCH_STR] +[SETUP_FAIL_BTS_HS_DSCH_STR] +[SETUP_FAIL_IUB_HS_TOTAL_STR] +[SETUP_FAIL_UE_HS_DSCH_STR])
KPI class Accessibility
Unit Percentage
Available Key Performance Indicators per Formula WCDMA RAN Key Performance Indicators
122 DN05191189 Issue: 08

Table 69 HSDPA Resource Accessibility for RT Traffic (Cont.)
Typical values See Targets for WCDMA RAN key performance indicators.
Object Summary Levels Network, City, Area, RNC, Cluster of cells, Cell
Time Summary Levels Week, Day, Hour
Table 70 HSDPA Setup Success Ratio
KPI name HSDPA Setup Success Ratio from user perspective
KPI abbreviation HSDPA stp SR Usr
KPI ID RNC_914c
Description HSDPA Setup Success Ratio [%] for Streaming, Interactiveand Background Services from user perspective over thereporting period.
Note The capacity requests by HSDPA capable UE to cells thatare not configured to support HSDPA are excluded byspecific counters in the formula.
Measurement M1022: Packet Call
KPI formula 100* sum([M1022C190] + [M1022C21] + [M1022C22] +[M1022C191] + [M1022C23] + [M1022C24] + [M1022C192]+ [M1022C25] + [M1022C26]) / sum([M1022C181] +[M1022C3] + [M1022C4] + [M1022C182] + [M1022C5] +[M1022C6] - [M1022C222] - [M1022C221] - [M1022C220] -[M1022C219] - [M1022C218] - [M1022C217])
KPI formula with short names 100* sum([HS_E_REQ_HS_E_ALLO_STRE] +[HS_E_REQ_HS_E_ALLO_INT] +[HS_E_REQ_HS_E_ALLO_BGR] +[HS_E_REQ_HS_D_ALLO_STRE] +[HS_E_REQ_HS_D_ALLO_INT] +[HS_E_REQ_HS_D_ALLO_BGR] +[HS_D_REQ_HS_D_ALLO_STRE] +[HS_D_REQ_HS_D_ALLO_INT] +[HS_D_REQ_HS_D_ALLO_BGR]) /sum([PS_ATT_HSDSCH_EDCH_STRE] +[PS_ATT_HSDSCH_EDCH_INT] +[PS_ATT_HSDSCH_EDCH_BGR] +[PS_ATT_HSDSCH_DCH_STRE] +[PS_ATT_HSDSCH_DCH_INT] +[PS_ATT_HSDSCH_DCH_BGR] -[HS_D_REQ_D_D_ALLO_STR_CELL] -[HS_D_REQ_D_D_ALLO_BGR_CELL] -[HS_D_REQ_D_D_ALLO_INT_CELL] -[HS_E_REQ_D_D_ALLO_STR_CELL] -[HS_E_REQ_D_D_ALLO_BGR_CELL] -[HS_E_REQ_D_D_ALLO_INT_CELL])
KPI class Accessibility
WCDMA RAN Key Performance Indicators Available Key Performance Indicators per Formula
Issue: 08 DN05191189 123

Table 70 HSDPA Setup Success Ratio (Cont.)
Unit Percentage
Typical values OPEN
Object Summary Levels Network, RNC
Time Summary Levels Week, Day, Hour
Table 71 HSUPA Resource Accessibility for NRT Traffic
KPI name HSUPA Resource Accessibility for NRT Traffic
KPI abbreviation HSUPA res acc NRT traf
KPI ID RNC_913b
Description The accessibility of all started resource allocations for E-DCH for NRT Traffic. The number of times when E-DCHchannel has been established divided by the number oftimes when HS-DSCH channel has been selected by cellspecific PS.
Note 1. This KPI includes all reservations, also all SHO branchesincluded in HSUPA AS. 2. The corresponding IHSPA KPI isIHSPA5005a.
Measurement 1002: Traffic
KPI formula 100* sum([M1002C531] + [M1002C532]) /sum([M1002C531] + [M1002C532] + [M1002C520] +[M1002C519] + [M1002C516] + [M1002C515] +[M1002C517] + [M1002C518] + [M1002C526] +[M1002C525] + [M1002C530] + [M1002C529] +[M1002C528] + [M1002C527] + [M1002C524] +[M1002C523] + [M1002C681] + [M1002C682])
KPI formula with short names 100* sum([ALLO_SUCCESS_EDCH_INT] +[ALLO_SUCCESS_EDCH_BGR]) /sum([ALLO_SUCCESS_EDCH_INT] +[ALLO_SUCCESS_EDCH_BGR] +[EDCH_ALLO_CANC_NA_AS_BGR] +[EDCH_ALLO_CANC_NA_AS_INT] +[UL_DCH_SEL_MAX_HSUPA_USR_BGR] +[UL_DCH_SEL_MAX_HSUPA_USR_INT] +[UL_DCH_SEL_BTS_HW_INT] +[UL_DCH_SEL_BTS_HW_BGR] +[SETUP_FAIL_EDCH_BTS_BGR] +[SETUP_FAIL_EDCH_BTS_INT] +[SETUP_FAIL_EDCH_OTHER_BGR] +[SETUP_FAIL_EDCH_OTHER_INT] +[SETUP_FAIL_EDCH_TRANS_BGR] +[SETUP_FAIL_EDCH_TRANS_INT] +[SETUP_FAIL_EDCH_UE_BGR] +
Available Key Performance Indicators per Formula WCDMA RAN Key Performance Indicators
124 DN05191189 Issue: 08

Table 71 HSUPA Resource Accessibility for NRT Traffic (Cont.)
[SETUP_FAIL_EDCH_UE_INT] +[SETUP_REJ_EDCH_AC_INT] +[SETUP_REJ_EDCH_AC_BGR])
KPI class Accessibility
Unit %
Target values OPEN
Object summary levels Network, City, Area, RNC, Cluster of cells, Cell
Time summary levels Week, Day, Hour
Table 72 HSUPA Resource Accessibility for RT Traffic
KPI name HSUPA Resource Accessibility for RT Traffic
KPI abbreviation HSUPA res acc for RT traf
KPI ID RNC_5002a
Description The accessibility of all started resource allocations for E-DCH for RT Traffic. The number of times when E-DCHchannel has been established divided by the number oftimes when HS-DSCH channel has been selected by cellspecific PS.
Note This KPI includes all reservations, also all SHO branchesincluded in HSUPA AS.
Measurement M1002: Traffic
KPI formula 100* sum([M1002C607]) / sum([M1002C607] +[M1002C599] + [M1002C600] + [M1002C601] +[M1002C603] + [M1002C604] + [M1002C605] +[M1002C606])
KPI formula with short names 100* sum([ALLO_SUCCESS_EDCH_STR]) /sum([ALLO_SUCCESS_EDCH_STR] +[UL_DCH_SEL_MAX_HSUPA_USR_STR] +[UL_DCH_SEL_BTS_HW_STR] +[EDCH_ALLO_CANC_NA_AS_STR] +[SETUP_FAIL_EDCH_UE_STR] +[SETUP_FAIL_EDCH_BTS_STR] +[SETUP_FAIL_EDCH_TRANS_STR] +[SETUP_FAIL_EDCH_OTHER_STR])
KPI class Accessibility
Unit Percentage
Object Summary Levels Network, City, Area, RNC, Cluster of cells, Cell
WCDMA RAN Key Performance Indicators Available Key Performance Indicators per Formula
Issue: 08 DN05191189 125

Table 72 HSUPA Resource Accessibility for RT Traffic (Cont.)
Time Summary Levels Week, Day, Hour
Table 73 HSUPA Setup Success Ratio
KPI name HSUPA Setup Success Ratio from user perspective
KPI abbreviation HSUPA stp SR Usr
KPI ID RNC_915c
Description HSUPA Setup Success Ratio [%] for Streaming, Interactiveand Background Services from user perspective over thereporting period.
Note The capacity requests by HSUPA capable UE to cells thatare not configured to support HSDPA are excluded byspecific counters in the formula.
Measurement M1022: Packet Call
KPI formula 100* sum([M1022C190] + [M1022C21] + [M1022C22]) /sum([M1022C181] + [M1022C3] + [M1022C4] -[M1022C216] - [M1022C215] - [M1022C214] - [M1022C219]- [M1022C218] - [M1022C217])
KPI formula with short names 100* sum([HS_E_REQ_HS_E_ALLO_STRE] +[HS_E_REQ_HS_E_ALLO_INT] +[HS_E_REQ_HS_E_ALLO_BGR]) /sum([PS_ATT_HSDSCH_EDCH_STRE] +[PS_ATT_HSDSCH_EDCH_INT] +[PS_ATT_HSDSCH_EDCH_BGR] -[HS_E_REQ_HS_D_ALLO_STR_CELL] -[HS_E_REQ_HS_D_ALLO_BGR_CELL] -[HS_E_REQ_HS_D_ALLO_INT_CELL] -[HS_E_REQ_D_D_ALLO_STR_CELL] -[HS_E_REQ_D_D_ALLO_BGR_CELL] -[HS_E_REQ_D_D_ALLO_INT_CELL])
KPI class Accessibility
Unit Percentage
Typical values OPEN
Object Summary Levels Network, RNC
Time Summary Levels Week, Day, Hour
Table 74 R99 Setup Success Ratio
KPI name R99 Setup Success Ratio from user perspective
Available Key Performance Indicators per Formula WCDMA RAN Key Performance Indicators
126 DN05191189 Issue: 08

Table 74 R99 Setup Success Ratio (Cont.)
KPI abbreviation R99 stp SR Usr
KPI ID RNC_943b
Description R99 Setup Success Ratio for Streaming, Interactive andBackground Services [%] from user perspective over thereporting period.
Measurement M1022: Packet Call
KPI formula 100* sum([M1022C195] + [M1022C31] + [M1022C32]) /sum([M1022C183] + [M1022C7] + [M1022C8])
KPI formula with short names 100* sum([D_D_REQ_D_D_ALLO_STRE] +[D_D_REQ_D_D_ALLO_INT] +[D_D_REQ_D_D_ALLO_BGR]) /sum([PS_ATT_DCH_DCH_STRE] +[PS_ATT_DCH_DCH_INT] + [PS_ATT_DCH_DCH_BGR])
KPI class Accessibility
Unit Percentage
Typical values OPEN
Object Summary Levels Network, RNC
Time Summary Levels Week, Day, Hour
4.2.2 RNC function level indicators for retainability
The services and resources related to the KPIs are described in Radio network in the 3Gsystem and UTRAN Resource Model overview in WCDMA RAN System Overview.
For an overview on WCDMA RAN KPIs, see Overview of WCDMA RAN keyperformance indicators.
4.2.2.1 Packet Session Success Ratio (SSR) [%]
Table 75 HSDPA Resource Retainability for NRT Traffic
KPI name HSDPA Resource Retainability for NRT Traffic
KPI abbreviation HSDPA res retain NRT traf
KPI ID RNC_609a
Description The retainability of all successfully allocated HS-DSCHresources for NRT traffic.
WCDMA RAN Key Performance Indicators Available Key Performance Indicators per Formula
Issue: 08 DN05191189 127

Table 75 HSDPA Resource Retainability for NRT Traffic (Cont.)
Note 1 The normal transition from HS-DSCH to FACH/DCH areconsidered as a normal HS-DSCH release (includingtransitions due to mobility and pre-emption).
Note 2 The fallbacks and other possible normal release countersare not included in the formula. They are already included inthe Normal release counters.
Measurement M1002: Traffic
KPI formula 100* sum([M1002C407] + [M1002C410]) /sum([M1002C407] + [M1002C410] + [M1002C408] +[M1002C411] + [M1002C479] + [M1002C482])
KPI formula with short names 100* sum([REL_ALLO_NORM_HS_DSCH_INT] +[REL_ALLO_NORM_HS_DSCH_BGR]) /sum([REL_ALLO_NORM_HS_DSCH_INT] +[REL_ALLO_NORM_HS_DSCH_BGR] +[REL_ALLO_OTH_FAIL_HSDSCH_INT] +[REL_ALLO_OTH_FAIL_HSDSCH_BGR] +[REL_ALLO_RL_FAIL_HS_DSCH_INT] +[REL_ALLO_RL_FAIL_HS_DSCH_BGR])
KPI class Retainability
Unit Percentage
Object Summary Levels Network, City, Area, RNC, Cluster of cells, Cell
Time Summary Levels Week, Day, Hour
Table 76 HSDPA Resource Retainability for RT Traffic
KPI name HSDPA Resource Retainability for RT Traffic
KPI abbreviation HSDPA res retain RT traf
KPI ID RNC_5010a
Description The retainability of all successfully allocated HS-DSCHresources for RT traffic.
Note 1 The normal transition from HS-DSCH to FACH/DCH areconsidered as a normal HS-DSCH release (includingtransitions due to mobility and pre-emption).
Note 2 The fallbacks and other possible normal release countersare not included in the formula. They are already included inthe Normal release counters.
Measurement M1002: Traffic
Available Key Performance Indicators per Formula WCDMA RAN Key Performance Indicators
128 DN05191189 Issue: 08

Table 76 HSDPA Resource Retainability for RT Traffic (Cont.)
KPI formula 100 * sum([M1002C578]) / sum([M1002C578] +[M1002C594] + [M1002C579])
KPI formula with short names 100 * sum([REL_ALLO_NORM_HS_DSCH_STR]) /sum([REL_ALLO_NORM_HS_DSCH_STR] +[REL_ALLO_RL_FAIL_HS_DSCH_STR] +[REL_ALLO_OTH_FAIL_HSDSCH_STR])
KPI class Retainability
Unit Percentage
Object Summary Levels Network, City, Area, RNC, Cluster of cells, Cell
Time Summary Levels Week, Day, Hour
Table 77 HSDPA Success Ratio
KPI name HSDPA Success Ratio from user perspective
KPI abbreviation HSDPA SR Usr
KPI ID RNC_920b
Description The HSDPA Success Ratio for Streaming, Interactive andBackground Services from user perspective.
Note Switching from HSPA to R99 is considered as a normalHSPA release in the formula.
Measurement 1022: Packet Call
KPI formula 100-100* sum([M1022C208] + [M1022C57] + [M1022C58] +[M1022C209] + [M1022C59] + [M1022C60] + [M1022C211]+ [M1022C63] + [M1022C64] + [M1022C212] + [M1022C65]+ [M1022C66]) / sum([M1022C208] + [M1022C57] +[M1022C58] + [M1022C209] + [M1022C59] + [M1022C60] +[M1022C211] + [M1022C63] + [M1022C64] + [M1022C212]+ [M1022C65] + [M1022C66] + [M1022C202] + [M1022C45]+ [M1022C46] + [M1022C203] + [M1022C47] + [M1022C48]+ [M1022C197] + [M1022C35] + [M1022C36] +[M1022C198] + [M1022C37] + [M1022C38])
KPI formula with short names 100-100* sum([PS_REL_RL_FAIL_HS_E_STRE] +[PS_REL_RL_FAIL_HS_E_INT] +[PS_REL_RL_FAIL_HS_E_BGR] +[PS_REL_RL_FAIL_HS_D_STRE] +[PS_REL_RL_FAIL_HS_D_INT] +[PS_REL_RL_FAIL_HS_D_BGR] +[PS_REL_OTH_FAIL_HS_E_STRE] +[PS_REL_OTH_FAIL_HS_E_INT] +[PS_REL_OTH_FAIL_HS_E_BGR] +[PS_REL_OTH_FAIL_HS_D_STRE] +
WCDMA RAN Key Performance Indicators Available Key Performance Indicators per Formula
Issue: 08 DN05191189 129

Table 77 HSDPA Success Ratio (Cont.)
[PS_REL_OTH_FAIL_HS_D_INT] +[PS_REL_OTH_FAIL_HS_D_BGR]) /sum([PS_REL_RL_FAIL_HS_E_STRE] +[PS_REL_RL_FAIL_HS_E_INT] +[PS_REL_RL_FAIL_HS_E_BGR] +[PS_REL_RL_FAIL_HS_D_STRE] +[PS_REL_RL_FAIL_HS_D_INT] +[PS_REL_RL_FAIL_HS_D_BGR] +[PS_REL_OTH_FAIL_HS_E_STRE] +[PS_REL_OTH_FAIL_HS_E_INT] +[PS_REL_OTH_FAIL_HS_E_BGR] +[PS_REL_OTH_FAIL_HS_D_STRE] +[PS_REL_OTH_FAIL_HS_D_INT] +[PS_REL_OTH_FAIL_HS_D_BGR] +[PS_REL_NORM_HS_E_STRE] +[PS_REL_NORM_HS_E_INT] +[PS_REL_NORM_HS_E_BGR] +[PS_REL_NORM_HS_D_STRE] +[PS_REL_NORM_HS_D_INT] +[PS_REL_NORM_HS_D_BGR] +[PS_SWI_HS_E_TO_D_D_STRE] +[PS_SWI_HS_E_TO_D_D_INT] +[PS_SWI_HS_E_TO_D_D_BGR] +[PS_SWI_HS_D_TO_D_D_STRE] +[PS_SWI_HS_D_TO_D_D_INT] +[PS_SWI_HS_D_TO_D_D_BGR])
KPI class Retainability
Unit %
Target values OPEN
Object summary levels Network; City; Area; RNC; WBTS; Cluster of cells; Cell
Time summary levels Week, Day, Hour
Table 78 HSUPA resource Retainability for NRT Traffic
KPI name HSUPA resource Retainability for NRT Traffic
KPI abbreviation HSUPA res retain NRT traf
KPI ID RNC_919b
Description The retainability of all successfully allocated E-DCHresources for NRT traffic.
Note This KPI includes all HSUPA resource releases i.e. for allSHO branches included in HSUPA AS.
Measurement M1002: Traffic
Available Key Performance Indicators per Formula WCDMA RAN Key Performance Indicators
130 DN05191189 Issue: 08

Table 78 HSUPA resource Retainability for NRT Traffic (Cont.)
KPI formula 100* sum([M1002C535] + [M1002C536]) /sum([M1002C535] + [M1002C536] + [M1002C539] +[M1002C540] + [M1002C541] + [M1002C542])
KPI formula with short names 100* sum([REL_EDCH_NORM_INT] +[REL_EDCH_NORM_BGR])/sum([REL_EDCH_NORM_INT]+[REL_EDCH_NORM_BGR] + [REL_EDCH_RL_FAIL_INT]+ [REL_EDCH_RL_FAIL_BGR] +[REL_EDCH_OTHER_FAIL_INT] +[REL_EDCH_OTHER_FAIL_BGR])"
KPI class Retainability
Unit Percentage
Object Summary Levels Network, City, Area, RNC, Cluster of cells, Cell
Time Summary Levels Week, Day, Hour
Table 79 HSUPA Resource Retainability for RT Traffic
KPI name HSUPA Resource Retainability for RT Traffic
KPI abbreviation HSUPA res retain RT traf
KPI ID RNC_5012a
Description The retainability of all successfully allocated E-DCHresources for RT traffic.
Note This KPI includes all HSUPA resource releases, that is, forall SHO branches included in HSUPA AS.
Measurement M1002: Traffic
KPI formula 100 * sum([M1002C609] + [M1002C610]) /sum([M1002C609] + [M1002C610] + [M1002C611] +[M1002C612])
KPI formula with short names 100 * sum([REL_EDCH_NORM_STR] +[REL_EDCH_HSDSCH_SCC_STR]) /sum([REL_EDCH_NORM_STR] +[REL_EDCH_HSDSCH_SCC_STR] +[REL_EDCH_RL_FAIL_STR] +[REL_EDCH_OTHER_FAIL_STR])
KPI class Retainability
Unit Percentage
Object Summary Levels Network, City, Area, RNC, Cluster of cells, Cell
WCDMA RAN Key Performance Indicators Available Key Performance Indicators per Formula
Issue: 08 DN05191189 131

Table 79 HSUPA Resource Retainability for RT Traffic (Cont.)
Time Summary Levels Week, Day, Hour
Table 80 HSUPA Success Ratio
KPI name HSUPA Success Ratio from user perspective
KPI abbreviation HSUPA SR Usr
KPI ID RNC_921c
Description The HSUPA Success Ratio for Streaming, Interactive andBackground Services from user perspective.
Note Switching from HSPA to R99 is considered as a normalHSPA release in the formula.
Measurement 1022: Packet Call
KPI formula 100-100* sum([M1022C208] + [M1022C57] + [M1022C58] +[M1022C211] + [M1022C63] + [M1022C64]) /sum([M1022C208] + [M1022C57] + [M1022C58] +[M1022C211] + [M1022C63] + [M1022C64] + [M1022C202]+ [M1022C45] + [M1022C46] + [M1022C197] + [M1022C35]+ [M1022C36]+ [M1022C34]+ [M1022C33]+ [M1022C196])
KPI formula with short names 100-100* sum([PS_REL_RL_FAIL_HS_E_STRE] +[PS_REL_RL_FAIL_HS_E_INT] +[PS_REL_RL_FAIL_HS_E_BGR] +[PS_REL_OTH_FAIL_HS_E_STRE] +[PS_REL_OTH_FAIL_HS_E_INT] +[PS_REL_OTH_FAIL_HS_E_BGR]) /sum([PS_REL_RL_FAIL_HS_E_STRE] +[PS_REL_RL_FAIL_HS_E_INT] +[PS_REL_RL_FAIL_HS_E_BGR] +[PS_REL_OTH_FAIL_HS_E_STRE] +[PS_REL_OTH_FAIL_HS_E_INT] +[PS_REL_OTH_FAIL_HS_E_BGR] +[PS_REL_NORM_HS_E_STRE] +[PS_REL_NORM_HS_E_INT] +[PS_REL_NORM_HS_E_BGR] +[PS_SWI_HS_E_TO_D_D_STRE] +[PS_SWI_HS_E_TO_D_D_INT] +[PS_SWI_HS_E_TO_D_D_BGR]+[PS_SWI_HS_E_TO_HS_D_BGR]+[PS_SWI_HS_E_TO_HS_D_INT]+[PS_SWI_HS_E_TO_HS_D_STRE])
KPI class Retainability
Unit %
Target values OPEN
Available Key Performance Indicators per Formula WCDMA RAN Key Performance Indicators
132 DN05191189 Issue: 08

Table 80 HSUPA Success Ratio (Cont.)
Object summary levels Network; City; Area; RNC; WBTS; Cluster of cells; Cell
Time summary levels Week, Day, Hour
Table 81 R99 Success Ratio
KPI name R99 Success Ratio from user perspective
KPI abbreviation R99 SR Usr
KPI ID RNC_944c
Description The R99 Success Ratio for Streaming, Interactive andBackground Services from user perspective.
Measurement 1022: Packet Call
KPI formula 100-100* sum([M1022C210] + [M1022C61] + [M1022C62] +[M1022C213] + [M1022C67] + [M1022C68]) /sum([M1022C210] + [M1022C61] + [M1022C62] +[M1022C213] + [M1022C67] + [M1022C68] + [M1022C204]+ [M1022C49] + [M1022C50]+ [M1022C44]+ [M1022C43]+[M1022C201]+ [M1022C42]+ [M1022C41]+ [M1022C200])
KPI formula with short names 100-100* sum([PS_REL_RL_FAIL_D_D_STRE] +[PS_REL_RL_FAIL_D_D_INT] +[PS_REL_RL_FAIL_D_D_BGR] +[PS_REL_OTH_FAIL_D_D_STRE] +[PS_REL_OTH_FAIL_D_D_INT] +[PS_REL_OTH_FAIL_D_D_BGR]) /sum([PS_REL_RL_FAIL_D_D_STRE] +[PS_REL_RL_FAIL_D_D_INT] +[PS_REL_RL_FAIL_D_D_BGR] +[PS_REL_OTH_FAIL_D_D_STRE] +[PS_REL_OTH_FAIL_D_D_INT] +[PS_REL_OTH_FAIL_D_D_BGR] +[PS_REL_NORM_D_D_STRE] +[PS_REL_NORM_D_D_INT] +[PS_REL_NORM_D_D_BGR]+[PS_SWI_D_D_TO_HS_E_BGR]+[PS_SWI_D_D_TO_HS_E_INT]+[PS_SWI_D_D_TO_HS_E_STRE]+[PS_SWI_D_D_TO_HS_D_BGR]+[PS_SWI_D_D_TO_HS_D_INT]+[PS_SWI_D_D_TO_HS_D_STRE])
KPI class Retainability
Unit %
Target values OPEN
Object summary levels Network, RNC
WCDMA RAN Key Performance Indicators Available Key Performance Indicators per Formula
Issue: 08 DN05191189 133

Table 81 R99 Success Ratio (Cont.)
Time summary levels Week, Day, Hour
4.2.3 RNC function level indicators for usage
The services and resources related to the KPIs are described in Radio network in the 3Gsystem and UTRAN Resource Model overview in WCDMA RAN System Overview.
For an overview on WCDMA RAN KPIs, see Overview of WCDMA RAN keyperformance indicators.
4.2.3.1 Requested RRC Connection Attempt Numbers [Integer Number]
Table 82 Registration Attempts
KPI name Registration Attempts
KPI abbreviation Regist att
KPI ID RNC_218a
Description Number of registration attempts.
Note Registration means either network entry, change of locationarea or periodical location update.
Measurement M1001: Service Level
KPI formula sum([M1001C46])
KPI formula with short names sum([REGISTRATION_ATTS])
KPI class Usage/Requested Capacity
Unit #
Object Summary Levels Network, City, Area, RNC, Cluster of cells, Cell
Time Summary Levels Total; week; weeklyBH; day; dailyBH; hour
Table 83 RRC Setup Attempts
KPI name RRC Setup Attempts
KPI abbreviation RRC Setup att
KPI ID RNC_214a
Description The number of RRC connection setup attempts.
Available Key Performance Indicators per Formula WCDMA RAN Key Performance Indicators
134 DN05191189 Issue: 08

Table 83 RRC Setup Attempts (Cont.)
Note This KPI from RU20 onwards doesn't include RRC / RABsetups based on incoming relocations and hard handovers.These have been moved to the new counters and those arenot used in this KPI.
Measurement M1001: Service Level
KPI formula sum([M1001C0])
KPI formula with short names sum([RRC_CONN_STP_ATT])
KPI class Usage/Requested Capacity
Unit #
Object Summary Levels Network, City, Area, RNC, Cluster of cells, Cell
Time Summary Levels Total; week; weeklyBH; day; dailyBH; hour
4.2.3.2 Requested Service Attempt Numbers [Integer Number]
Table 84 RAB Attempts Voice
KPI name RAB Attempts Voice
KPI abbreviation RAB att Voice
KPI ID RNC_229a
Description Number of RAB setup attempts requested for CSConversational calls with RAB QoS parameter 'sourcedescriptor' = Speech.
Measurement M1001: Service Level
KPI formula sum([M1001C66])
KPI formula with short names sum([RAB_STP_ATT_CS_VOICE])
KPI class Usage/Requested Capacity
Unit #
Object Summary Levels Network, City, Area, RNC, Cluster of cells, Cell
Time Summary Levels Total; week; weeklyBH; day; dailyBH; hour
Table 85 RAB Attempts UDI
KPI name RAB Attempts UDI
WCDMA RAN Key Performance Indicators Available Key Performance Indicators per Formula
Issue: 08 DN05191189 135

Table 85 RAB Attempts UDI (Cont.)
KPI abbreviation RAB att UDI
KPI ID RNC_268a
Description Number of RAB setup attempts requested for CSConversational calls with RAB QoS parameter 'sourcedescriptor' = UDI.
Note UDI basically means video calls.
Measurement M1001: Service Level
KPI formula sum([M1001C67])
KPI formula with short names sum([RAB_STP_ATT_CS_CONV])
KPI class Usage/Requested Capacity
Unit #
Object Summary Levels Network, City, Area, RNC, Cluster of cells, Cell
Time Summary Levels Total; week; weeklyBH; day; dailyBH; hour
Table 86 RAB Attempts Streaming
KPI name RAB Attempts Streaming
KPI abbreviation RAB att Streaming
KPI ID RNC_617a
Description Number of RAB setup attempts requested for streamingcalls.
Measurement M1001: Service Level
KPI formula sum([M1001C68] + [M1001C70])
KPI formula with short names sum([RAB_STP_ATT_CS_STREA] +[RAB_STP_ATT_PS_STREA])
KPI class Usage/Requested Capacity
Unit #
Object Summary Levels Network, City, Area, RNC, Cluster of cells, Cell
Time Summary Levels Total; week; weeklyBH; day; dailyBH; hour
Available Key Performance Indicators per Formula WCDMA RAN Key Performance Indicators
136 DN05191189 Issue: 08

Table 87 RAB Attempts PS Interactive and Background
KPI name RAB Attempts PS Interactive and Background
KPI abbreviation RAB att PS Ia and Bg
KPI ID RNC_616a
Description Number of RAB setup attempts requested for PS Interactiveor Background calls. This counter update is dependingabout profile setting in registry.
Measurement M1001: Service Level
KPI formula sum([M1001C71] + [M1001C72])
KPI formula with short names sum([RAB_STP_ATT_PS_INTER] +[RAB_STP_ATT_PS_BACKG])
KPI class Usage/Requested Capacity
Unit #
Object Summary Levels Network, City, Area, RNC, Cluster of cells, Cell
Time Summary Levels Total; week; weeklyBH; day; dailyBH; hour
Table 88 Multi RAB attempts
KPI name CS Voice + PS Multi RAB attempts
KPI abbreviation CS Voice + PS M-RAB att
KPI ID RNC_740b
Description The number of RAB setup attemps the result of which wouldbe a multi-RAB combination "CS AMR + PS NRT". Updatedwhen CN requests the Multi-RAB combination to be set up.This is the case when a PS/CS RAB already exists and aCS/PS RAB is set up in addition to it (for the same RRCconnection).
Note The current formula lacks all possible Multi-RAB attemptsdue to missing counters.
Measurement M1001: Service Level
KPI formula sum ([M1001C700])
KPI formula with short names sum ([RAB_STP_ATT_AMR_PSNRT])
KPI class Usage/Requested Capacity
Unit #
WCDMA RAN Key Performance Indicators Available Key Performance Indicators per Formula
Issue: 08 DN05191189 137

Table 88 Multi RAB attempts (Cont.)
Typical values See RNC Product Description for Busy Hour Call Attempts(BHCA)
Object Summary Levels Network, City, Area, RNC, Cluster of cells, Cell
Time Summary Levels Total; week; weeklyBH; day; dailyBH; hour
Table 89 Short Message Service Attempts for idle mode UEs
KPI name Short Message Service Attempts for idle mode UEs
KPI abbreviation Inc SMS att
KPI ID RNC_5046a
Description Number of Short Message Service attempts requested forUEs in idle mode.
Measurement M1001: Service Level
KPI formula sum ([M1001C54] + [M1001C56])
KPI formula with short names sum ([MOC_LOW_PRIOR_SIGN_ATTS] +[MTC_LOW_PRIOR_SIGN_ATTS])
KPI class Usage/Requested Capacity
Unit #
Object Summary Levels Network, RNC
Time Summary Levels Total; week; weeklyBH; day; dailyBH; hour
Table 90 Intra RNC Inter frequency HO Success Rate RT
KPI name MTC share of requested SMS
KPI abbreviation MTC share of req SMS
KPI ID RNC_5068a
Description MTC share of requested SMS.
Note SMS is requested by the RRC Setup Cause = Low PrioritySignaling.
Measurement 1001 - Service Level (RNC)
KPI formula 100*sum([M1001C56]) / sum([M1001C56]+[M1001C54])
Available Key Performance Indicators per Formula WCDMA RAN Key Performance Indicators
138 DN05191189 Issue: 08

Table 90 Intra RNC Inter frequency HO Success Rate RT (Cont.)
KPI formula with short names 100*sum([MTC_LOW_PRIOR_SIGN_ATTS]) /sum([MTC_LOW_PRIOR_SIGN_ATTS]+
[MOC_LOW_PRIOR_SIGN_ATTS])
KPI class Usage/Requested Capacity
Unit %
Object Summary Levels Network, City, Area, RNC, Cluster of cells, Cell
Time Summary Levels Total; week; weeklyBH; day; dailyBH; hour
Table 91 NAS BHCA
KPI name NAS BHCA
KPI abbreviation NAS BHCA
KPI ID RNC_5448a
Description Busy Hour Call Allocation attempts for non Radio AccessBearer related RRC Connection Establishment requestcauses.
Measurement 1001: Service Level
KPI formula sum([M1001C42]+ [M1001C44]+ [M1001C46]+[M1001C48]+ [M1001C50]+ [M1001C52]+ [M1001C54]+[M1001C56]+ [M1001C60]+ [M1001C30])
KPI formula with short names sum([INTR_RAT_CELL_RE_SEL_ATTS]+[CELL_CHNG_ORD_ATTS]+ [REGISTRATION_ATTS]+[DETACH_ATTS]+ [MOC_HIGH_PRIOR_SIGN_ATTS]+[MTC_HIGH_PRIOR_SIGN_ATTS]+[MOC_LOW_PRIOR_SIGN_ATTS]+[MTC_LOW_PRIOR_SIGN_ATTS]+[MTC_CAUSE_UNKNOWN_ATTS]+[MOC_SUBSC_TRAF_CALL_ATTS])
KPI class Usage/Requested Capacity
Unit Integer number
Object summary levels Network, City, Area, RNC, Cluster of cells, Cell
Time summary levels Total; week; weeklyBH; day; dailyBH; hour
Table 92 Incoming Location Service Attempts
KPI name Incoming Location Service Attempts
WCDMA RAN Key Performance Indicators Available Key Performance Indicators per Formula
Issue: 08 DN05191189 139

Table 92 Incoming Location Service Attempts (Cont.)
KPI abbreviation Inc LCS att
KPI ID RNC_5047a
Description Number of Location Service attempts requested.
Measurement M1011: Location Services
KPI formula sum ([M1011C0])
KPI formula with short names sum ([NBR_OF_LCS_REQUESTS])
KPI class Usage/Requested Capacity
Unit #
Object Summary Levels Network, RNC
Time Summary Levels Total; week; weeklyBH; day; dailyBH; hour
4.2.3.3 Requested Packet Session Attempt Numbers [Integer Number]
Table 93 Packet Session attempts
KPI name Packet Session attempts
KPI abbreviation Packet Session att
KPI ID RNC_930b
Description Packet Session Setup Attempts over the reporting period.
Note For differences between Packet Service, Packet Sessionand Packet call, see RAN KPI Document.
Measurement M1022: Packet Call
KPI formula sum ( [M1022C3] + [M1022C4] + [M1022C5] + [M1022C6] +[M1022C7] + [M1022C8] + [M1022C181] + [M1022C182] +[M1022C183] )
KPI formula with short names sum ( [PS_ATT_HSDSCH_EDCH_INT] +[PS_ATT_HSDSCH_EDCH_BGR] +[PS_ATT_HSDSCH_DCH_INT] +[PS_ATT_HSDSCH_DCH_BGR] +[PS_ATT_DCH_DCH_INT] + [PS_ATT_DCH_DCH_BGR] +[PS_ATT_HSDSCH_EDCH_STRE] +[PS_ATT_HSDSCH_DCH_STRE] +[PS_ATT_DCH_DCH_STRE] )
KPI class Usage/Requested Capacity
Available Key Performance Indicators per Formula WCDMA RAN Key Performance Indicators
140 DN05191189 Issue: 08

Table 93 Packet Session attempts (Cont.)
Unit #
Typical values See RNC Product Description for Busy Hour Call Attempts(BHCA).
Object Summary Levels Network; City; Area; RNC; WBTS; Cluster of cells; Cell
Time Summary Levels Total; week; weeklyBH; day; dailyBH; hour
Table 94 R99 Packet Session Attempts
KPI name R99 Packet Session Attempts
KPI abbreviation R99 Packet Session Att
KPI ID RNC_1906a
Description This KPIs shows sum of number of DCH/DCH packet callattempts for the interactive, background and streamingtraffic classes.
Measurement M1022: Packet Call
KPI formula [M1022C7] + [M1022C8] + [M1022C183]
KPI formula with short names [PS_ATT_DCH_DCH_INT] + [PS_ATT_DCH_DCH_BGR] +[PS_ATT_DCH_DCH_STRE]
KPI class Usage/Requested Capacity
Unit #
Object Summary Levels Network, City, Area, RNC, Cluster of cells, Cell
Time Summary Levels Total; week; weeklyBH; day; dailyBH; hour
Table 95 HSDPA attempts
KPI name HSDPA attempts
KPI abbreviation HSDPA att
KPI ID RNC_926b
Description HSDPA attempts from user perspective over the reportingperiod.
Measurement M1022: Packet Call
KPI formula sum ( [M1022C3] + [M1022C4] + [M1022C181] +[M1022C5] + [M1022C6] + [M1022C182])
WCDMA RAN Key Performance Indicators Available Key Performance Indicators per Formula
Issue: 08 DN05191189 141

Table 95 HSDPA attempts (Cont.)
KPI formula with short names sum ( [PS_ATT_HSDSCH_EDCH_INT] +[PS_ATT_HSDSCH_EDCH_BGR] +[PS_ATT_HSDSCH_EDCH_STRE] +[PS_ATT_HSDSCH_DCH_INT] +[PS_ATT_HSDSCH_DCH_BGR] +[PS_ATT_HSDSCH_DCH_STRE])
KPI class Usage/Requested Capacity
Unit #
Typical values See RNC Product Description for Busy Hour Call Attempts(BHCA)
Object Summary Levels Network, City, Area, RNC, Cluster of cells, Cell
Time Summary Levels Total; week; weeklyBH; day; dailyBH; hour
Table 96 HSUPA attempts
KPI name HSUPA attempts
KPI abbreviation HSUPA att
KPI ID RNC_928b
Description HSUPA attempts from user perspective over the reportingperiod.
Measurement M1022: Packet Call
KPI formula sum ( [M1022C3] + [M1022C4] + [M1022C181])
KPI formula with short names sum ( [PS_ATT_HSDSCH_EDCH_INT] +[PS_ATT_HSDSCH_EDCH_BGR] +[PS_ATT_HSDSCH_EDCH_STRE])
KPI class Usage/Requested Capacity
Unit #
Object Summary Levels Network; City; Area; RNC; WBTS; Cluster of cells; Cell
Time Summary Levels Total; week; weeklyBH; day; dailyBH; hour
Table 97 HS-FACH session attempts
KPI name HS-FACH session attempts
KPI abbreviation HS FACH sess att
Available Key Performance Indicators per Formula WCDMA RAN Key Performance Indicators
142 DN05191189 Issue: 08

Table 97 HS-FACH session attempts (Cont.)
KPI ID RNC_5456a
Description HS-FACH session attempts.
Note HS-FACH session attempts - only HS-FACH DLconfiguration counter is taken into account in this KPI.
Measurement 1006: RRC signalling
KPI formula sum([M1006C249])
KPI formula with short names sum([RB_CONFIG_HSFACH_DL])
KPI class Usage/Requested Capacity
Unit Integer number
Object summary levels Network, City, Area, RNC, Cluster of cells, Cell
Time summary levels Total; week; weeklyBH; day; dailyBH; hour
4.2.3.4 Requested SRNS Relocation Attempt Numbers [Integer Number]
Table 98 SRNS Relocation UE not involved CS Attempts
KPI name SRNS Relocation UE not involved CS Attempts
KPI abbreviation SRNS Rel UEnot inv CS Att
KPI ID RNC_5072a
Description Relocation preparations with UE not involved for CS domain.
Measurement 1009: L3 Relocation signalling
KPI formula sum ([M1009C2])
KPI formula with short names sum ([SRNS_RELOC_OUT_REQ_CONTR_MSC])
KPI class Usage/Requested Capacity
Unit Integer number
Object summary levels Network; City; Area; RNC
Time summary levels Total; week; weeklyBH; day; dailyBH; hour
Table 99 SRNS Relocation UE not involved PS Attempts
KPI name SRNS Relocation UE not involved PS Attempts
WCDMA RAN Key Performance Indicators Available Key Performance Indicators per Formula
Issue: 08 DN05191189 143

Table 99 SRNS Relocation UE not involved PS Attempts (Cont.)
KPI abbreviation SRNS Rel UEnot inv PS Att
KPI ID RNC_5074a
Description Relocation preparations with UE not involved for PS domain.
Measurement 1009: L3 Relocation signalling
KPI formula sum ([M1009C3])
KPI formula with short names sum ([SRNS_REL_OUT_REQ_CONTR_SGSN])
KPI class Usage/Requested Capacity
Unit Integer number
Object summary levels Network; City; Area; RNC
Time summary levels Total; week; weeklyBH; day; dailyBH; hour
Table 100 Incoming Inter System HHO Attempts (CS)
KPI name Incoming Inter System HHO Attempts (CS)
KPI abbreviation Inc Inter Sys HHO Att CS
KPI ID RNC_5078a
Description The number of incoming inter-system hard handoverattempts for CS domain. This includes both GSM->WCDMA,GAN->WCDMA and LTE->WCDMA cases.
Note This KPI include CS only. PS is handled via CellReselection.
Measurement 1001: Service Level
KPI formula sum ([M1001C219])
KPI formula with short names sum ([INTER_SYS_HHO_ATTS])
KPI class Usage/Requested Capacity
Unit Integer number
Object Summary Levels Network; City; Area; RNC; WBTS; Cluster of cells; Cell
Time Summary Levels Total; week; weeklyBH; day; dailyBH; hour
Available Key Performance Indicators per Formula WCDMA RAN Key Performance Indicators
144 DN05191189 Issue: 08

Table 101 Incoming Inter System Change Attempts (PS)
KPI name Incoming Inter System Change Attempts (PS)
KPI abbreviation Inc Inter Sys HHO Att PS
KPI ID RNC_5079a
Description The number of incoming inter-system change attempts forthe PS domain.
Note PS is handled by cell reselection, which from the RNC pointof view is a new connection established via RRCCONNECTION REQUEST with establishment cause "Inter-RAT cell change order.
Measurement 1001 - Service Level (RNC)
KPI formula sum ([M1001C44])
KPI formula with short names sum ([INTR_RAT_CELL_CHNG_ORD ATTEMPTS])
KPI class Usage/Requested Capacity
Unit Integer number
Object Summary Levels Network; City; Area; RNC; WBTS; Cluster of cells; Cell
Time Summary Levels Total; week; weeklyBH; day; dailyBH; hour
Table 102 Incoming LTE PS ISHO preparation requests
KPI name Incoming LTE PS ISHO preparation requests
KPI abbreviation Inc LTE PS ISHO prep req
KPI ID RNC_5475a
Description Incoming LTE PS ISHO preparation requests
Measurement 1009: L3 Relocation signalling
KPI formula sum([M1009C276])
KPI formula with short names sum([LTE_PS_IN_PREP_REQ])
KPI class Usage/Requested Capacity
Unit Integer number
Object summary levels Network, RNC
Time summary levels Total; week; weeklyBH; day; dailyBH; hour
WCDMA RAN Key Performance Indicators Available Key Performance Indicators per Formula
Issue: 08 DN05191189 145

4.2.3.5 Requested Handover Attempt Numbers [Integer Number]
Table 103 Soft HO Update Attempts, RT
KPI name Soft HO Update Attempts, RT
KPI abbreviation Soft HO Update att RT
KPI ID RNC_193b
Description Number of active set updates, RT.
Note SHO attempt includes cases when UE has also anyadditional NRT service.
Measurement M1007: Soft Handover
KPI formula sum ([M1007C10] + [M1007C11] + [M1007C12])
KPI formula with short names sum ([CELL_ADD_REQ_ON_SHO_FOR_RT] +[CELL_DEL_REQ_ON_SHO_FOR_RT] +[CELL_REPL_REQ_ON_SHO_FOR_RT])
KPI class Usage/Requested Capacity
Unit #
Typical values See RNC Product Description for assumed SHO Proportionsin relation to established calls.
Object Summary Levels Network, City, Area, RNC, Cluster of cells, Cell
Time Summary Levels Total; week; weeklyBH; day; dailyBH; hour
Table 104 Soft HO Update Attempts, NRT
KPI name Soft HO Update Attempts, NRT
KPI abbreviation Soft HO Update att NRT
KPI ID RNC_194b
Description Number of active set updates, NRT.
Note SHO attempt excludes cases when UE has also any RTservice.
Measurement M1007: Soft Handover
KPI formula sum ([M1007C27] + [M1007C28] + [M1007C29] )
KPI formula with short names sum ([CELL_ADD_REQ_ON_SHO_FOR_NRT] +[CELL_DEL_REQ_ON_SHO_FOR_NRT] +[CELL_REPL_REQ_ON_SHO_FOR_NRT] )
Available Key Performance Indicators per Formula WCDMA RAN Key Performance Indicators
146 DN05191189 Issue: 08

Table 104 Soft HO Update Attempts, NRT (Cont.)
KPI class Usage/Requested Capacity
Unit #
Object Summary Levels Network, City, Area, RNC, Cluster of cells, Cell
Time Summary Levels Total; week; weeklyBH; day; dailyBH; hour
Table 105 Intra System Hard Handover Attempts
KPI name Intra System Hard Handover Attempts
KPI abbreviation Intra System HHO Att
KPI ID RNC_743a
Description Number of Inter RNC Intra Frequency Hard Handoverattempts and all Intra RNC/Inter RNC Inter Frequency HardHandover Attempts.
Note Inter RNC Intra Frequency HHO can occur when Inter RNCSHO is not possible due to parameter settings or Iurunavailability.
Measurement M1008: Intra System Handover
KPI formula sum([M1008C4] + [M1008C5] + [M1008C13] + [M1008C14]+ [M1008C54] + [M1008C58] + [M1008C62] + [M1008C102]+ [M1008C106] + [M1008C110])
KPI formula with short names sum([HHO_ATT_CAUSED_SHO_INCAP_RT] +[IMMED_HHO_CSD_SHO_INCAP_RT] +[HHO_ATT_CAUSED_SHO_INCAP_NRT] +[IMMED_HHO_CSD_SHO_INCAP_NRT] +[INTRA_INTRA_HHO_ATT_RT] +[INTRA_INTER_HHO_ATT_RT] + [INTER_HHO_ATT_RT] +[INTRA_INTRA_HHO_ATT_NRT] +[INTRA_INTER_HHO_ATT_NRT] +[INTER_HHO_ATT_NRT])
KPI class Usage/Requested Capacity
Unit #
Typical values See RNC Product Description for assumed HHOProportions in relation to established calls.
Object Summary Levels Network, City, Area, RNC, Cluster of cells, Cell
Time Summary Levels Total; week; weeklyBH; day; dailyBH; hour
WCDMA RAN Key Performance Indicators Available Key Performance Indicators per Formula
Issue: 08 DN05191189 147

Table 106 Intra RNC HHO Attempts for CS
KPI name Intra RNC Inter frequency HO Attempts R
KPI abbreviation Intra RNC HHO Att CS
KPI ID RNC_5066a
Description Intra RNC Inter frequency HO Attempts RT. Includnig bothintra and inter BTS HOs.
Measurement M1008 - Intra System Hard Handover (RNC)
KPI formula sum ([M1008C54] + [M1008C58])
KPI formula with short names sum ([INTRA_INTRA_HHO_ATT_RT] +[INTRA_INTER_HHO_ATT_RT])
KPI class Usage/Requested Capacity
Unit Integer number
Object Summary Levels Network, City, Area, RNC, Cluster of cells, Cell
Time Summary Levels Total; week; weeklyBH; day; dailyBH; hour
Table 107 HSDPA Serving Cell Change Attempts
KPI name HSDPA Serving Cell Change Attempts
KPI abbreviation HSDPA SCC att
KPI ID RNC_927a
Description HSDPA Serving Cell Change Attempts over the reportingperiod in the Source Cell.
Measurement M1008: Intra System Handover
KPI formula sum ( [M1008C213] + [M1008C214] + [M1008C215] +[M1008C216] )
KPI formula with short names sum ( [SCC_STARTED_CPICH_ECNO] +[SCC_STARTED_UL_SIR_ERROR] +[SCC_STARTED_ACTIVE_SET_UPD] +[SCC_STARTED_OTHER_REASON] )
KPI class Usage/Requested Capacity
Unit #
Object Summary Levels Network; City; Area; RNC; WBTS; Cluster of cells; Cell
Available Key Performance Indicators per Formula WCDMA RAN Key Performance Indicators
148 DN05191189 Issue: 08

Table 107 HSDPA Serving Cell Change Attempts (Cont.)
Time Summary Levels Total; week; weeklyBH; day; dailyBH; hour
Table 108 HSUPA Serving Cell Change Attempts
KPI name HSUPA Serving Cell Change Attempts
KPI abbreviation HSUPA SCC att
KPI ID RNC_929a
Description HSUPA Serving Cell Change Attempts over the reportingperiod in the Source Cell.
Note E-DCH Serving cell change can only occur when a HS-DSCH Serving Cell change is executed.
Measurement M1008: Intra System Handover
KPI formula sum([M1008C239])
KPI formula with short names sum([EDCH_SCC_STARTED])
KPI class Usage/Requested Capacity
Unit #
Object Summary Levels Network; City; Area; RNC; WBTS; Cluster of cells; Cell
Time Summary Levels Total; week; weeklyBH; day; dailyBH; hour
Table 109 Intra RNC Inter frequency HO Attempts NRT
KPI name Intra RNC Inter frequency HO Attempts NRT
KPI abbreviation IntrRNC InteFr HO Att NRT
KPI ID RNC_5070a
Description Intra RNC Inter frequency HO Attempts NRT. Including bothintra and inter BTS HOs.
Measurement 1008 - Intra System Hard Handover (RNC)
KPI formula sum ([M1008C102] + [M1008C106])
KPI formula with short names sum ([INTRA RNC INTRA BTS INTER FREQ HOATTEMPTS FOR NRT] + [INTRA RNC INTER BTS INTERFREQ HO ATTEMPTS FOR NRT])
KPI class Usage/Requested Capacity
WCDMA RAN Key Performance Indicators Available Key Performance Indicators per Formula
Issue: 08 DN05191189 149

Table 109 Intra RNC Inter frequency HO Attempts NRT (Cont.)
Unit Integer number
Object Summary Levels Network; City; Area; RNC; WBTS; Cluster of cells; Cell
Time Summary Levels Total; week; weeklyBH; day; dailyBH; hour
4.2.3.6 Requested state transition numbers
Table 110 Number of state transitions
KPI name Number of state transitions
KPI abbreviation Nr state trans attempts
KPI ID RNC_5446a
Description The sum of all state transitions excluding when coming fromidle to CELL-DCH or when going to idle from any state.
Measurement 1006: RRC signalling
KPI formula sum([M1006C171]+ [M1006C173]+ [M1006C175]+[M1006C177]+ [M1006C179]+ [M1006C181])
KPI formula with short names sum([DENOM_ST_TRANS_TIME_PCH_FACH]+[DENOM_ST_TRANS_TIME_FACH_DCH]+[DENOM_ST_TRANS_TIME_PCH_DCH]+[DENOM_ST_TRANS_TIME_DCH_FACH]+[DENOM_ST_TRANS_TIME_DCH_PCH]+[DENOM_ST_TRANS_TIME_FACH_PCH])
KPI class Usage/Requested Capacity
Unit Integer number
Object summary levels Network, City, Area, RNC, Cluster of cells, Cell
Time summary levels Total; week; weeklyBH; day; dailyBH; hour
4.2.3.7 Capacity restrictions
Table 111 Mass event handler duration
KPI name Mass event handler duration
KPI abbreviation MEH duration
KPI ID RNC_5461a
Description This KPI shows how long the Mass event handler wasactive.
Available Key Performance Indicators per Formula WCDMA RAN Key Performance Indicators
150 DN05191189 Issue: 08
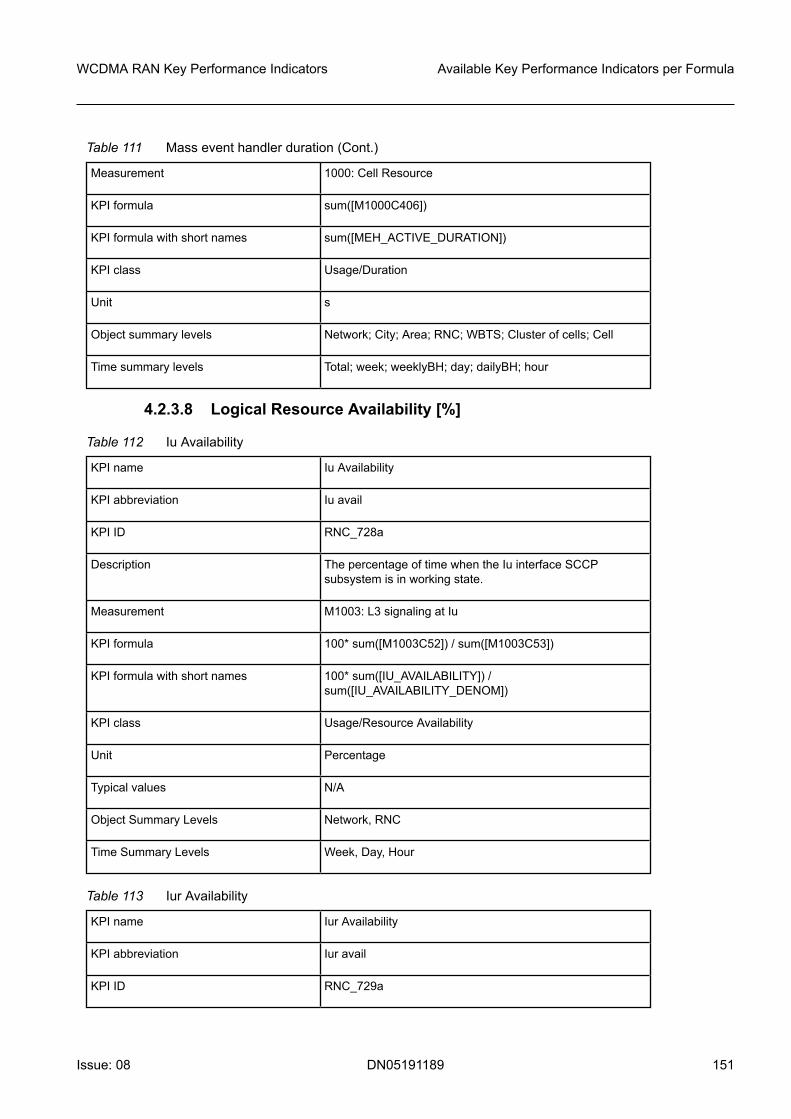
Table 111 Mass event handler duration (Cont.)
Measurement 1000: Cell Resource
KPI formula sum([M1000C406])
KPI formula with short names sum([MEH_ACTIVE_DURATION])
KPI class Usage/Duration
Unit s
Object summary levels Network; City; Area; RNC; WBTS; Cluster of cells; Cell
Time summary levels Total; week; weeklyBH; day; dailyBH; hour
4.2.3.8 Logical Resource Availability [%]
Table 112 Iu Availability
KPI name Iu Availability
KPI abbreviation Iu avail
KPI ID RNC_728a
Description The percentage of time when the Iu interface SCCPsubsystem is in working state.
Measurement M1003: L3 signaling at Iu
KPI formula 100* sum([M1003C52]) / sum([M1003C53])
KPI formula with short names 100* sum([IU_AVAILABILITY]) /sum([IU_AVAILABILITY_DENOM])
KPI class Usage/Resource Availability
Unit Percentage
Typical values N/A
Object Summary Levels Network, RNC
Time Summary Levels Week, Day, Hour
Table 113 Iur Availability
KPI name Iur Availability
KPI abbreviation Iur avail
KPI ID RNC_729a
WCDMA RAN Key Performance Indicators Available Key Performance Indicators per Formula
Issue: 08 DN05191189 151

Table 113 Iur Availability (Cont.)
Description The percentage of time when the Iur interface SCCPsubsystem is in working state.
Measurement M1004: L3 signaling at Iur
KPI formula 100* sum([M1004C143]) / sum([M1004C144])
KPI formula with short names 100* sum([IUR_AVAILABILITY]) /sum([IUR_AVAILABILITY_DENOM])
KPI class Usage/Resource Availability
Unit Percentage
Typical values N/A
Object Summary Levels Network, RNC
Time Summary Levels Week, Day, Hour
4.2.3.9 User Resource Reservation Numbers [Integer Number]
Table 114 Peak number of HSPA users in RNC
KPI name Peak number of HSPA users in RNC
KPI abbreviation Peak nr HSPA usr in RNC
KPI ID RNC_5486a
Description Peak Number of simultaneous HSPA connections in oneRNC over the reporting period.
KPI uses the peak number of HSPA connection per RNCand then calculates the sum of this number from all theRNCs in the selected objects (object PLMN for example).
Note HSPA connections mean HS-DSCH/DCH and HS-DSCH/EDCH allocations. Several SHO branches are notcounted separately.
Measurement 609: DSP Service Statistics
KPI formula sum([M609C1](ServType = ALLHSPA))
KPI formula with short names sum([DSP_SERVICE_PEAK_RES_ALLOC](ServType =ALLHSPA))
Formula note Note 1: Formula comprises only records whereSERV_TYPE_ID="ALLHSPA".
KPI class Usage/Allocated Capacity
Available Key Performance Indicators per Formula WCDMA RAN Key Performance Indicators
152 DN05191189 Issue: 08

Table 114 Peak number of HSPA users in RNC (Cont.)
Unit Integer number
Object summary levels Network, RNC
Time summary levels Total; week; weeklyBH; day; dailyBH; hour
Table 115 Peak number of HSDPA users in RNC
KPI name Peak number of HSDPA users in RNC
KPI abbreviation Peak nr HSDPA usr in RNC
KPI ID RNC_5017a
Description Peak Number of simultaneous HSDPA connections in oneRNC over the reporting period.
Note HSUPA call does not update counters for this object even ifit uses HSDPA in downlink. As RNC capacity is common forHSPA users and the defined KPIs are separately for HSDPAand HSUPA users (RNC_5018a) a checking of both HSPAuser KPIs is needed in order to evaluate RNC HSPAcapacity.
Measurement M609: DSP Service Statistics
KPI formula max([M609C1](ServType = ALLHSDPA))
KPI formula with short names max([DSP_SERVICE_PEAK_RES_ALLOC](ServType =ALLHSDPA))
Formula note Formula comprises only records whereSERV_TYPE_ID="ALLHSDPA".
KPI class Usage/Allocated Capacity
Unit #
Typical values See Targets for WCDMA RAN key performance indicators
Object Summary Levels Network, RNC
Object Summary Level notes The related measurement is not HSDPA resource specific, itmeasures all DSP resources. Therefore the used countermeasures all possible DSP services and the measurementobject - ALLHSDPA - is utilized for counter data separation.
Time Summary Levels Week, Day, Hour
Table 116 Peak number of HSUPA users in RNC
KPI name Peak number of HSUPA users in RNC
WCDMA RAN Key Performance Indicators Available Key Performance Indicators per Formula
Issue: 08 DN05191189 153

Table 116 Peak number of HSUPA users in RNC (Cont.)
KPI abbreviation Peak nr HSUPA usr in RNC
KPI ID RNC_5018a
Description Peak Number of simultaneous HSUPA connections in oneRNC over the reporting period.
Note As RNC capacity is common for HSPA users and thedefined KPIs are separately for HSDPA and HSUPA users(RNC_5017a) a checking of both HSPA user KPIs is neededin order to evaluate RNC HSPA capacity.
Measurement M609: DSP Service Statistics
KPI formula max([M609C1](ServType = ALLHSUPA))
KPI formula with short names max([DSP_SERVICE_PEAK_RES_ALLOC](ServType =ALLHSUPA))
Formula note Formula comprises only records whereSERV_TYPE_ID="ALLHSUPA".
KPI class Usage/Allocated Capacity
Unit #
Typical values See Targets for WCDMA RAN key performance indicators
Object Summary Levels Network, RNC
Object Summary Level notes The related measurement is not HSUPA resource specific, itmeasures all DSP resources. Therefore the used countermeasures all possible DSP services and the measurementobject - ALLHSUPA - is utilised for counter data separation.
Time Summary Levels Week, Day, Hour
Table 117 Peak number of RRC Connected Mode Users in RNC
KPI name Peak RRC connected mode users per RNC
KPI abbreviation Peak RRC Users RNC
KPI ID RNC_2173a
Description The sum of peak RRC connected mode users divided by thenumber of active RNCs
Measurement 802: RNC Capacity Usage
KPI formula sum([M802C18]) / COUNT(DISTINCT RNC_ID)
Available Key Performance Indicators per Formula WCDMA RAN Key Performance Indicators
154 DN05191189 Issue: 08

Table 117 Peak number of RRC Connected Mode Users in RNC (Cont.)
KPI formula with short names sum([MAX_RRC_CONN_MODE_USERS]) /COUNT(DISTINCT RNC_ID)
KPI class Usage/Allocated Capacity
Unit Integer number
Object summary levels Network, RNC
Time summary levels Total; week; weeklyBH; day; dailyBH; hour
Table 118 Maximum number of Voice calls per RNC
KPI name Maximum number of Voice calls per RNC
KPI abbreviation Max nr Voice calls perRNC
KPI ID RNC_5016a
Description Peak Number of simultaneous AMR calls in one RNC overthe reporting period.
Note Corresponding IHSPA KPI is IHSPA_5444a
Measurement 802: RNC Capacity Usage
KPI formula max([M802C1])
KPI formula with short names max([AMR_MAX])
KPI class Usage/Allocated Capacity
Unit #
Target values See Targets for WCDMA RAN key performance indicators.
Object summary levels Network, RNC
Time summary levels Week, Day, Hour
Table 119 Average number of active PS users
KPI name Average number of active PS users
KPI abbreviation Avg Nbr PS act
KPI ID RNC_5227a
WCDMA RAN Key Performance Indicators Available Key Performance Indicators per Formula
Issue: 08 DN05191189 155

Table 119 Average number of active PS users (Cont.)
Description Average number of PS UEs in CELL-DCH state. Thenumber is based on average counter values collected in ashort i.e. 15 minutes period. Here it is assumed that in ashort period peak vs. average values does not differ much.
Note An active PS User is here based on the total number ofCELL-DCH users from which - it is subtracted all CS users. -a subtracted CS users includes also PS users as part ofCS+PS multi RAB. => the end result here will be all singleactive PS RAB users + standalone SRBs
Measurement 802: RNC Capacity Usage
KPI formula sum ([M802C19] -[M802C0])
KPI formula with short names sum ([AVE_USERS_CELL_DCH] -[AMR_AVERAGE])
KPI class Usage/Allocated Capacity
Unit Integer number
Object summary levels Network, RNC
Time summary levels 15 Minutes
Table 120 Maximum number of users in HS-FACH state
KPI name Maximum number of users in HS-FACH state
KPI abbreviation Max usrs HS-FACH
KPI ID RNC_5372a
Description Maximum number of simultaneous users in EnhancedCELL_FACH state. This KPI is only for CELL level. Theoutcome is the value of the most loaded cell.
Measurement 5000: HSPA in WBTS
KPI formula MAX([M5000C422])
KPI formula with short names MAX([MAX_EFACH_USERS])
KPI class Usage/Users
Unit Integer number
Object summary levels Network; City; Area; RNC; WBTS; Cluster of cells; Cell
Time summary levels Total; week; weeklyBH; day; dailyBH; hour
Available Key Performance Indicators per Formula WCDMA RAN Key Performance Indicators
156 DN05191189 Issue: 08

4.2.3.10 Allocated Capacity [Mbit/s]
CS voice call
Table 121 Average Allocated Uplink Dedicated Channel Capacity for CS Voice inControlling RNC
KPI name Average Allocated Uplink Dedicated Channel Capacity forCS Voice in Controlling RNC
KPI abbreviation Alloc UL DCH cap CS Voice
KPI ID RNC_162c
Description Allocated Uplink Dedicated Channel Capacity [Mbit/s] for CSVoice in Controlling RNC for the reporting period. Thesethroughput calculations are based on resource allocationcounters and do not show as such the actual throughput butallocated capacity.
Note The counters in the formula include soft handoveroverheads.
Measurement M1002: Traffic
KPI formula sum((4.75*[M1002C34]) + (4.75*[M1002C270])+(5.15*[M1002C35]) + (5.15*[M1002C271])+(5.9*[M1002C36]) + (5.9*[M1002C272]) + (6.7*[M1002C37])+ (6.7*[M1002C273]) + (7.4*[M1002C38]) +(7.4*[M1002C274]) + (7.95*[M1002C39]) +(7.95*[M1002C275]) + (10.2*[M1002C40]) +(10.2*[M1002C276]) + (12.2 * [M1002C41]) +(12.2*[M1002C277]) + (12.65 * [M1002C494]) + (12.65*[M1002C489]) + (6.6 * [M1002C496]) + (6.6 *[M1002C490])+ (8.85 *[M1002C495])) /sum(PERIOD_DURATION)*60*100000
KPI formula with short names sum((4.75*[DUR_FOR_AMR_4_75_UL_IN_SRNC]) +(4.75*[DURA_FOR_AMR_4_75_UL_IN_DRNC])+(5.15*[DUR_FOR_AMR_5_15_UL_IN_SRNC]) +(5.15*[DURA_FOR_AMR_5_15_UL_IN_DRNC])+(5.9*[DUR_FOR_AMR_5_9_UL_IN_SRNC]) +(5.9*[DURA_FOR_AMR_5_9_UL_IN_DRNC]) +(6.7*[DUR_FOR_AMR_6_7_UL_IN_SRNC]) +(6.7*[DURA_FOR_AMR_6_7_UL_IN_DRNC]) +(7.4*[DUR_FOR_AMR_7_4_UL_IN_SRNC]) +(7.4*[DURA_FOR_AMR_7_4_UL_IN_DRNC]) +(7.95*[DUR_FOR_AMR_7_95_UL_IN_SRNC]) +(7.95*[DURA_FOR_AMR_7_95_UL_IN_DRNC]) +(10.2*[DUR_FOR_AMR_10_2_UL_IN_SRNC]) +(10.2*[DURA_FOR_AMR_10_2_UL_IN_DRNC]) + (12.2 *[DUR_FOR_AMR_12_2_UL_IN_SRNC]) +(12.2*[DURA_FOR_AMR_12_2_UL_IN_DRNC]) + (12.65 *[DURA_FOR_WAMR_12_65_DRNC]) + (12.65*[DURA_FOR_WAMR_12_65_SRNC]) + (6.6 *[DURA_FOR_WAMR_6_6_DRNC]) + (6.6
WCDMA RAN Key Performance Indicators Available Key Performance Indicators per Formula
Issue: 08 DN05191189 157

Table 121 Average Allocated Uplink Dedicated Channel Capacity for CS Voice inControlling RNC (Cont.)
*[DURA_FOR_WAMR_6_6_SRNC]) + (8.85*[DURA_FOR_WAMR_8_85_DRNC])) /sum(PERIOD_DURATION)*60*100000
KPI class Usage/Allocated Capacity
Unit Mbps
Typical values Depends on Traffic and DCH capacity.
Object Summary Levels Network, City, Area, RNC, Cluster of cells, Cell
Time Summary Levels Week, Day, Hour
R99 data calls
Table 122 Average Allocated Uplink Dedicated Channel Capacity for Data Calls inControlling RNC
KPI name Average Allocated Uplink Dedicated Channel Capacity forData Calls in Controlling RNC
KPI abbreviation Allo UL dch cap Data Call
KPI ID RNC_164f
Description Allocated Uplink Dedicated Channel Capacity [Mbit/s] forData Calls in Controlling RNC over the reporting period.These throughput calculations are based on resourceallocation counters and do not show as such the actualthroughput but allocated capacity.
Note The counters in the formula include soft handoveroverheads.
Measurement M1002: Traffic
KPI formula sum((64*[M1002C177]) + (64*[M1002C69]) +(14.4*[M1002C76]) + (57.6*[M1002C78]) +(8*[M1002C190])+ (16*[M1002C191])+ (32*[M1002C192])+(64*[M1002C193])+ (128*[M1002C194])+ (8*[M1002C206])+ (8*[M1002C222]) + (16*[M1002C207]) +(16*[M1002C223]) + (32*[M1002C208]) + (32*[M1002C224])+ (64*[M1002C209]) + (64*[M1002C225]) +(128*[M1002C210]) + (128*[M1002C226]) +(256*[M1002C211]) + (256 *[M1002C227]) +(384*[M1002C213]) + (384*[M1002C229]) +(8*[M1002C315]) + (14.4*[M1002C316])+ (16*[M1002C317])+ (32*[M1002C319]) + (57.6*[M1002C321]) +(64*[M1002C322]) + (128*[M1002C323]) +(256*[M1002C324]) (384*[M1002C326])) /sum(PERIOD_DURATION)*60*100000
Available Key Performance Indicators per Formula WCDMA RAN Key Performance Indicators
158 DN05191189 Issue: 08

Table 122 Average Allocated Uplink Dedicated Channel Capacity for Data Calls inControlling RNC (Cont.)
KPI formula with short names sum((64*[DUR_PS_CONV_64_UL_IN_SRNC]) +(64*[ALLO_DUR_CS_CONV_64_IN_SRNC]) +(14.4*[ALLO_DUR_NTRANS_STRM_14_4_UL]) +(57.6*[ALLO_DUR_NTRANS_STRM_56_7_UL]) +(8*[DUR_PS_STREAM_8_UL_IN_SRNC])+(16*[DUR_PS_STREAM_16_UL_IN_SRNC])+(32*[DUR_PS_STREAM_32_UL_IN_SRNC])+(64*[DUR_PS_STREAM_64_UL_IN_SRNC])+(128*[DUR_PS_STREAM_128_UL_IN_SRNC])+(8*[DUR_PS_INTERA_8_UL_IN_SRNC]) +(8*[DUR_PS_BACKG_8_UL_IN_SRNC]) +(16*[DUR_PS_INTERA_16_UL_IN_SRNC]) +(16*[DUR_PS_BACKG_16_UL_IN_SRNC]) +(32*[DUR_PS_INTERA_32_UL_IN_SRNC]) +(32*[DUR_PS_BACKG_32_UL_IN_SRNC]) +(64*[DUR_PS_INTERA_64_UL_IN_SRNC]) +(64*[DUR_PS_BACKG_64_UL_IN_SRNC]) +(128*[DUR_PS_INTERA_128_UL_IN_SRNC]) +(128*[DUR_PS_BACKG_128_UL_IN_SRNC]) +(256*[DUR_PS_INTERA_256_UL_IN_SRNC]) + (256*[DUR_PS_BACKG_256_UL_IN_SRNC]) +(384*[DUR_PS_INTERA_384_UL_IN_SRNC]) +(384*[DUR_PS_BACKG_384_UL_IN_SRNC]) +(8*[DURA_FOR_DATA_8_UL_IN_DRNC]) +(14.4*[DURA_FOR_DATA_14_4_UL_DRNC])+(16*[DURA_FOR_DATA_16_UL_IN_DRNC]) +(32*[DURA_FOR_DATA_32_UL_IN_DRNC]) +(57.6*[DURA_FOR_DATA_57_6_UL_DRNC]) +(64*[DURA_FOR_DATA_64_UL_IN_DRNC]) +(128*[DURA_FOR_DATA_128_UL_IN_DRNC]) +(256*[DURA_FOR_DATA_256_UL_IN_DRNC])(384*[DURA_FOR_DATA_384_UL_IN_DRNC])) /sum(PERIOD_DURATION)*60*100000
KPI class Usage/Allocated Capacity
Unit Mbps
Typical values See RNC Product Description for maximum supportedthroughput
Object Summary Levels Network, City, Area, RNC, Cluster of cells, Cell
Time Summary Levels Week, Day, Hour
CS voice call
Table 123 Average Allocated Downlink Dedicated Channel Capacity for CS Voice inControlling RNC
KPI name Average Allocated Downlink Dedicated Channel Capacity forCS Voice in Controlling RNC
WCDMA RAN Key Performance Indicators Available Key Performance Indicators per Formula
Issue: 08 DN05191189 159

Table 123 Average Allocated Downlink Dedicated Channel Capacity for CS Voice inControlling RNC (Cont.)
KPI abbreviation Allo DL dch cap CS V CRNC
KPI ID RNC_163c
Description Allocated Downlink Dedicated Channel Capacity [Mbit/s] forCS Voice in Controlling RNC for the reporting period. Thesethroughput calculations are based on resource allocationcounters and do not show as such the actual throughput butallocated capacity.
Note The counters in the formula include soft handoveroverheads.
Measurement M1002: Traffic
KPI formula sum((4.75*[M1002C42]) + (4.75*[M1002C278]) +(5.15*[M1002C43]) + (5.15*[M1002C279]) +(5.9*[M1002C44]) + (5.9*[M1002C280]) + (6.7*[M1002C45])+ (6.7*[M1002C281]) + (7.4*[M1002C46]) +(7.4*[M1002C282]) + (7.95*[M1002C47]) +(7.95*[M1002C283]) + (10.2*[M1002C48]) +(10.2*[M1002C284]) + (12.2*[M1002C49]) +(12.2*[M1002C285]) + (12.65 * [M1002C494]) + (12.65*[M1002C489]) + (6.6 * [M1002C496])+ (6.6 *[M1002C490])+ (8.85 *[M1002C495])) /sum(PERIOD_DURATION)*60*100000
KPI formula with short names sum((4.75*[DUR_FOR_AMR_4_75_DL_IN_SRNC]) +(4.75*[DURA_FOR_AMR_4_75_DL_IN_DRNC]) +(5.15*[DUR_FOR_AMR_5_15_DL_IN_SRNC]) +(5.15*[DURA_FOR_AMR_5_15_DL_IN_DRNC]) +(5.9*[DUR_FOR_AMR_5_9_DL_IN_SRNC]) +(5.9*[DURA_FOR_AMR_5_9_DL_IN_DRNC]) +(6.7*[DUR_FOR_AMR_6_7_DL_IN_SRNC]) +(6.7*[DURA_FOR_AMR_6_7_DL_IN_DRNC]) +(7.4*[DUR_FOR_AMR_7_4_DL_IN_SRNC]) +(7.4*[DURA_FOR_AMR_7_4_DL_IN_DRNC]) +(7.95*[DUR_FOR_AMR_7_95_DL_IN_SRNC]) +(7.95*[DURA_FOR_AMR_7_95_DL_IN_DRNC]) +(10.2*[DUR_FOR_AMR_10_2_DL_IN_SRNC]) +(10.2*[DURA_FOR_AMR_10_2_DL_IN_DRNC]) +(12.2*[DUR_FOR_AMR_12_2_DL_IN_SRNC]) +(12.2*[DURA_FOR_AMR_12_2_DL_IN_DRNC]) + (12.65 *[DURA_FOR_WAMR_12_65_DRNC]) + (12.65*[DURA_FOR_WAMR_12_65_SRNC]) + (6.6 *[DURA_FOR_WAMR_6_6_DRNC])+ (6.6*[DURA_FOR_WAMR_6_6_SRNC]) + (8.85*[DURA_FOR_WAMR_8_85_DRNC])) /sum(PERIOD_DURATION)*60*100000
KPI class Usage/Allocated Capacity
Unit Mbps
Available Key Performance Indicators per Formula WCDMA RAN Key Performance Indicators
160 DN05191189 Issue: 08

Table 123 Average Allocated Downlink Dedicated Channel Capacity for CS Voice inControlling RNC (Cont.)
Typical values Depends on Traffic and DCH capacity.
Object Summary Levels Network, City, Area, RNC, Cluster of cells, Cell
Time Summary Levels Week, Day, Hour
R99 data calls
Table 124 Average Allocated Downlink Dedicated Channel Capacity for Data Calls inControlling RNC
KPI name Average Allocated Downlink Dedicated Channel Capacity forData Calls in Controlling RNC
KPI abbreviation Allo DL dch cap DCal CRNC
KPI ID RNC_165g
Description Allocated Downlink Dedicated Channel Capacity [Mbit/s] forData Calls in Controlling RNC over the reporting period.These throughput calculations are based on resourceallocation counters and as such are not showing actualthroughput but allocated capacity.
Note The counters in the formula include soft handoveroverheads.
Measurement M1002: Traffic
KPI formula sum((64*[M1002C69]) + (14.4*[M1002C79]) +(57.6*[M1002C81]) + (8*[M1002C198]) + (16*[M1002C199])+ (32*[M1002C200]) + (64*[M1002C201]) +(128*[M1002C202]) + (256*[M1002C203]) +(384*[M1002C205]) + (8*[M1002C214]) + (8*[M1002C230])+ (16*[M1002C215]) + (16*[M1002C231]) +(32*[M1002C216]) + (32*[M1002C232]) + (64*[M1002C217])+ (64*[M1002C233]) + (128*[M1002C218]) +(128*[M1002C234]) + (256*[M1002C219]) +(256*[M1002C235]) + (384*[M1002C221]) +(384*[M1002C237]) + (8*[M1002C327]) +(14.4*[M1002C328]) + (16*[M1002C329]) +(32*[M1002C331]) + (57.6 *[M1002C333]) +(64*[M1002C334]) + (128*[M1002C335]) +(256*[M1002C336]) + (384*[M1002C338])) /sum(PERIOD_DURATION)*60*100000
KPI formula with short names sum((64*[ALLO_DUR_CS_CONV_64_IN_SRNC]) +(14.4*[ALLO_DUR_NTRANS_STRM_14_4_DL]) +(57.6*[ALLO_DUR_NTRANS_STRM_56_7_DL]) +(8*[DUR_PS_STREAM_8_DL_IN_SRNC]) +(16*[DUR_PS_STREAM_16_DL_IN_SRNC]) +(32*[DUR_PS_STREAM_32_DL_IN_SRNC]) +(64*[DUR_PS_STREAM_64_DL_IN_SRNC]) +
WCDMA RAN Key Performance Indicators Available Key Performance Indicators per Formula
Issue: 08 DN05191189 161

Table 124 Average Allocated Downlink Dedicated Channel Capacity for Data Calls inControlling RNC (Cont.)
(128*[DUR_PS_STREAM_128_DL_IN_SRNC]) +(256*[DUR_PS_STREAM_256_DL_IN_SRNC]) +(384*[DUR_PS_STREAM_384_DL_IN_SRNC]) +(8*[DUR_PS_INTERA_8_DL_IN_SRNC]) +(8*[DUR_PS_BACKG_8_DL_IN_SRNC]) +(16*[DUR_PS_INTERA_16_DL_IN_SRNC]) +(16*[DUR_PS_BACKG_16_DL_IN_SRNC]) +(32*[DUR_PS_INTERA_32_DL_IN_SRNC]) +(32*[DUR_PS_BACKG_32_DL_IN_SRNC]) +(64*[DUR_PS_INTERA_64_DL_IN_SRNC]) +(64*[DUR_PS_BACKG_64_DL_IN_SRNC]) +(128*[DUR_PS_INTERA_128_DL_IN_SRNC]) +(128*[DUR_PS_BACKG_128_DL_IN_SRNC]) +(256*[DUR_PS_INTERA_256_DL_IN_SRNC]) +(256*[DUR_PS_BACKG_256_DL_IN_SRNC]) +(384*[DUR_PS_INTERA_384_DL_IN_SRNC]) +(384*[DUR_PS_BACKG_384_DL_IN_SRNC]) +(8*[DURA_FOR_DATA_8_DL_IN_DRNC]) +(14.4*[DURA_FOR_DATA_14_4_DL_DRNC]) +(16*[DURA_FOR_DATA_16_DL_IN_DRNC]) +(32*[DURA_FOR_DATA_32_DL_IN_DRNC]) + (57.6*[DURA_FOR_DATA_57_6_DL_DRNC]) +(64*[DURA_FOR_DATA_64_DL_IN_DRNC]) +(128*[DURA_FOR_DATA_128_DL_IN_DRNC]) +(256*[DURA_FOR_DATA_256_DL_IN_DRNC]) +(384*[DURA_FOR_DATA_384_DL_IN_DRNC])) /sum(PERIOD_DURATION)*60*100000
KPI class Usage/Allocated Capacity
Unit Mbps
Typical values See RNC Product Description for maximum supportedthroughput.
Object Summary Levels Network, City, Area, RNC, Cluster of cells, Cell
Time Summary Levels Week, Day, Hour
HSPA selections
Table 125 HS-DSCH selections
KPI name HS-DSCH selections
KPI abbreviation HS-DSCH selections
KPI ID RNC_614c
Description The number of times when HS-DSCH channel has beenselected by cell specific packet scheduler.
Measurement M1002: Traffic
Available Key Performance Indicators per Formula WCDMA RAN Key Performance Indicators
162 DN05191189 Issue: 08

Table 125 HS-DSCH selections (Cont.)
KPI formula sum ([M1002C385] + [M1002C389] + [M1002C569] +[M1002C475] + [M1002C476] + [M1002C591] +[M1002C401] + [M1002C402] + [M1002C577] +[M1002C413] + [M1002C415] + [M1002C416] +[M1002C417] + [M1002C421] + [M1002C423] +[M1002C424] + [M1002C425] + [M1002C581] +[M1002C585] + [M1002C583] + [M1002C584] +[M1002C602] + [M1002C521] + [M1002C522])
KPI formula with short names sum ([ALLO_HS_DSCH_FLOW_INT] +[ALLO_HS_DSCH_FLOW_BGR] +[ALLO_HS_DSCH_FLOW_STR] +[DCH_SEL_MAX_HSDPA_USERS_INT] +[DCH_SEL_MAX_HSDPA_USERS_BGR] +[DCH_SEL_MAX_HSDPA_USERS_STR] +[REJ_HS_DSCH_RET_INT] + [REJ_HS_DSCH_RET_BGR]+ [REJ_HS_DSCH_RET_STR] +[SETUP_FAIL_RNC_HS_DSCH_INT] +[SETUP_FAIL_UE_HS_DSCH_INT] +[SETUP_FAIL_BTS_HS_DSCH_INT] +[SETUP_FAIL_IUB_HS_TOTAL_INT] +[SETUP_FAIL_RNC_HS_DSCH_BGR] +[SETUP_FAIL_UE_HS_DSCH_BGR] +[SETUP_FAIL_BTS_HS_DSCH_BGR] +[SETUP_FAIL_IUB_HS_TOTAL_BGR] +[SETUP_FAIL_RNC_HS_DSCH_STR] +[SETUP_FAIL_IUB_HS_TOTAL_STR] +[SETUP_FAIL_UE_HS_DSCH_STR] +[SETUP_FAIL_BTS_HS_DSCH_STR] +[DL_DCH_SEL_HSDPA_POWER_STR] +[DL_DCH_SEL_HSDPA_POWER_INT] +[DL_DCH_SEL_HSDPA_POWER_BGR])
KPI class Usage/Allocated Capacity
Unit #
Typical values OPEN
Object Summary Levels Network, City, Area, RNC, Cluster of cells, Cell
Time Summary Levels Total; week; weeklyBH; day; dailyBH; hour
Table 126 E-DCH selections
KPI name E-DCH selections
KPI abbreviation E-DCH selections
KPI ID RNC_923d
Description The number of times when E-DCH channel has beenselected by cell specific packet scheduler for NRT Traffic.
WCDMA RAN Key Performance Indicators Available Key Performance Indicators per Formula
Issue: 08 DN05191189 163

Table 126 E-DCH selections (Cont.)
Measurement 1002: Traffic
KPI formula sum ([M1002C531] + [M1002C532] + [M1002C607] +[M1002C520] + [M1002C519] + [M1002C601] +[M1002C516] + [M1002C515] + [M1002C599] +[M1002C517] + [M1002C518] + [M1002C600] +[M1002C526] + [M1002C525] + [M1002C604] +[M1002C530] + [M1002C529] + [M1002C606] +[M1002C528] + [M1002C527] + [M1002C605] +[M1002C524] + [M1002C523] + [M1002C603] +[M1002C681] + [M1002C682])
KPI formula with short names sum ([ALLO_SUCCESS_EDCH_INT] +[ALLO_SUCCESS_EDCH_BGR] +[ALLO_SUCCESS_EDCH_STR] +[EDCH_ALLO_CANC_NA_AS_BGR] +[EDCH_ALLO_CANC_NA_AS_INT] +[EDCH_ALLO_CANC_NA_AS_STR] +[UL_DCH_SEL_MAX_HSUPA_USR_BGR] +[UL_DCH_SEL_MAX_HSUPA_USR_INT] +[UL_DCH_SEL_MAX_HSUPA_USR_STR] +[UL_DCH_SEL_BTS_HW_INT] +[UL_DCH_SEL_BTS_HW_BGR] +[UL_DCH_SEL_BTS_HW_STR] +[SETUP_FAIL_EDCH_BTS_BGR] +[SETUP_FAIL_EDCH_BTS_INT] +[SETUP_FAIL_EDCH_BTS_STR] +[SETUP_FAIL_EDCH_OTHER_BGR] +[SETUP_FAIL_EDCH_OTHER_INT] +[SETUP_FAIL_EDCH_OTHER_STR] +[SETUP_FAIL_EDCH_TRANS_BGR] +[SETUP_FAIL_EDCH_TRANS_INT] +[SETUP_FAIL_EDCH_TRANS_STR] +[SETUP_FAIL_EDCH_UE_BGR] +[SETUP_FAIL_EDCH_UE_INT] +[SETUP_FAIL_EDCH_UE_STR] +[SETUP_REJ_EDCH_AC_INT] +[SETUP_REJ_EDCH_AC_BGR])
KPI class Usage/Allocated Capacity
Unit #
Target values OPEN
Object summary levels Network, City, Area, RNC, Cluster of cells, Cell
Time summary levels Total; week; weeklyBH; day; dailyBH; hour
4.2.3.11 Soft Handover Overhead [%]
Table 127 Soft Handover Overhead in CRNC
KPI name Soft Handover Overhead in CRNC
Available Key Performance Indicators per Formula WCDMA RAN Key Performance Indicators
164 DN05191189 Issue: 08

Table 127 Soft Handover Overhead in CRNC (Cont.)
KPI abbreviation SHO Overhead in CRNC
KPI ID RNC_192b
Description Soft Handover Overhead [%] for Controlling RNC over thereporting period.
Note 1 In the SHO Measurement the counters are both for RNCand WCELL. This formula is purely using the cell levelcounters.
Note 2 The formula will not work properly in border areas. Thisbecause that for the DRNC cells in the AS there will not beany counter updates.
Measurement M1007: Soft Handover
KPI formula 100* (sum([M1007C0] + [M1007C19] + [M1007C1] +[M1007C20] + [M1007C2] + [M1007C21]) / sum(([M1007C0]+ [M1007C19]) + ([M1007C1] + [M1007C20])/2 +([M1007C2] + [M1007C21])/3) - 1)
KPI formula with short names 100* (sum([ONE_CELL_IN_ACT_SET_FOR_RT] +[ONE_CELL_IN_ACT_SET_FOR_NRT] +[TWO_CELLS_IN_ACT_SET_FOR_RT] +[TWO_CELLS_IN_ACT_SET_FOR_NRT] +[THREE_CELLS_IN_ACT_SET_RT] +[THREE_CELLS_IN_ACT_SET_NRT]) /sum(([ONE_CELL_IN_ACT_SET_FOR_RT] +[ONE_CELL_IN_ACT_SET_FOR_NRT]) +([TWO_CELLS_IN_ACT_SET_FOR_RT] +[TWO_CELLS_IN_ACT_SET_FOR_NRT])/2 +([THREE_CELLS_IN_ACT_SET_RT] +[THREE_CELLS_IN_ACT_SET_NRT])/3) - 1)
KPI class Usage/Allocated Capacity
Unit Percentage
Typical values 40 % (Average AS size = 1.4)
Object Summary Levels Network, City, Area, RNC, Cluster of cells, Cell
Time Summary Levels Week, Day, Hour
4.2.3.12 Radio layer (MAC or IP) Data Volumes [Mbit]
Table 128 HSUPA MAC-es data volume at RNC
KPI name HSUPA MAC-es data volume at RNC
KPI abbreviation HSUPA MAC-es DV at RNC
WCDMA RAN Key Performance Indicators Available Key Performance Indicators per Formula
Issue: 08 DN05191189 165

Table 128 HSUPA MAC-es data volume at RNC (Cont.)
KPI ID RNC_931c
Description HSUPA MAC-es total throughput based on MAC-es PDUs inRNC.
Note 1 The BTS is assumed to be capable of forwarding allsuccessfully received MAC-es PDUs to RNC.
Note 2 This KPI is mainly meant for following up overall traffic.
Measurement M1023: Cell Throughput
KPI formula sum([M1023C10] + [M1023C23])*8 / 1000000
KPI formula with short names sum([NRT_EDCH_UL_DATA_VOL] +[RT_E_DCH_UL_STREA_DATA])*8 / 1000000
KPI class Usage/Throughput
Unit Mbit
Typical values See RNC Product Description for maximum supportedthroughput.
Object Summary Levels Network, RNC, BTS
Time Summary Levels Total; week; weeklyBH; day; dailyBH; hour
Table 129 HSDPA MAC-d data volume at RNC
KPI name HSDPA MAC-d data volume at RNC
KPI abbreviation HSDPA DL vol SRNC side
KPI ID RNC_5043a
Description Total Data Volume for HSDPA Downlink Traffic in ServingRNC for the reporting period on Iub. The Downlink Trafficincludes HS-DSCH (MAC-hs) traffic.
Measurement M1023: Cell Throughput
KPI formula sum([M1023C8])*8 / 1000000
KPI formula with short names sum([HS_DSCH_DATA_VOL])*8 / 1000000
KPI class Usage/Throughput
Unit Mbit
Available Key Performance Indicators per Formula WCDMA RAN Key Performance Indicators
166 DN05191189 Issue: 08

Table 129 HSDPA MAC-d data volume at RNC (Cont.)
Typical values See RNC Product Description for maximum supportedthroughput.
Object Summary Levels Network, City, Area, RNC, Cluster of cells, Cell
Time Summary Levels Week, Day, Hour
Table 130 Iu-PS peak throughput
KPI name Iu-PS peak throughput
KPI abbreviation Iu-PS peak throughput
KPI ID RNC_5021b
Description Peak Iu-PS throughput calls in one RNC over the reportingperiod.
Note This KPI works only with NPGE and NPS1 HW.
Measurement 802: RNC Capacity Usage
KPI formula MAX([M802C9])
KPI formula with short names MAX([IU_PS_THR_PEAK])
KPI class Usage/Throughput
Unit kbit/s
Target values See Targets for WCDMA RAN key performance indicators
Object summary levels Network, RNC
Time summary levels Week, Day, Hour
4.2.3.13 Average Radio Layer (RLC, MAC or FP) Throughput [Mbit/s]
Table 131 Average NRT DCH DL Throughput
KPI name Average NRT DCH DL Throughput
KPI abbreviation Avg NRT DCH DL thp NW
KPI ID RNC_5032a
Description The net throughput in Downlink for Interactive andBackground Class traffic using DCH. The throughputexcludes RLC retransmissions.
Measurement M1026: RCPM RLC WCEL
WCDMA RAN Key Performance Indicators Available Key Performance Indicators per Formula
Issue: 08 DN05191189 167

Table 131 Average NRT DCH DL Throughput (Cont.)
KPI formula sum (All NRT DCHs ([M1026C15]*[M1026C29])) /sum((PERIOD_DURATION)*60*1000)
KPI formula with short names sum (All NRT DCHs([RLC_AM_PDU_DL_NET_TP_W]*[RLC_AM_DL_MEAS_TIME_W])) /sum((PERIOD_DURATION)*60*1000)
Formula note NRT DCHs comprise records where TRSUB_ID is'PS_NRT_data' and CHTYP_ID is 'DCH'.
KPI class Usage/Throughput
Unit Mbps
Typical values Depends on Traffic and DCH capacity.
Object Summary Levels Network; City; Area; RNC; WBTS; Cluster of cells; Cell
Time Summary Levels Week, Day, Hour
Table 132 Average NRT HS-DSCH DL Throughput
KPI name Average NRT HS-DSCH DL Throughput
KPI abbreviation Avg NRT HS-DSCH DL thp NW
KPI ID RNC_5033c
Description The net throughput in Downlink NRT traffic using HS-DSCH.The throughput excludes RLC retransmissions.
Measurement 1026: RCPM RLC WCEL
KPI formula avg (NRT HS-DSCHs ([M1026C15]))
KPI formula with short names avg (NRT HS-DSCHs ([RLC_AM_PDU_DL_NET_TP_W]))
Formula note Note 1: NRT HS-DSCHs comprise records whereTRSUB_ID is 'PS_NRT_data' and CHTYP_ID is 'HSDPA'.
KPI class Usage/Throughput
Unit kbit/s
Target values Depends on Traffic and available HS-DSCH capacity. ThisKPI can be used to follow up HSDPA throughputperformance from user perspective but it is not intended forlive network performance verification purposes.
Object summary levels Network; City; Area; RNC; WBTS; Cluster of cells; Cell
Available Key Performance Indicators per Formula WCDMA RAN Key Performance Indicators
168 DN05191189 Issue: 08

Table 132 Average NRT HS-DSCH DL Throughput (Cont.)
Time summary levels Week, Day, Hour
Table 133 Average MAC-d flow throughput
KPI name Average MAC-d flow throughput
KPI abbreviation Avg MAC-d flow thp
KPI ID RNC_721d
Description The average MAC-d flow throughput calculated as the totalHSDPA MAC-d throughput at the BTS divided by the totalHSDPA MAC-d allocations. This includes the whole MAC-dallocation time including any inactive periods.
Note Note 1: Dual cell user is counted as a separate user in eachof the two cells.
Measurement 1002: Traffic
5000: HSPA in WBTS
5002: Cell Throughput in WBTS
KPI formula sum ([M5000C126]-[M5000C127] +([M5002C128]+[M5002C129])*8) / (sum([M1002C393] +[M1002C397] + [M1002C573]) /100)
KPI formula with short names sum ([RECEIVED_HS_MACD_BITS]-[DISCARDED_HS_MACD_BITS] +([MC_HSDPA_ORIG_DATA_PRI] +[MC_HSDPA_ORIG_DATA_SEC])*8)
/
(sum([ALLO_DUR_HS_DSCH_FLOW_INT] +[ALLO_DUR_HS_DSCH_FLOW_BGR] +[ALLO_DUR_HS_DSCH_FLOW_STR]) /100)
KPI class Usage/Throughput
Unit kbps
Target values OPEN
Object summary levels Network, City, Area, RNC, Cluster of cells, Cell
Table 134 HSUPA MAC-es average throughput at RNC
KPI name HSUPA MAC-es average throughput at RNC
KPI abbreviation HSUPA MAC-es avg thp RNC
KPI ID RNC_952c
WCDMA RAN Key Performance Indicators Available Key Performance Indicators per Formula
Issue: 08 DN05191189 169

Table 134 HSUPA MAC-es average throughput at RNC (Cont.)
Description HSUPA MAC-es average throughput based on MAC-esPDUs in RNC.
Note 1 The BTS is assumed to be capable of forwarding allsuccessfully received MAC-es PDUs to RNC.
Note 2 This KPI is mainly meant for busy hour follow-up.
Measurement M1023: Cell Throughput
KPI formula sum([M1023C10] + [M1023C23]) * 8 /sum(PERIOD_DURATION)*1000000*60
KPI formula with short names sum([NRT_EDCH_UL_DATA_VOL] +[RT_E_DCH_UL_STREA_DATA]) * 8 /sum(PERIOD_DURATION)*1000000*60
KPI class Usage/Throughput
Unit Mbps
Typical values Depends on Traffic and available E-DCH capacity. This KPIcan be used to follow up HSUPA throughput performancefrom network perspective but it is not intended for livenetwork performance verification purposes.
Object Summary Levels Network, City, Area, RNC, Cluster of cells, Cell
Time Summary Levels Total; week; weeklyBH; day; dailyBH; hour
4.2.4 RNC function level indicators for mobility
The services and resources related to the KPIs are described in Radio network in the 3Gsystem and UTRAN Resource Model overview in WCDMA RAN System Overview.
For an overview on WCDMA RAN KPIs, see Overview of WCDMA RAN keyperformance indicators.
4.2.4.1 Intra RNC Inter frequency HO Success Ratio [%]
Table 135 Intra RNC Inter frequency HO Success Rate RT
KPI name Intra RNC Inter frequency HO Success Rate RT
KPI abbreviation IntraRNC InterFr HO SR RT
KPI ID RNC_5069a
Description Intra RNC Inter frequency HO Success Rate for RT. Includnig both intra and interBTS HOs.
Measurement 1008: Intra System Hard Handover
Available Key Performance Indicators per Formula WCDMA RAN Key Performance Indicators
170 DN05191189 Issue: 08

Table 135 Intra RNC Inter frequency HO Success Rate RT (Cont.)
KPI formula 100* sum ([M1008C55]+[M1008C59]) / sum ([M1008C54]+[M1008C58])
KPI formula with short names 100* sum([SUCC_INTRA_INTRA_HHO_ATT_RT]+[SUCC_INTRA_INTER_HHO_ATT_RT]) /sum ([INTRA_INTRA_HHO_ATT_RT]+[INTRA_INTER_HHO_ATT_RT])
KPI class Mobility
Unit %
Object summary levels Network, City, Area, RNC, Cluster of cells, Cell
Time summary levels Total; week; weeklyBH; day; dailyBH; hour
Table 136 Intra RNC Inter frequency HO Success Rate NRT
KPI name Intra RNC Inter frequency HO Success Rate NRT
KPI abbreviation IntrRNC InteFr HO SR NRT
KPI ID RNC_5071a
Description Intra RNC Inter frequency HO Success Rate NRT.Includnig both intra and interBTS HOs.
Measurement 1008: Intra System Hard Handover
KPI formula 100* sum ([M1008C103] + [M1008C107]) / sum ([M1008C102] + [M1008C106] )
KPI formula with short names 100* sum ([SUCC_INTRA_INTRA_HHO_ATT_NRT] +[SUCC_INTRA_INTER_HHO_ATT_NRT]) / sum ([INTRA_INTRA_HHO_ATT_NRT]+ [INTRA_INTER_HHO_ATT_NRT] )
KPI class Mobility
Unit %
Object summary levels Network; City; Area; RNC; WBTS; Cluster of cells; Cell
Time summary levels Total; week; weeklyBH; day; dailyBH; hour
4.3 Transport Resource Manager level4.3.1 Transport Resource Manager level indicators for
accessibility
The services and resources related to the KPIs are described in Radio network in the 3Gsystem and UTRAN Resource Model overview in WCDMA RAN System Overview.
WCDMA RAN Key Performance Indicators Available Key Performance Indicators per Formula
Issue: 08 DN05191189 171

For an overview on WCDMA RAN KPIs, see Overview of WCDMA RAN keyperformance indicators.
4.3.1.1 Transmission Resource Accessibility Ratio [%]
Table 137 AAL2 connection reservation success rate
KPI name AAL2 connection reservation success rate
KPI abbreviation AAL2 conn reservation SR
KPI ID RNC_602a
Description The transport resource request success ratio [%]. This KPIdescribes the average success rate of the transportresource reservation attempts for AAL2 type connections.The low success rate increases the number of unsuccessfulRAB setups and requires further troubleshooting in transportlayer.
Measurement M800: AAL2 Resource Reservation Measurement
KPI formula 100* sum([M800C4]) / sum([M800C4] + [M800C5] +[M800C1] + [M800C2] + [M800C3])
KPI formula with short names 100* sum([AAL2_SUCCEEDED]) /sum([AAL2_SUCCEEDED] + [AAL2_REJECTED] +[RES_EXT_CAP] + [RES_INT_CAP] + [RES_OTHER])
KPI class Accessibility
Unit Percentage
Typical values N/A (Not enough experience yet)
Object Summary Levels Network, RNC, VCC
Time Summary Levels Week, Day, Hour
Table 138 IP Route Accessibility for outgoing traffic
KPI name IP Route Accessibility for outgoing traffic
KPI abbreviation IP Route Acc out
KPI ID RNC_5005a
Description The transport resource request success ratio [%]. This KPIdescribes the average success rate of the transportresource reservation attempts for IP Route basedconnections every/selected interface where IP is used.
Measurement M804: IP CAC Accessibility
Available Key Performance Indicators per Formula WCDMA RAN Key Performance Indicators
172 DN05191189 Issue: 08

Table 138 IP Route Accessibility for outgoing traffic (Cont.)
KPI formula 100* sum([M804C0]) / sum([M804C0] + [M804C1] +[M804C2] + [M804C3])
KPI formula with short names 100* sum([SUCC_RNC_IP_RES]) /sum([SUCC_RNC_IP_RES] + [FAIL_RNC_IP_RES_EXT] +[FAIL_RNC_IP_RES_INT] + [FAIL_RNC_IP_RES_OTHER])
KPI class Accessibility
Unit Percentage
Object Summary Levels Network, RNC, IP Route
Time Summary Levels Week, Day, Hour
Table 139 IP Route Accessibility for incoming iub traffic
KPI name IP Route Accessibility for incoming iub traffic
KPI abbreviation IP Route Acc Iub In
KPI ID RNC_5031a
Description The transport resource request success ratio [%]. This KPIdescribes the average success rate of the transportresource reservation attempts for IP Route basedconnections every/selected interface where IP is used.
Measurement M804: IP CAC Accessibility
KPI formula 100* sum([M804C4]) / sum([M804C4] + [M804C5] +[M804C6])
KPI formula with short names 100* sum([SUCC_BTS_IP_RES]) /sum([SUCC_BTS_IP_RES] +[FAIL_BTS_IP_RES_EXT_TRANS] +[FAIL_BTS_IP_RES_OTHER_TRANS])
KPI class Accessibility
Unit Percentage
Object Summary Levels Network, RNC, IP Route
Time Summary Levels Week, Day, Hour
4.3.2 Transport Resource Manager level indicators for usage
The services and resources related to the KPIs are described in Radio network in the 3Gsystem and UTRAN Resource Model overview in WCDMA RAN System Overview.
WCDMA RAN Key Performance Indicators Available Key Performance Indicators per Formula
Issue: 08 DN05191189 173

For an overview on WCDMA RAN KPIs, see Overview of WCDMA RAN keyperformance indicators.
4.3.2.1 Reserved AAL2 bandwidth [%]
Table 140 AAL2 path average reserved bandwidth
KPI name AAL2 path average reserved bandwidth
KPI abbreviation Alloc avg cap of CBR VCC
KPI ID RNC_601a
Description The ratio between average reserved bandwidth and totalbandwidth of AAL2 path estimated by CAC duringmeasurement period. The AAL2 path is an ATM VCCbetween two AAL type 2 entities. The high reservation levelmay cause blocking of radio bearer setup.
Measurement M550: AAL2 Path CAC Resource Measurement
KPI formula 100* sum([M550C1] / [M550C7]) / sum([M550C0])
KPI formula with short names 100* sum([SUM_RESERVED_CELL_RATE] /[NBR_SAMPLES]) /sum([AAL2_PATH_GUAR_CELL_RATE])
KPI class Usage/Allocated Capacity
Unit Percentage
Typical values Depends on Traffic and AAL2 capacity.
Object Summary Levels Network, RNC, VCC
Time Summary Levels Week, Day, Hour
4.3.2.2 Reserved IP bandwidth [%]
Table 141 Max Reserved IP based route bandwidth
KPI name Max Reserved IP based route bandwidth
KPI abbreviation Max Rsv IP BW
KPI ID RNC_1909b
Description Maximum value of IP bandwidth usage rate, comparing themaximum value of reserved IP layer bit rate against theavailable bandwidth
Measurement 568: IP Based Route
KPI formula 100*
Available Key Performance Indicators per Formula WCDMA RAN Key Performance Indicators
174 DN05191189 Issue: 08

Table 141 Max Reserved IP based route bandwidth (Cont.)
MAX([M568C5])
/
AVG([M568C2])
KPI formula with short names 100*
MAX([MAX_RESERVED_RATE_IP_ROUTE])
/
AVG([COMMITTED_BIT_RATE_IP_ROUTE])
KPI class Usage/Transmission load
Unit %
Object summary levels Network, RNC, IP Route
Time summary levels Week, Day, Hour
Table 142 IP based Iub Uplink maximum reservation rate at Flexi BTS
KPI name IP based Iub Uplink maximum reservation rate at Flexi BTS
KPI abbreviation IP Iub UL max rsv R F-BTS
KPI ID RNC_5383a
Description This tells the maximum reservation rate of guaranteed IPtransport resources at Flexi BTS per IP interface.
Measurement 5117: FTM IP statistics
KPI formula 100*
sum([M5117C7])
/
sum([M5117C10])
KPI formula with short names 100*
sum([cacMaxReservedBitRate])
/
sum([cacMaxCommittedBitRate])
KPI class Usage/Transmission load
Unit %
WCDMA RAN Key Performance Indicators Available Key Performance Indicators per Formula
Issue: 08 DN05191189 175
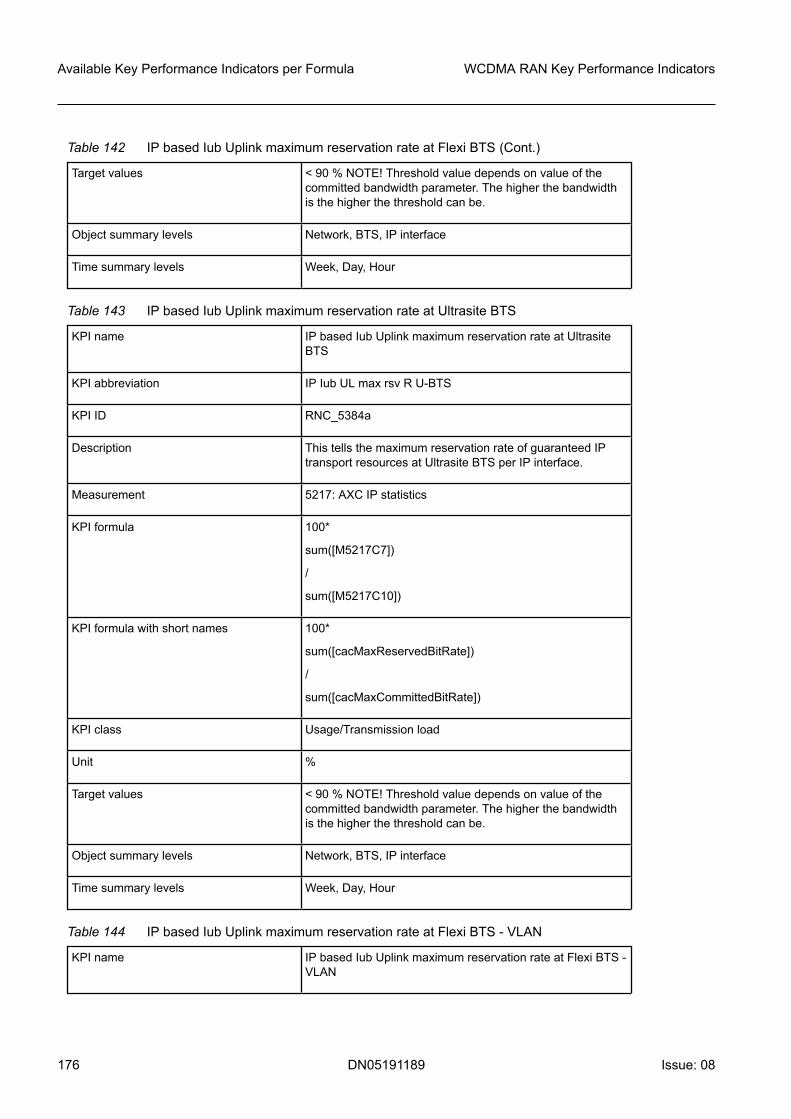
Table 142 IP based Iub Uplink maximum reservation rate at Flexi BTS (Cont.)
Target values < 90 % NOTE! Threshold value depends on value of thecommitted bandwidth parameter. The higher the bandwidthis the higher the threshold can be.
Object summary levels Network, BTS, IP interface
Time summary levels Week, Day, Hour
Table 143 IP based Iub Uplink maximum reservation rate at Ultrasite BTS
KPI name IP based Iub Uplink maximum reservation rate at UltrasiteBTS
KPI abbreviation IP Iub UL max rsv R U-BTS
KPI ID RNC_5384a
Description This tells the maximum reservation rate of guaranteed IPtransport resources at Ultrasite BTS per IP interface.
Measurement 5217: AXC IP statistics
KPI formula 100*
sum([M5217C7])
/
sum([M5217C10])
KPI formula with short names 100*
sum([cacMaxReservedBitRate])
/
sum([cacMaxCommittedBitRate])
KPI class Usage/Transmission load
Unit %
Target values < 90 % NOTE! Threshold value depends on value of thecommitted bandwidth parameter. The higher the bandwidthis the higher the threshold can be.
Object summary levels Network, BTS, IP interface
Time summary levels Week, Day, Hour
Table 144 IP based Iub Uplink maximum reservation rate at Flexi BTS - VLAN
KPI name IP based Iub Uplink maximum reservation rate at Flexi BTS -VLAN
Available Key Performance Indicators per Formula WCDMA RAN Key Performance Indicators
176 DN05191189 Issue: 08

Table 144 IP based Iub Uplink maximum reservation rate at Flexi BTS - VLAN (Cont.)
KPI abbreviation IP Iub UL max rsv R F-BTS
KPI ID RNC_5385a
Description This tells the maximum reservation rate of guaranteed IPtransport resources at Flexi BTS per VLAN interface.
Measurement 5124: FTM VLAN IP Statistics
KPI formula 100*
sum([M5124C7])
/
sum([M5124C10])
KPI formula with short names 100*
sum([cacMaxReservedBitRate])
/
sum([cacMaxCommittedBitRate])
KPI class Usage/Transmission load
Unit %
Object summary levels Network, BTS, VLAN interface
Time summary levels Week, Day, Hour
Table 145 IP based Iub Uplink maximum reservation rate at Ultrasite BTS - VLAN
KPI name IP based Iub Uplink maximum reservation rate at UltrasiteBTS - VLAN
KPI abbreviation IP Iub UL max rsv R U-BTS
KPI ID RNC_5386a
Description This tells the maximum reservation rate of guaranteed IPtransport resources at Ultrasite BTS per VLAN interface.
Measurement 5221: AXC VLAN IP statistics
KPI formula 100*
sum([M5221C7])
/
sum([M5221C10])
KPI formula with short names 100*
WCDMA RAN Key Performance Indicators Available Key Performance Indicators per Formula
Issue: 08 DN05191189 177
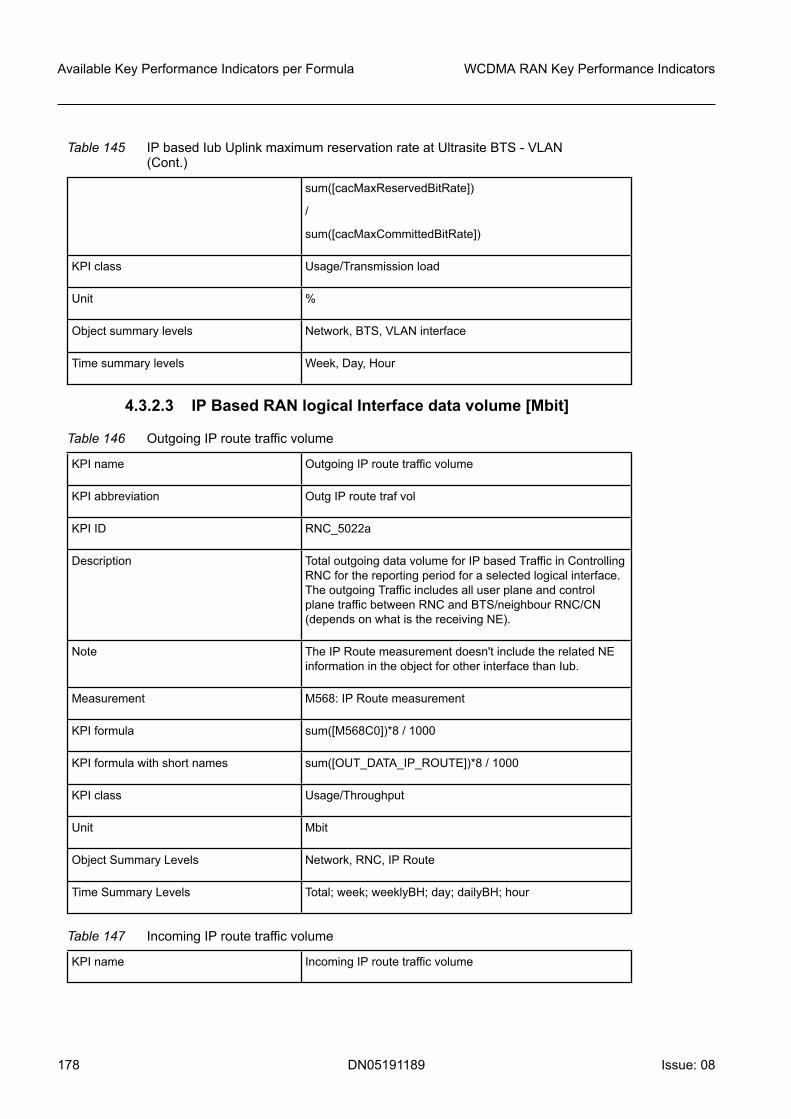
Table 145 IP based Iub Uplink maximum reservation rate at Ultrasite BTS - VLAN(Cont.)
sum([cacMaxReservedBitRate])
/
sum([cacMaxCommittedBitRate])
KPI class Usage/Transmission load
Unit %
Object summary levels Network, BTS, VLAN interface
Time summary levels Week, Day, Hour
4.3.2.3 IP Based RAN logical Interface data volume [Mbit]
Table 146 Outgoing IP route traffic volume
KPI name Outgoing IP route traffic volume
KPI abbreviation Outg IP route traf vol
KPI ID RNC_5022a
Description Total outgoing data volume for IP based Traffic in ControllingRNC for the reporting period for a selected logical interface.The outgoing Traffic includes all user plane and controlplane traffic between RNC and BTS/neighbour RNC/CN(depends on what is the receiving NE).
Note The IP Route measurement doesn't include the related NEinformation in the object for other interface than Iub.
Measurement M568: IP Route measurement
KPI formula sum([M568C0])*8 / 1000
KPI formula with short names sum([OUT_DATA_IP_ROUTE])*8 / 1000
KPI class Usage/Throughput
Unit Mbit
Object Summary Levels Network, RNC, IP Route
Time Summary Levels Total; week; weeklyBH; day; dailyBH; hour
Table 147 Incoming IP route traffic volume
KPI name Incoming IP route traffic volume
Available Key Performance Indicators per Formula WCDMA RAN Key Performance Indicators
178 DN05191189 Issue: 08

Table 147 Incoming IP route traffic volume (Cont.)
KPI abbreviation Inc IP route traf vol
KPI ID RNC_5029a
Description Total incoming data volume for IP based Traffic inControlling RNC for the reporting period for a selectedlogical interface. The incoming Traffic includes all user planetraffic between RNC and BTS/neighbour RNC/CN (dependswhat is the sending NE).
Note The IP Route measurement doesn't include the related NEinformation in the object for other interfaces than Iub.
Measurement 568: IP Based Route
KPI formula sum([M568C1])*8 / 1000
KPI formula with short names sum([IN_DATA_IP_ROUTE])*8 / 1000
KPI class Usage/Throughput
Unit Mbit
Object summary levels Network, RNC, IP Route
Time summary levels Total; week; weeklyBH; day; dailyBH; hour
4.3.2.4 ATM Based RAN logical Interface data volume [Mbit]
Table 148 ATM interface based incoming Data Volume (RNC side)
KPI name ATM interface based incoming Data Volume (RNC side)
KPI abbreviation ATM If ba inc DV RNCside
KPI ID RNC_946b
Description Total incoming data volume for ATM based Traffic inControlling RNC for the reporting period for a selectedlogical interface The incoming Traffic includes all user planeand control plane traffic between RNC and BTS/neighbourRNC/CN (depends what is the sending NE). In the caseO&M uses traffic dedicated VPC it can be left out ofmeasurement to increase the number of measured Iub links,see NOTE3.
Note 1 The ATM VP measurement doesn't include the related NEinformation in the object. It must be derived from anothersource.
WCDMA RAN Key Performance Indicators Available Key Performance Indicators per Formula
Issue: 08 DN05191189 179

Table 148 ATM interface based incoming Data Volume (RNC side) (Cont.)
Note 2 (In case of Iub interface measuring)! The use of this KPIrequires that there exist dedicated VP(s) between RNC andNodeB for the Iub links to be monitored. If several BTS sitesare sharing same VP in RNC end this KPI can not be usedto monitor Iub specific throughput.
Note 3 This KPI is mainly meant for following up overall traffic.
Measurement M529: ATM VP Traffic Measurement
KPI formula sum([M529C0])*53*8 / 1000000
KPI formula with short names sum([IN_TOT_CELLS_VP])*53*8 / 1000000
KPI class Usage/Throughput
Unit Mbit
Object Summary Levels Network, RNC, BTS
Time Summary Levels Week, Day, Hour
Table 149 ATM interface based outgoing Data Volume (RNC side)
KPI name ATM interface based outgoing Data Volume (RNC side)
KPI abbreviation ATM If ba out DV RNC side
KPI ID RNC_945b
Description Total Outgoing data volume for ATM based Traffic inControlling RNC for the reporting period for a selectedlogical interface The outgoing Traffic includes all user planeand control plane traffic between RNC and BTS/neighbourRNC/CN (depends what is the sending NE). In the caseO&M uses traffic dedicated VPC it can be left out ofmeasurement to increase the number of measured Iub links,see NOTE3.
Note 1 The ATM VP measurement doesn't include the related NEinformation in the object. It must be derived from anothersource.
Note 2 (In case of Iub interface measuring)! The use of this KPIrequires that there exist dedicated VP(s) between RNC andNodeB for the Iub links to be monitored. If several BTS sitesare sharing same VP in RNC end this KPI can not be usedto monitor Iub specific throughput.
Note 3 This KPI is mainly meant for following up overall traffic.
Measurement M529: ATM VP Traffic Measurement
Available Key Performance Indicators per Formula WCDMA RAN Key Performance Indicators
180 DN05191189 Issue: 08

Table 149 ATM interface based outgoing Data Volume (RNC side) (Cont.)
KPI formula sum([M529C1])*53*8 / 1000000
KPI formula with short names sum([EG_TOT_CELLS_VP])*53*8 / 1000000
KPI class Usage/Throughput
Unit Mbit
Object Summary Levels Network, RNC, BTS
Time Summary Levels Week, Day, Hour
4.3.2.5 Average ATM layer throughput per RAN logical interface [Mbit/s]
Table 150 ATM interface based average throughput for outgoing traffic (RNC side)
KPI name ATM interface based average throughput for outgoing traffic(RNC side)
KPI abbreviation Iub DL avg thp (RNC side)
KPI ID RNC_950b
Description Average throughput for outgoing ATM based Traffic inControlling RNC for the reporting period for a selectedlogical interface The outgoing Traffic includes all user planeand control plane traffic between RNC and BTS/neighbourRNC/CN (depends what is the sending NE). In the caseO&M uses traffic dedicated VPC it can be left out ofmeasurement to increase the number of measured Iub links,see NOTE3.
Note 1 The ATM VP measurement doesn't include the related NEinformation in the object. It must be derived from anothersource.
Note 2 (In case of Iub interface measuring)! The use of this KPIrequires that there exist dedicated VP(s) between RNC andNodeB for the Iub links to be monitored. If several BTS sitesare sharing same VP in RNC end this KPI can not be usedto monitor Iub specific throughput.
Note 3 This KPI is mainly meant for busy hour follow-up.
Measurement M529: ATM VP Traffic Measurement
KPI formula sum([M529C1])*53*8 /sum(PERIOD_DURATION)*1000000*60
KPI formula with short names sum([EG_TOT_CELLS_VP])*53*8 /sum(PERIOD_DURATION)*1000000*60
WCDMA RAN Key Performance Indicators Available Key Performance Indicators per Formula
Issue: 08 DN05191189 181
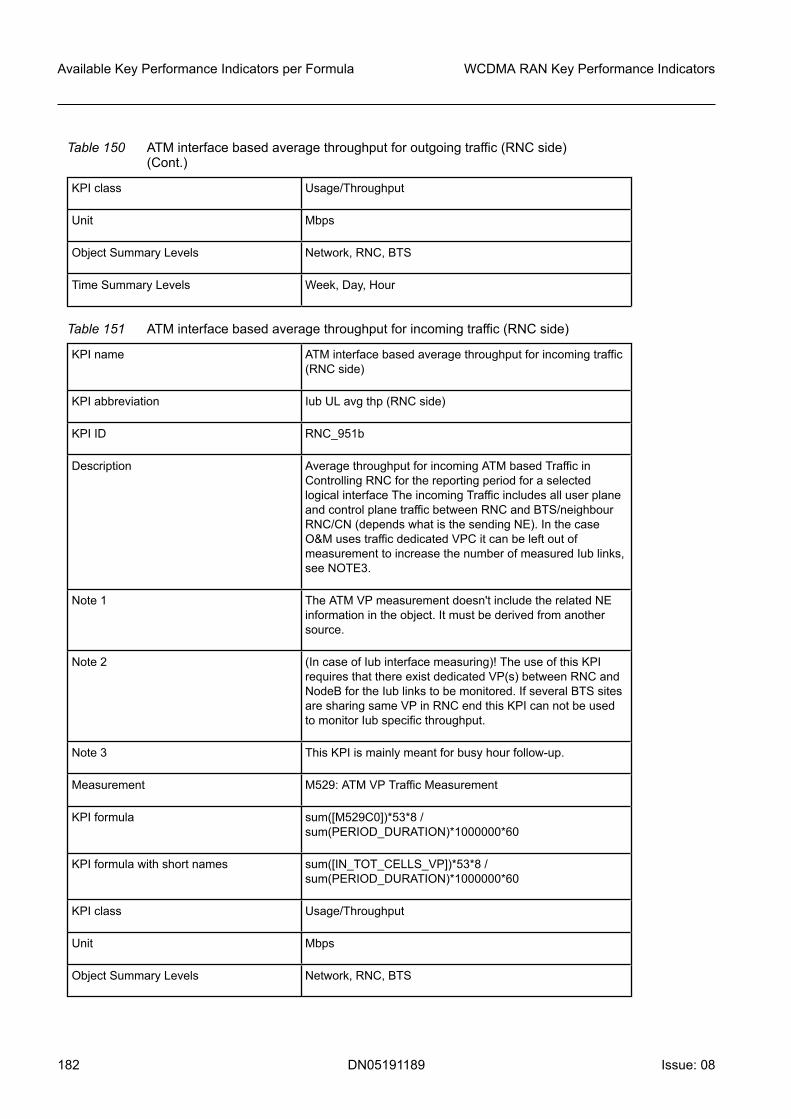
Table 150 ATM interface based average throughput for outgoing traffic (RNC side)(Cont.)
KPI class Usage/Throughput
Unit Mbps
Object Summary Levels Network, RNC, BTS
Time Summary Levels Week, Day, Hour
Table 151 ATM interface based average throughput for incoming traffic (RNC side)
KPI name ATM interface based average throughput for incoming traffic(RNC side)
KPI abbreviation Iub UL avg thp (RNC side)
KPI ID RNC_951b
Description Average throughput for incoming ATM based Traffic inControlling RNC for the reporting period for a selectedlogical interface The incoming Traffic includes all user planeand control plane traffic between RNC and BTS/neighbourRNC/CN (depends what is the sending NE). In the caseO&M uses traffic dedicated VPC it can be left out ofmeasurement to increase the number of measured Iub links,see NOTE3.
Note 1 The ATM VP measurement doesn't include the related NEinformation in the object. It must be derived from anothersource.
Note 2 (In case of Iub interface measuring)! The use of this KPIrequires that there exist dedicated VP(s) between RNC andNodeB for the Iub links to be monitored. If several BTS sitesare sharing same VP in RNC end this KPI can not be usedto monitor Iub specific throughput.
Note 3 This KPI is mainly meant for busy hour follow-up.
Measurement M529: ATM VP Traffic Measurement
KPI formula sum([M529C0])*53*8 /sum(PERIOD_DURATION)*1000000*60
KPI formula with short names sum([IN_TOT_CELLS_VP])*53*8 /sum(PERIOD_DURATION)*1000000*60
KPI class Usage/Throughput
Unit Mbps
Object Summary Levels Network, RNC, BTS
Available Key Performance Indicators per Formula WCDMA RAN Key Performance Indicators
182 DN05191189 Issue: 08

Table 151 ATM interface based average throughput for incoming traffic (RNC side)(Cont.)
Time Summary Levels Week, Day, Hour
4.3.2.6 ATM layer traffic load [%]
Table 152 ATM VCC specific incoming traffic load
KPI name ATM VCC specific incoming traffic load
KPI abbreviation ATM VCC spec inc traf ld
KPI ID RNC_960b
Description This KPI shows the incoming ATM layer traffic load for singleATM VC connection. The load is measured in RNC ingressdirection. It depends on the selected configuration, whichtraffic type utilizes one VCC. The ATM VCC trafficthroughput is compared to the VCC PCR (in the case ofCBR connection) or MDCR (in the case of UBR+connection) to calculate the load [%]. If there is dedicatedVC connection used for HSDPA, this KPI can be used tofollow the HSDPA load over Iub and the same applies toother traffic types as well.
Note 1 If VCC is UBR type, the MDCR or PCR value is alwaysreported as "0" and the calculation can not be done.
Note 2 If UBR+ is in use the KPI can give results over 100%.
Measurement M530: ATM VC Traffic Measurement
KPI formula 100*sum([M530C0]) /sum([M530C4]*PERIOD_DURATION_SUM)*60
KPI formula with short names 100*sum([IN_TOT_CELLS_VC]) /sum([IN_CAP_VC]*PERIOD_DURATION_SUM)*60
KPI class Usage/Transmission load
Unit %
Typical values Depends on Traffic and AAL2 capacity.
Object Summary Levels Network, RNC
Time Summary Levels Week, Day, Hour
Table 153 ATM VCC specific outgoing traffic load
KPI name ATM VCC specific outgoing traffic load
KPI abbreviation ATM VCC traf load Iub DL
WCDMA RAN Key Performance Indicators Available Key Performance Indicators per Formula
Issue: 08 DN05191189 183

Table 153 ATM VCC specific outgoing traffic load (Cont.)
KPI ID RNC_732b
Description This KPI shows the outgoing ATM layer traffic load for singleATM VC connection. The load is measured in RNC egressdirection. It depends on the selected configuration, whichtraffic type utilises one VCC. The ATM VCC trafficthroughput is compared to the VCC PCR (in the case ofCBR connection) or MDCR (in the case of UBR+connection) to calculate the load [%]. If there is dedicatedVC connection used for HSDPA, this KPI can be used tofollow the HSDPA load over Iub and the same applies toother traffic types as well.
Note 1 If VCC is UBR type the MDCR or PCR value is alwaysreported as "0" and the calculation can not be done.
Note 2 If UBR+ is in use the KPI can give results over 100%.
Measurement M530: ATM VC Traffic Measurement
KPI formula 100* sum([M530C1]) /sum([M530C7]*PERIOD_DURATION)*60
KPI formula with short names 100* sum([EG_TOT_CELLS_VC]) /sum([EG_CAP_VC]*PERIOD_DURATION)*60
KPI class Usage/Transmission load
Unit %
Typical values Depends on Traffic and AAL2 capacity.
Object Summary Levels Network, RNC
Time Summary Levels Week, Day, Hour
4.3.2.7 IP layer traffic load
Table 154 Average outgoing IP route traffic utilization
KPI name Average Outgoing IP route traffic utilization
KPI abbreviation Ave Outg IP route traf
KPI ID RNC_5449a
Description Average outgoing traffic utilization rate for IP based Traffic inControlling RNC for the reporting period for a selected logicalinterface. The outgoing Traffic includes all user plane trafficbetween RNC and BTS/neighbour RNC/CN (depends on what isthe receiving NE).
Available Key Performance Indicators per Formula WCDMA RAN Key Performance Indicators
184 DN05191189 Issue: 08

Table 154 Average outgoing IP route traffic utilization (Cont.)
Note The IP Route measurement does not include the related NEinformation in the object for other interface than Iub.
Measurement 568: IP Based Route
KPI formula 100*sum([M568C0])*8 / (PERIOD_DURATION*60) /sum([M568C15])
KPI formula with short names 100*sum([OUT_DATA_IP_ROUTE])*8 /(PERIOD_DURATION*60) / sum([IP_EG_BW_CONFIG])
KPI class Usage/Transmission load
Unit %
Object summary levels Network, RNC, IP Route
Time summary levels Total; week; weeklyBH; day; dailyBH; hour
4.4 Access point level4.4.1 Access point level indicators for usage
The services and resources related to the KPIs are described in Radio network in the 3Gsystem and UTRAN Resource Model overview in WCDMA RAN System Overview.
For an overview on WCDMA RAN KPIs, see Overview of WCDMA RAN keyperformance indicators.
4.4.1.1 Radio Load [dBm]
Table 155 Noise floor of the System
KPI name Noise floor of the System
KPI abbreviation Noise floor of the System
KPI ID RNC_177c
Description Average PrxNoise [dBm] of a cell over the reporting period.
Measurement M1000: Cell Resource
KPI formula -100*avg([M1000C10])
KPI formula with short names -100*avg([AVE_PRX_NOISE])
Formula note 1 When using the formula, linear scale has to be used withcalculations. This means that the dBm values in thecounters must be converted to Watts and after the
WCDMA RAN Key Performance Indicators Available Key Performance Indicators per Formula
Issue: 08 DN05191189 185

Table 155 Noise floor of the System (Cont.)
calculation is done, the result must be converted back todBms. It is possible that the counter in the formula is notupdated during the measurement period, that is, thedenominator counter is not updated. These samples shouldbe filtered out. The calculation must also include a divisionby - 100 in order to take out the raw counter unit valuemultiplication by -100.
Formula note 2 Pre-calculated values The counter M1000C10 alreadyshows the average dBm level. Therefore, the denom counterM1000C11 is not used in the formula.
KPI class Usage/Radio Load
Unit dBm
Typical values < -102 dBm
Object Summary Levels Network, City, Area, RNC, Cluster of cells, Cell
Time Summary Levels Week, Day, Hour
Table 156 Average Uplink R99 Load
KPI name Average Uplink R99 Load
KPI abbreviation Avg UL R99 Load
KPI ID RNC_101c
Description Average received uplink power [dBm] shows the uplinkloading of a cell over the reporting period.
Measurement 1000: Cell Resource
KPI formula 10*LOG(10,sum(POWER(10,(-112.1 + [M1000C0] /10)/10)*[M1000C1] + POWER(10,(-112.1 + [M1000C2] /10)/10)*[M1000C3] + POWER(10,(-112.1 + [M1000C4] /10)/10)*[M1000C5] + POWER(10,(-112.1 + [M1000C6] /10)/10)*[M1000C7] + POWER(10,(-112.1 + [M1000C8] /10)/10)*[M1000C9]) / sum([M1000C1] + [M1000C3] +[M1000C5] + [M1000C7] + [M1000C9]) )
KPI formula with short names 10*LOG(10,sum(POWER(10,(-112.1 +[AVE_PRXTOT_CLASS_0] /10) /10)*[PRXTOT_DENOM_0]+ POWER(10,(-112.1 + [AVE_PRXTOT_CLASS_1] /10)/10)*[PRXTOT_DENOM_1] + POWER(10,(-112.1 +[AVE_PRXTOT_CLASS_2] /10) /10)*[PRXTOT_DENOM_2]+ POWER(10,(-112.1 + [AVE_PRXTOT_CLASS_3] /10)/10)*[PRXTOT_DENOM_3] + POWER(10,(-112.1 +[AVE_PRXTOT_CLASS_4] /10) /10)*[PRXTOT_DENOM_4])
Available Key Performance Indicators per Formula WCDMA RAN Key Performance Indicators
186 DN05191189 Issue: 08

Table 156 Average Uplink R99 Load (Cont.)
/ sum([PRXTOT_DENOM_0] + [PRXTOT_DENOM_1] +[PRXTOT_DENOM_2] + [PRXTOT_DENOM_3] +[PRXTOT_DENOM_4]) )
Formula note The counter values are given in standardized RSSI values(0-621). This means that the values must be converted todBm values (-112.1 to -50.0) before the KPI can becalculated. It is possible that the counter in the formula is notupdated during the measurement period, meaning that thedenominator counter is not updated. These samples shouldbe filtered out. When using the formula, a linear scale has tobe used with calculations. This means that the dBm valuesin the counters must be converted to Watts and, after thecalculation is done, the result must be converted back todBm.
KPI class Usage/Radio Load
Unit dBm
Target values Depends on PrxNoise and Traffic
Object summary levels Network, City, Area, RNC, Cluster of cells, Cell
Time summary levels Week, Day, Hour
Table 157 Average HSUPA Uplink Load
KPI name Average HSUPA Uplink Load
KPI abbreviation Avg HSUPA UL Load
KPI ID RNC_1180a
Description Average received uplink power [dBm] for HSUPA of a cellover the reporting period.
Measurement M5000: HSPA in WBTS
KPI formula avg([M5000C156])
KPI formula with short names avg([HSUPA_UL_PWR_AVG])
KPI class Usage/Radio Load
Unit dBm
Object Summary Levels Network, City, Area, RNC, Cluster of cells, Cell
Time Summary Levels Week, Day, Hour
WCDMA RAN Key Performance Indicators Available Key Performance Indicators per Formula
Issue: 08 DN05191189 187

Table 158 Average R99 Downlink Load
KPI name Average Downlink R99 Load
KPI abbreviation Avg DL R99 Load
KPI ID RNC_102c
Description Average transmitted downlink power [dBm] shows thedownlink loading of a cell over the reporting period. Thepower is only related to R99 and no HSPA (HSDPA orHSUPA DL) power is included.
Measurement 1000: Cell Resource
KPI formula 10*LOG(10,sum(POWER(10,([M1000C14] /100)/10)*[M1000C15] + POWER(10,([M1000C16] /100)/10)*[M1000C17] + POWER(10,([M1000C18] /100)/10)*[M1000C19] + POWER(10,([M1000C20] /100)/10)*[M1000C21] + POWER(10,([M1000C22] /100)/10)*[M1000C23]) / sum([M1000C15] + [M1000C17] +[M1000C19] + [M1000C21] + [M1000C23]) )
KPI formula with short names 10*LOG(10,sum(POWER(10,([AVE_PTXTOT_CLASS_0]/100) /10)*[PTXTOT_DENOM_0] +POWER(10,([AVE_PTXTOT_CLASS_1] /100)/10)*[PTXTOT_DENOM_1] +POWER(10,([AVE_PTXTOT_CLASS_2] /100)/10)*[PTXTOT_DENOM_2] +POWER(10,([AVE_PTXTOT_CLASS_3] /100)/10)*[PTXTOT_DENOM_3] +POWER(10,([AVE_PTXTOT_CLASS_4] /100)/10)*[PTXTOT_DENOM_4]) / sum([PTXTOT_DENOM_0] +[PTXTOT_DENOM_1] + [PTXTOT_DENOM_2] +[PTXTOT_DENOM_3] + [PTXTOT_DENOM_4]) )
Formula note It is possible that the counter in the formula is not updatedduring the measurement period, meaning that thedenominator counter is not updated. These samples shouldbe filtered out. When using the formula, a linear scale has tobe used with calculations. This means that the dBm valuesin the counters must be converted to Watts and, after thecalculation is done, the result must be converted back todBm.
KPI class Usage/Radio Load
Unit dBm
Target values Depends on Traffic
Object summary levels Network, City, Area, RNC, Cluster of cells, Cell
Time summary levels Week, Day, Hour
Available Key Performance Indicators per Formula WCDMA RAN Key Performance Indicators
188 DN05191189 Issue: 08

Table 159 Average HSPA Downlink Load
KPI name Average HSPA Downlink Load
KPI abbreviation Avg HSPA DL Load
KPI ID RNC_1181a
Description Average transmitted downlink power [dBm] for HSPA of acell over the reporting period.
Measurement M1000: Cell Resource
KPI formula avg([M1000C238])
KPI formula with short names avg([AVE_HSPA_DL_POWER])
Formula note When using the formula, linear scale has to be used withcalculations. This means that the dBm values in thecounters must be converted to Watts and, after thecalculation is done, the result must be converted back todBms.
KPI class Usage/Radio Load
Unit dBm
Object Summary Levels Network, City, Area, RNC, Cluster of cells, Cell
Time Summary Levels Week, Day, Hour
4.4.1.2 Logical Resource Availability [%]
Table 160 Cell Availability
KPI name Cell Availability
KPI abbreviation Cell avail
KPI ID RNC_183c
Description The availability of the WCELLs under a Controlling RNC(CRNC).
Note 1 This KPI was changed in RAS05.1 due to new counters.
Note 2 This KPI tells the "user" point of view.
Note 3 The duration of power saving mode is included in theduration of the working state.
Measurement M1000: Cell Resource
KPI formula 100* sum([M1000C178]) / sum([M1000C180])
WCDMA RAN Key Performance Indicators Available Key Performance Indicators per Formula
Issue: 08 DN05191189 189
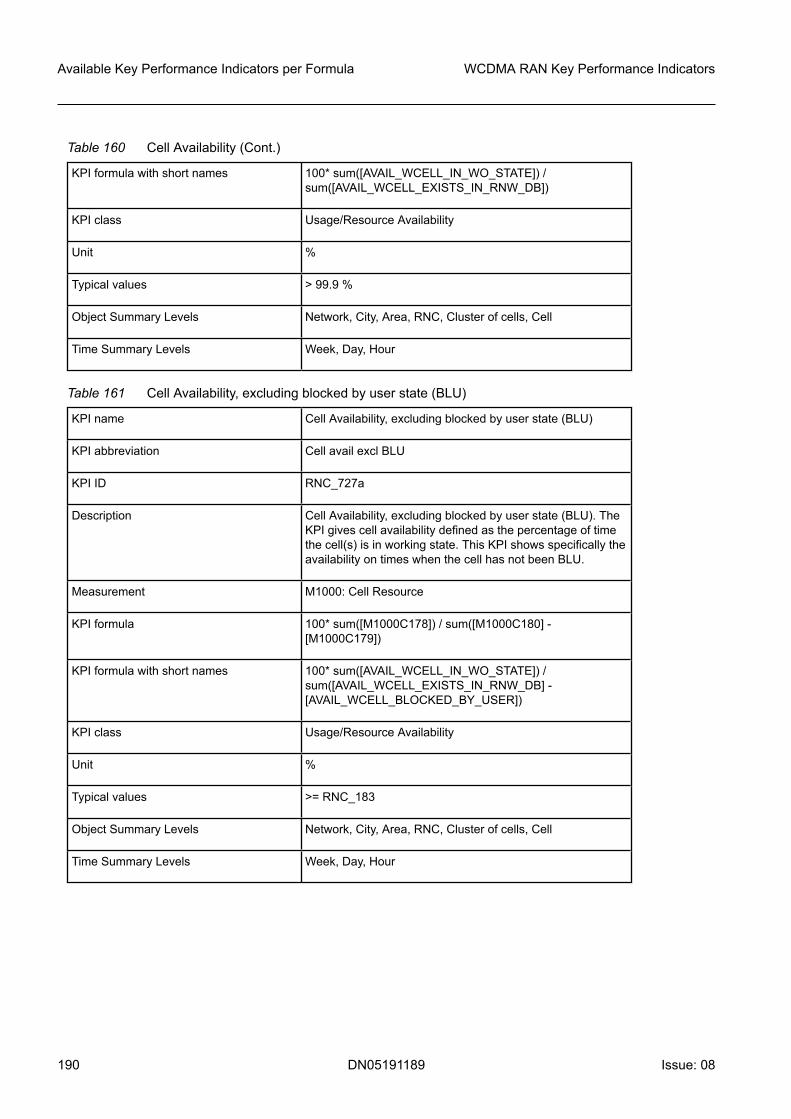
Table 160 Cell Availability (Cont.)
KPI formula with short names 100* sum([AVAIL_WCELL_IN_WO_STATE]) /sum([AVAIL_WCELL_EXISTS_IN_RNW_DB])
KPI class Usage/Resource Availability
Unit %
Typical values > 99.9 %
Object Summary Levels Network, City, Area, RNC, Cluster of cells, Cell
Time Summary Levels Week, Day, Hour
Table 161 Cell Availability, excluding blocked by user state (BLU)
KPI name Cell Availability, excluding blocked by user state (BLU)
KPI abbreviation Cell avail excl BLU
KPI ID RNC_727a
Description Cell Availability, excluding blocked by user state (BLU). TheKPI gives cell availability defined as the percentage of timethe cell(s) is in working state. This KPI shows specifically theavailability on times when the cell has not been BLU.
Measurement M1000: Cell Resource
KPI formula 100* sum([M1000C178]) / sum([M1000C180] -[M1000C179])
KPI formula with short names 100* sum([AVAIL_WCELL_IN_WO_STATE]) /sum([AVAIL_WCELL_EXISTS_IN_RNW_DB] -[AVAIL_WCELL_BLOCKED_BY_USER])
KPI class Usage/Resource Availability
Unit %
Typical values >= RNC_183
Object Summary Levels Network, City, Area, RNC, Cluster of cells, Cell
Time Summary Levels Week, Day, Hour
Available Key Performance Indicators per Formula WCDMA RAN Key Performance Indicators
190 DN05191189 Issue: 08

4.4.1.3 HW Resources [%]
Ultrasite or Flexi Rel1 Baseband resources
Table 162 Average ratio of utilized CE for DL in BTS
KPI name Average ratio of utilized CE for DL in BTS
KPI abbreviation Avg R utilized CE DL BTS
KPI ID RNC_730a
Description Average ratio of utilized CE for DL in BTS [%].
Note The details of BTS CE usage and measuring of these aredescribed in the referred BTS counters document.
Measurement M5001: WBTS HW Resource Measurement
KPI formula 100* sum([M5001C7]) / sum([M5001C2])
KPI formula with short names 100* sum([AVG_USED_CE_DL]) / sum([AVE_AVAIL_CE])
KPI class Usage/HW Resources
Unit %
Typical values Depends on Traffic and CE capacity.
Object Summary Levels Network, RNC, BTS, LCG
Time Summary Levels Week, Day, Hour
Table 163 Average ratio of utilized CE for UL in BTS
KPI name Average ratio of utilized CE for UL in BTS
KPI abbreviation Avg R utilized CE UL BTS
KPI ID RNC_731a
Description Average ratio of utilized CE for UL in BTS [%].
Note The details of BTS CE usage and measuring of these aredescribed in the referred BTS counters document.
Measurement M5001: WBTS HW Resource Measurement
KPI formula 100* sum([M5001C8]) / sum([M5001C2])
KPI formula with short names 100* sum([AVG_USED_CE_UL]) / sum([AVE_AVAIL_CE])
KPI class Usage/HW Resources
WCDMA RAN Key Performance Indicators Available Key Performance Indicators per Formula
Issue: 08 DN05191189 191

Table 163 Average ratio of utilized CE for UL in BTS (Cont.)
Unit %
Typical values Depends on Traffic and CE capacity.
Object Summary Levels Network, RNC, BTS, LCG
Time Summary Levels Week, Day, Hour
NB/RSxx BTS Baseband resources need to be used in case the whole network or anarea of the network is based on NB/RSxx BTSs.
Table 164 Base Band Usage Ratio Licensing - Uplink CE - Mean
KPI name Base Band Usage Ratio Licensing - Uplink CE - Mean
KPI abbreviation BB Usg License UL CE Mean
KPI ID RNC_7001a
Description The average license related uplink channel element usageratio.
Note This KPI is relevant only for NB/RSxxx BTSs.
Measurement M92001: NodeB Resource
KPI formula avg([bbUsageRatioLicense_0_0])
KPI formula with short names avg([bbUsageRatioLicenseULCEMean])
KPI class Usage/HW Resources
Unit %
Object Summary Levels Network, RNC, BTS
Time Summary Levels Week, Day, Hour
Table 165 Base Band Usage Ratio Licensing - Downlink CE - Mean
KPI name Base Band Usage Ratio Licensing - Downlink CE - Mean
KPI abbreviation BB Usg License DL CE Mean
KPI ID RNC_7005a
Description The average license related downlink channel elementusage ratio
Note This KPI is relevant only for NB/RSxxx BTSs.
Available Key Performance Indicators per Formula WCDMA RAN Key Performance Indicators
192 DN05191189 Issue: 08

Table 165 Base Band Usage Ratio Licensing - Downlink CE - Mean (Cont.)
Measurement M92001: NodeB Resource
KPI formula avg([bbUsageRatioLicense_2_0])
KPI formula with short names avg([bbUsageRatioLicenseDLCEMean])
KPI class Usage/HW Resources
Unit %
Object Summary Levels Network, RNC, BTS
Time Summary Levels Week, Day, Hour
Flexi Rel2 Baseband resources
Table 166 Average ratio of utilized R99 CE for DL in BTS
KPI name Average ratio of utilized R99 CE for DL in BTS
KPI abbreviation Avg R util R99 CE DL BTS FlexiR2
KPI ID RNC_2277a
Description Average ratio of utilized R99 CE for DL in BTS [%].
Measurement 5006: WBTS R99 HW Resource
KPI formula 100* sum([M5006C4]) / sum([M5006C1])
KPI formula with short names 100* sum([AVG_USED_R99_CE_DL]) /sum([AVG_AVAIL_R99_CE])
KPI class Usage/HW Resources
Unit %
Object summary levels Network, RNC, BTS, LCG
Time summary levels Total; week; weeklyBH; day; dailyBH; hour
Table 167 Average ratio of utilized R99 CE for UL in BTS
KPI name Average ratio of utilized R99 CE for UL in BTS
KPI abbreviation Avg R util R99 CE UL BTS FlexiR2
KPI ID RNC_2278a
Description Average ratio of utilized R99 CE for UL in BTS [%].
WCDMA RAN Key Performance Indicators Available Key Performance Indicators per Formula
Issue: 08 DN05191189 193

Table 167 Average ratio of utilized R99 CE for UL in BTS (Cont.)
Measurement 5006: WBTS R99 HW Resource
KPI formula 100* sum([M5006C7]) / sum([M5006C1])
KPI formula with short names 100* sum([AVG_USED_R99_CE_UL]) /sum([AVG_AVAIL_R99_CE])
KPI class Usage/HW Resources
Unit %
Object summary levels Network, RNC, BTS, LCG
Time summary levels Total; week; weeklyBH; day; dailyBH; hour
Table 168 Average HSDPA Processing Sets Utilization ratio
KPI name Average HSDPA Processing Sets Utilization ratio
KPI abbreviation Avg HSDPA PS util ratio
KPI ID RNC_5407a
Description The average HSDPA Processing Sets Utilization ratio.Processing Set Utilization ratio is based on two conditions -throughput utilization and number of users. Sampling forboth conditions is constantly done and at the end of themeasurement period the highest condition percentage valueis given.
Note Retransmissions are included
Measurement 5008: WBTS level monitoring
KPI formula avg([M5008C23])
KPI formula with short names avg([AVG_HSDPA_PS_UTIL_RAT])
KPI class Usage/HW Resources
Unit %
Object summary levels Network, RNC, BTS
Time summary levels Total; week; weeklyBH; day; dailyBH; hour
Table 169 Average HSUPA Processing Sets Utilization ratio
KPI name Average HSUPA Processing Sets Utilization ratio
KPI abbreviation Avg HSUPA PS util ratio
Available Key Performance Indicators per Formula WCDMA RAN Key Performance Indicators
194 DN05191189 Issue: 08

Table 169 Average HSUPA Processing Sets Utilization ratio (Cont.)
KPI ID RNC_5408a
Description The average HSUPA Processing Sets Utilization ratio.Processing Set Utilization ratio is based on two conditions -throughput utilization and number of users. Sampling forboth conditions is constantly done and at the end of themeasurement period the highest condition percentage valueis given.
Note Retransmissions are included.
Measurement 5008: WBTS level monitoring
KPI formula avg([M5008C26])
KPI formula with short names avg([AVG_HSUPA_PS_UTIL_RAT])
KPI class Usage/HW Resources
Unit %
Object summary levels Network, RNC, BTS
Time summary levels Total; week; weeklyBH; day; dailyBH; hour
4.4.1.4 User Resource Reservation Numbers [Integer Number]
Table 170 Peak number of HSDPA users in WBTS
KPI name Peak number of HSDPA users in WBTS
KPI abbreviation Peak nr HSDPA usr in WBTS
KPI ID RNC_5117a
Description Peak Number of simultaneous HSDPA connections in oneWBTS over the reporting period.
Note In this context "HSDPA user" means a user whose HS-DSCH serving cell is located in the BTS, regardless ofwhether the uplink is Rel99 or E-DCH.
Measurement M1031: WBTS Resource
KPI formula max([M1031C0])
KPI formula with short names max([MAX_HSDPA_USERS_PER_WBTS])
KPI class Usage/Allocated Capacity
Unit #
WCDMA RAN Key Performance Indicators Available Key Performance Indicators per Formula
Issue: 08 DN05191189 195

Table 170 Peak number of HSDPA users in WBTS (Cont.)
Object Summary Levels BTS
Time Summary Levels Week, Day, Hour
Table 171 Peak number of HSUPA users in WBTS
KPI name Peak number of HSUPA users in WBTS
KPI abbreviation Peak nr HSUPA usr in WBTS
KPI ID RNC_5118a
Description Peak Number of simultaneous HSUPA connections in oneWBTS over the reporting period.
Note In this context "HSUPA user" means a user who has gothave at least one E-DCH radio link in the BTS, either in theserving radio link set, or in a non-serving radio link set.
Measurement M1031: WBTS Resource
KPI formula max([M1031C1])
KPI formula with short names max([MAX_HSUPA_USERS_PER_WBTS])
KPI class Usage/Allocated Capacity
Unit #
Object Summary Levels BTS
Time Summary Levels Week, Day, Hour
Table 172 Average number of active users with MIMO
KPI name Average number of active users with MIMO
KPI abbreviation Avg nr of act usr w MIMO
KPI ID RNC_5113a
Description Average number of users having MIMO dual stream modeactive.
Measurement M5000 - HSPA in WBTS
KPI formula [M5000C358] / sum([M5000C327])
KPI formula with short names [MIMO_D_UE_ACT_SUM] / sum([DENOM_CPC_USERS])
KPI class Usage/Allocated Capacity
Available Key Performance Indicators per Formula WCDMA RAN Key Performance Indicators
196 DN05191189 Issue: 08

Table 172 Average number of active users with MIMO (Cont.)
Unit #
Object Summary Levels Network, City, Area, RNC, Cluster of cells, Cell
Time Summary Levels Week, Day, Hour
Table 173 Average number of active DC HSDPA users
KPI name Average number of active DC HSDPA users
KPI abbreviation Avg nr of act DC HSDPA usr
KPI ID RNC_5149a
Description The average number of active DC HSDPA users using either1 or 2 Carriers.
Measurement M5000 - HSPA in WBTS
KPI formula ([M5000C329] + [M5000C328]) / [M5000C327]
KPI formula with short names ([ACTIVE_DC_HSDPA_USERS_1C_SUM] +[ACTIVE_DC_HSDPA_USERS_2C_SUM]) /[DENOM_CPC_USERS]
KPI class Usage/Allocated Capacity
Unit #
Object Summary Levels Network, City, Area, RNC, Cluster of cells, Cell
Time Summary Levels Week, Day, Hour
4.4.1.5 HSPA Scheduler resource utilization [%]
Table 174 E-DCH 2ms TTI utilization
KPI name E-DCH 2ms TTI utilization
KPI abbreviation E-DCH 2ms TTI utilization
KPI ID RNC_5106a
Description The ratio of MAC-e data received with 2 ms TTIs and totalMAC-e data received by BTS.
Measurement M5000: HSPA in WBTS
KPI formula 100*sum([M5000C322])/sum([M5000C322] + [M5000C323])
WCDMA RAN Key Performance Indicators Available Key Performance Indicators per Formula
Issue: 08 DN05191189 197

Table 174 E-DCH 2ms TTI utilization (Cont.)
KPI formula with short names 100*sum([MACE_PDU_DATA_2MS_TTI])/sum([MACE_PDU_DATA_2MS_TTI] +[MACE_PDU_DATA_10MS_TTI])
KPI class Usage/Allocated Capacity
Unit %
Object Summary Levels Network, City, Area, RNC, Cluster of cells, Cell
Time Summary Levels Week, Day, Hour
4.4.1.6 Radio layer (MAC or FP) Data Volumes [Mbit]
Table 175 HSDPA received data
KPI name HSDPA received data
KPI abbreviation HSDPA rcvd Data
KPI ID RNC_608c
Description Amount of data received in NodeB from the RNC in MAC-dPDUs multiplexed into HSDPA channels. This KPI includesoriginal data sent on MAC-ehs PDUs in the primary andsecondary cell for Multi-Carrier HSDPA.
Measurement 5000: HSPA in WBTS
5002: Cell Throughput in WBTS
KPI formula sum([M5000C126]+([M5002C128]+[M5002C129])*8) / 1000
KPI formula with short names sum([RECEIVED_HS_MACD_BITS]+([MC_HSDPA_ORIG_DATA_PRI]+[MC_HSDPA_ORIG_DATA_SEC])*8) / 1000
KPI class Usage/Throughput
Unit Mbit
Target values See BTS Product Description for maximum HSDPA cellsupported throughput.
Object summary levels Network, City, Area, RNC, Cluster of cells, Cell
Time summary levels Week, Day, Hour
The KPI RNC_5043a (see Table HSDPA MAC-d data volume at RNC) needs to be usedin case the whole network or an area of the network is based on NB/RSxx BTSs.
Available Key Performance Indicators per Formula WCDMA RAN Key Performance Indicators
198 DN05191189 Issue: 08

Table 176 Iub data volume DL in BTS
KPI name Iub data volume DL in BTS
KPI abbreviation Iub data vol DL in BTS
KPI ID RNC_5019a
Description Iub data volume in DL on BTS side for the reporting periodon Iub. The Downlink Traffic includes all Dedicated Channel(DCH) user plane + control plane FP payload (excluding FPheader data) traffic and HSDPA shared channel (HS-DSCH)FP payload (excluding FP header data) traffic between RNCand BTS.
Measurement M5003: Frame Protocol in WBTS
KPI formula sum([M5003C4] + [M5003C6] + [M5003C20])*8 / 1000
KPI formula with short names sum([CCH_DATA_FROM_IUB] + [DCH_DATA_FROM_IUB]+ [HSDSCH_DATA_FROM_IUB])*8 / 1000
KPI class Usage/Throughput
Unit Mbit
Typical values See RNC Product Description for maximum supportedthroughput.
Object Summary Levels Network, RNC, BTS, LCG
Time Summary Levels Week, Day, Hour
Table 177 Iub data volume UL in BTS
KPI name Iub data volume UL in BTS
KPI abbreviation Iub data vol UL in BTS
KPI ID RNC_5020a
Description FP layer total Iub Throughput volume UL on BTS side for thereporting period on Iub. The Uplink Traffic includes all userplane and control plane FP payload (excluding FP headerdata) traffic between RNC and BTS.
Measurement M5003: FP Layer in WBTS
KPI formula sum([M5003C3] + [M5003C5] + [M5003C7])*8 / 1000
KPI formula with short names sum([CCH_DATA_TO_IUB_INTERFACE] +[DCH_DATA_TO_IUB] + [EDCH_DATA_TO_IUB])*8 / 1000
KPI class Usage/Throughput
WCDMA RAN Key Performance Indicators Available Key Performance Indicators per Formula
Issue: 08 DN05191189 199

Table 177 Iub data volume UL in BTS (Cont.)
Unit Mbit
Typical values See RNC Product Description for maximum supportedthroughput.
Object Summary Levels Network, RNC, BTS, LCG
Time Summary Levels Week, Day, Hour
Table 178 HSDPA MAC-d data volume at BTS
KPI name HSDPA MAC-d data volume at BTS
KPI abbreviation HSDPA MAC-d DV at BTS
KPI ID RNC_739d
Description HSDPA MAC-d net throughput, which means successfullydelivered MAC-d PDU data to HSDPA Capable UEs,assuming that MAC-hs is capable of delivering the PDUs.
Note Note 1: The MAC-hs is assumed to be capable of deliveringall MAC-d PDUs to UEs. Note 2: This KPI can be used tosee the total HSDPA throughput per cell and compare theaverage value to the defined performance value. Note 3:This KPI is mainly meant for following up overall traffic.
Measurement 5000: HSPA in WBTS
5002: Cell Throughput in WBTS
KPI formula sum([M5000C126]-[M5000C127] +([M5002C128]+[M5002C129])*8) / 1000
KPI formula with short names sum([RECEIVED_HS_MACD_BITS]-[DISCARDED_HS_MACD_BITS] +([MC_HSDPA_ORIG_DATA_PRI]+[MC_HSDPA_ORIG_DATA_SEC])*8) / 1000
KPI class Usage/Throughput
Unit Mbit
Target values Depends on Traffic. KPI can be used to follow HSDPAthroughput.
Object summary levels Network, City, Area, RNC, Cluster of cells, Cell
Time summary levels Week, Day, Hour
Available Key Performance Indicators per Formula WCDMA RAN Key Performance Indicators
200 DN05191189 Issue: 08

Table 179 HS-FACH data volume downlink
KPI name HS-FACH data volume downlink
KPI abbreviation HS-FACH data vol DL
KPI ID RNC_5462a
Description Enhanced CELL-FACH data volume downlink.
Note This KPI calculates the high speed CELL_FACH User Planedata volume sent by the MAC-ehs scheduler to the UE.
Measurement 5002: Cell Throughput in WBTS
KPI formula sum([M5002C50])*8 / 1000
KPI formula with short names sum([U_DATA_VOL_DL_EFACH])*8 / 1000
KPI class Usage/Throughput
Unit Mbit
Object summary levels Network; City; Area; RNC; WBTS; Cluster of cells; Cell
Time summary levels Total; week; weeklyBH; day; dailyBH; hour
Table 180 HS-FACH data volume uplink
KPI name HS-FACH data volume uplink
KPI abbreviation HS-FACH data vol UL
KPI ID RNC_5463a
Description Enhanced CELL-FACH data volume uplink.
Note This KPI calculates the high speed CELL_FACH User Planedata volume received by the MAC-i scheduler from the UE.
Measurement 5002: Cell Throughput in WBTS
KPI formula sum([M5002C54]) * 8 / 1000
KPI formula with short names sum([U_DATA_VOL_UL_EFACH]) * 8 / 1000
KPI class Usage/Throughput
Unit Mbit
Object summary levels Network; City; Area; RNC; WBTS; Cluster of cells; Cell
Time summary levels Total; week; weeklyBH; day; dailyBH; hour
WCDMA RAN Key Performance Indicators Available Key Performance Indicators per Formula
Issue: 08 DN05191189 201

4.4.1.7 Average Radio Layer (MAC) Throughput [Mbit/s]
Table 181 HSDPA MAC-d average net throughput at BTS
KPI name HSDPA MAC-d average net throughput at BTS
KPI abbreviation HSDPA MAC-d avg thp BTS
KPI ID RNC_606d
Description HSDPA MAC-d net throughput i.e.successfully deliveredMAC-d PDU data to HSDPA Capable UEs assuming thatMAC-hs is capable of delivering the PDUs.
Note 1 The MAC-hs is assumed to be capable of delivering allMAC-d PDUs to UEs.
Note 2 This KPI can be used to see the total HSDPA throughput percell and compare the average value to defined performancevalue.
Note 3 This KPI is mainly meant for busy hour follow-up.
Measurement M5000: HSPA in WBTS
KPI formula sum([M5000C126] - [M5000C127]) /sum(PERIOD_DURATION)*1000*60
KPI formula with short names sum([RECEIVED_HS_MACD_BITS] -[DISCARDED_HS_MACD_BITS]) /sum(PERIOD_DURATION)*1000*60
KPI class Usage/Throughput
Unit Mbps
Typical values Depends on Traffic. KPI can be used to follow HSDPAthroughput.
Object Summary Levels Network, City, Area, RNC, Cluster of cells, Cell
Time Summary Levels Week, Day, Hour
Table 182 Active HS-DSCH end user throughput
KPI name Active HS-DSCH end user throughput
KPI abbreviation Act HSDPA end usr thp
KPI ID RNC_1879d
Description The average active HS-DSCH MAC-d throughput from enduser perspective, calculated as the HSDPA MAC-dthroughput at BTS, divided by the active HS-DSCH time
Available Key Performance Indicators per Formula WCDMA RAN Key Performance Indicators
202 DN05191189 Issue: 08

Table 182 Active HS-DSCH end user throughput (Cont.)
multiplied by the active users. The active time refers to thescheduled TTIs, i.e. when sending data. The active usersrefers to the number of users with data in the allocatedbuffer. Allocated buffer means that the users are scheduledor waiting to be scheduled in a TTI. The throughput islooked at from MAC-d layer, i.e. how much MAC-d leveldata the HS-DSCH is able to successfully transfer to UEsusing the scheduled TTIs, so this considers also the MAC-hs efficiency.
Note Note 1: Dual cell user is counted as a separate user in eachof the two cells.
Measurement 5000: HSPA in WBTS
5002: Cell Throughput in WBTS
KPI formula (sum([M5000C126]-[M5000C127] +([M5002C128]+[M5002C129])*8 )* 500) / sum([M5000C85])
KPI formula with short names (sum([RECEIVED_HS_MACD_BITS]-[DISCARDED_HS_MACD_BITS] +([MC_HSDPA_ORIG_DATA_PRI]+[MC_HSDPA_ORIG_DATA_SEC])*8 )* 500) /sum([HSDPA_BUFF_WITH_DATA_PER_TTI])
KPI class Usage/Throughput
Unit kbit/s
Object summary levels Network, City, Area, RNC, Cluster of cells, Cell
4.4.1.8 Active Throughput [Mbit/s]
Table 183 Active HS-DSCH cell throughput
KPI name Active HS-DSCH cell throughput
KPI abbreviation Active HS-DSCH cell thr
KPI ID RNC_722d
Description The average active HS-DSCH MAC-d cell throughput fromnetwork perspective calculated as the HSDPA MAC-dthroughput at BTS divided by the active HS-DSCH time fromthe network perspective. The active time refers to thescheduled TTIs, i.e. when sending data. The throughput islooked at from MAC-d layer, i.e. how much MAC-d level datathe HS-DSCH is able to successfully transfer to UEs usingthe scheduled TTIs, so this considers also the MAC-hsefficiency. When aggregated per BTS and higher this KPIs isstill showing average Cell throughput for all Cells.
WCDMA RAN Key Performance Indicators Available Key Performance Indicators per Formula
Issue: 08 DN05191189 203

Table 183 Active HS-DSCH cell throughput (Cont.)
Note Note 1: Dual cell user is counted as a separate user in eachof the two cells.
Measurement 5000: HSPA in WBTS
5000: HSPA in WBTS
5002: Cell Throughput in WBTS
KPI formula (sum([M5000C126]-[M5000C127]+([M5002C128]+[M5002C129])*8) * 500) / sum([M5000C69]+ [M5000C70] + [M5000C71] + [M5000C72] + [M5000C73]+ [M5000C74])
KPI formula with short names (sum([RECEIVED_HS_MACD_BITS]-[DISCARDED_HS_MACD_BITS]+([MC_HSDPA_ORIG_DATA_PRI]+[MC_HSDPA_ORIG_DATA_SEC])*8) * 500) /sum([HS_SCCH_PWR_DIST_CLASS_0] +[HS_SCCH_PWR_DIST_CLASS_1] +[HS_SCCH_PWR_DIST_CLASS_2] +[HS_SCCH_PWR_DIST_CLASS_3] +[HS_SCCH_PWR_DIST_CLASS_4] +[HS_SCCH_PWR_DIST_CLASS_5])
KPI class Usage/Throughput
Unit kbit/s
Target values See BTS Product Description for maximum HSDPA usersupported throughput
Object summary levels Network, City, Area, RNC, Cluster of cells, Cell
Table 184 Active HSUPA cell throughput
KPI name Active HSUPA cell throughput
KPI abbreviation Active HSUPA cell thp
KPI ID RNC_1883c
Description HSUPA Cell throughput by comparing the total number oftransmitted data against the total amount of activesimultaneous HSUPA user's allocation time
Measurement 1000: Cell Resource
5002: Cell Throughput in WBTS
KPI formula SUM ( [M5002C2] + [M5002C3] + [M5002C4])* 8 / SUM([M1000C272] + [M1000C273] + [M1000C274] +[M1000C275] + [M1000C276] + [M1000C277] +[M1000C278] + [M1000C279] + [M1000C280] +
Available Key Performance Indicators per Formula WCDMA RAN Key Performance Indicators
204 DN05191189 Issue: 08

Table 184 Active HSUPA cell throughput (Cont.)
[M1000C281] + [M1000C365] + [M1000C366] +[M1000C367] + [M1000C368] + [M1000C369] +[M1000C370] + [M1000C371] + [M1000C372] +[M1000C373] + [M1000C374] + [M1000C375] +[M1000C376] + [M1000C384] + [M1000C385] +[M1000C386]+ [M1000C387])
KPI formula with short names SUM ( [EDCH_DATA_SCELL_UL] +[EDCH_DATA_NSC_S_EDCH_UL] +[EDCH_DATA_NSC_NS_EDCH_UL])* 8 / SUM([DUR_HSUPA_USERS_1_OR_2] +[DUR_HSUPA_USERS_3_OR_4] +[DUR_HSUPA_USERS_5_OR_6] +[DUR_HSUPA_USERS_7_OR_8] +[DUR_HSUPA_USERS_9_OR_10] +[DUR_HSUPA_USERS_11_OR_12] +[DUR_HSUPA_USERS_13_OR_14] +[DUR_HSUPA_USERS_15_OR_16] +[DUR_HSUPA_USERS_17_OR_18] +[DUR_HSUPA_USERS_19_OR_20] +[DURA_HSUPA_USERS_21_TO_24] +[DURA_HSUPA_USERS_25_TO_28] +[DURA_HSUPA_USERS_29_TO_32] +[DURA_HSUPA_USERS_33_TO_36] +[DURA_HSUPA_USERS_37_TO_40] +[DURA_HSUPA_USERS_41_TO_44] +[DURA_HSUPA_USERS_45_TO_48] +[DURA_HSUPA_USERS_49_TO_52] +[DURA_HSUPA_USERS_53_TO_56] +[DURA_HSUPA_USERS_57_TO_60] +[DURA_HSUPA_USERS_61_TO_64] +[DURA_HSUPA_USERS_65_TO_72] +[DURA_HSUPA_USERS_73_TO_80] +[DURA_HSUPA_USERS_81_TO_96] +[DURA_HSUPA_USERS_97_TO_112]+[DURA_HSUPA_USERS_113_OR_MORE])
KPI class Usage/Throughput
Unit kbps
Object summary levels Network; City; Area; RNC; WBTS; Cluster of cells; Cell
Time summary levels Week, Day, Hour
Table 185 Average HSUPA user throughput
KPI name Average HSUPA user throughput
KPI abbreviation Avg HSUPA usr thr
KPI ID RNC_5460a
WCDMA RAN Key Performance Indicators Available Key Performance Indicators per Formula
Issue: 08 DN05191189 205

Table 185 Average HSUPA user throughput (Cont.)
Description Average HSUPA end user throughput calculated as sum ofMAC-e / MAC-i data volume updated only for serving celldivided by sum of activity time coming from all activeHSUPA users. Measured throughput from any applicationperspective (e.g. FTP) will be different then throughputmeasured by this KPI. The reasons are e.g. headersaggregation from higher layers or number of retransmission.
Measurement 5000: HSPA in WBTS
KPI formula Sum([M5000C322]+ [M5000C323])*8 /Sum(([M5000C320]/500)+ ([M5000C321]/100))
KPI formula with short names Sum([MACE_PDU_DATA_2MS_TTI]+[MACE_PDU_DATA_10MS_TTI])*8 /Sum(([MACE_PDUS_2MS_TTI]/500)+([MACE_PDUS_10MS_TTI]/100))
Formula note Weights 500 and 100 in denominator are used to calculatedactive transmission time in seconds out of TTIs.
KPI class Usage/Throughput
Unit kbit/s
Object summary levels Network, City, Area, RNC, Cluster of cells, Cell
Time summary levels Total; week; weeklyBH; day; dailyBH; hour
4.4.2 Access point level indicators for mobility
The services and resources related to the KPIs are described in Radio network in the 3Gsystem and UTRAN Resource Model overview in WCDMA RAN System Overview.
For an overview on WCDMA RAN KPIs, see Overview of WCDMA RAN keyperformance indicators.
4.4.2.1 Soft Handover Success Rate [%]
Table 186 Soft Handover Success Ratio
KPI name Soft Handover Success Ratio
KPI abbreviation SHO SR
KPI ID RNC_195a
Description Soft Handover Success Rate means branch addition, branchdeletion or branch replacement over the reporting period inthe Source Cell of the Soft Handover. It is compared howmany successful Active set updates there are compared toinitial Addition/Replacement/Deletion requests.
Available Key Performance Indicators per Formula WCDMA RAN Key Performance Indicators
206 DN05191189 Issue: 08
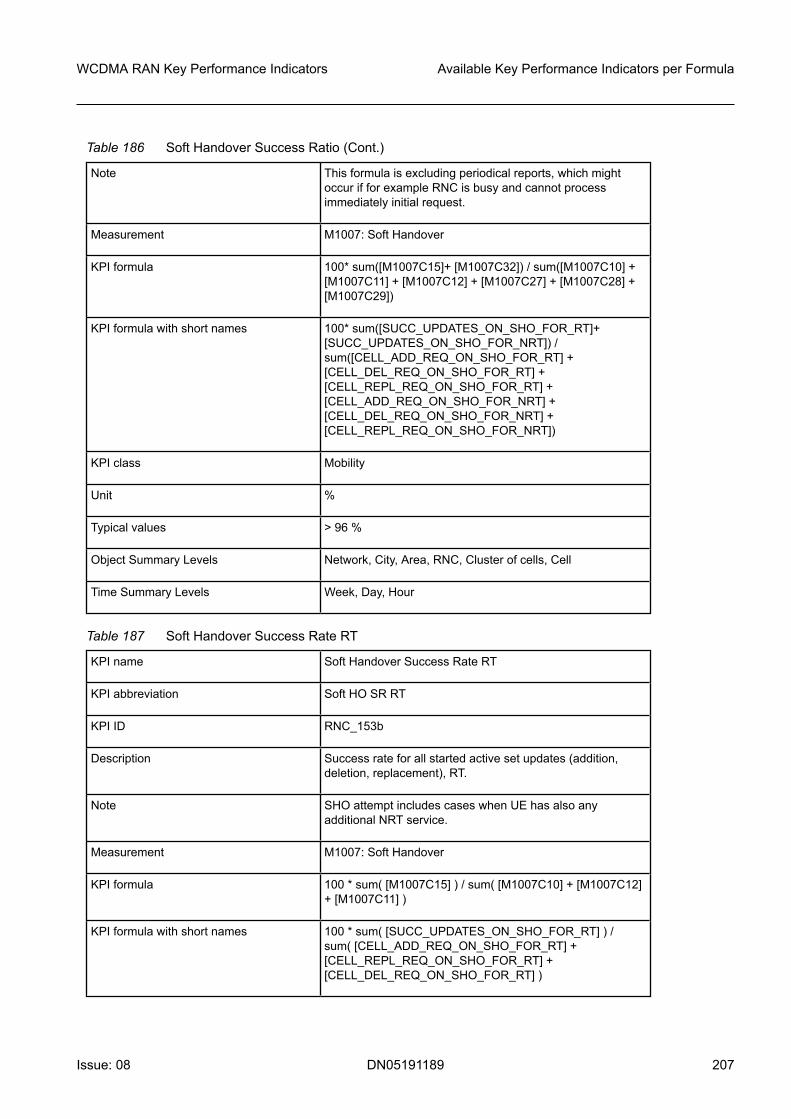
Table 186 Soft Handover Success Ratio (Cont.)
Note This formula is excluding periodical reports, which mightoccur if for example RNC is busy and cannot processimmediately initial request.
Measurement M1007: Soft Handover
KPI formula 100* sum([M1007C15]+ [M1007C32]) / sum([M1007C10] +[M1007C11] + [M1007C12] + [M1007C27] + [M1007C28] +[M1007C29])
KPI formula with short names 100* sum([SUCC_UPDATES_ON_SHO_FOR_RT]+[SUCC_UPDATES_ON_SHO_FOR_NRT]) /sum([CELL_ADD_REQ_ON_SHO_FOR_RT] +[CELL_DEL_REQ_ON_SHO_FOR_RT] +[CELL_REPL_REQ_ON_SHO_FOR_RT] +[CELL_ADD_REQ_ON_SHO_FOR_NRT] +[CELL_DEL_REQ_ON_SHO_FOR_NRT] +[CELL_REPL_REQ_ON_SHO_FOR_NRT])
KPI class Mobility
Unit %
Typical values > 96 %
Object Summary Levels Network, City, Area, RNC, Cluster of cells, Cell
Time Summary Levels Week, Day, Hour
Table 187 Soft Handover Success Rate RT
KPI name Soft Handover Success Rate RT
KPI abbreviation Soft HO SR RT
KPI ID RNC_153b
Description Success rate for all started active set updates (addition,deletion, replacement), RT.
Note SHO attempt includes cases when UE has also anyadditional NRT service.
Measurement M1007: Soft Handover
KPI formula 100 * sum( [M1007C15] ) / sum( [M1007C10] + [M1007C12]+ [M1007C11] )
KPI formula with short names 100 * sum( [SUCC_UPDATES_ON_SHO_FOR_RT] ) /sum( [CELL_ADD_REQ_ON_SHO_FOR_RT] +[CELL_REPL_REQ_ON_SHO_FOR_RT] +[CELL_DEL_REQ_ON_SHO_FOR_RT] )
WCDMA RAN Key Performance Indicators Available Key Performance Indicators per Formula
Issue: 08 DN05191189 207

Table 187 Soft Handover Success Rate RT (Cont.)
KPI class Mobility
Unit %
Typical values > 96 %
Object Summary Levels Network, City, Area, RNC, Cluster of cells, Cell
Time Summary Levels Total; week; weeklyBH; day; dailyBH; hour
Table 188 Soft Handover Success Rate NRT
KPI name Soft Handover Success Rate NRT
KPI abbreviation Soft HO SR NRT
KPI ID RNC_191b
Description Success rate for all started active set updates (addition,deletion, replacement), NRT.
Note SHO attempt excludes cases when UE has also any RTservice.
Measurement M1007: Soft Handover
KPI formula 100 * sum( [M1007C32] ) / sum( [M1007C27] + [M1007C29]+ [M1007C28] )
KPI formula with short names 100 * sum( [SUCC_UPDATES_ON_SHO_FOR_NRT] ) /sum( [CELL_ADD_REQ_ON_SHO_FOR_NRT] +[CELL_REPL_REQ_ON_SHO_FOR_NRT] +[CELL_DEL_REQ_ON_SHO_FOR_NRT] )
KPI class Mobility
Unit %
Typical values > 96 %
Object Summary Levels Network, City, Area, RNC, Cluster of cells, Cell
Time Summary Levels Total; week; weeklyBH; day; dailyBH; hour
4.4.2.2 HSPA Serving Cell Change Success Rate [%]
Table 189 HSDPA Serving Cell Change Success Rate
KPI name HSDPA Serving Cell Change Success Rate
KPI abbreviation HSDPA SCC SR
Available Key Performance Indicators per Formula WCDMA RAN Key Performance Indicators
208 DN05191189 Issue: 08

Table 189 HSDPA Serving Cell Change Success Rate (Cont.)
KPI ID RNC_733b
Description HSDPA Serving Cell Change Success Rate over thereporting period in the Source Cell.
Note Corresponding to IHSPA_5026a
Measurement 1008: Intra System Hard Handover
KPI formula 100-100* sum([M1008C217]+ [M1008C218]+[M1008C219]+ [M1008C220]+ [M1008C221]) /sum([M1008C213]+ [M1008C214]+ [M1008C215]+[M1008C216])
KPI formula with short names 100-100* sum([SCC_FAILED_DUE_TO_UE]+[SCC_FAILED_DUE_TO_BTS]+[SCC_FAILED_DUE_TO_TRANSM]+[SCC_FAILED_DUE_TO_AC]+[SCC_FAILED_DUE_TO_OTHER]) /sum([SCC_STARTED_CPICH_ECNO]+[SCC_STARTED_UL_SIR_ERROR]+[SCC_STARTED_ACTIVE_SET_UPD]+[SCC_STARTED_OTHER_REASON])
KPI class Mobility
Unit %
Target values OPEN
Object summary levels Network, RNC
Time summary levels Week, Day, Hour
Table 190 HSUPA Serving Cell Change Success Rate
KPI name HSUPA Serving Cell Change Success Rate
KPI abbreviation HSUPA SCC SR
KPI ID RNC_918b
Description HSUPA Serving Cell Success Ratio [%] for the reportingperiod in the Source Cell of the Hard Handover.
Note The HSUPA Serving Cell Change are only done when theHSDPA Serving Cell Change is needed.
Measurement M1008: Intra System Handover
KPI formula 100* sum([M1008C240] + [M1008C241]) /sum([M1008C239])
WCDMA RAN Key Performance Indicators Available Key Performance Indicators per Formula
Issue: 08 DN05191189 209

Table 190 HSUPA Serving Cell Change Success Rate (Cont.)
KPI formula with short names 100* sum([EDCH_SCC_INTRA_BTS_SUCCESS] +[EDCH_SCC_INTER_BTS_SUCCESS]) /sum([EDCH_SCC_STARTED])
KPI class Mobility
Unit %
Typical values See System Program Report.
Object Summary Levels Network, RNC
Time Summary Levels Week, Day, Hour
4.4.3 Access point level indicators for integrity
The services and resources related to the KPIs are described in Radio network in the 3Gsystem and UTRAN Resource Model overviewin WCDMA RAN System Overview.
For an overview on WCDMA RAN KPIs, see Overview of WCDMA RAN keyperformance indicators.
4.4.3.1 NRT Retransmission Ratio [%]
Table 191 NRT DCH DL Efficiency
KPI name NRT DCH DL Efficiency
KPI abbreviation NRT DCH DL Efficiency NW
KPI ID RNC_5035a
Description The efficiency of selected Background Radio Bearers inDownlink using DCH. The bit rate of once transmittedbackground RLC PDUs divided by the bit rate of alltransmitted background RLC PDUs.
Measurement M1026 RCPM RLC WCEL
KPI formula 100* avg(All NRT DCHs([M1026C15] / [M1026C12]))
KPI formula with short names 100* avg(All NRT DCHs([RLC_AM_PDU_DL_NET_TP_W] /[RLC_AM_PDU_DL_GR_TP_W]))
Formula note NRT DCHs comprise records where TRSUB_ID is'PS_NRT_data' and where CHTYP_ID is 'DCH'.
KPI class Integrity/Error rates
Unit %
Typical values Depends on the BLER target of the service
Available Key Performance Indicators per Formula WCDMA RAN Key Performance Indicators
210 DN05191189 Issue: 08

Table 191 NRT DCH DL Efficiency (Cont.)
Object Summary Levels Network, City, Area, RNC, Cluster of cells, Cell
Time Summary Levels Week, Day, Hour
Table 192 HSDPA MAC-hs efficiency
KPI name HSDPA MAC-hs efficiency
KPI abbreviation HSDPA MAC-hs efficiency
KPI ID RNC_607d
Description HSDPA Successful transmission ratio i.e. efficiency of HSDPA datatransmission between BTS and HSDPA Capable UEs done by MAC-hs.Based on successfully sent MAC-hs PDUs divided by totally sent MAC-hsPDUs. (Total number of all successful sent MAC-hs PDUs divided by totalnumber of all transmitted MAC-hs PDUs (including retransmissions)).
Measurement M5000: HSPA in WBTS
KPI formula 100*sum([M5000C0] + [M5000C1] + [M5000C2] +[M5000C3] + [M5000C4] +[M5000C5])/sum([M5000C49] +[M5000C50]+[M5000C51]+[M5000C52]+[M5000C53]+[M5000C86]+[M5000C87]+[M5000C88]+[M5000C89]+[M5000C90]+[M5000C91]+[M5000C92]+[M5000C93]+[M5000C94]+[M5000C95] +[M5000C54]+[M5000C55] + [M5000C56] + [M5000C57]+[M5000C58] + [M5000C96] +[M5000C97] + [M5000C98] +[M5000C99]+[M5000C100] +[M5000C101] +[M5000C102]+[M5000C103]+[M5000C104]+[M5000C105] +[M5000C283] +[M5000C59] + [M5000C60] + [M5000C61]+[M5000C62] + [M5000C63] + [M5000C106] +[M5000C107]+[M5000C108]+[M5000C109]+[M5000C110] +[M5000C111] +[M5000C112]+[M5000C113] +[M5000C114] +[M5000C115] +[M5000C64] + [M5000C65] +[M5000C66] + [M5000C67] + [M5000C68] +[M5000C116] +[M5000C117]+[M5000C118] +[M5000C119] +[M5000C120] +[M5000C121] +[M5000C122]+[M5000C123] +[M5000C124] +[M5000C125] +[M5000C284]))
KPI formula with short names 100*sum([MAC_HS_PDU_RETR_DIST_CL_0] +[MAC_HS_PDU_RETR_DIST_CL_1] + [MAC_HS_PDU_RETR_DIST_CL_2]+ [MAC_HS_PDU_RETR_DIST_CL_3] +[MAC_HS_PDU_RETR_DIST_CL_4] +[MAC_HS_PDU_RETR_DIST_CL_5])/sum([ORIG_TRANS_1_CODE_QPSK] + [ORIG_TRANS_2_CODE_QPSK]+ [ORIG_TRANS_3_CODE_QPSK] + [ORIG_TRANS_4_CODE_QPSK] +[ORIG_TRANS_5_CODE_QPSK] + [ORIG_TRANS_6_CODE_QPSK]+[ORIG_TRANS_7_CODE_QPSK] +[ORIG_TRANS_8_CODE_QPSK]+[ORIG_TRANS_9_CODE_QPSK] +[ORIG_TRANS_10_CODE_QPSK]+[ORIG_TRANS_11_CODE_QPSK] +[ORIG_TRANS_12_CODE_QPSK]+[ORIG_TRANS_13_CODE_QPSK] +[ORIG_TRANS_14_CODE_QPSK]+[ORIG_TRANS_15_CODE_QPSK] +[ORIG_TRANS_1_CODE_16QAM] +[ORIG_TRANS_2_CODE_16QAM] + [ORIG_TRANS_3_CODE_16QAM] +[ORIG_TRANS_4_CODE_16QAM] + [ORIG_TRANS_5_CODE_16QAM] +[ORIG_TRANS_6_CODE_16QAM] +[ORIG_TRANS_7_CODE_16QAM] +[ORIG_TRANS_8_CODE_16QAM] +[ORIG_TRANS_9_CODE_16QAM]+[ORIG_TRANS_10_CODE_16QAM] +[ORIG_TRANS_11_CODE_16QAM]+[ORIG_TRANS_12_CODE_16QAM] +[ORIG_TRANS_13_CODE_16QAM]
WCDMA RAN Key Performance Indicators Available Key Performance Indicators per Formula
Issue: 08 DN05191189 211

Table 192 HSDPA MAC-hs efficiency (Cont.)
+[ORIG_TRANS_14_CODE_16QAM] +[ORIG_TRANS_15_CODE_16QAM]+[ORIG_TRANS_MAC_EHS_64QAM] +[RETRANS_1_CODE_QPSK] +[RETRANS_2_CODE_QPSK] + [RETRANS_3_CODE_QPSK] +[RETRANS_4_CODE_QPSK] + [RETRANS_5_CODE_QPSK] +[RETRANS_6_CODE_QPSK] +[RETRANS_7_CODE_QPSK]+[RETRANS_8_CODE_QPSK] +[RETRANS_9_CODE_QPSK]+[RETRANS_10_CODE_QPSK] +[RETRANS_11_CODE_QPSK]+[RETRANS_12_CODE_QPSK] +[RETRANS_13_CODE_QPSK]+[RETRANS_14_CODE_QPSK] +[RETRANS_15_CODE_QPSK]+[RETRANS_1_CODE_16QAM] + [RETRANS_2_CODE_16QAM] +[RETRANS_3_CODE_16QAM] + [RETRANS_4_CODE_16QAM] +[RETRANS_5_CODE_16QAM] +[RETRANS_6_CODE_16QAM]+[RETRANS_7_CODE_16QAM] +[RETRANS_8_CODE_16QAM]+[RETRANS_9_CODE_16QAM] +[RETRANS_10_CODE_16QAM]+[RETRANS_11_CODE_16QAM] +[RETRANS_12_CODE_16QAM]+[RETRANS_13_CODE_16QAM] +[RETRANS_14_CODE_16QAM]+[RETRANS_15_CODE_16QAM] +[RETRANS_MAC_EHS_64QAM])
KPI class Integrity/Error rates
Unit %
Typical values Depends on radio conditions
Object Summary Levels Network, City, Area, RNC, Cluster of cells, Cell
Time Summary Levels Week, Day, Hour
The following KPI (RNC_7063a) needs to be used in case the whole network or an areaof the network is based on NB/RSxx BTSs.
Table 193 HARQ not acknowledged Ratio - Mean Value
KPI name HARQ not acknowledged Ratio - Mean Value
KPI abbreviation HARQ Non-Ack Ratio Mean
KPI ID RNC_7063a
Description The average ratio of non-acknowledged HARQ processes
Note This KPI is relevant only for NB/RSxxx BTSs.
Measurement M92003: NodeB HSDPA
KPI formula avg([hsNackRatio_0])
KPI formula with short names avg([hsNackRatioMean])
KPI class Integrity/Error rates
Unit %
Available Key Performance Indicators per Formula WCDMA RAN Key Performance Indicators
212 DN05191189 Issue: 08
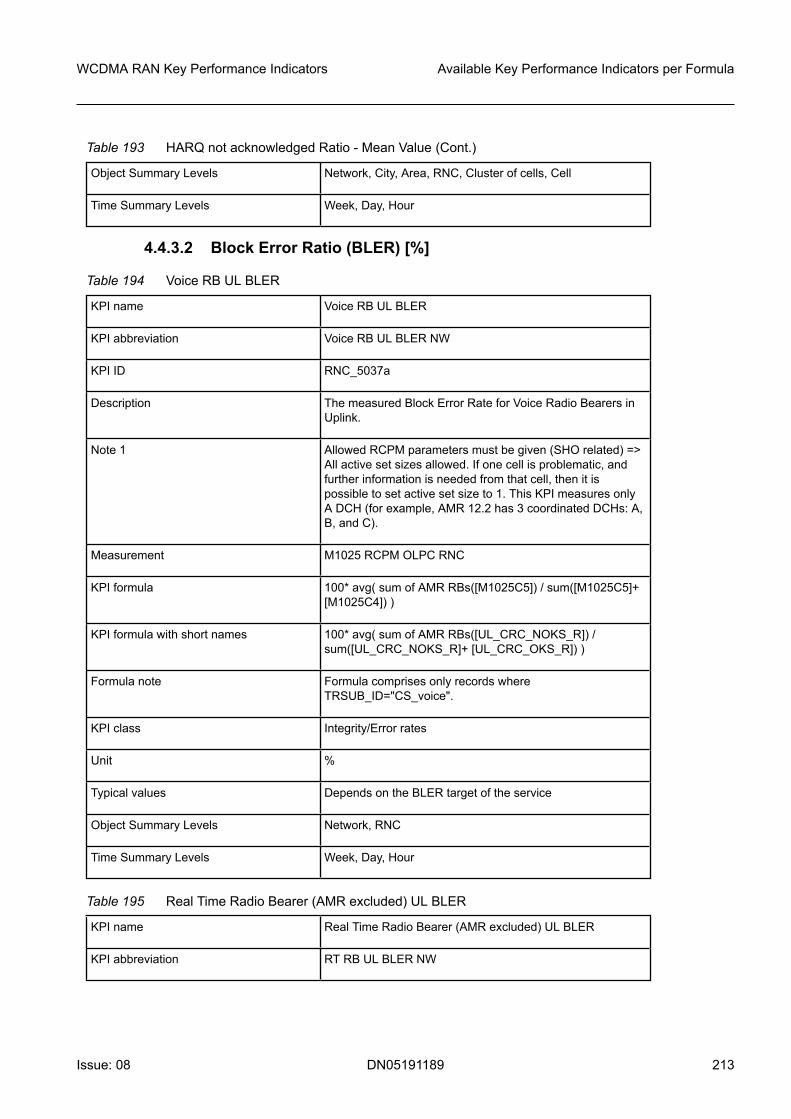
Table 193 HARQ not acknowledged Ratio - Mean Value (Cont.)
Object Summary Levels Network, City, Area, RNC, Cluster of cells, Cell
Time Summary Levels Week, Day, Hour
4.4.3.2 Block Error Ratio (BLER) [%]
Table 194 Voice RB UL BLER
KPI name Voice RB UL BLER
KPI abbreviation Voice RB UL BLER NW
KPI ID RNC_5037a
Description The measured Block Error Rate for Voice Radio Bearers inUplink.
Note 1 Allowed RCPM parameters must be given (SHO related) =>All active set sizes allowed. If one cell is problematic, andfurther information is needed from that cell, then it ispossible to set active set size to 1. This KPI measures onlyA DCH (for example, AMR 12.2 has 3 coordinated DCHs: A,B, and C).
Measurement M1025 RCPM OLPC RNC
KPI formula 100* avg( sum of AMR RBs([M1025C5]) / sum([M1025C5]+[M1025C4]) )
KPI formula with short names 100* avg( sum of AMR RBs([UL_CRC_NOKS_R]) /sum([UL_CRC_NOKS_R]+ [UL_CRC_OKS_R]) )
Formula note Formula comprises only records whereTRSUB_ID="CS_voice".
KPI class Integrity/Error rates
Unit %
Typical values Depends on the BLER target of the service
Object Summary Levels Network, RNC
Time Summary Levels Week, Day, Hour
Table 195 Real Time Radio Bearer (AMR excluded) UL BLER
KPI name Real Time Radio Bearer (AMR excluded) UL BLER
KPI abbreviation RT RB UL BLER NW
WCDMA RAN Key Performance Indicators Available Key Performance Indicators per Formula
Issue: 08 DN05191189 213

Table 195 Real Time Radio Bearer (AMR excluded) UL BLER (Cont.)
KPI ID RNC_5036a
Description The measured Block Error Rate for Conversational Class(AMR excluded) and Streaming Radio Bearers in Uplink.
Measurement M1025 RCPM OLPC WCEL
KPI formula 100* avg( (sum of Conversational (AMR excluded) RBs([M1025C5]) + sum of Streaming RBs ([M1025C5])) / (sumof Conversational (AMR excluded) RBs ([M1025C5] +[M1025C4]) + sum of Streaming RBs([M1025C5]+[M1025C5])) )
KPI formula with short names 100* avg( (sum of Conversational (AMR excluded) RBs([UL_CRC_NOKS_R]) + sum of Streaming RBs([UL_CRC_NOKS_R])) / (sum of Conversational (AMRexcluded) RBs ([UL_CRC_NOKS_R] + [UL_CRC_OKS_R])+ sum of Streaming RBs([UL_CRC_NOKS_R]+[UL_CRC_NOKS_R])) )
Formula note Formula comprises only records whereTRSUB_ID="CS_transparent" orTRSUB_ID="CS_non_transparent" orTRSUB_ID="PS_RT_data".
KPI class Integrity/Error rates
Unit %
Typical values Depends on the BLER target of the service
Object Summary Levels Network, RNC
Time Summary Levels Week, Day, Hour
Table 196 Non Real Time Radio Bearer UL BLER
KPI name Non Real Time Radio Bearer UL BLER
KPI abbreviation NRT RB UL BLER NW
KPI ID RNC_5034a
Description The measured Block Error Rate for Interactive Class andBackground Class Radio Bearers in Uplink.
Measurement M1025 RCPM OLPC RNC
KPI formula 100* avg( (sum of Interactive RBs([M1025C5]) + sum ofBackground RBs([M1025C5])) / (sum of InteractiveRBs([M1025C5]+ [M1025C4]) + sum of BackgroundRBs([M1025C5]+ [M1025C4])) )
Available Key Performance Indicators per Formula WCDMA RAN Key Performance Indicators
214 DN05191189 Issue: 08

Table 196 Non Real Time Radio Bearer UL BLER (Cont.)
Formula note Formula comprises only records where TRSUB_ID is'PS_NRT_data'.
KPI formula with short names 100* avg( (sum of Interactive RBs([UL_CRC_NOKS_R]) +sum of Background RBs([UL_CRC_NOKS_R])) / (sum ofInteractive RBs([UL_CRC_NOKS_R]+ [UL_CRC_OKS_R])+ sum of Background RBs([UL_CRC_NOKS_R]+[UL_CRC_OKS_R])) )
KPI class Integrity/Error rates
Unit %
Typical values Depends on the BLER target of the service
Object Summary Levels Network, RNC
Time Summary Levels Week, Day, Hour
Table 197 HSUPA MAC-e BLER
KPI name HSUPA MAC-e BLER
KPI abbreviation HSUPA MAC-e BLER
KPI ID RNC_917a
Description The measured Block Error Rate for HSUPA Radio Bearersin Uplink. Block Error Rate calculated based on HARQ firstand successful transmissions compared to all successfultransmissions and failed transmissions.
Measurement 5000: HSPA in WBTS
KPI formula 100-100* sum([M5000C128]) / sum([M5000C128] +[M5000C129] + [M5000C130] + [M5000C131] +[M5000C132] + [M5000C133] + [M5000C134] +[M5000C135] + [M5000C136] + [M5000C137] +[M5000C138] + [M5000C139] + [M5000C140] +[M5000C142])
KPI formula with short names 100-100* sum([MACE_PDU_RETR_00_COUNTER]) /sum([MACE_PDU_RETR_00_COUNTER] +[MACE_PDU_RETR_01_COUNTER] +[MACE_PDU_RETR_02_COUNTER] +[MACE_PDU_RETR_03_COUNTER] +[MACE_PDU_RETR_04_COUNTER] +[MACE_PDU_RETR_05_COUNTER] +[MACE_PDU_RETR_06_COUNTER] +[MACE_PDU_RETR_07_COUNTER] +[MACE_PDU_RETR_08_COUNTER] +[MACE_PDU_RETR_09_COUNTER] +[MACE_PDU_RETR_10_COUNTER] +
WCDMA RAN Key Performance Indicators Available Key Performance Indicators per Formula
Issue: 08 DN05191189 215

Table 197 HSUPA MAC-e BLER (Cont.)
[MACE_PDU_RETR_11_COUNTER] +[MACE_PDU_RETR_12_COUNTER] +[MACE_PDU_HARQ_FAIL_COUNTER])
KPI class Integrity/Error rates
Unit %
Target values Depends on the BLER target of the service
Object summary levels Network, City, Area, RNC, Cluster of cells, Cell, RB
Time summary levels Week, Day, Hour
The following KPI (RNC_7070a) needs to be used in case the whole network or an areaof the network is based on NB/RSxx BTSs.
Table 198 HSUPA HARQ not acknowledged Ratio
KPI name HSUPA HARQ not acknowledged Ratio
KPI abbreviation E-DCH HARQ Non-Ack Ratio
KPI ID RNC_7070a
Description HSUPA Hybrid Automatic Repeat Request (HARQ) notacknowledged Ratio.
Note This KPI is relevant only for NB/RSxxx BTSs.
Measurement M92004: NodeB HSUPA
KPI formula 100* avg( [edchHarqRetr_0_0] / ([edchHarqRetr_0_0] +[edchHarqRetr_1_0]) )
KPI formula with short names 100* avg( [edchHarqRetrMean] / ([edchHarqRetrMean] +[edchHarqRetrRecPDUMean]) )
KPI class Usage/HW Resources
Unit %
Object Summary Levels Network, City, Area, RNC, Cluster of cells, Cell
Time Summary Levels Week, Day, Hour
Table 199 Voice RB DL BLER
KPI name Voice RB DL BLER
KPI abbreviation Voice RB DL BLER
Available Key Performance Indicators per Formula WCDMA RAN Key Performance Indicators
216 DN05191189 Issue: 08

Table 199 Voice RB DL BLER (Cont.)
KPI ID RNC_5023a
Description The measured Block Error Rate for AMR Radio Bearers inDownlink.
Measurement M1018: RCPM UEQ
KPI formula 100* sum (AMR RBs [M1018C0])
KPI formula with short names 100* sum (AMR RBs [UEQ_AVE_BLER])
Formula note Formula comprises only records where TR_SUB_ID='CS_voice'.
KPI class Integrity/Error rates
Unit Percentage
Typical valuesTypical values Depends on the BLER target of the service
Object Summary Levels Network, City, Area, RNC, Cluster of cells, Cell, RB
Time Summary Levels Week, Day, Hour
Table 200 Real Time Radio Bearer (AMR excluded) DL BLER
KPI name Real Time Radio Bearer (AMR excluded) DL BLER
KPI abbreviation RT Radio Bearer DL BLER
KPI ID RNC_5024a
Description The measured Block Error Rate for Conversational Class(AMR excluded) and Streaming Radio Bearers in Downlink.
Measurement M1018: RCPM UEQ
KPI formula 100* sum( sum of Conversational (AMR excluded) RBs[M1018C0]) + sum of CS Streaming RBs [M1018C0])
KPI formula with short names 100* sum( sum of Conversational (AMR excluded) RBs[UEQ_AVE_BLER]) + sum of CS Streaming RBs[UEQ_AVE_BLER])
Formula note Formula comprises only records where TR_SUB_ID='CS_transparent' or 'CS_non_transparent'.
KPI class Integrity/Error rates
Unit %
WCDMA RAN Key Performance Indicators Available Key Performance Indicators per Formula
Issue: 08 DN05191189 217

Table 200 Real Time Radio Bearer (AMR excluded) DL BLER (Cont.)
Object Summary Levels Network, City, Area, RNC, Cluster of cells, Cell, RB
Time Summary Levels Week, Day, Hour
4.4.3.3 Radio interface transmission utilization [%]
Table 201 CPC efficiency
KPI name CPC efficiency
KPI abbreviation CPC efficiency
KPI ID RNC_5111a
Description CPC efficiency based on detecting discontinuous UL DPCCHtransmission.
Measurement M5000: HSPA in WBTS
KPI formula 100-100*( sum([M5000C291])/sum([M5000C292]) )
KPI formula with short names 100-100*( sum([NUMBER_OF_NON_DTX_DPCCH_SLOTS])/sum([NUMBER_OF_DPCCH_SLOTS]) )
KPI class Integrity
Unit %
Object Summary Levels Network, City, Area, RNC, Cluster of cells, Cell
Time Summary Levels Week, Day, Hour
4.4.3.4 Radio interface quality
Table 202 Average reported CQI
KPI name Average reported CQI
KPI abbreviation Avg reported CQI
KPI ID RNC_706b
Description Average reported CQI.
Note This KPI shows the average reported CQI. This is calculated bydividing all the reported CQIs dividing by the total number of reportedCQIs.
Measurement 5000: HSPA in WBTS
Available Key Performance Indicators per Formula WCDMA RAN Key Performance Indicators
218 DN05191189 Issue: 08

Table 202 Average reported CQI (Cont.)
KPI formula sum([M5000C9]+2*[M5000C10]+3*[M5000C11]+4*[M5000C12]+5*[M5000C13]+6*[M5000C14]+7*[M5000C15]+8*[M5000C16]+9*[M5000C17]+10*[M5000C18]+11*[M5000C19]+12*[M5000C20]+13*[M5000C21]+14*[M5000C22]+15*[M5000C23]+16*[M5000C24]+17*[M5000C25]+18*[M5000C26]+19*[M5000C27]+20*[M5000C28]+21*[M5000C29]+22*[M5000C30]+23*[M5000C31]+24*[M5000C32]+25*[M5000C33]+26*[M5000C34]+27*[M5000C35]+28*[M5000C36]+29*[M5000C37]+30*[M5000C38]) /sum([M5000C8]+[M5000C9]+[M5000C10]+[M5000C11]+[M5000C12]+[M5000C13]+[M5000C14]+[M5000C15]+[M5000C16]+[M5000C17]+[M5000C18]+[M5000C19]+[M5000C20]+[M5000C21]+[M5000C22]+[M5000C23]+[M5000C24]+[M5000C25]+[M5000C26]+[M5000C27]+[M5000C28]+[M5000C29]+[M5000C30]+[M5000C31]+[M5000C32]+[M5000C33]+[M5000C34]+[M5000C35]+[M5000C36]+[M5000C37]+[M5000C38])
KPI formula with short names sum([CQI_DIST_CL_1]+2*[CQI_DIST_CL_2]+3*[CQI_DIST_CL_3]+4*[CQI_DIST_CL_4]+5*[CQI_DIST_CL_5]+6*[CQI_DIST_CL_6]+7*[CQI_DIST_CL_7]+8*[CQI_DIST_CL_8]+9*[CQI_DIST_CL_9]+10*[CQI_DIST_CL_10]+11*[CQI_DIST_CL_11]+12*[CQI_DIST_CL_12]+13*[CQI_DIST_CL_13]+14*[CQI_DIST_CL_14]+15*[CQI_DIST_CL_15]+16*[CQI_DIST_CL_16]+17*[CQI_DIST_CL_17]+18*[CQI_DIST_CL_18]+19*[CQI_DIST_CL_19]+20*[CQI_DIST_CL_20]+21*[CQI_DIST_CL_21]+22*[CQI_DIST_CL_22]+23*[CQI_DIST_CL_23]+24*[CQI_DIST_CL_24]+25*[CQI_DIST_CL_25]+26*[CQI_DIST_CL_26]+27*[CQI_DIST_CL_27]+28*[CQI_DIST_CL_28]+29*[CQI_DIST_CL_29]+30*[CQI_DIST_CL_30]) /sum([CQI_DIST_CL_0]+[CQI_DIST_CL_1]+[CQI_DIST_CL_2]+[CQI_DIST_CL_3]+[CQI_DIST_CL_4]+[CQI_DIST_CL_5]+[CQI_DIST_CL_6]+[CQI_DIST_CL_7]+[CQI_DIST_CL_8]+[CQI_DIST_CL_9]+[CQI_DIST_CL_10]+[CQI_DIST_CL_11]+[CQI_DIST_CL_12]+[CQI_DIST_CL_13]+[CQI_DIST_CL_14]+[CQI_DIST_CL_15]+[CQI_DIST_CL_16]+[CQI_DIST_CL_17]+[CQI_DIST_CL_18]+[CQI_DIST_CL_19]+[CQI_DIST_CL_20]+[CQI_DIST_CL_21]+[CQI_DIST_CL_22]+[CQI_DIST_CL_23]+[CQI_DIST_CL_24]+[CQI_DIST_CL_25]+[CQI_DIST_CL_26]+[CQI_DIST_CL_27]+[CQI_DIST_CL_28]+[CQI_DIST_CL_29]+[CQI_DIST_CL_30])
KPI class Integrity
Unit %
Object Summary Levels Network, City, Area, RNC, Cluster of cells, Cell
Time Summary Levels Week, Day, Hour
WCDMA RAN Key Performance Indicators Available Key Performance Indicators per Formula
Issue: 08 DN05191189 219