10 July 2018 21st Century Fox - Credit Suisse
28
DISCLOSURE APPENDIX AT THE BACK OF THIS REPORT CONTAINS IMPORTANT DISCLOSURES, ANALYST CERTIFICATIONS, LEGAL ENTITY DISCLOSURE AND THE STATUS OF NON-US ANALYSTS. US Disclosure: Credit Suisse does and seeks to do business with companies covered in its research reports. As a result, investors should be aware that the Firm may have a conflict of interest that could affect the objectivity of this report. Investors should consider this report as only a single factor in making their investment decision. 10 July 2018 Americas/United States Equity Research Entertainment 21st Century Fox (FOXA) INITIATION Rating OUTPERFORM Price (06-Jul-18, US$) 48.93 Target price (US$) 57.00 52-week price range (US$) 49.79 - 24.97 Market cap(US$ m) 51,574 Enterprise value (US$ m) 63,638 Target price is for 12 months. Research Analysts Douglas Mitchelson 212 325 7542 [email protected] Meghan Durkin 212 325-7742 [email protected] Brian Russo 212 325 7539 [email protected] Grant Joslin 212 325 2789 [email protected] Feeding Frenzy on Fox, But What About New Fox? Top Pick in Media ■ Initiating with an Outperform rating and $57 target price, 16% upside. ■ Our Thesis: At $38/share in cash (50%) and Disney stock (50%), Disney has topped a recent Comcast offer for Fox businesses covering ~60% of EBITDA. We see the potential for bidding amongst Disney and Comcast to continue, and assume another $5/share of value will be derived from a higher bid. The remaining businesses, called New Fox for now (Fox Broadcasting, Fox News, Fox Sports), are worth another $14/share, in our view (11x P/FCF target). New Fox has high quality businesses, each with clear negotiating leverage over pay TV distributors, low entertainment advertising exposure, low capex and working capital needs and a ~$6.5b tax shield due to the Disney deal structure – we see a full $1.23/share of CY19e FCF. ■ Key Debates: At what value will the Disney/Comcast bidding end and when a deal would close (and regulatory prospects if Comcast wins); M&A/capital deployment strategy of New Fox (Is it a buyer? Seller? Capital optimizer? Back to the “Murdoch discount” days?) and, as a corollary, where the valuation for New Fox will settle out; New Fox’s affiliate pricing power vs. its sports renewals prospects (all 2022+, and especially the NFL); and digital strategy, given New Fox’s lesser scale and reliance on sports programming. ■ Catalysts: Deal bidding; NFL ratings (starts Aug.); new TV season scatter. ■ Valuation/Risks: FOXA currently trades at 12x CY19e EV/EBITDA and 23x P/E, reflective of its sale process. Our $57 CYE’18 target is derived assuming the current Disney offer ($38/shr) is increased $5/shr, plus valuing New Fox at $14/shr using our CBS target multiple (11.5x CY’19e EBITDA). Risks include deal price & timing, New Fox strategy, economic cyclicality, long-term programming costs (esp. NFL renewal), content popularity, and cord cutting. Share price performance FOXA.OQ S&P 500 INDEX Ju l- 1 7 Oct-17 Jan - 1 8 Apr-18 Ju l- 1 8 20 30 40 50 On 06-Jul-2018 the S&P 500 INDEX closed at 2759.82 Daily Jul07, 2017 - Jul06, 2018, 07/07/17 = US$27.9 Quarterly EPS Q1 Q2 Q3 Q4 2017A 0.51 0.53 0.54 0.36 2018E 0.49 0.42 0.49 0.70 2019E 0.52 0.40 0.68 0.88 Financial and valuation metrics Year 6/17A 6/18E 6/19E 6/20E EPS (CS adj.) (US$) 1.93 2.10 2.47 2.82 Prev. EPS (US$) - - - - P/E rel. (%) 118.3 132.9 123.8 120.0 Revenue (US$ m) 28,500.6 30,237.2 32,174.6 34,263.2 EBITDA (US$ m) 7,173.1 7,431.6 8,316.6 9,169.4 EV/EBITDA (current) 8.9 8.6 7.7 7.0 Net debt (US$ m) 13,750 12,065 9,432 4,975 ROIC (%) 14.27 20.08 17.24 19.13 Number of shares (m) 1,054.03 IC (current, US$ m) 30,688.00 BV/share (Next Qtr., US$) 10.7 EV/IC (x) 1.9 Net debt (Next Qtr., US$ m) 12,064.6 Dividend (current, US$) 0.95 Net debt/tot eq (Next Qtr.,%) 57.0 Source: Company data, Thomson Reuters, Credit Suisse estimates
Transcript of 10 July 2018 21st Century Fox - Credit Suisse

DISCLOSURE APPENDIX AT THE BACK OF THIS REPORT CONTAINS IMPORTANT DISCLOSURES, ANALYST CERTIFICATIONS, LEGAL ENTITY DISCLOSURE AND THE STATUS OF NON-US ANALYSTS. US Disclosure: Credit Suisse does and seeks to do business with companies covered in its research reports. As a result, investors should be aware that the Firm may have a conflict of interest that could affect the objectivity of this report. Investors should consider this report as only a single factor in making their investment decision.
10 July 2018Americas/United States
Equity ResearchEntertainment
21st Century Fox (FOXA)
INITIATION Rating OUTPERFORMPrice (06-Jul-18, US$) 48.93Target price (US$) 57.0052-week price range (US$) 49.79 - 24.97Market cap(US$ m) 51,574Enterprise value (US$ m) 63,638Target price is for 12 months.
Research AnalystsDouglas Mitchelson
212 325 [email protected]
Meghan Durkin212 325-7742
Brian Russo212 325 7539
Grant Joslin212 325 2789
Feeding Frenzy on Fox, But What About New Fox? Top Pick in Media■ Initiating with an Outperform rating and $57 target price, 16% upside.
■ Our Thesis: At $38/share in cash (50%) and Disney stock (50%), Disney has topped a recent Comcast offer for Fox businesses covering ~60% of EBITDA. We see the potential for bidding amongst Disney and Comcast to continue, and assume another $5/share of value will be derived from a higher bid. The remaining businesses, called New Fox for now (Fox Broadcasting, Fox News, Fox Sports), are worth another $14/share, in our view (11x P/FCF target). New Fox has high quality businesses, each with clear negotiating leverage over pay TV distributors, low entertainment advertising exposure, low capex and working capital needs and a ~$6.5b tax shield due to the Disney deal structure – we see a full $1.23/share of CY19e FCF.
■ Key Debates: At what value will the Disney/Comcast bidding end and when a deal would close (and regulatory prospects if Comcast wins); M&A/capital deployment strategy of New Fox (Is it a buyer? Seller? Capital optimizer? Back to the “Murdoch discount” days?) and, as a corollary, where the valuation for New Fox will settle out; New Fox’s affiliate pricing power vs. its sports renewals prospects (all 2022+, and especially the NFL); and digital strategy, given New Fox’s lesser scale and reliance on sports programming.
■ Catalysts: Deal bidding; NFL ratings (starts Aug.); new TV season scatter.
■ Valuation/Risks: FOXA currently trades at 12x CY19e EV/EBITDA and 23x P/E, reflective of its sale process. Our $57 CYE’18 target is derived assuming the current Disney offer ($38/shr) is increased $5/shr, plus valuing New Fox at $14/shr using our CBS target multiple (11.5x CY’19e EBITDA). Risks include deal price & timing, New Fox strategy, economic cyclicality, long-term programming costs (esp. NFL renewal), content popularity, and cord cutting.
Share price performance
FO XA .O Q S& P 5 0 0 IN D EX
Ju l - 1 7 O ct - 1 7 Jan - 1 8 A p r - 1 8 Ju l - 1 82 0
3 0
4 0
5 0
On 06-Jul-2018 the S&P 500 INDEX closed at 2759.82Daily Jul07, 2017 - Jul06, 2018, 07/07/17 = US$27.9
Quarterly EPS Q1 Q2 Q3 Q42017A 0.51 0.53 0.54 0.362018E 0.49 0.42 0.49 0.702019E 0.52 0.40 0.68 0.88
Financial and valuation metricsYear 6/17A 6/18E 6/19E 6/20EEPS (CS adj.) (US$) 1.93 2.10 2.47 2.82Prev. EPS (US$) - - - -P/E rel. (%) 118.3 132.9 123.8 120.0Revenue (US$ m) 28,500.6 30,237.2 32,174.6 34,263.2EBITDA (US$ m) 7,173.1 7,431.6 8,316.6 9,169.4EV/EBITDA (current) 8.9 8.6 7.7 7.0Net debt (US$ m) 13,750 12,065 9,432 4,975ROIC (%) 14.27 20.08 17.24 19.13
Number of shares (m) 1,054.03 IC (current, US$ m) 30,688.00BV/share (Next Qtr., US$) 10.7 EV/IC (x) 1.9Net debt (Next Qtr., US$ m) 12,064.6 Dividend (current, US$) 0.95Net debt/tot eq (Next Qtr.,%) 57.0Source: Company data, Thomson Reuters, Credit Suisse estimates

10 July 2018
21st Century Fox (FOXA) 2
21st Century Fox (FOXA)Price (06 Jul 2018): US$48.93; Rating: OUTPERFORM; Target Price: 57.00; Analyst: Douglas MitchelsonIncome Statement 6/17A 6/18E 6/19E 6/20ERevenue (US$ m) 28,500.6 30,237.2 32,174.6 34,263.2EBITDA (US$ m) 7,173 7,432 8,317 9,169Depr. & amort. (553) (574) (580) (580)EBIT (US$) 6,279 6,729 7,681 8,533Net interest exp (1,183) (1,205) (1,168) (1,132)PBT (US$) 4,689 5,182 6,413 7,236Income taxes (1,419) (44) (1,539) (1,737)Profit after tax 3,270 5,139 4,874 5,500Minorities (274) (290) (284) (278)Reported net income (US$) 2,996 4,849 4,590 5,221Other NPAT adjustments (586) 960 0 0Adjusted net income 3,582 3,889 4,590 5,221Cash Flow 6/17A 6/18E 6/19E 6/20ECash flow from operations 3,785 3,297 5,000 5,991CAPEX (377) (436) (386) (411)Free cashflow to the firm 3,408 2,861 4,614 5,580Cash flow from investments (752) (513) (1,296) (411)Net share issue(/repurchase) (619) 0 0 0Dividends paid (943) (1,021) (1,071) (1,123)Cashflow from financing activities (1,281) (1,019) (1,071) (1,123)Change in cash 1,767 1,811 2,633 4,457Balance Sheet (US$) 6/17A 6/18E 6/19E 6/20ECash & cash equivalents 6,163 7,932 10,565 15,022Account receivables 6,477 7,173 7,718 7,979Other current assets 545 775 654 685Total fixed assets 1,781 1,874 1,939 2,029Investment securities - - - -Total assets 50,724 55,146 57,439 62,411Total current liabilities 7,238 7,806 7,083 7,849Shareholder equity 15,722 19,913 23,185 27,681Total liabilities and equity 50,724 55,146 57,439 62,411Net debt 13,750 12,065 9,432 4,975Per share 6/17A 6/18E 6/19E 6/20ENo. of shares (wtd avg) 1,856 1,854 1,855 1,855CS adj. EPS 1.93 2.10 2.47 2.82Prev. EPS (US$)Dividend (US$) 0.51 0.55 0.58 0.61Free cash flow per share 1.84 1.54 2.49 3.01Earnings 6/17A 6/18E 6/19E 6/20ESales growth (%) 4.3 6.1 6.4 6.5EBIT growth (%) 10.2 7.2 14.1 11.1Net profit growth (%) 6.5 8.6 18.0 13.8EPS growth (%) 11.7 8.7 18.0 13.8EBITDA margin (%) 25.2 24.6 25.8 26.8EBIT margin (%) 22.0 22.3 23.9 24.9Pretax margin (%) 16.5 17.1 19.9 21.1Net margin (%) 12.6 12.9 14.3 15.2Valuation 6/17A 6/18E 6/19E 6/20EEV/EBITDA (x) 8.9 8.6 7.7 7.0P/E (x) 25.4 23.3 19.8 17.4Returns 6/17A 6/18E 6/19E 6/20EROIC (%) 14.3 20.1 17.2 19.1Gearing 6/17A 6/18E 6/19E 6/20ENet debt/equity (%) 81.2 57.0 38.6 17.2Quarterly EPS Q1 Q2 Q3 Q42017A 0.51 0.53 0.54 0.362018E 0.49 0.42 0.49 0.702019E 0.52 0.40 0.68 0.88
Company BackgroundFox is a US media and entertainment company. The company owns and operates a broadcast network and domestic cable networks.
Blue/Grey Sky Scenario
Our Blue Sky Scenario (US$) 71.00Our Blue Sky target price is based on a Sum of-the-Parts valuation of $50.50 for M&A (Disney Bid) plus $20 for New Fox. Our Blue Sky M&A value of $50.50 per share uses our $129 Blue Sky TP for Disney ($40.50 per Fox sh), and assumes Disney raises its bid by $10/sh. Our Blue Sky valuation for New Fox is $20 per share, assuming that New Fox beats expectations and trades at a premium 12x '18e EBITDA relative to CBS.
Our Grey Sky Scenario (US$) 47.00Our Grey Sky target price is based on a Sum of-the-Parts valuation of $36.67 for M&A (Disney bid) plus $10.60 for New Fox. Our Grey Sky M&A value uses our $87 Grey Sky TP for Disney ($36.67 per Fox sh) and assumes Disney does not raise its bid. Our $10.60 Grey Sky valuation for New Fox assumes that New Fox misses our expectations and trades at 9.5x '18e EBITDA, a discount to CBS shares.
Share price performance
FO XA .O Q S& P 5 0 0 IN D EX
Ju l - 1 7 O ct - 1 7 Jan - 1 8 A p r - 1 8 Ju l - 1 82 0
3 0
4 0
5 0
On 06-Jul-2018 the S&P 500 INDEX closed at 2759.82Daily Jul07, 2017 - Jul06, 2018, 07/07/17 = US$27.9
Source: Company data, Thomson Reuters, Credit Suisse estimates

10 July 2018
21st Century Fox (FOXA) 3
Table of ContentsExecutive Summary 4
Investment Thesis in Charts 6
Valuation 9
Forecast Summary 14
PEERs 16
Financial Statements 17
Appendix 20
Risks 24

10 July 2018
21st Century Fox (FOXA) 4
Executive SummaryThe two key factors for 21st Century Fox’s stock price at this point are whether Comcast will come back and outbid Walt Disney for the majority of the Fox businesses that are for sale and at what price the New Fox split-off businesses will trade. It is difficult to ascertain the maximum amount that Disney or Comcast would be willing to commit to a Fox acquisition. Both have strong balance sheets, and both have compelling strategic rationales:
■ In the case of Disney, acquiring Fox would elevate Disney into the leading position in TV and film content by a wide margin, boosting its ability to take on Netflix in global direct-to-consumer streaming. Disney’s streaming ambitions would also be enhanced by Fox’s direct-to-consumer platforms in India (Hotstar) and Europe (via Sky PLC). How much is it worth to Disney to lock in its future as a global streaming leader?
■ For Comcast, it would enhance its media growth prospects (international growth, synergies and scale) and would diversify away from its U.S. pay TV business (for which growth has slowed), while doing so using low cost of capital cash/debt. (Its last bid was 100% cash.) As important, in our view, Comcast would be stopping Disney from buying Fox -- Disney’s recent strategic pivot to launching direct-to-consumer streaming services will likely, in our view, start to undermine Comcast’s (and the whole industry’s) pay TV bundles over time. With Fox, Disney would be in a position to pursue that initiative from much greater scale and likely much more aggressively. How much is it worth for Comcast to improve its growth profile, diversify its revenues and protect its core traditional pay TV business model?
Disney’s bid for Fox has already hit 15x EV/EBITDA (CY18e, pre-synergies), a price level at which its balance sheet and Comcast’s are becoming stretched. Disney also garnered matching rights in its last approved Fox bid and the Disney/Fox deal has already received DoJ and FTC regulatory approval. Fox and Disney have set July 27 as the date for shareholder votes on the deal. All this would seem to position Disney as the clear front runner to win Fox. At the same time, we would be surprised if Comcast’s first public offer was its best and final. In determining our target price for FOXA, we assumed that the bidding would move another $5/share higher, adding another $9.4b to the deal cost. It is quite possible that bidding becomes even more aggressive, and it is also possible that Comcast decides any further bidding would be futile.
With regard to New Fox’s value, analysis at this stage is fueled by pro formas and other disclosures in the Disney June 28th proxy filing that suggest, to us, the market is undervaluing New Fox’s growth prospects and FCF generation. In fact, we think New Fox will deserve the moniker of FCF Machine, something that we have not used for media companies in quite some time due to their working capital investments in ramping content. (New Fox is shedding all of its working capital intensive businesses.)
Our preliminary forecast shows a 6% revenue CAGR and 8% EBITDA CAGR FY18e-FY22e, putting New Fox at the top of the Media sector (right with CBS).
First, New Fox will be comprised of Fox News (roughly $3b of revenue, almost $2b of EBITDA), Fox Sports cable networks (roughly $2.25b of revenue and $350m of EBITDA) and Fox Broadcasting (essentially the existing Television segment, roughly $5b of revenue and $400m of EBITDA, with the Fox network modestly unprofitable and its TV stations generating all of the profit). New Fox will have just under $200m of corporate expense, leading to FY18e EBITDA of ~$2.42b.
For affiliate revenue, New Fox should have clear negotiating leverage over pay TV distributors given the importance of Fox News, Fox Sports networks and Fox Broadcast content to the bundle. This has been evidenced by strong renewal after strong renewal, even as these networks often negotiated renewals on a stand-

10 July 2018
21st Century Fox (FOXA) 5
alone basis without the need to bundle to firm up their position. Fox is also adding the Thursday Night Football package this fall under its 5-year deal with the NFL, which should create incremental pricing power. We expect a 10% total company affiliate revenue growth CAGR the next 4 years off its $5b FY18e base.
For advertising, we expect its ~$4.6b to remain flatish, outside its acquisition of TV stations from Sinclair (FY19/20) and new sports rights like the WWE (FY20).
Beyond Thursday Night Football, the Sinclair acquisition and WWE addition, cost growth will be relatively restrained with its long-term sports deals ($3b of its $4.8b of programming costs) amortizing at ~4%.
Net debt should be $6b at the time of split-off, estimated December 31st, 2018 (the Disney deal still needs numerous foreign regulatory approvals). The only minority to consider is the 49% of the Big Ten Network owned by the Big Ten, which is modest in value. We did not consider other assets, like New Fox’s continued ownership of its studio lot in L.A.
Importantly, New Fox will have a $433m/year tax reduction for 15 years due to the structure of the Disney deal. Given this annual tax reduction and the lack of working capital increases mentioned previously, we estimate $1.23 of FCF/share (using the current FOXA share count) for CY19, growing to $1.43 in CY20e.
We expect investors will naturally compare New Fox to CBS, both being broadcast network-focused and having similar long-term growth rates, though New Fox does not currently have the management uncertainty evident at CBS. Similarly, both New Fox and CBS are controlled companies and it is unclear if they will participate in sector consolidation anytime soon, but the asset value for both has risen dramatically the past two years given the elevated M&A multiples for Time Warner and Fox, and the AT&T/Time Warner lawsuit win over the DoJ potentially expanding the list of acquirers that could receive regulatory approval to buy either company. Lastly, both are reliant on sports programming, in particular the NFL, though both have sufficient scale in sports and the Sunday afternoon packages run through the 2022-23 season.
Our target for CBS implies 11.5x EV/EBITDA and 14x P/FCF. Applying those multiples to our CY19 New Fox estimates yields $14.40/share and $17.20/share, respectively, of value for New Fox. We are using the EV/EBITDA output of $14.40/share in our FOXA target price methodology to be conservative, but we would not be surprised to see investors gravitate towards a FCF valuation for New Fox given the unusual nature of its 15 year tax asset from the Disney deal. By our estimates, New Fox would be debt free in about two years if management choses to just pay down debt with FCF.
Concerns for New Fox will be advertising exposure, although it will be heavily weighted to sports and news advertising (in theory, with less secular headwinds); sourcing content for Fox Broadcast without an in-house TV studio anymore; digital and capital deployment strategies; and whether owning Fox News will hamper access to Hollywood talent or a sale of a company if the Murdochs went in that direction. (For example, AT&T owns CNN, which would create regulatory and cultural issues were it to pursue a New Fox acquisition.)
Overall our $57 target for FOXA constitutes Disney’s $38/share offer, an assumption of an additional $5/share from increased bids, plus our $14/share target price for New Fox. With 16% upside potential to our $57 target price, we are initiating 21st Century Fox with an Outperform rating and as our Top Pick within the Media sector.

10 July 2018
21st Century Fox (FOXA) 6
Investment Thesis in ChartsFigure 1: New Fox and bidding upside are being undervalued, in our view
Cash from Disney$19.00
Cash from Disney$19.00
Disney stock$19.00
Disney stock$19.00
New Fox$10.93
New Fox$14.00
Bid Raise $5.00
$-
$10
$20
$30
$40
$50
$60
FOXA Current $48.93 FOXA Target $57.00
FOXA price components -- Current and at CS target
Source: Company data, Credit Suisse estimates.
Figure 2: At the current Disney offer level, we show New Fox trading at 10x CY19e FCF. At a $5/Shr bid increase, New Fox Is <6x
New Fox Valuation / Target Price AnalysisNew Fox Implied ValuationImplied New Fox price Current Bid $5/Shr Bid Increase
FOXA stock price as at 7/6/18 48.93$ 48.93$ Less: Current Disney offer 38.00 38.00Less: expected offer increase 0.00 5.00Plus: Arbitrage spread (@ 6% Annual) (1.14) (1.14)
New Fox implied value 12.07$ 7.07$
New Fox Ratios at current implied priceFully diluted shares 1,855 1,855Equity Value at implied price 22,384$ 13,112$
Net Debt, 12/31/18 5,900$ 5,900$ Big-10 Minority 226 226
New Fox Implied EV 28,510$ 19,237$
New Fox CY19e EBITDA 2,858$ 2,858$ Implied New Fox EV/EBITDA 10.0x 6.7x
CY19e FCF/Share 1.23$ 1.23$ Implied New Fox P/FCF 9.8x 5.7x
Fox Deal Value at CS Disney Target PriceDisney CYE'18 CS Target Price 114.00$ Value at DIS Target, Limited By Collar 114.00$ Collar is $93.53 to $114.32Resulting Fox Shares per DIS Share 0.1667Disney Shares Issued To FOXA 309 Shares Issued
Stock Bid Value / Fox Share 19.00$ Cash Portion Per FOXA Share 19.00$ 50% of Deal Price
Total Value @ CS Disney Target 38.00$
Source: Company data, Credit Suisse estimates.

10 July 2018
21st Century Fox (FOXA) 7
Figure 3: New Fox will be a “Free Cash Flow Machine”…
46.0%53.7% 53.7%
58.4%62.1% 65.5%
83.0%
DIS CBS Media DISCA FOXA VIAB New FOX
Media Group CY19E EBITDA as a % of FCF
Source: Company data, Credit Suisse estimates
Figure 4: Very strong affiliate leverage & little entertainment ad exposure
Affiliate Leverage
Entertainment Advertising Exposure
(FY19E)Fox Broadcasting Very Strong 32.6%Fox News Very Strong 0.0%Fox National Sports Nets Strong 0.0%
New Fox Very Strong 16.7%
Source: Company data, Credit Suisse estimates
Figure 5: Overall, we see leading top-line growth prospects,
6.0%5.3%
4.7%
3.1%3.8%
2.2%1.7%
0.0%
1.0%
2.0%
3.0%
4.0%
5.0%
6.0%
7.0%
New Fox CBS DIS DISCA NBCU TW VIAB
Revenue CAGR, CY'18e-CY'22e
Source: Company data, Credit Suisse estimates.

10 July 2018
21st Century Fox (FOXA) 8
Figure 6: and fairly stable margins despite reliance on sports content…
23% 23%
29%
38%
25%29%
24%24% 24%27%
38%
25%29%
24%
0%
5%
10%
15%
20%
25%
30%
35%
40%
45%
New Fox CBS DIS DISCA NBCU TW VIAB
EBITDA Margins, CY'18e and CY'22eCY'18e
CY'22e
Source: Company data, Credit Suisse estimates.
Figure 7: …yielding strong EBITDA growth prospects
7.7%8.2%
3.3%
4.9%4.1%
2.0% 2.3%
0.0%
1.0%
2.0%
3.0%
4.0%
5.0%
6.0%
7.0%
8.0%
9.0%
New Fox CBS DIS DISCA NBCU TW VIAB
EBITDA CAGR, CY'18e-CY'22e
Source: Company data, Credit Suisse estimates.
Figure 8: Also, New Fox will de-lever rapidly, allowing flexibility for capital return
2.7x
1.9x
0.8x
0.0x
-0.8x
FY18E FY19E FY20E FY21E FY22E
New Fox Debt Leverage
Source: Company data, Credit Suisse estimates.

10 July 2018
21st Century Fox (FOXA) 9
ValuationTotal FOXA currently trades at 12x CY19e EV/EBITDA and 23x P/E, reflective of its partial sale M&A process. Our $57 CYE’18 target price is derived via the $38/share Disney deal being valued at our Disney target price (our $114 Disney target is within the deal collar, leaving the stock value in-line with the accepted offer), adding $5/shr based on our assumption that there will be another round of bidding by Comcast and Disney, plus the value of New Fox using our CBS target 11.5x EBITDA multiple (another $14/shr). Note: Every +/-100bp change in EV/EBITDA for New Fox affects our target price by ~$1/share.
Figure 9: FOXA Valuation Analysis
MMs, except per share FY18E FY19E FY20E FY21E FY22E FY23E '19-'23Closing Price on:
Class A 48.93$ 48.93$ 48.93$ 48.93$ 48.93$ 48.93$ Class B 48.62$ 48.62$ 48.62$ 48.62$ 48.62$ 48.62$
Fully Diluted Shares, EOP 1,858 1,858 1,858 1,858 1,858 1,858Public Equity Value 90,642 90,642 90,643 90,643 90,643 90,643
Debt, EOP 19,997 19,997 19,997 19,997 19,997 19,997Less: Cash, EOP (7,932) (10,565) (15,022) (19,706) (24,905) (29,981) 29.8%Net Debt, EOP 12,065 9,432 4,975 291 (4,908) (9,984)
• Gross Leverage 3 2 2 2 2 2
• Net Leverage 2 1 1 0 (0) (1)
Investments / JVs (15,898) (16,534) (17,196) (17,884) (18,599) (19,343) 4.0%Minority Stakes in Cons. Entities 2,562 2,664 2,771 2,881 2,997 3,117 4.0%Option proceeds 0 0 0 0 0 0Total Hidden Value (13,337) (13,870) (14,425) (15,002) (15,602) (16,226) 4.0%
Enterprise Value 89,370 86,204 81,192 75,931 70,133 64,433 -7.0%
EBITDA, Reported 7,432 8,316 9,169 9,869 10,465 10,014 4.8%Add: Stock Comp ExpenseOther AdjustmentsEBITDA, CS 7,432 8,316 9,169 9,869 10,465 10,014 4.8%
• Consensus EBITDA
EV / EBITDA Multiple 12.0x 10.4x 8.9x 7.7x 6.7x 6.4x• At CS Target Price
EPS, Reported $2.62 $2.47 $2.82 $3.17 $3.46 $3.31 7.5%Adjustments (0.52) 0.00 0.00 0.00 0.00 0.00EPS, CS $2.10 $2.47 $2.82 $3.17 $3.46 $3.31 7.5%
• Consensus EPS $1.93 $2.23 $2.54 $2.88 $3.24
P/E Multiple 23.3x 19.8x 17.4x 15.4x 14.1x 14.8x• At CS Target Price 22.4x 19.0x 16.7x 14.8x 13.6x 14.2x
Free Cash Flow 2,861 4,614 5,580 5,864 6,437 6,376 8.4%
FCF per Share $1.54 $2.49 $3.01 $3.16 $3.47 $3.44 8.4%FCF Yield 3.2% 5.1% 6.2% 6.5% 7.1% 7.0%FCF Multiple 31.7x 19.7x 16.3x 15.5x 14.1x 14.2x
Source: Company data, Credit Suisse estimates.

10 July 2018
21st Century Fox (FOXA) 10
Figure 10: FOXA Valuation Perspectives
$1.50
$2.00
$2.50
$3.00
$3.50
$20
$25
$30
$35
$40
$45
$50
Jun '14 Dec '14 Jun '15 Dec '15 Jun '16 Dec '16 Jun '17 Dec '17
Pro
ject
ed E
PS
Sha
re P
rice
21st Century Fox Share Price and Earnings Revisions
Stock Price F2016e EPS F2017e EPS F2018e EPS F2019e EPS5x
7x
9x
11x
13x
15x
17x
19x
21x
Jun '08 Jun '09 Jun '10 Jun '11 Jun '12 Jun '13 Jun '14 Jun '15 Jun '16 Jun '17 Jun '18
21st Century Fox 1-Yr Forward P/E
10-Yr Avg 13.6x
±1 Std Dev
Media P/E ex-FOXA
VIAB
VZ
FOXA*
DIS
T
CMCSACBS
DISCA
GOOGLFB
SIRI
AMCX*
TMUS*
ATVI
EA
0x
5x
10x
15x
20x
25x
30x
-5% 0% 5% 10% 15% 20% 25% 30%
Forw
ard
P/E
3-YR EPS CAGR '18e-'21e
Media and Telecom PEGPEG=1
*Consensus EPS and Growth
Source: Company data, Credit Suisse estimates, Thomson Reuters.

10 July 2018
21st Century Fox (FOXA) 11
Figure 11: FOXA Sum of the Parts$MMs, except per share data EBITDA EBITDA Per % of
Revenue EBITDA Margin CAGR Mult Value Share Total Valuation Methodology
Fox Sum-of-the-Parts AnalysisNEW FOX
Fox News 2,978 2,093 70% 10.0x 20,935 11$ 20% Comp to DISCA-SNI acquisition multiple 10xNational Sports 2,466 425 17% 12.0x 5,100 3 5% Includes 100% of Big Ten Network
Total Cable Networks 5,444 2,518 46% 7% 10.3x 26,035 14$ 24%Fox broadcast network 3,910 (198) -5% 7,500 4 7% CS asset value estimateFox O&O stations 1,904 667 35% 9.0x 6,001 3 6% TV station M&A multiples
Total Television 5,814 469 8% 19% 28.8x 13,501 7$ 13% CBS EV/EBITDA multipleCorporate Functions (276) (94) 34% 3% 6.0x (561) (0) -1% Multiple based on growthBig Ten Network Minority (49%) (226) (0) 0% Values based disclosures in Proxy
Total Asset Value 10,982 2,894 26% 9% 13.4x 38,748 21$ 36% Consistent with 12x Disney/Fox multipleNet Debt (5,900) (3)
Net Equity Value 32,849 18$ 32%
SOLD FOXRSNs 4,358 1,891 43% 8.0x 15,128 8$ 14% Based on Disney / Fox multipleYES Network (100%) 358 11.2x 4,000 2 4% Based on estimated valuation for call option by MinoritiesFx / NatGeo (100%) 3,550 774 22% 10.0x 7,744 4 7% Based on Disney / Fox multiple; includes 100% of Nat Geo with est. EBITDA $325MStar 3,089 541 18% 25.0x 13,513 7 13% Based on Disney / Fox multipleFox International 2,897 1,085 37% 10.0x 10,845 6 10% Based on Disney / Fox multiple
Total Cable Networks 13,894 4,648 33% 11.0x 51,229 28$ 48%Filmed Entertainment 8,403 1,144 14% 18.0x 20,589 11 19% Based on LGF EV/EBITDA 13.5x and DIS film 15.5xNatGeo Minority (27%) (88) 10.0x (879) (0) -1% Based on Disney / Fox multipleYES Network minority (20%) (72) 11.2x (800) (0) -1% Based on estimated valuation for call option by MinoritiesCorporate Functions (1,243) (417) 34% 6.0x (2,501) (1) -2% Multiple based on growth
Total Asset Value 21,054 5,216 25% 13.0x 67,639 36$ 64% Consistent with 12x CY18e Disney/Fox multipleNet Debt (12,065) (6)$ "New Fox" tax payment to Disney, net of tax liability created -Hulu stake (500) minority loss 2,250 1 2% 30%-owned x TWX $6b purchase price implied + 25% per ProxySky stake Shares 667 Price £13.51 12,073 6 11% Valued at 6/11/18 closing price as it exceeds £12.50 Comcast bid Other 200 0 0% Disney valuation of minorities
Total JVs 14,523 8$ 14%Net Equity Value 70,098 38$ 68% 1,858 million shares outstanding
TOTAL FOXTOTAL ASSET VALUE 32,036 8,110 25% 8% 13.1x 106,388 57$ Net Debt plus Minorities Net Value (3,441) (2) Fox Sum-of-the-Parts Equity Value 102,947 55$
FY19e
Source: Company data, Credit Suisse estimates.

10 July 2018
21st Century Fox (FOXA) 12
Target Price/Scenario Analysis■ Blue Sky ($71 Target Price): Our $71 Blue Sky target price is based on a Blue Sky
Sum-of-the-Parts valuation of $50.50 for M&A (Disney Bid) plus $20 for New Fox. Our Blue Sky M&A value of $50.50 per share uses our $129 Blue Sky target price for Disney ($40.50 per Fox share), and assumes Disney raises its bid by $10 per share. Our Blue Sky valuation for New Fox is $20 per share, assuming that New Fox beats our expectations and trades at a premium to CBS shares (CS Target 11.5x CY18E EV/EBITDA). We raise our CY18E EBITDA by 5% ($3.001b vs CSe $2.858b) and apply a premium multiple of 14.5x EBITDA resulting in a Blue Sky valuation of $20 per share for New Fox.
■ Grey Sky ($47 Target Price): Our $47 Grey Sky target price is based on a Grey Sky Sum-of-the-Parts valuation of $36.67 for M&A (Disney bid) plus $10.60 for New Fox. Our Grey Sky M&A value uses our $87 Grey Sky target price for Disney (which equates to $36.67 per Fox share) and assumes Disney does not raise its bid. Our Grey Sky valuation for New Fox assumes that New Fox misses our expectations and trades at a discount to CBS (CS Target 11.5x CY18E EV/EBITDA). We lower our New Fox CY18E EBITDA by 5% ($2.715b vs CSe $2.858b) and apply a discount multiple of 9.5x EBITDA, resulting in a Grey Sky valuation of $10.60 per share for New Fox.
Figure 12: New Fox Target Price AnalysisFOXA Target Price
Base Case Blue Skies Grey SkiesDisney Value @ Disney Target Price 38.00$ Current Deal 40.50$ At DIS Blue Sky 36.67$ At DIS Grey SkyExpected increase in Bid 5.00$ Assume Increase 10.00$ Large bid increase -$ No bid increase
Total M&A Value 43.00$ 50.50$ 36.67$ % of Total Value 75% 73% 80%
New Fox valueNew Fox CY19e EBITDA 2,858$ CS Estimate 3,001$ +5% 2,715$ -5%EV/EBITDA Multiple 11.5x At CBS Target 14.5x Premium to CBS 9.5x Discount to CBSNew Fox EV 32,866$ 43,512$ 25,793$
Net Debt, 12/31/18 (5,900) (5,900) (5,900)Big-10 Minority (226) (226) (226)
New Fox Equity Value 26,741$ 37,386$ 19,667$ New Fox Shares Out 1,855 1,855 1,855New Fox Share Price 14.42$ 20.16$ 10.60$ EV/EBITDA-based Target 57.00$ 71.00$ 47.00$
New Fox CY19e FCF/Share 1.23$ CS Estimate 1.35$ +10% 1.11$ -10%P/FCF Multiple 11.0x Discount to CBS Tar. 14.0x At CBS Target 8.0x Discount to CBS
New Fox Price 13.55$ 18.96$ 8.87$ P/FCF-based Target 57.00$ 69.00$ 46.00$
Current FOXA Stock Price 48.93$ 48.93$ 48.93$ % Difference to Target 16% 41% -6%
Source: Company data, Credit Suisse estimates
10 July 2018
21st Century Fox (FOXA) 13
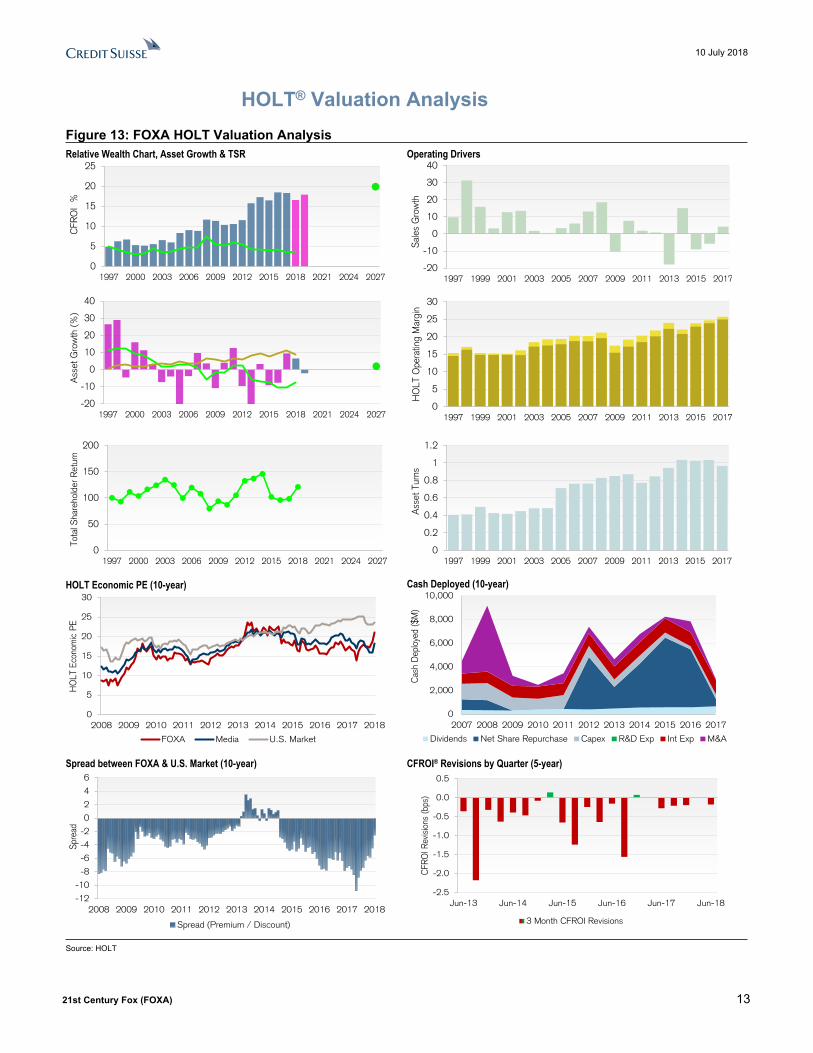
HOLT® Valuation AnalysisFigure 13: FOXA HOLT Valuation AnalysisRelative Wealth Chart, Asset Growth & TSR
0
5
10
15
20
25
1997 2000 2003 2006 2009 2012 2015 2018 2021 2024 2027
CFR
OI
%
Operating Drivers
-20
-10
0
10
20
30
40
1997 1999 2001 2003 2005 2007 2009 2011 2013 2015 2017
Sal
es G
row
th-20
-10
0
10
20
30
40
1997 2000 2003 2006 2009 2012 2015 2018 2021 2024 2027
Ass
et G
row
th (
%)
0
5
10
15
20
25
30
1997 1999 2001 2003 2005 2007 2009 2011 2013 2015 2017H
OLT
Ope
ratin
g M
argi
n
0
50
100
150
200
1997 2000 2003 2006 2009 2012 2015 2018 2021 2024 2027
Tota
l Sha
reho
lder
Ret
urn
0
0.2
0.4
0.6
0.8
1
1.2
1997 1999 2001 2003 2005 2007 2009 2011 2013 2015 2017
Ass
et T
urns
HOLT Economic PE (10-year)
0
5
10
15
20
25
30
2008 2009 2010 2011 2012 2013 2014 2015 2016 2017 2018
HO
LT E
cono
mic
PE
FOXA Media U.S. Market
Cash Deployed (10-year)
0
2,000
4,000
6,000
8,000
10,000
2007 2008 2009 2010 2011 2012 2013 2014 2015 2016 2017
Cas
h D
eplo
yed
($M
)
Dividends Net Share Repurchase Capex R&D Exp Int Exp M&A
Spread between FOXA & U.S. Market (10-year)
-12
-10
-8
-6
-4
-2
0
2
4
6
2008 2009 2010 2011 2012 2013 2014 2015 2016 2017 2018
Spre
ad
Spread (Premium / Discount)
CFROI® Revisions by Quarter (5-year)
-2.5
-2.0
-1.5
-1.0
-0.5
0.0
0.5
Jun-13 Jun-14 Jun-15 Jun-16 Jun-17 Jun-18
CFR
OI R
evisi
ons
(bps
)
3 Month CFROI Revisions
Source: HOLT

10 July 2018
21st Century Fox (FOXA) 14
Forecast SummaryFigure 14: Credit Suisse vs. Street Estimates
CS FORECAST VS. STREET
MMs, except EPS F4Q18E FY18E FY19E FY20E CAGRRevenue CS 7,724 30,183 31,979 34,245 6.5%
Consensus 7,530 29,956 31,825 33,706 6.1%
Adj. EBITDA CS 1,899 7,022 7,438 8,354 9.1%Consensus 1,915 7,033 7,669 8,192 7.9%
EPS CS 0.54$ 1.94$ 2.11$ 2.48$ 13.2%Consensus 0.55$ 1.93$ 2.23$ 2.54$ 14.7%
FCF CS 1,359 3,218 4,247 4,650 20.2%Consensus 762 3,522 4,026 4,389 11.6%
Source: Company data, Credit Suisse estimates, Thomson Reuters.

10 July 2018
21st Century Fox (FOXA) 15
Figure 15: FOXA Forecast Summary$ in MMs ex per sub and share F1Q17 F2Q17 F3Q17 F4Q17 F1Q18 F2Q18 F3Q18E F4Q18E FY14 FY15 FY16 FY17 FY18E FY19E FY20E '14-'18 '18-'23
CONSOLIDATED FOXRevenue 6,506 7,682 7,564 6,748 7,002 8,037 7,420 7,724 26,061 26,952 27,326 28,500 30,183 31,979 34,245 3.7% 5.9%
% Y/Y 7.1% 4.2% 4.7% 1.5% 7.6% 4.6% -1.9% 14.5% -5.8% 3.4% 1.4% 4.3% 5.9% 6.0% 7.1%
OpEx 4,730 5,704 5,641 5,317 5,229 6,624 5,540 5,839 19,855 20,544 20,804 21,392 23,232 24,597 25,947 4.0% 5.2%
% Y/Y 3.7% 0.8% 5.1% 1.9% 10.6% 16.1% -1.8% 9.8% -7.7% 3.5% 1.3% 2.8% 8.6% 5.9% 5.5%
EBITDA 1,791 1,994 1,938 1,450 1,791 1,438 1,894 1,899 6,291 6,488 6,597 7,173 7,022 7,438 8,354 2.8% 7.8%
% Y/Y 16.7% 15.3% 3.0% -0.1% 0.0% -27.9% -2.3% 30.9% 0.5% 3.1% 1.7% 8.7% -2.1% 5.9% 12.3%
% Margin 27.5% 26.0% 25.6% 21.5% 25.6% 17.9% 25.5% 24.6% 24.1% 24.1% 24.1% 25.2% 23.3% 23.3% 24.4%
EPS 0.51$ 0.53$ 0.54$ 0.36$ 0.49$ 0.42$ 0.49$ 0.54$ 1.65$ 1.71$ 1.73$ 1.93$ 1.94$ 2.11$ 2.48$ 4.0% 11.8%
% Y/Y 34.8% 20.6% 14.5% -20.3% -3.1% -21.1% -9.4% 51.3% 21.8% 3.2% 1.3% 11.7% 0.3% 9.2% 17.3%
CapEx 53 64 85 175 81 157 105 93 678 424 263 377 436 384 411 -10.5% 2.0%
% Y/Y 55.9% 10.3% 32.8% 63.6% 52.8% 145.3% 23.5% -47.0% 9.0% -37.5% -38.0% 43.3% 15.6% -11.9% 7.1%
% of Revenue 0.8% 0.8% 1.1% 2.6% 1.2% 2.0% 1.4% 1.2% 2.6% 1.6% 1.0% 1.3% 1.4% 1.2% 1.2%
FCF 927 179 1,110 1,192 667 -401 1,593 1,359 2,286 3,193 2,785 3,408 3,218 4,247 4,650 8.9% 13.7%
% Y/Y NM -62.6% -35.3% 28.3% -28.0% NM 43.5% 14.0% -3.9% 39.7% -12.8% 22.4% -5.6% 32.0% 9.5%
Dividends 54 427 41 421 67 445 67 442 792 878 821 943 1,021 1,071 1,123 6.5% 5.0%
Buybacks 467 152 0 0 0 0 0 0 3,706 5,939 4,904 619 0 0 0 -100.0%
Total Capital Return 521 579 41 421 67 445 67 442 4,498 6,817 5,725 1,562 1,021 1,071 1,123 -31.0% 5.0%
% of FCF 56.2% NM 3.7% 35.3% 10.0% NM 4.2% 32.5% 196.8% NM NM 45.8% 31.7% 25.2% 24.2%
Net Debt 14,807 15,363 14,324 13,750 12,948 13,985 12,625 11,708 13,643 10,611 15,301 13,750 11,708 9,442 5,915 -3.8%
Net Leverage 2.2x 2.2x 2.0x 1.9x 1.8x 2.1x 1.9x 1.7x 2.2x 1.6x 2.3x 1.9x 1.7x 1.3x 0.7x
SEGMENTSAvg Reverse Retrans Rate $0.60 $0.59 $0.59 $0.56 $0.67 $0.68 $0.62 $0.70 $0.28 $0.45 $0.47 $0.59 $0.67 $0.77 $0.91 23.7% 17.4%
% Y/Y 40.6% 42.4% 11.0% 14.2% 11.7% 14.3% 5.0% 25.0% 147.7% 58.0% 3.8% 25.6% 13.8% 15.0% 18.0%
Avg Retrans Rate $1.85 $1.85 $1.90 $1.90 $2.00 $2.00 $2.19 $2.19 $1.17 $1.35 $1.72 $1.88 $2.09 $2.37 $2.85 15.5% 16.7%
% Y/Y 8.8% 8.8% 8.6% 8.6% 8.0% 8.0% 15.0% 15.0% 56.6% 15.0% 27.7% 8.9% 11.5% 13.4% 20.0%
Total Retrans/Reverse Rev 317 316 320 311 344 346 355 367 740 944 1,114 1,264 1,411 1,599 1,894 17.5% 16.2%
RevenueCable Networks SegmentAdvertising 893 995 922 974 943 1,032 936 1,272 3,224 3,499 3,719 3,784 4,184 4,416 4,584 6.7% 3.6%
% Y/Y Rpt'd 5.5% 4.1% -8.5% 7.3% 5.6% 3.8% 1.5% 30.6% 8.3% 8.5% 6.3% 1.8% 10.6% 5.6% 3.8%
Affiliate Fees 2,601 2,603 2,832 2,974 2,891 2,919 3,148 3,274 8,418 9,532 10,199 11,009 12,232 13,274 14,292 9.8% 6.7%
% Y/Y 7.5% 6.3% 7.6% 10.2% 11.2% 12.2% 11.2% 10.1% 15.5% 13.2% 7.0% 7.9% 11.1% 8.5% 7.7%
Domestic subscribers %Y/Y -1.4% -1.4% -1.4% -1.5% -1.5% -1.7% -0.7% -0.7% -0.8% -1.0% -1.2% -1.4% -1.2% -0.9% -1.2% -1.2% -1.6%
Domestic affiliate rate %Y/Y 11.1% 10.2% 9.8% 10.9% 10.4% 11.2% 9.1% 8.6% 9.8% 16.2% 10.5% 10.5% 9.8% 8.5% 8.3% 11.7% 7.8%
Content Licensing/Other 317 369 269 381 363 453 334 450 630 743 1,111 1,336 1,601 1,649 1,697 26.2% 2.9%
% Y/Y 59.4% 23.7% -10.3% 21.6% 14.6% 22.8% 24.0% 18.1% 2.3% 17.8% 49.6% 20.3% 19.8% 3.0% 2.9%
Cable Networks Total 3,810 3,967 4,024 4,329 4,196 4,405 4,419 4,997 12,273 13,773 15,029 16,130 18,017 19,338 20,572 10.1% 5.7%
% Y/Y 10.0% 7.1% 2.1% 10.4% 10.1% 11.0% 9.8% 15.4% 12.8% 12.2% 9.1% 7.3% 11.7% 7.3% 6.4%
Television 1,038 1,918 1,690 1,003 1,065 1,806 1,149 1,092 5,296 4,895 5,105 5,649 5,112 5,671 6,369 -0.9% 7.9%
% Y/Y -1.0% 11.8% 30.1% -3.7% 2.6% -5.8% -32.0% 8.9% 9.0% -7.6% 4.3% 10.7% -9.5% 10.9% 12.3%
Filmed Entertainment 1,907 2,269 2,256 1,803 1,963 2,246 2,243 1,983 9,679 9,525 8,505 8,235 8,435 8,351 8,685 -3.4% 4.0%
% Y/Y 6.8% -3.9% -2.8% -11.5% 2.9% -1.0% -0.6% 10.0% 12.0% -1.6% -10.7% -3.2% 2.4% -1.0% 4.0%
Corp/Eliminations -249 -472 -406 -387 -222 -420 -391 -348 -1,186 -1,241 -1,313 -1,514 -1,381 -1,381 -1,381 3.9% 0.0%
% Y/Y 12.7% 16.5% 21.9% 9.3% -10.8% -11.0% -3.7% -10.0% 3.4% 4.6% 5.8% 15.3% -8.8% 0.0% 0.0%
TOTAL REVENUE 6,506 7,682 7,564 6,748 7,002 8,037 7,420 7,724 26,061 26,952 27,326 28,500 30,183 31,979 34,245 3.7% 5.9%
% Y/Y 7.1% 4.2% 4.7% 1.5% 7.6% 4.6% -1.9% 14.5% -5.8% 3.4% 1.4% 4.3% 5.9% 6.0% 7.1%
Operating ExpensesCable Networks 2,441 2,653 2,593 2,907 2,703 3,065 2,749 3,438 7,951 9,205 9,959 10,594 11,955 12,732 13,446 10.7% 5.9%
% Y/Y 12.1% 7.5% 0.3% 6.5% 10.7% 15.5% 6.0% 18.3% 17.0% 15.8% 8.2% 6.4% 12.8% 6.5% 5.6%
Television 847 1,542 1,500 866 943 1,750 1,071 919 4,414 4,177 4,361 4,755 4,683 5,421 6,048 1.5% 8.0%
% Y/Y -0.7% 7.3% 27.8% -3.5% 11.3% 13.5% -28.6% 6.1% 10.2% -5.4% 4.4% 9.0% -1.5% 15.8% 11.6%
Filmed Entertainment 1,596 1,880 1,883 1,825 1,707 2,115 1,957 1,743 8,321 8,080 7,420 7,184 7,522 7,362 7,362 -2.5% 1.3%
% Y/Y -2.4% -8.7% 1.7% -2.6% 7.0% 12.5% 3.9% -4.5% 13.5% -2.9% -8.2% -3.2% 4.7% -2.1% 0.0%
Corp/Eliminations -154 -371 -335 -281 -124 -306 -237 -260 -830 -918 -936 -1,141 -927 -918 -909 2.8% -1.0%
TOTAL OPEXP 4,730 5,704 5,641 5,317 5,229 6,624 5,540 5,839 19,855 20,544 20,804 21,392 23,232 24,597 25,947 4.0% 5.2%
% Y/Y % Y/Y 3.7% 0.8% 5.1% 1.9% 10.6% 16.1% -1.8% 9.8% -7.7% 3.5% 1.3% 2.8% 8.6% 5.9% 5.5%
EBITDACable Networks 1,384 1,330 1,446 1,441 1,511 1,365 1,684 1,572 4,407 4,648 5,145 5,601 6,132 6,662 7,182 8.6% 5.3%
% Y/Y 6.0% 6.4% 5.2% 18.7% 9.2% 2.6% 16.5% 9.1% 5.5% 5.5% 10.7% 8.9% 9.5% 8.6% 7.8%
% Margin 36.3% 33.5% 35.9% 33.3% 36.0% 31.0% 38.1% 31.5% 35.9% 33.7% 34.2% 34.7% 34.0% 34.4% 34.9%
Television 191 376 190 137 122 56 78 174 882 718 744 894 430 250 321 -16.5% 6.4%
% Y/Y -2.6% 34.8% 52.0% -4.9% -36.1% -85.1% -58.9% 26.7% 3.2% -18.6% 3.6% 20.2% -51.9% -41.7% 28.4%
% Margin 18.4% 19.6% 11.2% 13.7% 11.5% 3.1% 6.8% 15.9% 16.7% 14.7% 14.6% 15.8% 8.4% 4.4% 5.0%
Filmed Entertainment 311 389 373 -22 256 131 286 240 1,358 1,445 1,085 1,051 913 989 1,323 -9.4% 19.4%
% Y/Y 108.7% 28.8% -20.6% NA -17.7% -66.3% -23.3% NA 3.8% 6.4% -24.9% -3.1% -13.1% 8.3% 33.8%
% Margin 16.3% 17.1% 16.5% -1.2% 13.0% 5.8% 12.8% 12.1% 14.0% 15.2% 12.8% 12.8% 10.8% 11.8% 15.2%
Corporate/Eliminations -95 -101 -71 -106 -98 -114 -154 -88 -356 -323 -377 -373 -454 -463 -472 6.3% 2.0%
% Y/Y -18.1% 0.0% -20.2% 49.3% 3.2% 12.9% 116.9% -17.0% -25.2% -9.3% 16.7% -1.1% 21.7% 2.0% 2.0%
EBITDA 1,791 1,994 1,938 1,450 1,791 1,438 1,894 1,899 6,291 6,488 6,597 7,173 7,022 7,438 8,354 2.8% 7.8%
% Y/Y 16.7% 15.3% 3.0% -0.1% 0.0% -27.9% -2.3% 30.9% 0.5% 3.1% 1.7% 8.7% -2.1% 5.9% 12.3%
% Margin 27.5% 26.0% 25.6% 21.5% 25.6% 17.9% 25.5% 24.6% 24.1% 24.1% 24.1% 25.2% 23.3% 23.3% 24.4%
Source: Company data, Credit Suisse estimates.

10 July 2018
21st Century Fox (FOXA) 16
PEERsPEERs is a global database that captures unique information about companies within the Credit Suisse coverage universe based on their relationships with other companies – their customers, suppliers, and competitors. The database is built from our research analysts’ insight regarding these relationships. Credit Suisse covers over 3,000 companies globally. These companies form the core of the PEERs database, but it also includes relationships on stocks that are not under coverage. For more information, see our November 2016 PEERs report, titled A Chain Reaction: Supply Chain Strategies.
Figure 16: FOXA PEERs Map
Source: Credit Suisse PEERs.
10 July 2018
21st Century Fox (FOXA) 17
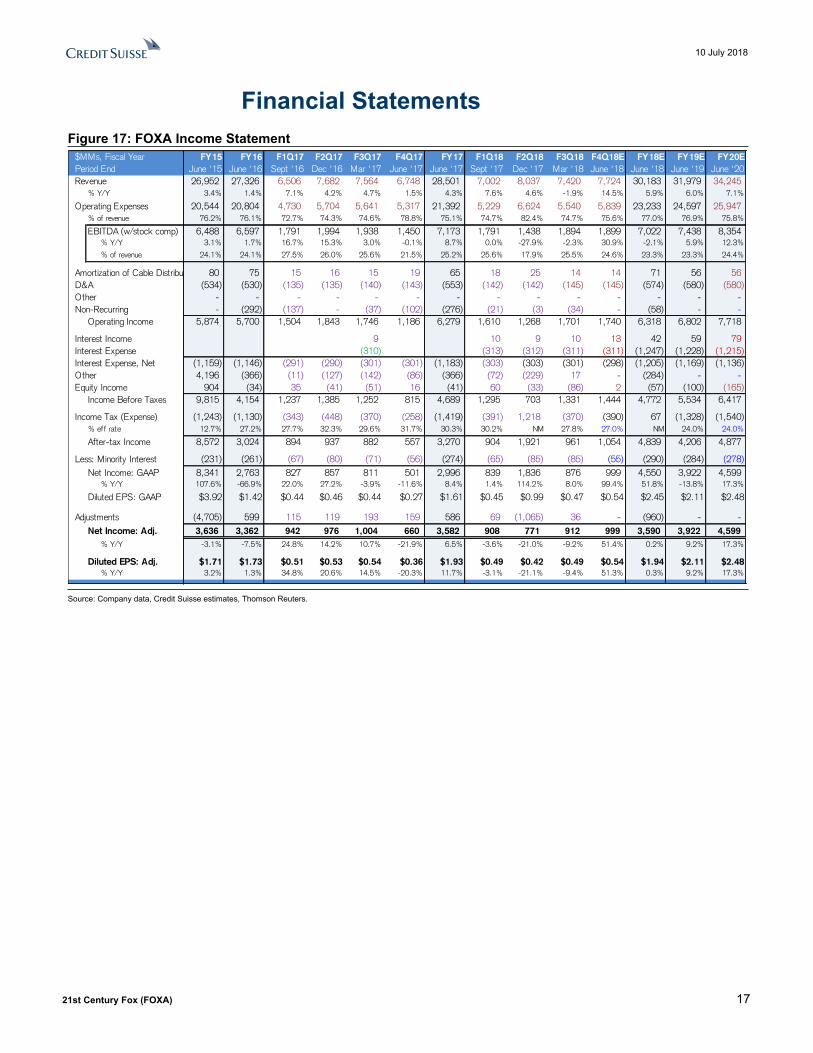
Financial StatementsFigure 17: FOXA Income Statement
$MMs, Fiscal Year FY15 FY16 F1Q17 F2Q17 F3Q17 F4Q17 FY17 F1Q18 F2Q18 F3Q18 F4Q18E FY18E FY19E FY20EPeriod End June '15 June '16 Sept '16 Dec '16 Mar '17 June '17 June '17 Sept '17 Dec '17 Mar '18 June '18 June '18 June '19 June '20Revenue 26,952 27,326 6,506 7,682 7,564 6,748 28,501 7,002 8,037 7,420 7,724 30,183 31,979 34,245
% Y/Y 3.4% 1.4% 7.1% 4.2% 4.7% 1.5% 4.3% 7.6% 4.6% -1.9% 14.5% 5.9% 6.0% 7.1%
Operating Expenses 20,544 20,804 4,730 5,704 5,641 5,317 21,392 5,229 6,624 5,540 5,839 23,233 24,597 25,947% of revenue 76.2% 76.1% 72.7% 74.3% 74.6% 78.8% 75.1% 74.7% 82.4% 74.7% 75.6% 77.0% 76.9% 75.8%
EBITDA (w/stock comp) 6,488 6,597 1,791 1,994 1,938 1,450 7,173 1,791 1,438 1,894 1,899 7,022 7,438 8,354% Y/Y 3.1% 1.7% 16.7% 15.3% 3.0% -0.1% 8.7% 0.0% -27.9% -2.3% 30.9% -2.1% 5.9% 12.3%
% of revenue 24.1% 24.1% 27.5% 26.0% 25.6% 21.5% 25.2% 25.6% 17.9% 25.5% 24.6% 23.3% 23.3% 24.4%
Amortization of Cable Distribution 80 75 15 16 15 19 65 18 25 14 14 71 56 56D&A (534) (530) (135) (135) (140) (143) (553) (142) (142) (145) (145) (574) (580) (580)Other - - - - - - - - - - - - - -Non-Recurring - (292) (137) - (37) (102) (276) (21) (3) (34) - (58) - -
Operating Income 5,874 5,700 1,504 1,843 1,746 1,186 6,279 1,610 1,268 1,701 1,740 6,318 6,802 7,718
Interest Income 9 10 9 10 13 42 59 79Interest Expense (310) (313) (312) (311) (311) (1,247) (1,228) (1,215)Interest Expense, Net (1,159) (1,146) (291) (290) (301) (301) (1,183) (303) (303) (301) (298) (1,205) (1,169) (1,136)Other 4,196 (366) (11) (127) (142) (86) (366) (72) (229) 17 - (284) - -Equity Income 904 (34) 35 (41) (51) 16 (41) 60 (33) (86) 2 (57) (100) (165)
Income Before Taxes 9,815 4,154 1,237 1,385 1,252 815 4,689 1,295 703 1,331 1,444 4,772 5,534 6,417
Income Tax (Expense) (1,243) (1,130) (343) (448) (370) (258) (1,419) (391) 1,218 (370) (390) 67 (1,328) (1,540)% eff rate 12.7% 27.2% 27.7% 32.3% 29.6% 31.7% 30.3% 30.2% NM 27.8% 27.0% NM 24.0% 24.0%
After-tax Income 8,572 3,024 894 937 882 557 3,270 904 1,921 961 1,054 4,839 4,206 4,877
Less: Minority Interest (231) (261) (67) (80) (71) (56) (274) (65) (85) (85) (55) (290) (284) (278)Net Income: GAAP 8,341 2,763 827 857 811 501 2,996 839 1,836 876 999 4,550 3,922 4,599
% Y/Y 107.6% -66.9% 22.0% 27.2% -3.9% -11.6% 8.4% 1.4% 114.2% 8.0% 99.4% 51.8% -13.8% 17.3%
Diluted EPS: GAAP $3.92 $1.42 $0.44 $0.46 $0.44 $0.27 $1.61 $0.45 $0.99 $0.47 $0.54 $2.45 $2.11 $2.48
Adjustments (4,705) 599 115 119 193 159 586 69 (1,065) 36 - (960) - -Net Income: Adj. 3,636 3,362 942 976 1,004 660 3,582 908 771 912 999 3,590 3,922 4,599
% Y/Y -3.1% -7.5% 24.8% 14.2% 10.7% -21.9% 6.5% -3.6% -21.0% -9.2% 51.4% 0.2% 9.2% 17.3%
Diluted EPS: Adj. $1.71 $1.73 $0.51 $0.53 $0.54 $0.36 $1.93 $0.49 $0.42 $0.49 $0.54 $1.94 $2.11 $2.48% Y/Y 3.2% 1.3% 34.8% 20.6% 14.5% -20.3% 11.7% -3.1% -21.1% -9.4% 51.3% 0.3% 9.2% 17.3%
Source: Company data, Credit Suisse estimates, Thomson Reuters.

10 July 2018
21st Century Fox (FOXA) 18
Figure 18: FOXA Balance Sheet$MMs, Fiscal Year FY15 FY16 F1Q17 F2Q17 F3Q17 F4Q17 FY17 F1Q18 F2Q18 F3Q18 F4Q18E FY18E FY19E FY20EPeriod End June '15 June '16 Sept '16 Dec '16 Mar '17 June '17 June '17 Sept '17 Dec '17 Mar '18 June '18 June '18 June '19 June '20Cash & Equivalents 8,428 4,424 4,681 4,530 5,572 6,163 6,163 6,901 5,809 7,372 8,289 8,289 10,555 14,082Receivables 5,912 6,258 6,099 6,983 7,219 6,477 6,477 6,619 7,554 6,905 7,123 7,123 7,613 7,975Inventory 2,749 3,291 3,300 3,507 3,418 3,101 3,101 2,856 3,132 3,645 3,399 3,399 3,224 3,425Other Current Assets 287 976 841 685 529 545 545 622 907 739 769 769 645 685Current Assets 17,376 14,949 14,921 15,705 16,738 16,286 16,286 16,998 17,402 18,661 19,580 19,580 22,037 26,166
Receivables 394 389 465 490 538 543 543 684 732 736 618 618 645 685Investments 4,529 3,863 3,912 3,616 3,679 3,902 3,902 4,066 4,364 4,256 4,238 4,238 4,166 4,094Inventory 6,411 7,041 7,396 7,572 7,725 7,452 7,452 8,019 8,034 8,002 8,651 8,651 8,222 8,540PP&E 1,722 1,692 1,669 1,657 1,691 1,781 1,781 1,779 1,840 1,861 1,873 1,873 1,936 2,025Goodwill 12,513 12,733 12,739 12,720 12,733 12,792 12,792 12,779 12,789 12,794 12,794 12,794 12,794 12,794Intangible assets, net 6,320 6,777 6,715 6,635 6,579 6,574 6,574 6,289 6,228 6,174 6,109 6,109 5,851 5,592Other Assets 786 921 809 812 1,001 1,394 1,394 1,414 1,469 1,494 1,494 1,494 1,494 1,494Total Assets 50,051 48,365 48,626 49,207 50,684 50,724 50,724 52,028 52,858 53,978 55,358 55,358 57,144 61,391
Accounts payable and other accrued liabilities 3,937 3,181 3,438 3,156 3,832 3,451 3,451 3,966 3,692 3,979 4,438 4,438 3,617 3,892Participations, residuals and royalties payable 1,632 1,672 1,573 1,613 1,663 1,657 1,657 1,604 1,753 1,682 1,773 1,773 1,929 2,096Program rights payable 1,001 1,283 1,345 1,278 1,233 1,093 1,093 1,228 1,260 1,183 1,401 1,401 1,447 1,572Defered revenue 448 505 612 622 621 580 580 671 719 717 701 701 723 786Current portion of borrowings 244 427 454 80 107 457 457 707 631 1,538 - - - -Current Liabilities 7,262 7,068 7,422 6,749 7,456 7,238 7,238 8,176 8,055 9,099 8,313 8,313 7,717 8,346
Borrowings 18,795 19,298 19,034 19,813 19,789 19,456 19,456 19,142 19,163 18,459 19,997 19,997 19,997 19,997Deferred Income Taxes 2,082 2,888 2,782 2,709 2,742 2,782 2,782 2,801 3,675 1,638 1,624 1,624 1,402 1,146Other Long-term Liabilities 3,105 3,678 3,780 3,803 3,826 3,616 3,616 3,654 1,622 3,798 3,798 3,798 3,798 3,798Redeemable noncontrolling interests 621 552 553 578 619 694 694 699 712 761 761 761 761 761
Class A Common Stock 12 11 11 11 11 11 11 11 11 11 11 11 11 11Class B Common Stock 8 8 8 8 8 8 8 8 8 8 8 8 8 8Additional paid-in-capital 13,427 12,211 12,232 12,224 12,274 12,406 12,406 12,345 12,392 12,530 12,560 12,560 12,680 12,800Retained Earnings / Accumulated deficit 5,343 3,575 3,741 4,479 4,919 5,315 5,315 5,816 7,627 8,121 8,733 8,733 11,868 15,622AOCI (1,570) (2,144) (2,185) (2,382) (2,195) (2,018) (2,018) (1,876) (1,649) (1,699) (1,699) (1,699) (2,350) (2,350)Total Shareholders' Equity 17,220 13,661 13,807 14,340 15,017 15,722 15,722 16,304 18,389 18,971 19,613 19,613 22,217 26,091Noncontrolling interests 966 1,220 1,248 1,215 1,235 1,216 1,216 1,252 1,242 1,252 1,252 1,252 1,252 1,252Total Equity 18,186 14,881 15,055 15,555 16,252 16,938 16,938 17,556 19,631 20,223 20,865 20,865 23,469 27,343
Total Liabilities & Equity 50,051 48,365 48,626 49,207 50,684 50,724 50,724 52,028 52,858 53,978 55,358 55,358 57,144 61,391
Source: Company data, Credit Suisse estimates.

10 July 2018
21st Century Fox (FOXA) 19
Figure 19: FOXA Cash Flow Statement$MMs, Fiscal Year FY15 FY16 F1Q17 F2Q17 F3Q17 F4Q17 FY17 F1Q18 F2Q18 F3Q18 F4Q18E FY18E FY19E FY20EPeriod End June '15 June '16 Sept '16 Dec '16 Mar '17 June '17 June '17 Sept '17 Dec '17 Mar '18 June '18 June '18 June '19 June '20Net Income 8,604 3,024 894 937 882 557 3,270 904 1,921 961 1,054 4,840 4,206 4,877D&A 736 530 135 135 140 143 553 142 142 145 145 574 580 580Amortization of cable distribution investments 80 75 15 16 15 19 65 18 25 14 18 75 72 72Impairment and restructuring charges 0 (420) 0 0 213 102 315 21 3 34 0 58 0 0Equity-based compensation 83 196 42 20 35 29 126 27 39 100 30 196 120 120Equity income / loss / cash distributions (552) 385 (33) 223 49 (12) 227 (55) 39 185 0 169 0 0Other (4,196) 658 148 127 (34) 86 327 72 229 (17) - 284 - -Deferred Tax 171 466 (12) (59) 1 159 89 (11) (1,289) 24 (14) (1,290) (221) (257)Working Capital (1,309) (1,866) (209) (1,156) (106) 284 (1,187) (370) (1,353) 252 219 (1,252) (125) (332)Cash from Operations 3,617 3,048 980 243 1,195 1,367 3,785 748 (244) 1,698 1,451 3,653 4,631 5,061
CapEx (424) (263) (53) (64) (85) (175) (377) (81) (157) (105) (93) (436) (384) (411)M&A (1,391) (1,098) (6) (1) (11) (185) (203) 261 (108) (113) - 40 (910) -Other 8,551 (277) (63) (63) (22) (24) (172) (29) (55) (33) - (117) - -Cash from Investing 6,736 (1,638) (122) (128) (118) (384) (752) 151 (320) (251) (93) (513) (1,294) (411)
Capex consensus 76 91 90 86 431 456 479
Debt Raise (Paydown) 316 673 (68) 401 0 12 345 (67) (62) 200 0 71 0 0Stock Buybacks, net (5,939) (4,904) (467) (152) 0 0 (619) 0 0 0 0 - - -Dividends (878) (821) (54) (427) (41) (421) (943) (67) (445) (67) (442) (1,021) (1,071) (1,123)Other (601) (278) (19) (25) (19) (1) (64) (32) (18) (19) - (69) - -Cash from Financing (7,102) (5,330) (608) (203) (60) (410) (1,281) (166) (525) 114 (442) (1,019) (1,071) (1,123)
Impact of discontinued operations (49) (20) (6) (9) (6) (7) (28) (9) (17) (16) - (42) - -Impact of FX (189) (64) 13 (54) 31 25 15 14 14 18 - 46 - -
Cash, Begin 5,415 8,428 4,424 4,681 4,530 5,572 4,424 6,163 6,901 5,809 7,372 6,163 8,289 10,555
Change in Cash 3,013 (4,004) 257 (151) 1,042 591 1,739 738 (1,092) 1,563 917 2,126 2,266 3,527
Cash, End 8,428 4,424 4,681 4,530 5,572 6,163 6,163 6,901 5,809 7,372 8,289 8,289 10,555 14,082
Free Cash FlowCash From Operations 3,617 3,048 980 243 1,195 1,367 3,785 748 (244) 1,698 1,451 3,653 4,631 5,061CapEx (424) (263) (53) (64) (85) (175) (377) (81) (157) (105) (93) (436) (384) (411)Free Cash Flow 3,193 2,785 927 179 1,110 1,192 3,408 667 (401) 1,593 1,359 3,218 4,247 4,650
% Y/Y 39.7% -12.8% NM -62.6% -35.3% 28.3% 22.4% -28.0% NM 43.5% 14.0% -5.6% 32.0% 9.5%
Consensus 816 374 401 762 3,524 4,045 4,299
FCF per shr $1.50 $1.43 $0.50 $0.10 $0.60 $0.64 $1.84 $0.36 ($0.22) $0.86 $0.73 $1.74 $2.29 $2.51% Y/Y 48.8% -4.5% NM -60.5% -33.1% 31.0% 28.2% -27.7% NM 43.1% 14.0% -5.5% 32.0% 9.5%
Source: Company data, Credit Suisse estimates, Thomson Reuters.

10 July 2018
21st Century Fox (FOXA) 20
Appendix
Figure 20: Broadcast Ratings Dashboard
Demo 2015 2016 2017 1Q17 2Q17 3Q17 4Q17 1Q18 2Q QTD 1-Apr 8-Apr 15-Apr 22-Apr 29-Apr 6-May ##### ##### ##### 3-Jun
Average Commercial Audience (000s)ABC P18-49 983 924 803 878 859 663 816 816 823 859 768 887 799 824 840 768 702 634 1,177CBS P18-49 1,061 1,031 858 1,008 678 656 1,070 897 612 656 825 687 603 580 575 641 603 525 485FOX P18-49 2,057 1,920 1,864 2,766 829 1,106 2,509 1,441 714 743 654 803 717 818 762 786 742 795 417NBC P18-49 1,086 1,130 862 899 719 778 1,044 1,147 655 660 636 660 664 612 697 660 745 550 648CW P18-49 430 390 332 409 308 223 400 354 300 309 264 320 344 311 321 328 335 267 210
ION P18-49 241 269 244 264 241 237 235 276 270 272 272 260 257 263 249 267 278 263 305TEL P18-49 293 280 271 305 238 283 264 235 227 215 236 225 236 240 212 226 236 221 208UNI P18-49 472 394 359 412 348 346 334 348 294 284 309 295 298 314 293 287 312 268 286
Average Commercial Audience (000s) -- % Change Y/YABC P18-49 -7% -6% -13% -10% -16% -11% -14% -7% 1% 17% 0% 8% -2% 2% -1% -3% -7% -6% -3%CBS P18-49 -4% -3% -17% -25% -12% -17% -10% -11% -16% -41% -21% 0% -11% -14% -19% -11% -8% -13% -8%FOX P18-49 -17% -7% -3% 25% -18% -6% -15% -48% -9% -23% -27% -3% -12% -2% -21% -11% -23% -18% -51%NBC P18-49 -10% 4% -24% -12% -12% -44% -18% 28% -9% -10% -15% -3% -9% -17% -12% -15% 3% -18% -8%CW P18-49 -7% -9% -15% -15% -23% -16% -2% -13% -4% -30% -20% 14% 67% -24% -20% -20% -16% -28% -13%ION P18-49 0% 12% -9% -10% -12% -6% -9% 5% 10% 18% 14% 13% 10% 6% -2% 11% 15% -3% 22%TEL P18-49 3% -4% -3% 16% -9% 1% -17% -23% -2% -21% -12% -10% -12% -4% 4% 14% 9% 8% 1%UNI P18-49 -12% -17% -9% -5% -14% -4% -13% -16% -6% -21% -12% -13% -15% -13% -24% -20% -9% -29% -15%
Average Commercial Audience (000s) -- Δ CHANGEABC P18-49 (72) (59) (121) (98) (159) (86) (137) (62) 9 123 (2) 62 (13) 16 (5) (25) (50) (38) (32)CBS P18-49 (40) (30) (173) (331) (95) (132) (121) (111) (119) (465) (217) 3 (74) (93) (136) (79) (51) (81) (45)FOX P18-49 (415) (137) (56) 557 (185) (65) (433) (1,325) (74) (223) (247) (21) (101) (13) (205) (98) (218) (180) (427)NBC P18-49 (127) 44 (268) (127) (97) (613) (231) 248 (61) (77) (115) (21) (64) (124) (96) (118) 21 (123) (58)CW P18-49 (31) (40) (58) (74) (94) (41) (10) (55) (14) (135) (67) 40 138 (96) (78) (82) (65) (104) (32)ION P18-49 - 28 (25) (29) (33) (16) (22) 12 25 41 34 30 24 14 (4) 27 36 (8) 56TEL P18-49 9 (13) (9) 41 (24) 4 (55) (70) (5) (56) (33) (26) (33) (9) 8 27 20 17 2UNI P18-49 (62) (78) (35) (21) (56) (13) (49) (64) (20) (76) (43) (45) (52) (45) (92) (74) (30) (108) (52)
Commercial Duration (in Minutes) -- % Change Y/YABC 2% 1% 0% 0% -2% 2% 1% 0% 3% -6% 5% 2% 2% 5% 2% 1% 2% 1% 0%CBS 0% 2% 2% 1% 3% 2% 1% 0% 0% -7% -1% 0% -1% -1% 0% -1% 1% 2% 0%FOX 1% 4% 6% 5% 2% 8% 9% -2% -4% 5% -14% 14% 41% 5% -35% 2% 5% -17% -13%NBC 3% 3% 3% 2% 3% 3% 5% 7% 4% 5% 6% 3% 2% 5% 4% 7% 2% 4% 6%CW 11% 3% -4% -4% 0% 1% -15% -10% -15% -17% -13% -12% -13% -13% -13% -12% -12% -13% -12%ION 9% -2% 1% 5% 5% -2% -3% 3% 0% 3% 0% 0% 0% 1% 2% 1% -1% 2% 0%TEL 3% 5% 0% -5% -3% 6% 4% 12% -1% 9% 2% 2% 2% 4% 6% 2% -6% -5% -10%UNI 2% 9% 5% 3% 7% 9% 1% 16% 12% 16% 14% 15% 15% 13% 16% 11% 12% 16% -4%
Big 4 2% 2% 2% 1% 2% 3% 3% 2% 2% -2% 2% 2% 3% 3% -1% 2% 2% 1% 1%Other English Bcast 35% 52% 45% 82% 79% 24% 23% 25% 5% 3% 4% 5% 6% 6% 8% 5% 6% 4% 4%Spanish Bcast 10% 15% 3% 5% 3% 4% 0% 7% 6% 7% 6% 6% 6% 7% 7% 7% 4% 8% 2%
Commercial Viewing Time (Billions of Minutes)ABC P18-49 52.2 49.5 43.1 11.5 11.3 8.9 11.3 10.6 7.9 0.8 0.8 0.9 0.9 0.9 0.9 0.8 0.7 0.7 1.2CBS P18-49 64.3 64.0 54.2 16.2 10.4 10.1 17.4 14.4 6.6 0.7 1.0 0.8 0.7 0.7 0.7 0.7 0.7 0.6 0.6FOX P18-49 27.0 26.2 27.0 9.0 2.6 3.9 11.6 4.6 1.5 0.1 0.1 0.2 0.2 0.3 0.1 0.1 0.2 0.2 0.1NBC P18-49 60.8 65.2 51.5 13.0 10.5 11.7 16.2 17.8 7.0 0.8 0.8 0.8 0.8 0.7 0.8 0.8 0.9 0.7 0.8CW P18-49 5.4 5.1 4.1 1.3 1.0 0.7 1.1 1.0 0.6 0.1 0.1 0.1 0.1 0.1 0.1 0.1 0.1 0.1 0.0ION P18-49 23.3 25.4 23.4 6.2 6.0 5.7 5.5 6.8 4.7 0.5 0.5 0.5 0.5 0.5 0.5 0.5 0.5 0.5 0.6ESTRELLA P18-49 2.7 2.9 3.3 0.9 0.9 0.8 0.8 0.8 0.6 0.1 0.1 0.1 0.1 0.1 0.1 0.1 0.1 0.1 0.0TEL P18-49 14.4 14.4 14.0 3.6 3.2 4.0 3.3 3.1 2.1 0.2 0.2 0.2 0.2 0.2 0.2 0.2 0.2 0.2 0.2UNI P18-49 24.7 22.3 21.3 5.7 5.1 5.2 5.3 5.6 3.4 0.4 0.4 0.4 0.4 0.4 0.4 0.4 0.4 0.4 0.3
Big 4 204.3 204.9 175.7 49.8 34.8 34.6 56.5 47.4 23.0 2.5 2.6 2.7 2.5 2.6 2.5 2.4 2.5 2.1 2.6Other English Bcast 39.0 49.1 53.4 13.5 13.3 13.0 13.7 14.9 10.5 1.2 1.2 1.1 1.1 1.1 1.1 1.1 1.2 1.1 1.2Spanish Bcast 42.7 40.6 39.6 10.4 9.4 10.2 9.6 9.7 6.1 0.7 0.7 0.7 0.7 0.7 0.7 0.7 0.7 0.7 0.6Broadcast Nets 286.0 294.6 268.8 73.6 57.6 57.9 79.8 72.1 39.6 4.4 4.5 4.5 4.4 4.4 4.3 4.2 4.4 3.9 4.4
Commercial Viewing Time (Billions of Minutes) -- % Change Y/YABC -5% -5% -13% -10% -17% -10% -14% -7% 4% 10% 5% 9% 1% 7% 2% -2% -5% -5% -3%CBS -3% 0% -15% -24% -10% -15% -9% -11% -17% -46% -21% 1% -12% -15% -19% -12% -7% -12% -8%FOX -16% -3% 3% 31% -17% 2% -7% -49% -13% -19% -38% 11% 24% 3% -49% -9% -18% -32% -57%NBC -8% 7% -21% -10% -9% -42% -14% 37% -5% -6% -10% 0% -7% -13% -8% -9% 5% -15% -3%CW 4% -7% -19% -18% -23% -14% -17% -22% -19% -43% -31% 0% 45% -34% -30% -30% -26% -37% -23%ION 9% 9% -8% -5% -8% -8% -11% 8% 11% 21% 15% 13% 10% 7% 0% 12% 14% -1% 22%TEL 6% 1% -3% 10% -12% 7% -14% -14% -3% -14% -10% -9% -11% 0% 10% 15% 2% 3% -9%UNI -10% -9% -5% -2% -8% 5% -12% -2% 5% -9% 0% 0% -2% -1% -12% -11% 2% -17% -19%
Big 4 -7% 0% -14% -10% -13% -25% -11% -5% -7% -20% -13% 4% -4% -6% -12% -8% -3% -13% -7%Other English Bcast 8% 26% 9% 18% 18% 3% -1% 11% 11% 14% 15% 16% 18% 4% 4% 5% 11% -1% 16%Spanish Bcast -2% -5% -3% 4% -7% 7% -13% -7% -1% -12% -6% -4% -6% -2% -6% -4% 2% -11% -15%Broadcast Nets -4% 3% -9% -4% -6% -15% -10% -2% -2% -12% -6% 5% 0% -3% -8% -4% 1% -10% -3%
Standard Calendar Years Standard Calendar Quarters Nielsen Calendar Weeks (M-Su 6a-6a) Ending
Source: Nielsen NNTV, Credit Suisse, Company Reports. QTD based on 4/1/18-6/3/18 vs 4/1/17-6/3/17. QTD and most recent two weeks are set to Live+SD ratings and as commercial ratings are reported on a two week delay.

10 July 2018
21st Century Fox (FO
XA)
21
Figure 21: Credit Suisse Cable Networks Ratings DashboardFox National Cable Nets
Demo 2015 2016 2017 1Q17 2Q17 3Q17 4Q17 1Q18 2Q QTD Apr 1 Apr 8 Apr 15 Apr 22 Apr 29 May 6 May 13 May 20 May 27 Jun 3
Average Commercial Audience (000s), Target DemoFOX NEWS CHANNEL P25-54 195 257 301 336 296 286 288 283 279 243 248 297 271 261 255 276 264 255 257FX P18-49 256 234 197 214 191 188 195 184 156 179 155 151 133 180 123 134 153 154 161FOX SPORTS 1 P18-49 54 67 63 50 55 51 96 48 55 40 66 48 53 39 56 47 51 40 61NATIONAL GEOGRAPHIC P25-54 108 99 84 91 75 86 84 98 86 100 96 87 82 69 76 79 83 81 95FOX SPORTS 2 P18-49 8 7 8 7 7 8 9 8 7 7 7 7 5 6 6 6 6 6 7FXX P18-49 108 113 97 108 94 92 94 98 92 88 102 83 81 99 86 88 94 82 90FX MOVIE CHANNEL P18-49 33 36 34 33 32 36 35 40 32 41 33 33 31 29 32 29 32 37 42NAT GEO WILD P18-49 39 37 33 37 34 35 28 32 31 30 28 31 33 28 34 31 30 27 37FOX BUSINESS NETWORK P25-54 11 17 16 19 14 15 17 19 17 21 17 19 18 17 16 15 15 15 15FOX DEPORTES P18-49 15 14 14 14 13 10 18 11 12 10 13 11 9 13 14 9 11 11 9
Average Commercial Audience (000s), Target Demo -- % Change Y/YFOX NEWS CHANNEL P25-54 -3% 32% 17% 32% 45% 12% -10% -16% -11% -15% -27% -11% -9% -9% -4% -1% -8% -14% -14%FX P18-49 -19% -9% -16% -20% -16% -13% -13% -14% -21% -12% -7% -30% -25% 3% -50% -34% -1% -7% -21%FOX SPORTS 1 P18-49 20% 24% -6% 4% -18% 19% -14% -4% 4% -22% 53% 45% 10% -7% 56% -24% -12% -15% -9%NATIONAL GEOGRAPHIC P25-54 -10% -8% -15% -14% -26% -16% -3% 8% 4% 22% 25% 14% 14% -18% 1% 0% 5% 4% 20%FOX SPORTS 2 P18-49 14% -13% 14% 17% 0% 33% 29% 14% 0% 40% 17% 17% -58% 20% 20% 0% 0% 20% 0%FXX P18-49 10% 5% -14% -2% -6% -19% -27% -9% -5% -15% -3% -8% -12% -5% -5% -5% 3% -10% -13%FX MOVIE CHANNEL P18-49 -18% 9% -6% -15% -6% 3% -3% 21% 7% 58% 0% 32% 0% -17% 7% -6% 3% 23% 45%NAT GEO WILD P18-49 -3% -5% -11% -10% -11% 0% -18% -14% -14% -3% -7% 0% 32% 12% -8% -16% -33% -34% -18%FOX BUSINESS NETWORK P25-54 57% 55% -6% -5% 0% 0% -15% 0% 13% 17% 6% 12% 20% 31% 45% 7% 15% 7% 15%FOX DEPORTES P18-49 -12% -7% 0% 8% 0% 0% -10% -21% -20% 11% 44% -15% -44% 30% -22% -25% 22% -15% -63%
Average Commercial Audience (000s), Target Demo -- Δ CHANGEFOX NEWS CHANNEL P25-54 (7) 62 44 82 92 31 (32) (53) (35) (43) (94) (35) (27) (27) (11) (4) (22) (40) (41)FX P18-49 (62) (22) (37) (53) (36) (29) (29) (30) (42) (25) (11) (66) (45) 5 (122) (70) (2) (11) (44)FOX SPORTS 1 P18-49 9 13 (4) 2 (12) 8 (15) (2) 2 (11) 23 15 5 (3) 20 (15) (7) (7) (6)NATIONAL GEOGRAPHIC P25-54 (12) (9) (15) (15) (27) (16) (3) 7 3 18 19 11 10 (15) 1 - 4 3 16FOX SPORTS 2 P18-49 1 (1) 1 1 - 2 2 1 - 2 1 1 (7) 1 1 - - 1 -FXX P18-49 10 5 (16) (2) (6) (22) (34) (10) (5) (15) (3) (7) (11) (5) (5) (5) 3 (9) (13)FX MOVIE CHANNEL P18-49 (7) 3 (2) (6) (2) 1 (1) 7 2 15 - 8 - (6) 2 (2) 1 7 13NAT GEO WILD P18-49 (1) (2) (4) (4) (4) - (6) (5) (5) (1) (2) - 8 3 (3) (6) (15) (14) (8)FOX BUSINESS NETWORK P25-54 4 6 (1) (1) - - (3) - 2 3 1 2 3 4 5 1 2 1 2FOX DEPORTES P18-49 (2) (1) - 1 - - (2) (3) (3) 1 4 (2) (7) 3 (4) (3) 2 (2) (15)
Nielsen Calendar Weeks (M-Su 6a-6a)Standard Calendar Years Standard Calendar Quarters
Source: Nielsen NNTV, Credit Suisse, Company Reports. QTD based on 4/1/18-6/3/18 vs 4/1/17-6/3/17. QTD and most recent two weeks are set to Live+SD ratings and as commercial ratings are reported on a two week delay.

10 July 2018
21st Century Fox (FO
XA)
22
Figure 22: Credit Suisse Cable Networks Ratings DashboardFox National Cable Nets
Demo 2015 2016 2017 1Q17 2Q17 3Q17 4Q17 1Q18 2Q QTD Apr 1 Apr 8 Apr 15 Apr 22 Apr 29 May 6 May 13 May 20 May 27 Jun 3
Commercial Duration -- % Change Y/YFOX NEWS CHANNEL Commercial Duration-1% -1% -3% -7% -8% 1% 1% 4% 2% 4% 5% -4% -1% 1% 0% 8% 6% 6% 3%FX Commercial Duration4% 0% 0% -2% 5% 1% -3% -1% -4% -1% 1% 1% 2% -6% -8% -5% -4% -9% -6%FOX SPORTS 1 Commercial Duration-9% -1% 6% 4% 4% 6% 11% 6% 2% -1% 1% 2% 3% -4% 9% 3% 2% 9% 0%NATIONAL GEOGRAPHIC Commercial Duration-4% 1% -2% -6% -9% 2% 4% 8% 10% 5% 9% 9% 12% 13% 13% 8% 7% 8% 17%FOX SPORTS 2 Commercial Duration-3% 1% 1% -4% 2% 0% 5% 8% 6% 8% -4% 3% 23% 3% -3% 4% -2% 23% 6%FXX Commercial Duration2% 0% 4% 2% 7% 4% 4% 2% -1% 3% 1% 1% -3% -2% -1% -1% -1% -2% -2%FX MOVIE CHANNEL Commercial Duration4% 10% 3% 2% 2% 7% 3% 2% 1% 4% -3% 2% 2% -3% 3% 2% 2% 0% 1%NAT GEO WILD Commercial Duration4% 5% 0% -2% 0% 0% 0% -1% -1% -1% -2% -2% -3% -1% -1% 0% 1% -1% 2%FOX BUSINESS NETWORK Commercial Duration5% 1% 1% -7% 3% 3% 6% 13% 3% 5% 3% -4% 4% 3% 8% 3% 4% 4% 2%FOX DEPORTES Commercial Duration2% 1% 1% 12% -3% -5% 0% -13% -2% -7% -11% -8% -1% -7% 4% 0% 0% -1% 5%
Fox National Cable Nets 0% 1% 1% -2% 0% 2% 3% 3% 2% 2% 1% 0% 3% 0% 2% 2% 2% 3% 2%
Commercial Viewing Time (Billions of Minutes), Target DemoFOX NEWS CHANNEL P25-54 24.1 31.3 35.5 9.6 8.7 8.7 8.5 8.4 5.8 0.6 0.6 0.6 0.6 0.6 0.6 0.6 0.6 0.6 0.6FX P18-49 25.0 22.8 19.3 5.1 4.8 4.6 4.7 4.4 2.7 0.3 0.3 0.3 0.3 0.3 0.2 0.2 0.3 0.3 0.3FOX SPORTS 1 P18-49 4.3 5.3 5.3 1.0 1.2 1.1 2.0 1.0 0.8 0.1 0.1 0.1 0.1 0.1 0.1 0.1 0.1 0.1 0.1NATIONAL GEOGRAPHIC P25-54 8.2 7.6 6.3 1.7 1.4 1.7 1.6 1.9 1.2 0.2 0.2 0.1 0.1 0.1 0.1 0.1 0.1 0.1 0.2FOX SPORTS 2 P18-49 0.6 0.5 0.6 0.1 0.1 0.2 0.2 0.2 0.1 0.0 0.0 0.0 0.0 0.0 0.0 0.0 0.0 0.0 0.0FXX P18-49 9.3 9.8 8.7 2.4 2.2 2.1 2.1 2.2 1.5 0.2 0.2 0.1 0.1 0.2 0.1 0.2 0.2 0.1 0.2FX MOVIE CHANNEL P18-49 1.1 1.3 1.2 0.3 0.3 0.3 0.3 0.4 0.2 0.0 0.0 0.0 0.0 0.0 0.0 0.0 0.0 0.0 0.0NAT GEO WILD P18-49 2.7 2.7 2.4 0.7 0.6 0.6 0.5 0.6 0.4 0.0 0.0 0.0 0.0 0.0 0.0 0.0 0.0 0.0 0.1FOX BUSINESS NETWORK P25-54 1.0 1.5 1.5 0.4 0.3 0.4 0.4 0.4 0.3 0.0 0.0 0.0 0.0 0.0 0.0 0.0 0.0 0.0 0.0FOX DEPORTES P18-49 1.0 0.9 0.9 0.2 0.2 0.2 0.3 0.2 0.1 0.0 0.0 0.0 0.0 0.0 0.0 0.0 0.0 0.0 0.0
Commercial Viewing Time (Billions of Minutes), Target Demo -- % Change Y/YFOX NEWS CHANNEL P25-54 -4% 30% 13% 23% 34% 13% -9% -13% -9% -12% -24% -14% -10% -9% -4% 6% -2% -8% -11%FX P18-49 -16% -9% -16% -21% -12% -12% -15% -14% -24% -13% -6% -30% -24% -3% -54% -38% -5% -15% -26%FOX SPORTS 1 P18-49 10% 23% 0% 8% -15% 26% -4% 1% 6% -22% 56% 48% 14% -11% 69% -22% -11% -7% -9%NATIONAL GEOGRAPHIC P25-54 -14% -7% -17% -19% -33% -14% 0% 17% 14% 29% 36% 24% 28% -8% 15% 8% 13% 12% 41%FOX SPORTS 2 P18-49 10% -12% 15% 12% 2% 33% 35% 23% 6% 51% 12% 20% -49% 24% 16% 4% -2% 47% 6%FXX P18-49 12% 5% -11% 0% 1% -16% -24% -8% -6% -12% -2% -7% -14% -6% -6% -6% 3% -11% -15%FX MOVIE CHANNEL P18-49 -14% 20% -2% -14% -4% 10% 0% 24% 7% 65% -3% 34% 2% -20% 9% -5% 6% 24% 46%NAT GEO WILD P18-49 1% -1% -11% -11% -11% 0% -18% -15% -15% -4% -9% -2% 28% 11% -9% -16% -32% -35% -16%FOX BUSINESS NETWORK P25-54 65% 56% -5% -11% 3% 3% -10% 13% 16% 23% 9% 7% 25% 35% 56% 10% 20% 12% 18%FOX DEPORTES P18-49 -10% -6% 1% 21% -3% -5% -10% -32% -22% 4% 28% -22% -45% 20% -19% -25% 23% -17% -61%
REVENUE-WEIGHTED CHANGE -6% 12% -1% 3% 5% 3% -11% -9% -9% -10% 0% -6% -8% -6% -7% -12% -3% -9% -12%
Nielsen Calendar Weeks (M-Su 6a-6a)Standard Calendar Years Standard Calendar Quarters
Source: Nielsen NNTV, Standard Media Index, Credit Suisse, QTD based on 4/1/18-6/3/18 vs 4/1/17-6/3/17. QTD and most recent two weeks are set to Live+SD ratings and as commercial ratings are reported on a two week delay, Revenue-weighted change uses SMI revenue data; calculated as sum of Y/Y change * contribution to total advertising revenue for each network.

10 July 2018
21st Century Fox (FO
XA)
23
Figure 23: 20th Century Fox Film Slate
Maze Runner: The Death Cure 1/26/18 Super Troopers 2 4/20/18 The Darkest Minds 8/3/18 Bad Times At The El Royale 10/5/18Red Sparrow 3/2/18 Deadpool 2 5/18/18 The Predator (2018) 9/14/18 Can You Ever Forgive Me? 10/19/18Love, Simon 3/16/18 Dark Phoenix 11/2/18Isle Of Dogs 3/23/18 Widows 11/16/18
Alita: Battle Angel 12/21/18Bohemian Rhapsody 12/25/18
Ad Astra 1/11/19 Gambit 6/7/19 Death on the Nile (2019) 11/8/19Spies in Disguise 1/18/19 Untitled Fox/Marvel Film I (2019) 6/7/19 Untitled Fox/Marvel Film II (2019) 11/22/19The Kid Who Would be King 2/14/19 The Call of the Wild 12/25/19New Mutants 2/22/19The Force 3/1/19
4Q183Q182Q181Q18
1Q19 2Q19 3Q19 4Q19
Source: Company data, Credit Suisse Estimates

10 July 2018
21st Century Fox (FOXA) 24
RisksRisks to our rating and target price specific to Fox include:
■ Deal Regulatory Dynamics: Fox’s current valuation and our target price are based in part on the expectation that the company is acquired by Disney or Comcast. While the Disney acquisition has already been approved by regulators, to the extent Comcast wins the bidding war, the transaction would require regulatory approval.
■ Economic Cyclicality: New Fox's operating results are sensitive to consumer spending and thus the state of the wider economy. To the extent the economy and consumer spending are unexpectedly weak or strong, our forecasts and valuation would be affected.
■ Long-Term Programming Costs (Esp. NFL Renewal): Television network programming costs constitute a significant portion of New Fox’s operating expenditures. Insofar as sports rights (such as for the NFL) or other programming costs grow above or below our projections, the margins and profitability of the company may be affected.
■ Popularity of Content: New Fox’s competitive position in its industry is to a large extent dependent on consumer tastes. Shifts in the popularity of content produced by the company may affect operating performance and profitability.
■ Cord Cutting: The bulk of New Fox’s revenues are derived from traditional Pay TV. If cord-cutting and cord-shaving trends accelerate, the company’s revenue growth could slow; similarly, to the extent these trends moderate, revenues may exceed our forecasts and support a higher valuation.

10 July 2018
21st Century Fox (FOXA) 25
Companies Mentioned (Price as of 06-Jul-2018)21st Century Fox (FOXA.OQ, $48.93, OUTPERFORM, TP $57.0)AT&T (T.N, $32.68)Alphabet (GOOGL.OQ, $1155.08)Altice Europe (ATCA.AS, €3.284)Amazon com Inc. (AMZN.OQ, $1710.63)CBS (CBS.N, $58.15)Charter Communications (CHTR.OQ, $304.43)Comcast Corp. (CMCSA.OQ, $33.58)Discovery Inc. (DISCA.OQ, $27.87)Dish Network (DISH.OQ, $34.99)Facebook Inc. (FB.OQ, $203.23)Interpublic Group (IPG.N, $22.86)Lions Gate Entertainment Corp. (LGFa.N, $25.69)Netflix Inc. (NFLX.OQ, $408.25)Omnicom Group Inc. (OMC.N, $77.08)Publicis Groupe SA (PUBP.PA, €59.56)Sky Plc (SKYB.L, 1456.0p)The Walt Disney Company (DIS.N, $104.78)Verizon Communications (VZ.N, $51.48)Viacom, Inc. (VIAB.OQ, $30.0)WPP (WPP.L, 1190.0p)
Disclosure AppendixAnalyst Certification I, Douglas Mitchelson, certify that (1) the views expressed in this report accurately reflect my personal views about all of the subject companies and securities and (2) no part of my compensation was, is or will be directly or indirectly related to the specific recommendations or views expressed in this report.
3-Year Price and Rating History for 21st Century Fox (FOXA.OQ)
FOXA.OQ Closing Price Target Price Date (US$) (US$) Rating 14-Sep-15 26.32 35.00 O 18-Nov-15 30.30 34.00 06-Jan-16 26.72 38.00 09-Feb-16 24.14 37.00 23-May-16 28.19 40.00 25-Jul-16 26.85 38.00 04-Aug-16 25.59 33.00 07-Nov-16 27.39 34.00 10-Jan-17 29.67 37.00 12-Oct-17 26.14 35.00 07-Nov-17 27.75 NC * Asterisk signifies initiation or assumption of coverage.Effective July 3, 2016, NC denotes termination of coverage.
Target Price Closing Price FOXA.OQ
01- Jan- 2016 01- Jan- 2017 01- Jan- 201820
30
40
50
O U T PERFO RMN O T C O V ERED
As of December 10, 2012 Analysts’ stock rating are defined as follows:Outperform (O) : The stock’s total return is expected to outperform the relevant benchmark* over the next 12 months.Neutral (N) : The stock’s total return is expected to be in line with the relevant benchmark* over the next 12 months.Underperform (U) : The stock’s total return is expected to underperform the relevant benchmark* over the next 12 months. *Relevant benchmark by region: As of 10th December 2012, Japanese ratings are based on a stock’s total return relative to the analyst's coverage universe which consists of all companies covered by the analyst within the relevant sector, with Outperforms representing the most attractive, Neutrals the less attractive, and Underperforms the least attractive investment opportunities. As of 2nd October 2012, U.S. and Canadian as well as European ratings are based on a stock’s total return relative to the analyst's coverage universe which consists of all companies covered by the analyst within the relevant sector, with Outperforms representing the most attractive, Neutrals the less attractive, and Underperforms the least attractive investment opportunities. For Latin American and Asia stocks (excluding Japan and Australia), ratings are based on a stock’s total return relative to the average total return of the relevant country or regional benchmark (India - S&P BSE Sensex Index); prior to 2nd October 2012 U.S. and Canadian ratings were based on (1) a stock’s absolute total return potential to its current share price and (2) the relative attractiveness of a stock’s total return potential within an analyst’s coverage universe. For Australian and New Zealand stocks, the expected total return (ETR) calculation includes 12-month rolling dividend yield. An Outperform rating is assigned where an ETR is greater than or equal to 7.5%; Underperform where an ETR less than or equal to 5%. A Neutral may be assigned where the ETR is between -5% and 15%. The overlapping rating range allows analysts to assign a rating that puts ETR in the context of associated risks. Prior to 18 May 2015, ETR ranges for Outperform and Underperform ratings did not overlap with Neutral thresholds between 15% and 7.5%, which was in operation from 7 July 2011.Restricted (R) : In certain circumstances, Credit Suisse policy and/or applicable law and regulations preclude certain types of communications, including an investment recommendation, during the course of Credit Suisse's engagement in an investment banking transaction and in certain other circumstances.Not Rated (NR) : Credit Suisse Equity Research does not have an investment rating or view on the stock or any other securities related to the company at this time.Not Covered (NC) : Credit Suisse Equity Research does not provide ongoing coverage of the company or offer an investment rating or investment view on the equity security of the company or related products.

10 July 2018
21st Century Fox (FOXA) 26
Volatility Indicator [V] : A stock is defined as volatile if the stock price has moved up or down by 20% or more in a month in at least 8 of the past 24 months or the analyst expects significant volatility going forward.Analysts’ sector weightings are distinct from analysts’ stock ratings and are based on the analyst’s expectations for the fundamentals and/or valuation of the sector* relative to the group’s historic fundamentals and/or valuation:Overweight : The analyst’s expectation for the sector’s fundamentals and/or valuation is favorable over the next 12 months.Market Weight : The analyst’s expectation for the sector’s fundamentals and/or valuation is neutral over the next 12 months.Underweight : The analyst’s expectation for the sector’s fundamentals and/or valuation is cautious over the next 12 months. *An analyst’s coverage sector consists of all companies covered by the analyst within the relevant sector. An analyst may cover multiple sectors.
Credit Suisse's distribution of stock ratings (and banking clients) is:
Global Ratings DistributionRating Versus universe (%) Of which banking clients (%)Outperform/Buy* 49% (62% banking clients)Neutral/Hold* 37% (57% banking clients)Underperform/Sell* 13% (51% banking clients)Restricted 2%*For purposes of the NYSE and FINRA ratings distribution disclosure requirements, our stock ratings of Outperform, Neutral, and Underperform most closely correspond to Buy, Hold, and Sell, respectively; however, the meanings are not the same, as our stock ratings are determined on a relative basis. (Please refer to definitions above.) An investor's decision to buy or sell a security should be based on investment objectives, current holdings, and other individual factors.
Important Global Disclosures Credit Suisse’s research reports are made available to clients through our proprietary research portal on CS PLUS. Credit Suisse research products may also be made available through third-party vendors or alternate electronic means as a convenience. Certain research products are only made available through CS PLUS. The services provided by Credit Suisse’s analysts to clients may depend on a specific client’s preferences regarding the frequency and manner of receiving communications, the client’s risk profile and investment, the size and scope of the overall client relationship with the Firm, as well as legal and regulatory constraints. To access all of Credit Suisse’s research that you are entitled to receive in the most timely manner, please contact your sales representative or go to https://plus.credit-suisse.com . Credit Suisse’s policy is to update research reports as it deems appropriate, based on developments with the subject company, the sector or the market that may have a material impact on the research views or opinions stated herein.Credit Suisse's policy is only to publish investment research that is impartial, independent, clear, fair and not misleading. For more detail please refer to Credit Suisse's Policies for Managing Conflicts of Interest in connection with Investment Research: https://www.credit-suisse.com/sites/disclaimers-ib/en/managing-conflicts.html . Credit Suisse does not provide any tax advice. Any statement herein regarding any US federal tax is not intended or written to be used, and cannot be used, by any taxpayer for the purposes of avoiding any penalties.Credit Suisse has decided not to enter into business relationships with companies that Credit Suisse has determined to be involved in the development, manufacture, or acquisition of anti-personnel mines and cluster munitions. For Credit Suisse's position on the issue, please see https://www.credit-suisse.com/media/assets/corporate/docs/about-us/responsibility/banking/policy-summaries-en.pdf . The analyst(s) responsible for preparing this research report received compensation that is based upon various factors including Credit Suisse's total revenues, a portion of which are generated by Credit Suisse's investment banking activities
Target Price and RatingValuation Methodology and Risks: (12 months) for 21st Century Fox (FOXA.OQ)
Method: Total FOXA currently trades at 12x CY19e EV/EBITDA and 23x P/E, reflective of its partial sale M&A process. Our $57 CYE’18 target price which drives our Outperform rating is derived via the $38/share Disney deal being valued at our Disney target price (our $114 Disney target is within the deal collar, leaving the stock value in-line with the accepted offer), adding $5/shr based on our assumption that there will be another round of bidding by Comcast and Disney, plus the value of New Fox using our CBS target 11.5x EBITDA multiple (another $14/shr). Note: Every +/-100bp change in EV/EBITDA for New Fox affects our target price by ~$1/share.
Risk: Risks to our Outperform rating and $57 target price specific to Fox include: Deal Regulatory Dynamics: Fox’s current valuation and our target price are based in part on the expectation that the company is acquired by Disney or Comcast. While the Disney acquisition has already been approved by regulators, to the extent Comcast wins the bidding war, the transaction would require regulatory approval. Economic Cyclicality: New Fox's operating results are sensitive to consumer spending and thus the state of the wider economy. To the extent the economy and consumer spending are unexpectedly weak or strong, our forecasts and valuation would be affected. Long-Term Programming Costs (Esp. NFL Renewal): Television network programming costs constitute a significant portion of New Fox’s operating expenditures. Insofar as sports rights (such as for the NFL) or other programming costs grow above or below our projections, the margins and profitability of the company may be affected. Popularity of Content: New Fox’s competitive position in its industry is to a large extent dependent on consumer tastes. Shifts in the popularity of content produced by the company may affect operating performance and profitability. Cord Cutting: The bulk of New Fox’s revenues are derived from traditional Pay TV. If cord-cutting and cord-shaving trends accelerate, the company’s revenue growth could slow; similarly, to the extent these trends moderate, revenues may exceed our forecasts and support a higher valuation.
Please refer to the firm's disclosure website at https://rave.credit-suisse.com/disclosures/view/selectArchive for the definitions of abbreviations typically used in the target price method and risk sections. See the Companies Mentioned section for full company names

10 July 2018
21st Century Fox (FOXA) 27
Credit Suisse currently has, or had within the past 12 months, the following as investment banking client(s): FOXA.OQCredit Suisse expects to receive or intends to seek investment banking related compensation from the subject company (FOXA.OQ) within the next 3 months.Credit Suisse or a member of the Credit Suisse Group is a market maker or liquidity provider in the securities of the following subject issuer(s): FOXA.OQA member of the Credit Suisse Group is party to an agreement with, or may have provided services set out in sections A and B of Annex I of Directive 2014/65/EU of the European Parliament and Council ("MiFID Services") to, the subject issuer (FOXA.OQ) within the past 12 months.Tidjane Thiam, the CEO of Credit Suisse is a non-executive Director of 21st Century Fox Inc. (FOXA).For date and time of production, dissemination and history of recommendation for the subject company(ies) featured in this report, disseminated within the past 12 months, please refer to the link: https://rave.credit-suisse.com/disclosures/view/report?i=368050&v=2a0y2d3vqnyzd3g9ee3il5ssw . Important Regional Disclosures Singapore recipients should contact Credit Suisse AG, Singapore Branch for any matters arising from this research report.The analyst(s) involved in the preparation of this report may participate in events hosted by the subject company, including site visits. Credit Suisse does not accept or permit analysts to accept payment or reimbursement for travel expenses associated with these events.Restrictions on certain Canadian securities are indicated by the following abbreviations: NVS--Non-Voting shares; RVS--Restricted Voting Shares; SVS--Subordinate Voting Shares.Individuals receiving this report from a Canadian investment dealer that is not affiliated with Credit Suisse should be advised that this report may not contain regulatory disclosures the non-affiliated Canadian investment dealer would be required to make if this were its own report.For Credit Suisse Securities (Canada), Inc.'s policies and procedures regarding the dissemination of equity research, please visit https://www.credit-suisse.com/sites/disclaimers-ib/en/canada-research-policy.html.Principal is not guaranteed in the case of equities because equity prices are variable.Commission is the commission rate or the amount agreed with a customer when setting up an account or at any time after that.This research report is authored by:Credit Suisse Securities (USA) LLC...................................................................Douglas Mitchelson ; Meghan Durkin ; Brian Russo ; Grant JoslinImportant Credit Suisse HOLT Disclosures The HOLT methodology does not assign ratings or a target price to a security. It is an analytical tool that involves use of a set of proprietary quantitative algorithms and warranted value calculations, collectively called the HOLT valuation model, that are consistently applied to all the companies included in its database. Third-party data (including consensus earnings estimates) are systematically translated into a number of default variables and incorporated into the algorithms available in the HOLT valuation model. The source financial statement, pricing, and earnings data provided by outside data vendors are subject to quality control and may also be adjusted to more closely measure the underlying economics of firm performance. These adjustments provide consistency when analyzing a single company across time, or analyzing multiple companies across industries or national borders. The default scenario that is produced by the HOLT valuation model establishes a warranted price for a security, and as the third-party data are updated, the warranted price may also change. The default variables may also be adjusted to produce alternative warranted prices, any of which could occur. The warranted price is an algorithmic output applied systematically across all companies based on historical levels and volatility of returns. Additional information about the HOLT methodology is available on request.CFROI, CFROE, HOLT, HOLT Lens, HOLTfolio, "Clarity is Confidence" and "Powered by HOLT" are trademarks or registered trademarks of Credit Suisse Group AG or its affiliates in the United States and other countries.HOLT is a corporate performance and valuation advisory service of Credit Suisse.© 2018 Credit Suisse Group AG and its subsidiaries and affiliates. All rights reserved.Important disclosures regarding companies that are the subject of this report are available by calling +1 (877) 291-2683. The same important disclosures, with the exception of valuation methodology and risk discussions, are also available on Credit Suisse’s disclosure website at https://rave.credit-suisse.com/disclosures . For valuation methodology and risks associated with any recommendation, price target, or rating referenced in this report, please refer to the disclosures section of the most recent report regarding the subject company.

10 July 2018
21st Century Fox (FOXA) 28
This report is produced by subsidiaries and affiliates of Credit Suisse operating under its Global Markets Division. For more information on our structure, please use the following link: https://www.credit-suisse.com/who-we-are This report may contain material that is not directed to, or intended for distribution to or use by, any person or entity who is a citizen or resident of or located in any locality, state, country or other jurisdiction where such distribution, publication, availability or use would be contrary to law or regulation or which would subject Credit Suisse or its affiliates ("CS") to any registration or licensing requirement within such jurisdiction. All material presented in this report, unless specifically indicated otherwise, is under copyright to CS. None of the material, nor its content, nor any copy of it, may be altered in any way, transmitted to, copied or distributed to any other party, without the prior express written permission of CS. All trademarks, service marks and logos used in this report are trademarks or service marks or registered trademarks or service marks of CS or its affiliates.The information, tools and material presented in this report are provided to you for information purposes only and are not to be used or considered as an offer or the solicitation of an offer to sell or to buy or subscribe for securities or other financial instruments. CS may not have taken any steps to ensure that the securities referred to in this report are suitable for any particular investor. CS will not treat recipients of this report as its customers by virtue of their receiving this report. The investments and services contained or referred to in this report may not be suitable for you and it is recommended that you consult an independent investment advisor if you are in doubt about such investments or investment services. Nothing in this report constitutes investment, legal, accounting or tax advice, or a representation that any investment or strategy is suitable or appropriate to your individual circumstances, or otherwise constitutes a personal recommendation to you. CS does not advise on the tax consequences of investments and you are advised to contact an independent tax adviser. Please note in particular that the bases and levels of taxation may change. Information and opinions presented in this report have been obtained or derived from sources believed by CS to be reliable, but CS makes no representation as to their accuracy or completeness. CS accepts no liability for loss arising from the use of the material presented in this report, except that this exclusion of liability does not apply to the extent that such liability arises under specific statutes or regulations applicable to CS. This report is not to be relied upon in substitution for the exercise of independent judgment. CS may have issued, and may in the future issue, other communications that are inconsistent with, and reach different conclusions from, the information presented in this report. Those communications reflect the different assumptions, views and analytical methods of the analysts who prepared them and CS is under no obligation to ensure that such other communications are brought to the attention of any recipient of this report. Some investments referred to in this report will be offered solely by a single entity and in the case of some investments solely by CS, or an associate of CS or CS may be the only market maker in such investments. Past performance should not be taken as an indication or guarantee of future performance, and no representation or warranty, express or implied, is made regarding future performance. Information, opinions and estimates contained in this report reflect a judgment at its original date of publication by CS and are subject to change without notice. The price, value of and income from any of the securities or financial instruments mentioned in this report can fall as well as rise. The value of securities and financial instruments is subject to exchange rate fluctuation that may have a positive or adverse effect on the price or income of such securities or financial instruments. Investors in securities such as ADR's, the values of which are influenced by currency volatility, effectively assume this risk. Structured securities are complex instruments, typically involve a high degree of risk and are intended for sale only to sophisticated investors who are capable of understanding and assuming the risks involved. The market value of any structured security may be affected by changes in economic, financial and political factors (including, but not limited to, spot and forward interest and exchange rates), time to maturity, market conditions and volatility, and the credit quality of any issuer or reference issuer. Any investor interested in purchasing a structured product should conduct their own investigation and analysis of the product and consult with their own professional advisers as to the risks involved in making such a purchase. Some investments discussed in this report may have a high level of volatility. High volatility investments may experience sudden and large falls in their value causing losses when that investment is realised. Those losses may equal your original investment. Indeed, in the case of some investments the potential losses may exceed the amount of initial investment and, in such circumstances, you may be required to pay more money to support those losses. Income yields from investments may fluctuate and, in consequence, initial capital paid to make the investment may be used as part of that income yield. Some investments may not be readily realisable and it may be difficult to sell or realise those investments, similarly it may prove difficult for you to obtain reliable information about the value, or risks, to which such an investment is exposed. This report may provide the addresses of, or contain hyperlinks to, websites. Except to the extent to which the report refers to website material of CS, CS has not reviewed any such site and takes no responsibility for the content contained therein. Such address or hyperlink (including addresses or hyperlinks to CS's own website material) is provided solely for your convenience and information and the content of any such website does not in any way form part of this document. Accessing such website or following such link through this report or CS's website shall be at your own risk.
This report is issued and distributed in European Union (except Switzerland): by Credit Suisse Securities (Europe) Limited, One Cabot Square, London E14 4QJ, England, which is authorised by the Prudential Regulation Authority and regulated by the Financial Conduct Authority and the Prudential Regulation Authority. Germany: Credit Suisse (Deutschland) Aktiengesellschaft regulated by the Bundesanstalt fuer Finanzdienstleistungsaufsicht ("BaFin"). United States and Canada: Credit Suisse Securities (USA) LLC; Switzerland: Credit Suisse AG; Brazil: Banco de Investimentos Credit Suisse (Brasil) S.A or its affiliates; Mexico: Banco Credit Suisse (México), S.A. (transactions related to the securities mentioned in this report will only be effected in compliance with applicable regulation); Japan: by Credit Suisse Securities (Japan) Limited, Financial Instruments Firm, Director-General of Kanto Local Finance Bureau ( Kinsho) No. 66, a member of Japan Securities Dealers Association, The Financial Futures Association of Japan, Japan Investment Advisers Association, Type II Financial Instruments Firms Association; Hong Kong: Credit Suisse (Hong Kong) Limited; Australia: Credit Suisse Equities (Australia) Limited; Thailand: Credit Suisse Securities (Thailand) Limited, regulated by the Office of the Securities and Exchange Commission, Thailand, having registered address at 990 Abdulrahim Place, 27th Floor, Unit 2701, Rama IV Road, Silom, Bangrak, Bangkok10500, Thailand, Tel. +66 2614 6000; Malaysia: Credit Suisse Securities (Malaysia) Sdn Bhd; Singapore: Credit Suisse AG, Singapore Branch; India: Credit Suisse Securities (India) Private Limited (CIN no.U67120MH1996PTC104392) regulated by the Securities and Exchange Board of India as Research Analyst (registration no. INH 000001030) and as Stock Broker (registration no. INB230970637; INF230970637; INB010970631; INF010970631), having registered address at 9th Floor, Ceejay House, Dr.A.B. Road, Worli, Mumbai - 18, India, T- +91-22 6777 3777; South Korea: Credit Suisse Securities (Europe) Limited, Seoul Branch; Taiwan: Credit Suisse AG Taipei Securities Branch; Indonesia: PT Credit Suisse Sekuritas Indonesia; Philippines:Credit Suisse Securities (Philippines ) Inc., and elsewhere in the world by the relevant authorised affiliate of the above.Additional Regional DisclaimersHong Kong: Credit Suisse (Hong Kong) Limited ("CSHK") is licensed and regulated by the Securities and Futures Commission of Hong Kong under the laws of Hong Kong, which differ from Australian laws. CSHKL does not hold an Australian financial services licence (AFSL) and is exempt from the requirement to hold an AFSL under the Corporations Act 2001 (the Act) under Class Order 03/1103 published by the ASIC in respect of financial services provided to Australian wholesale clients (within the meaning of section 761G of the Act). Research on Taiwanese securities produced by Credit Suisse AG, Taipei Securities Branch has been prepared by a registered Senior Business Person. Australia (to the extent services are offered in Australia): Credit Suisse Securities (Europe) Limited (“CSSEL”) and Credit Suisse International (“CSI”) are authorised by the Prudential Regulation Authority and regulated by the Financial Conduct Authority (“FCA”) and the Prudential Regulation Authority under UK laws, which differ from Australian Laws. CSSEL and CSI do not hold an Australian Financial Services Licence (“AFSL”) and are exempt from the requirement to hold an AFSL under the Corporations Act (Cth) 2001 (“Corporations Act”) under Class Order 03/1099 published by the Australian Securities and Investments Commission (“ASIC”), in respect of the financial services provided to Australian wholesale clients (within the meaning of section 761G of the Corporations Act). This material is not for distribution to retail clients and is directed exclusively at Credit Suisse's professional clients and eligible counterparties as defined by the FCA, and wholesale clients as defined under section 761G of the Corporations Act. Credit Suisse (Hong Kong) Limited (“CSHK”) is licensed and regulated by the Securities and Futures Commission of Hong Kong under the laws of Hong Kong, which differ from Australian laws. CSHKL does not hold an AFSL and is exempt from the requirement to hold an AFSL under the Corporations Act under Class Order 03/1103 published by the ASIC in respect of financial services provided to Australian wholesale clients (within the meaning of section 761G of the Corporations Act). Credit Suisse Securities (USA) LLC (CSSU) and Credit Suisse Asset Management LLC (CSAM LLC) are licensed and regulated by the Securities Exchange Commission of the United States under the laws of the United States, which differ from Australian laws. CSSU and CSAM LLC do not hold an AFSL and is exempt from the requirement to hold an AFSL under the Corporations Act under Class Order 03/1100 published by the ASIC in respect of financial services provided to Australian wholesale clients (within the meaning of section 761G of the Corporations Act). Malaysia: Research provided to residents of Malaysia is authorised by the Head of Research for Credit Suisse Securities (Malaysia) Sdn Bhd, to whom they should direct any queries on +603 2723 2020. Singapore: This report has been prepared and issued for distribution in Singapore to institutional investors, accredited investors and expert investors (each as defined under the Financial Advisers Regulations) only, and is also distributed by Credit Suisse AG, Singapore Branch to overseas investors (as defined under the Financial Advisers Regulations). Credit Suisse AG, Singapore Branch may distribute reports produced by its foreign entities or affiliates pursuant to an arrangement under Regulation 32C of the Financial Advisers Regulations. Singapore recipients should contact Credit Suisse AG, Singapore Branch at +65-6212-2000 for matters arising from, or in connection with, this report. By virtue of your status as an institutional investor, accredited investor, expert investor or overseas investor, Credit Suisse AG, Singapore Branch is exempted from complying with certain compliance requirements under the Financial Advisers Act, Chapter 110 of Singapore (the “FAA”), the Financial Advisers Regulations and the relevant Notices and Guidelines issued thereunder, in respect of any financial advisory service which Credit Suisse AG, Singapore Branch may provide to you. UAE: This information is being distributed by Credit Suisse AG (DIFC Branch), duly licensed and regulated by the Dubai Financial Services Authority (“DFSA”). Related financial services or products are only made available to Professional Clients or Market Counterparties, as defined by the DFSA, and are not intended for any other persons. Credit Suisse AG (DIFC Branch) is located on Level 9 East, The Gate Building, DIFC, Dubai, United Arab Emirates. EU: This report has been produced by subsidiaries and affiliates of Credit Suisse operating under its Global Markets Division In jurisdictions where CS is not already registered or licensed to trade in securities, transactions will only be effected in accordance with applicable securities legislation, which will vary from jurisdiction to jurisdiction and may require that the trade be made in accordance with applicable exemptions from registration or licensing requirements. This material is issued and distributed in the U.S. by CSSU, a member of NYSE, FINRA, SIPC and the NFA, and CSSU accepts responsibility for its contents. Clients should contact analysts and execute transactions through a Credit Suisse subsidiary or affiliate in their home jurisdiction unless governing law permits otherwise. Please note that this research was originally prepared and issued by CS for distribution to their market professional and institutional investor customers. Recipients who are not market professional or institutional investor customers of CS should seek the advice of their independent financial advisor prior to taking any investment decision based on this report or for any necessary explanation of its contents. This research may relate to investments or services of a person outside of the UK or to other matters which are not authorised by the Prudential Regulation Authority and regulated by the Financial Conduct Authority and the Prudential Regulation Authority or in respect of which the protections of the Prudential Regulation Authority and Financial Conduct Authority for private customers and/or the UK compensation scheme may not be available, and further details as to where this may be the case are available upon request in respect of this report. CS may provide various services to US municipal entities or obligated persons ("municipalities"), including suggesting individual transactions or trades and entering into such transactions. Any services CS provides to municipalities are not viewed as "advice" within the meaning of Section 975 of the Dodd-Frank Wall Street Reform and Consumer Protection Act. CS is providing any such services and related information solely on an arm's length basis and not as an advisor or fiduciary to the municipality. In connection with the provision of the any such services, there is no agreement, direct or indirect, between any municipality (including the officials,management, employees or agents thereof) and CS for CS to provide advice to the municipality. Municipalities should consult with their financial, accounting and legal advisors regarding any such services provided by CS. In addition, CS is not acting for direct or indirect compensation to solicit the municipality on behalf of an unaffiliated broker, dealer, municipal securities dealer, municipal advisor, or investment adviser for the purpose of obtaining or retaining an engagement by the municipality for or in connection with Municipal Financial Products, the issuance of municipal securities, or of an investment adviser to provide investment advisory services to or on behalf of the municipality. If this report is being distributed by a financial institution other than Credit Suisse AG, or its affiliates, that financial institution is solely responsible for distribution. Clients of that institution should contact that institution to effect a transaction in the securities mentioned in this report or require further information. This report does not constitute investment advice by Credit Suisse to the clients of the distributing financial institution, and neither Credit Suisse AG, its affiliates, and their respective officers, directors and employees accept any liability whatsoever for any direct or consequential loss arising from their use of this report or its content. Principal is not guaranteed. Commission is the commission rate or the amount agreed with a customer when setting up an account or at any time after that. No information or communication provided herein or otherwise is intended to be, or should be construed as, a recommendation within the meaning of the US Department of Labor’s final regulation defining "investment advice" for purposes of the Employee Retirement Income Security Act of 1974, as amended and Section 4975 of the Internal Revenue Code of 1986, as amended, and the information provided herein is intended to be general information, and should not be construed as, providing investment advice (impartial or otherwise). Copyright © 2018 CREDIT SUISSE AG and/or its affiliates. All rights reserved. Investment principal on bonds can be eroded depending on sale price or market price. In addition, there are bonds on which investment principal can be eroded due to changes in redemption amounts. Care is required when investing in such instruments.