1.0 Conservation of Biological Diversity
46
30 1.0 Conservation of Biological Diversity Biological diversity describes the number and kinds of plant and animal life forms, their genetic make-up, and the habitats where they live. Generally, greater diversity means a greater potential to adapt to changes. To preserve biological diversity, animal and plant species must be able to freely interact with one another and with the environment. Human activities can adversely impact biodiversity by altering habitats, introducing invasive species or reducing the population or range of species. Conserving the diversity of organisms should support the ability of ecosystems to function, reproduce and remain productive. There must be food, water, and shelter with sufficient space and light spread across the landscape for animals and plants to survive. This chapter begins with background information about climate, land usage, forest land changes, stocking levels, the impacts from settlement on surrounding forests and the efforts to conserve and protect forests in Iowa. There will also be discussion about the role trees have within urban communities; this is particularly important because so many communities were settled along rivers, which usually contain at least a riparian forest component for building materials and fuel wood. The forest types, size classes, age classes and successional stages show how the forest resource varies across the state. The USDA Forest Service Forest Inventory Data describes the impacts that people have on the forest resource, and shows trends whenever possible. Also within this chapter geospatial analysis is used to show the extent of forest land conversion, fragmentation, and parcelization. Finally, the status of forest communities and wildlife species of special concern that depend on the different forest types, age classes and successional stages is described. Climate Before looking at the forest types growing in Iowa, climate variations must be considered in order to understand why certain forest types dominate different areas of the state. Climate also helps to partition the state into different eco-regions, which act as a baseline for comparison for the different issues and threats facing Iowa forests. Iowa is located in the heartland of the United States and is bordered by the Mississippi River on the east and the Missouri and Big Sioux Rivers on the west. Iowa has a relatively low relief - elevations run from a high of 1,670 feet above mean sea level in Osceola County in northwestern Iowa to 480 feet above mean sea level in Lee County in the southeastern corner of the state. The climate of Iowa is influenced by its mid-continental location and the sheltering effect of the Rocky Mountains. A wide range of temperatures occur throughout the year, with hot summers and cold winters. Strong winds blow across Iowa throughout the year, which makes any exposed soil vulnerable to windblown erosion. This is most obvious by the creation of the Loess Hills, which are located along the state’s western boundary.
Transcript of 1.0 Conservation of Biological Diversity

30
1.0 Conservation of Biological DiversityBiological diversity describes the number and kinds of plant and animal life forms, their genetic make-up, and the habitats where they live. Generally, greater diversity means a greater potential to adapt to changes. To preserve biological diversity, animal and plant species must be able to freely interact with one another and with the environment. Human activities can adversely impact biodiversity by altering habitats, introducing invasive species or reducing the population or range of species. Conserving the diversity of organisms should support the ability of ecosystems to function, reproduce and remain productive. There must be food, water, and shelter with sufficient space and light spread across the landscape for animals and plants to survive.
This chapter begins with background information about climate, land usage, forest land changes, stocking levels, the impacts from settlement on surrounding forests and the efforts to conserve and protect forests in Iowa. There will also be discussion about the role trees have within urban communities; this is particularly important because so many communities were settled along rivers, which usually contain at least a riparian forest component for building materials and fuel wood.
The forest types, size classes, age classes and successional stages show how the forest resource varies across the state. The USDA Forest Service Forest Inventory Data describes the impacts that people have on the forest resource, and shows trends whenever possible.
Also within this chapter geospatial analysis is used to show the extent of forest land conversion, fragmentation, and parcelization. Finally, the status of forest communities and wildlife species of special concern that depend on the different forest types, age classes and successional stages is described.
ClimateBefore looking at the forest types growing in Iowa, climate variations must be considered in order to understand why certain forest types dominate different areas of the state. Climate also helps to partition the state into different eco-regions, which act as a baseline for comparison for the different issues and threats facing Iowa forests.
Iowa is located in the heartland of the United States and is bordered by the Mississippi River on the east and the Missouri and Big Sioux Rivers on the west. Iowa has a relatively low relief - elevations run from a high of 1,670 feet above mean sea level in Osceola County in northwestern Iowa to 480 feet above mean sea level in Lee County in the southeastern corner of the state.
The climate of Iowa is influenced by its mid-continental location and the sheltering effect of the Rocky Mountains. A wide range of temperatures occur throughout the year, with hot summers and cold winters. Strong winds blow across Iowa throughout the year, which makes any exposed soil vulnerable to windblown erosion. This is most obvious by the creation of the Loess Hills, which are located along the state’s western boundary.

31
These climatic factors combine to influence the length of the growing season across the state. Late frosts in the spring and early freezes in the fall result in a reduced growing season of 135 days in northeastern and northwestern Iowa. The longest growing season is in southeastern Iowa, with an average of 175 days. The state average growing season is 158 days long.
Statewide winter snowfall averages 32 inches. Northern Iowa (defined here as the region of the state north of U.S. Highway 30) receives frequent, often blowing and drifting snow typically associated with strong winds. Southern Iowa may experience substantial snowfall but has more frequent ice storms because its average temperature is 6-7 degree higher than in the northern part of the state. This results in a snow cover that is often covered by a surface crust of ice or hard snow. Harsh conditions seldom last for more than a few weeks in most of the state, particularly in the southern half.
The average annual precipitation is 34 inches. The northwest part of the state is the driest with an annual precipitation of 28 inches while the southeast is the wettest with an annual precipitation of 36 inches. Iowa often experiences seasonal extremes and frequent local, rapid weather changes due to the convergence of cold, dry Arctic air, moist maritime air from the Gulf of Mexico, and dry Pacific air masses.6
Like most states, periods of severe drought and periods of excessive precipitation can have a dramatic impact on terrestrial and aquatic vegetation as well as their associated fish and wildlife species. Every 30 years or so there is a long drought period which lasts for several years. The most famous drought was in the 1930s, when the Plains states were called the “Dust Bowl”. There have been two “100 year” floods in 1993 and 2008 causing billions of dollars in damage to private property and wiping out habitat for a variety of wildlife species. Tree mortality increased for riparian species like silver maple, cottonwood and black walnut in the 1990’s and it is expected that trend will regain momentum in the upcoming decade as a result of the 2008 flooding.
6<www.crh.noaa.gov/images/dvn/downloads/Clim_IA_01.pdf>. Feb. 5 2009.
The average temperature in the summer ranges from 71 degrees Fahrenheit in the northern part of the state to 73 degrees in the southern part. December to February winter temperatures average 22 degrees Fahrenheit with an average winter difference of 6.5 degrees between north and south. Temperature minimums of -25 degrees Fahrenheit are not uncommon in northern Iowa.
32
1.1 Area of Total Land, Forest Land and Reserved Forest LandThere are 36 million acres of land in Iowa. Once it was discovered that Iowa contained extremely productive soil, the transformation of native permanent vegetation resulted in one of the most altered landscapes in the world. When Iowa was discovered by European settlers, it was described as having 76% prairie (27,360,000 acres), 18% forest (6,700,000 acres) and 5% water and wetlands (1,800,000 acres). There is now less than 1% of the original prairie and wetlands left in small isolated areas and about 8% of the forest cover. Over time, these habitats have been fragmented and dramatically reduced in size, which has led to population losses for wildlife.
Figure 1.1 shows that forests made up about 8% of Iowa’s 36 million acres in 2002. Trees provide multiple benefits for wildlife, shade, windbreaks, beauty, recreation, clean air, clean water and wood products to everyone living in Iowa. Land used for agricultural crops represent 58% of the land usage with an additional 4% being idled in the Conservation Reserve Program. Out of the 58% of agricultural land, 53% is classified as prime farm land. Prime agricultural farm land is primarily located in the northern half of the state, much of it along river valleys.
Figure 1.1 Iowa’s Land Usage, 2002.
Source: Landsat TMSI.
Iowa has lost over half of the forest it had in the
1840’s.

33
Figure 1.2 shows spatially where Iowa’s forests were documented during the initial land survey of Iowa. Historic forests provide a footprint to begin prioritizing areas to improve the quality, quantity and connectivity of existing forests today.
Figure 1.2 Historical Forest Cover.
Source: Kathryne Clark, Iowa DNR GIS using General Land Office (GLO) Maps as Surveyed from 1836-59.
Iowa opened for settlement in 1833 and by 1910 most of the land had been converted to agricultural production. Early settlers used trees for lumber or other wood products or cleared areas to grow agricultural crops as they learned how productive the soils were for growing food. As local populations increased, growing demand for housing materials led to greater utilization of Iowa’s forest resource in the later half of the 1800’s. This combination of recognizing the soil producing capabilities for agricultural production and a growing human population placed a lot of pressure on Iowa’s natural resources. The conversion of Iowa’s native ecosystems allows it to produce a tenth of the nation’s food supply.7
Iowa ranked 45th among all states for number of acres covered in forest in 1987. In 2007 Iowa ranked 40th among all states in the number of acres of forest.8 Between 1987 and 2007, Iowa experienced the largest percentage increase (84%) in forest land of any state in the U.S. While many states are losing forest land, Iowa actually gained 1,317,000 acres of forest during this time period. For comparison, this was the 8th largest increase among all 50 states during this time frame.
Though Iowa ranks 40th in the nation in number of acres of forest land, this does not mean that
7Stone.8Smith, W. Brad et al. Forest Resources of the United States, 2002. Gen. Tech. Rep. NC-241. St. Paul, MN: U.S. Department of Agriculture, For-est Service, North Central Research Station, 2003. p. 137.

34
the importance of the forest and its resources are any less important than in other states. The diversity of habitat within the state provides for a wide variety of wildlife that has had to adapt to fewer acres of available permanent vegetation. Most of Iowa’s forests are located on steep slopes with sensitive soils or within riparian zones. The forests provide a wide range of uses for people today, just as they did during settlement. Natural resources have helped Iowa grow a strong manufacturing base to complement the agriculture industry, which has provided a diversity of job opportunities in both rural and urban areas.
The map in Figure 1.3 shows where Iowa’s forest cover is located based on 2002 satellite imagery. Forests made up 2,857,042 acres or nearly 8% of the land in 2002.
Figure 1.3 Existing Forest Cover in Iowa.
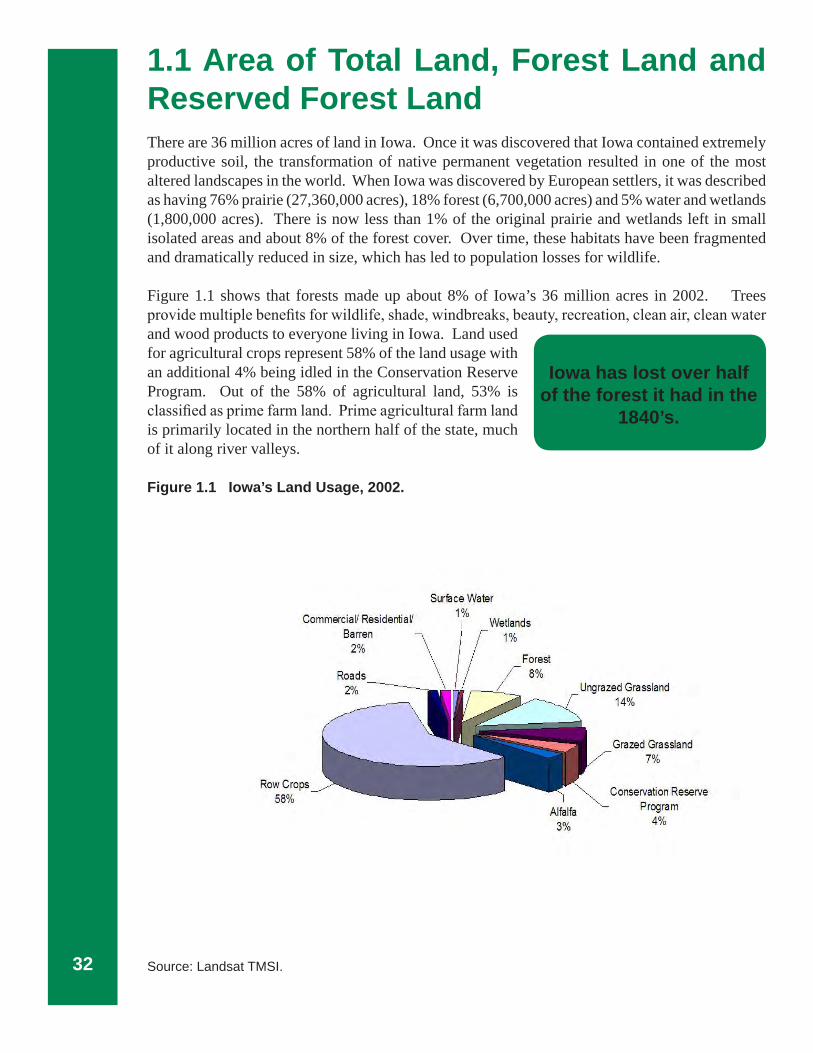
Source: Kathryne Clark, using satellite land cover from 2002. Figure 1.4 shows the trend for forest area in Iowa through time based on the best information available. The year 1630 is included as an estimate for general reference purposes only to convey the relative extent of forest land at the time of European settlement. As the graph below shows, Iowa never has returned to growing as many acres of forest as it had 380 years ago.
35
Figure 1.4 Acres of Forest in Iowa.
In 1974 a United State Department of Agriculture, Forest Service, Forest Inventory Analysis (USDA-FS-FIA) inventory found that Iowa had reduced the forest land cover to its lowest level ever recorded at 1.5 million acres. At that time every county in the state had some forest land, from 25% in Allamakee to less than 1% in 31 of the state’s 99 counties. Farmers owned 66% of the forest with another 24% owned by industrial and other non-farm landowners. Public entities owned 8% as state forests, parks, wildlife areas, watershed protection areas, flood prevention areas, recreational areas and military lands.9
Figure 1.5 shows the recent increasing trend of forest cover throughout Iowa. In 2007, U.S. Forest Service Forest Inventory and Analysis (FIA) data showed Iowa had 3.054 million acres of forest land. Allamakee County once again led all counties in Iowa at 42% forest cover while the number of counties with less than 1% forest cover dropped to only 14. Appendix A has a complete listing of the number of acres of forest for every county. Public entities have increased the number of acres of forest ownership to 9%.10
Figure 1.5 Forest Acres for Selected Years in Iowa.Year Acres of Forest Land (USFS FIA)1990 2,054,7942003 2,665,1502004 2,748,7172005 2,878,9422006 2,993,2672007 3,054,000
Source: Miles, P.D., 2010.
9Leatherberry, Earl C. et al. Iowa’s forests 1999-2003, Part A (Resource Bulletin NC-266A). St. Paul, MN: U.S. Department of Agriculture, Forest Service, North Central Research Station, 2006.10Miles, P.D. Forest Inventory EVALIDator web-application version 4.01 beta. St.Paul, MN:U.S. Department of Agriculture, Forest Service,
Northern Research Station. Jan 13 2010 < fiatools.fs.fed.us/Evalidator 4/tmattribute.jsp>.
Source: Smith, Brad. “Forest Resources of the United States”, 2007.
0
1,000,000
2,000,000
3,000,000
4,000,000
5,000,000
6,000,000
Acres
1630
1907
1920
1938
1953
1963
1977
1987
1997
2007
Year
Forest Area in Iowa

36
Forest Area by CountyIowa’s forest acreage has been steadily increasing since the low point in the early 1970’s. Figure 1.6 shows which counties in Iowa have the largest percentage of their available land in forest. The darker green counties have the largest percentage of forest, while the pink colored counties have the least.
Allamakee County had both the highest number of acres (176,000) and the largest percentage (42%) of its county covered with forest in Iowa in 2006 based on USDA-FS-FIA data. Most of Iowa’s forest resource is located in the northeast part of the state and the bottom 2 tiers of counties in the southeast area. Appendix A has a complete listing of the number of acres of forest for every county.
Figure 1.6 Change in Forest by County as a Percentage of Total Land Area, 1990-2003.
Source: Leatherberry et al., p.19, 2006.
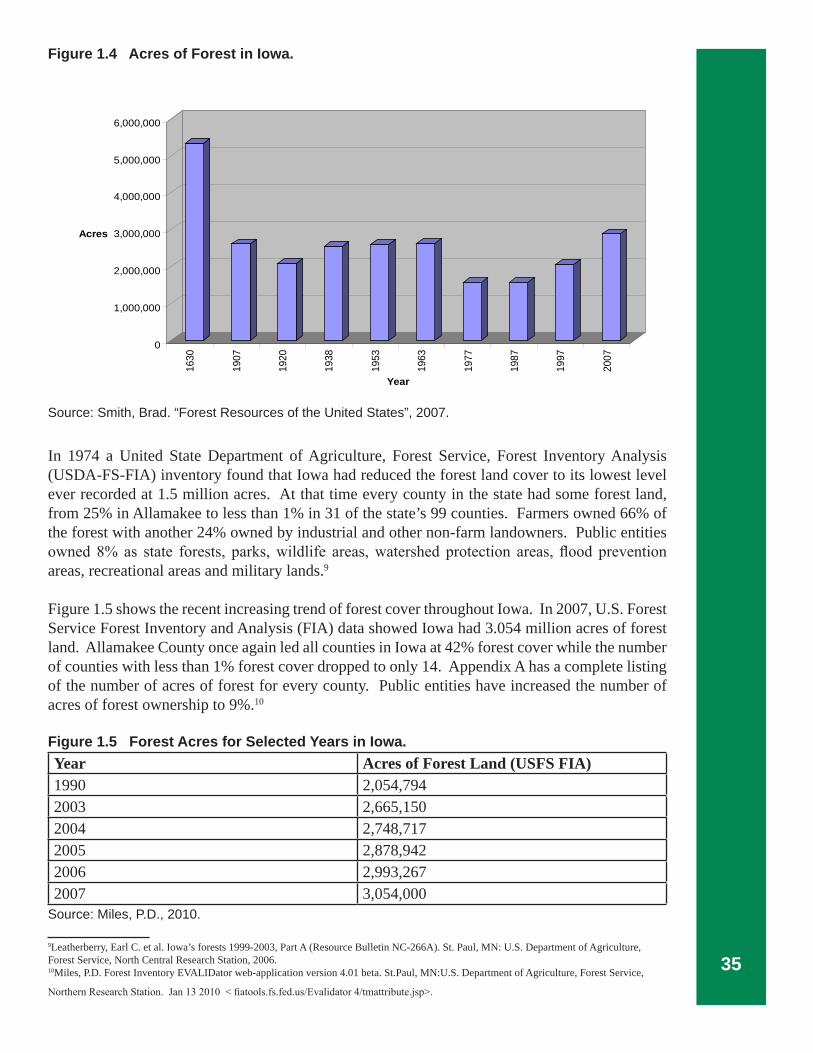
There are 9 counties in Iowa that have both the highest amount of forest within them and have the highest percentage of forest in their county when compared to the total amount of land for that county. These 9 counties represent over 894,000 acres of forest or 30% of Iowa’s total forested acreage based on 2006 USDA-FS-FIA data. Figure 1.7 lists the most heavily forested counties showing their acres and percent forested.
37
Figure 1.7 Counties with the Most Forest in Iowa in 2006.County Land in County Acres of Forest Percent ForestedAllamakee 420,318 176,675 42.03Clayton 518,960 142,133 27.39Jackson 415,252 108,807 26.20Decatur 338,921 92,369 27.25Lee 340,189 84,507 24.84Van Buren 311,995 76,275 24.45Des Moines 284,172 72,632 25.66Monroe 286,085 71,498 24.99Wapello 274,560 69,717 25.39Totals 894,612 29.89
Source: Miles, P.D.
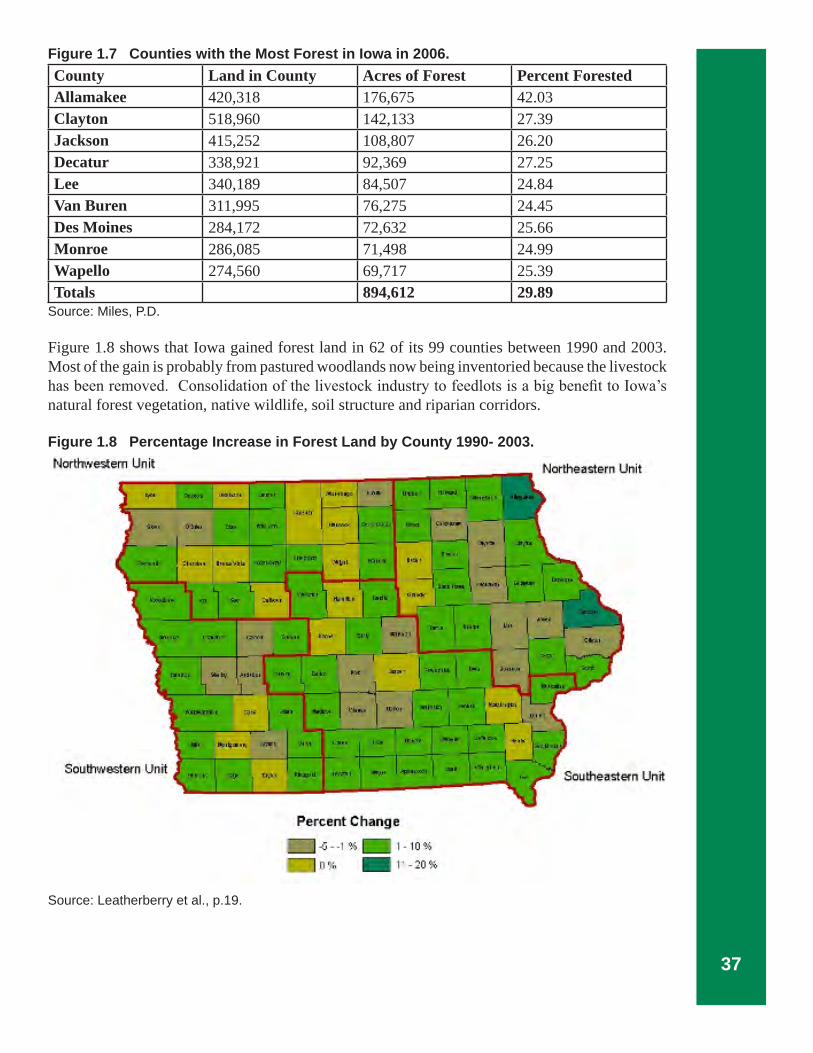
Figure 1.8 shows that Iowa gained forest land in 62 of its 99 counties between 1990 and 2003. Most of the gain is probably from pastured woodlands now being inventoried because the livestock has been removed. Consolidation of the livestock industry to feedlots is a big benefit to Iowa’s natural forest vegetation, native wildlife, soil structure and riparian corridors.
Figure 1.8 Percentage Increase in Forest Land by County 1990- 2003.
Source: Leatherberry et al., p.19.

38
There are 36 million acres of land in Iowa — 3 million acres are classified as forest.
Forest Area by Eco-regionsThere are 36 million acres of land in Iowa. When the last glacier, called the Des Moines Lobe, melted about 12,000 years ago and flattened wet, boggy forests of spruce and tamarack, Iowa’s vegetation was comprised of 76% prairie, 18% woodland and 6% wetlands and river waterways.
Figure 1.9 shows boundaries for the state’s nine eco-regions. These regions were determined by climatic conditions, underlying bedrock and glacial and loess deposit locations.
Figure 1.9 Eco-region Boundaries for Iowa.
Source: Kathryne Clark.

39
Figure 1.10 shows how Iowa’s forested acres have changed within each eco-region from the time of statehood to the present era. The eco-regions are listed from largest in total area (Southern Iowa Rolling Loess Prairies) to the smallest (Interior River Lowland) and acres for each eco-region are listed on the map in Figure 1.9. Column 1846 is based on original land surveyor notes taken between 1832 and 1859 that describe the trees growing in the area.
The 2002 column is based on satellite imagery technology that does not account for land use. The USDA-FS-FIA does take into consideration land use when determining if an area qualifies as forest. Pointing out this distinction in definitions is important to avoid direct comparison between USDA-FS-FIA data and this aerial imagery. The satellite imagery counts areas as forest even if the area is grazed, whereas the Forest Service doesn’t include these areas in their surveys. Definitions along riparian areas would not allow all of these areas to qualify as forest land that a satellite image may collect.
Figure 1.10 Comparison of Forested Acres in Iowa from Statehood (1846) to 2002.
Source: Kathryne Clark.
Certainly we will never know exactly how Iowa’s forests have changed since the beginning of statehood, but using the best data available allows for discussion of some general trends. The Southern Iowa Rolling Loess Prairies region has lost the greatest amount of forest land (1.1 million acres) while the Paleozoic Plateau has lost the greatest percentage (47%). The Loess Hills eco-regions are the only eco-regions to have gained forest, from 3% to 315%. The forest cover gain in these regions combined totals under 45,000 acres, or less than 1% of total land area. Overall, Iowa has lost more than 3.6 million acres (56%) of forest land since it became a state.
Characteristics of Each Eco-region
A brief description about the geology, area of forest cover, forest types, rivers, wildlife and human impact on each eco-region is provided, beginning with the eco-region covering the greatest area in the state and ending with the eco-region covering the smallest area.
Eco-RegionSouthern Iowa Roll-ing Loess PrairiesDes Moines LobeIowan SurfaceCentral Irregular Plains
1846 (acres)2002 Satellite
Imagery (acres)Acreage Change
Percentage Change
Loess Hills and Roll-ing PlainsNW IA Loess PrairiesPaleozoic PlateauLoess HillsMissouri Alluvial PlainInterior River LowlandTotal Acres
2,043,610
464,177826,251
1,402,023
71,433
9,660
1,327,836121,29190,041
115,2596,471,581
866,969
219,764277,647693,230
73,553
40,114480,545133,620
15,73743,711
2,846,892
-1,176,641
-244,413-548,604-708,793
2,120
30,454-847,291
12,329-74,304
-71,548-3,624,689
-58
-53-66-51
3
315-6410-83-62-56
40
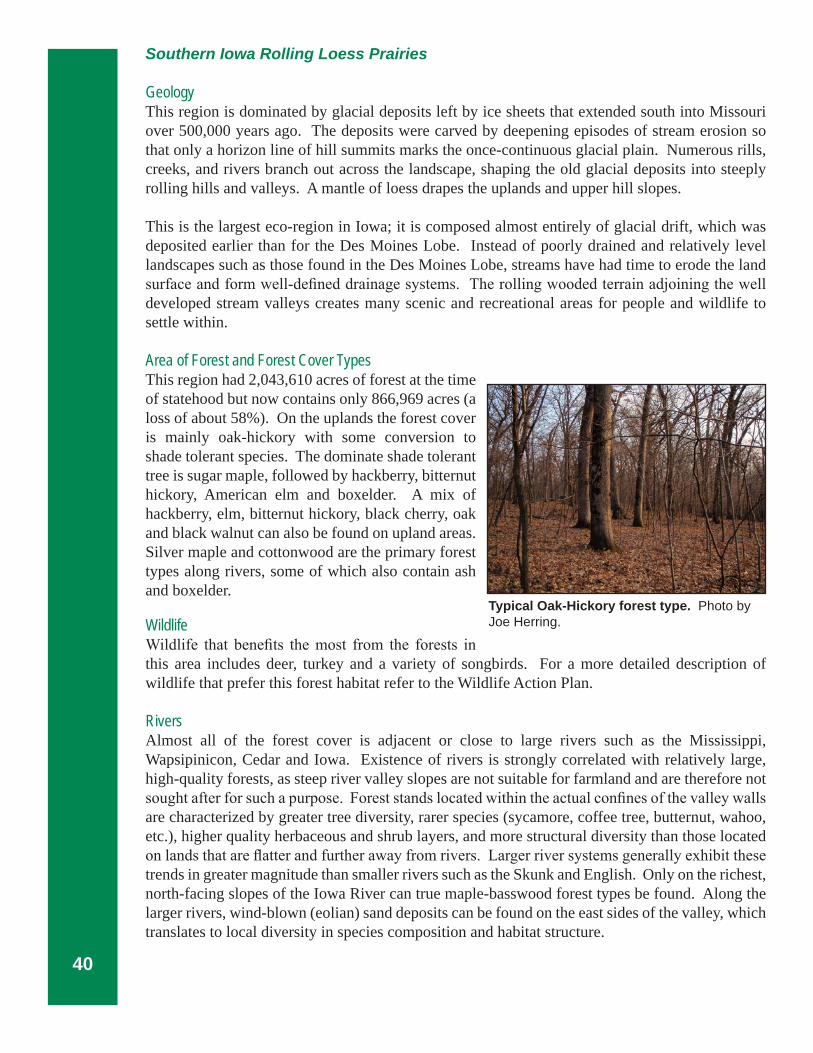
Typical Oak-Hickory forest type. Photo by Joe Herring.
Southern Iowa Rolling Loess Prairies
GeologyThis region is dominated by glacial deposits left by ice sheets that extended south into Missouri over 500,000 years ago. The deposits were carved by deepening episodes of stream erosion so that only a horizon line of hill summits marks the once-continuous glacial plain. Numerous rills, creeks, and rivers branch out across the landscape, shaping the old glacial deposits into steeply rolling hills and valleys. A mantle of loess drapes the uplands and upper hill slopes.
This is the largest eco-region in Iowa; it is composed almost entirely of glacial drift, which was deposited earlier than for the Des Moines Lobe. Instead of poorly drained and relatively level landscapes such as those found in the Des Moines Lobe, streams have had time to erode the land surface and form well-defined drainage systems. The rolling wooded terrain adjoining the well developed stream valleys creates many scenic and recreational areas for people and wildlife to settle within.
Area of Forest and Forest Cover TypesThis region had 2,043,610 acres of forest at the time of statehood but now contains only 866,969 acres (a loss of about 58%). On the uplands the forest cover is mainly oak-hickory with some conversion to shade tolerant species. The dominate shade tolerant tree is sugar maple, followed by hackberry, bitternut hickory, American elm and boxelder. A mix of hackberry, elm, bitternut hickory, black cherry, oak and black walnut can also be found on upland areas. Silver maple and cottonwood are the primary forest types along rivers, some of which also contain ash and boxelder.
WildlifeWildlife that benefits the most from the forests in this area includes deer, turkey and a variety of songbirds. For a more detailed description of wildlife that prefer this forest habitat refer to the Wildlife Action Plan.
RiversAlmost all of the forest cover is adjacent or close to large rivers such as the Mississippi, Wapsipinicon, Cedar and Iowa. Existence of rivers is strongly correlated with relatively large, high-quality forests, as steep river valley slopes are not suitable for farmland and are therefore not sought after for such a purpose. Forest stands located within the actual confines of the valley walls are characterized by greater tree diversity, rarer species (sycamore, coffee tree, butternut, wahoo, etc.), higher quality herbaceous and shrub layers, and more structural diversity than those located on lands that are flatter and further away from rivers. Larger river systems generally exhibit these trends in greater magnitude than smaller rivers such as the Skunk and English. Only on the richest, north-facing slopes of the Iowa River can true maple-basswood forest types be found. Along the larger rivers, wind-blown (eolian) sand deposits can be found on the east sides of the valley, which translates to local diversity in species composition and habitat structure.

41
Human ImpactAgriculture has reduced the total number of forest acres by simple conversion to row crop and by grazing systems in the timber. Grazing has reduced understory diversity, regeneration capacity, soil quality, tree health and environmental quality. Harvesting of timber products from the forest has been done unsustainably in many cases and has led to reduced stand quality and decreased genetic value. Parcelization resulting from construction of new housing developments and other activities has also had a tremendous impact on the forest resource of this region.
Unique Forest TypeThe picture is from a unique site called Swamp White Oak Preserve, a Nature Conservancy site near Muscatine. Thanks to a high water table and frequent flooding, this 372 acre preserve is one of the best remaining examples of the oak woodlands that were once common in Iowa’s floodplains. Now rare, these woodlands are considered to be the most biologically diverse forest type in all of Iowa. The oak woodland type is classified as a G-1 woodland community, meaning it’s one of the rarest of woodland areas. Most forests like this have either been altered by lack of fire or have been cut down for agricultural purposes.
Des Moines Lobe
GeologyIn north-central Iowa, the terrain offers a whole new set of challenges and opportunities. Here, farmers praise the flat, black, productive soils, while naturalists tout the pothole marshes and glacial lakes. It is a young landscape with dry, knobby mounds (of sand and gravel) and shallow, wet bowls (depressions) - the “tracks” of glaciers that melted just 13,000 to 12,000 years ago. Valuable deposits of gravel and sand lie where they were strewn by the glaciers or melt water streams. Those pulses of water from the decaying ice also formed wide valleys that now carry much smaller rivers.
But the glaciers left much of north-central Iowa’s land tabletop flat, without a distinct natural drainage pattern. To make the fields dry enough for farming, people built a series of drainage ditches, fed by clay and plastic tile lines to hurry the water off the land. For more than a century, landowners have tiled, ditched, and drained the region to convert its marshes to some of the world’s premier farmland. Water now runs off this productive land instead of being absorbed by wetlands or other areas with permanent vegetation with a stable soil structure.
Area of Forest and Forest Cover TypeThis eco-region contained an estimated 464,177 acres of forest when Iowa became a state but now contains only 219,764 acres. Forests are predominantly oak-hickory, succeeding to hackberry, basswood, and bitternut hickory. Oak species include bur oak, red oak and black oak, and hickory species include bitternut hickory and shagbark hickory. Hackberry, green ash, cottonwood,
Swamp White Oak Preserve in this eco-region. Photo by Mark Vitosh.

42
Siberian elm, black walnut, ironwood, coffee tree, mulberry, red elm and American elm are also associated with forests in this region
Along second and third order streams, deep alluvial soils support rich walnut-hackberry stands. Along larger rivers with well-established floodplains, forests are mostly even-aged stands of silver maple, cottonwood, willow, ash, and boxelder.
WildlifeWildlife that benefits the most from the forests in this area includes deer, turkey and a variety of songbirds. For a more detailed description of wildlife that prefer this forest habitat refer to the Wildlife Action Plan.
RiversForested areas cover the main river channels and adjacent drainages. Erosion into large river systems caused steep slopes to develop, exposing underlying glacial till soils. The aspect of these slopes determines which tree and shrub species will survive and thrive.
Human ImpactDue to past management, which has included selective harvesting of high value trees followed by grazing, many stands are two-aged, with older, widely spaced trees that were of too poor of quality to be logged. These forests were often oak and hickory with a younger generation (30-50 years) of mixed species (cherry, hackberry, hickory, elm) that evolved when grazing ceased. Another common stand type seen on floodplains is two-aged bur oak/soft maple, which contains mature bur oaks widely scattered among second generation bottomland hardwoods.
Unique Forest TypeThe deep ravines and north facing coves have allowed black walnut and red oak to grow very well. Isolated pockets of butternut trees can sometimes be found as well.
Iowan Surface GeologyThe last period of intense glacial cold that occurred 21,000 to 16,000 years ago had pronounced effects on northern Iowa, which was not far from the glacier front. Tundra and permafrost conditions persisted while hilly landscapes succumbed to vigorous episodes of weathering and leveling as materials were loosened and moved. This process created the gently rolling terrain of northeastern Iowa.
Typical Oak-Hickory forest type in this eco-region. Photo by Joe Herring.
43
The stones, carried from the north during an earlier glaciation more than 500,000 years ago, lie scattered in pastures or piled by farmers in fence rows. Abundant groundwater reaches the surface in springs, rivers and peaty wetlands, called fens, which also support rare plant and animal communities. Heavily wooded flood plains grew along water corridors.
The Iowan Surface has a higher amount of sandy/sand loam soils than the eco-regions to the south, which results in random patches of forest across the otherwise largely agricultural landscape. Moving further northeast in this eco-region, small quantities of aspen can be found within the other forest types.
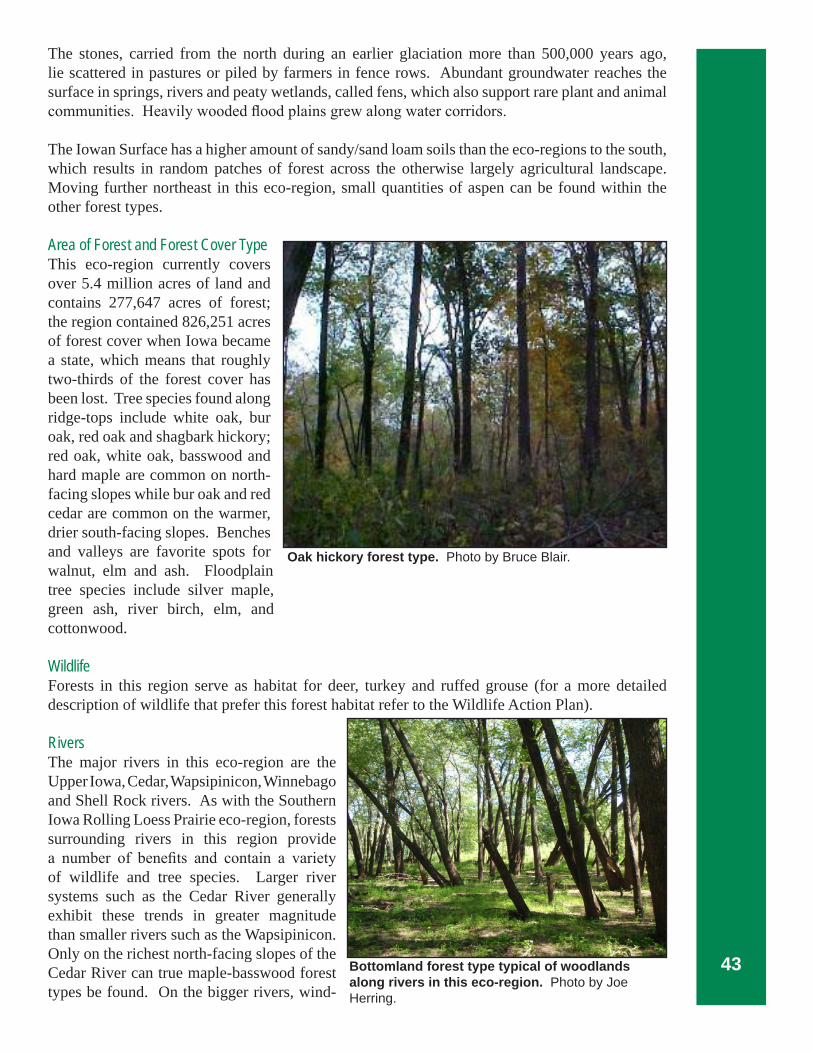
Area of Forest and Forest Cover TypeThis eco-region currently covers over 5.4 million acres of land and contains 277,647 acres of forest; the region contained 826,251 acres of forest cover when Iowa became a state, which means that roughly two-thirds of the forest cover has been lost. Tree species found along ridge-tops include white oak, bur oak, red oak and shagbark hickory; red oak, white oak, basswood and hard maple are common on north-facing slopes while bur oak and red cedar are common on the warmer, drier south-facing slopes. Benches and valleys are favorite spots for walnut, elm and ash. Floodplain tree species include silver maple, green ash, river birch, elm, and cottonwood.
WildlifeForests in this region serve as habitat for deer, turkey and ruffed grouse (for a more detailed description of wildlife that prefer this forest habitat refer to the Wildlife Action Plan).
RiversThe major rivers in this eco-region are the Upper Iowa, Cedar, Wapsipinicon, Winnebago and Shell Rock rivers. As with the Southern Iowa Rolling Loess Prairie eco-region, forests surrounding rivers in this region provide a number of benefits and contain a variety of wildlife and tree species. Larger river systems such as the Cedar River generally exhibit these trends in greater magnitude than smaller rivers such as the Wapsipinicon. Only on the richest north-facing slopes of the Cedar River can true maple-basswood forest types be found. On the bigger rivers, wind-
Bottomland forest type typical of woodlands along rivers in this eco-region. Photo by Joe Herring.
Oak hickory forest type. Photo by Bruce Blair.

44
Stephens State Forest. Photo by Jessica Flatt.
blown (eolian) sand deposits on the east sides of the valley can be found, which translates to local diversity in species composition and habitat structure.
Human ImpactConversion of timber to row cropping and grazing systems has reduced the total number of forest acres. Grazing has led to a decrease in under story diversity, regeneration capacity, soil quality, tree health and overall environmental quality. Harvesting of timber products from the forest has been done unsustainably in many cases and has therefore led to a reduction in stand quality and value. People have made a large impact on the forested resource in this region. Pastures and woodlands have been tiled and cleared to make way for farming, and landowners are less willing to take land out of production to plant permanent vegetation like trees because of the loss of income they would otherwise be able to receive by farming the area.
Unique Forest TypeThe most distinguishing characteristic of this region is the elongated, diagonal Paha ridges that are forested remnants of the former Southern Iowa Drift Plain surface.
Central Irregular Plains
GeologyThe Central Irregular Plains eco-region covers over 3.6 million acres in south-central Iowa. Major rivers within the eco-region are the Chariton, Des Moines, Grand, Missouri and their tributaries. The topography ranges from flat to moderately hilly. Glacial till forms the parent material for most of the soil, while Loess deposits increase toward the western part of this region.
Area of Forest and Forest Cover TypeLand in this region is used for contour farming, as pasture for livestock and as both private and public forest. The region has lost roughly half of its forest cover in the last 150+ years, and now contains 693,230 acres of forest. The oak-hickory forest type is the most common on uplands, which are composed of species like white oak, red oak, black oak, bur oak, ash, black cherry and shagbark hickory. Along riparian areas, silver maple, elm, hackberry, basswood, bitternut hickory, cottonwood, swamp white oak, bur oak, red oak, green ash, river birch, shellbark hickory, sycamore and basswood can be found in varying amounts. Black walnut exists on properly drained bottomlands, second bottoms, and benches and may be mixed on upland sites.
WildlifeWildlife that depends on forests in this region includes deer, turkey, woodcocks, grouse and other non-game bird species. Secondarily, quail management is important near woodland edges. For a
45
more detailed description of wildlife that prefer this forest habitat refer to the Wildlife Action Plan.
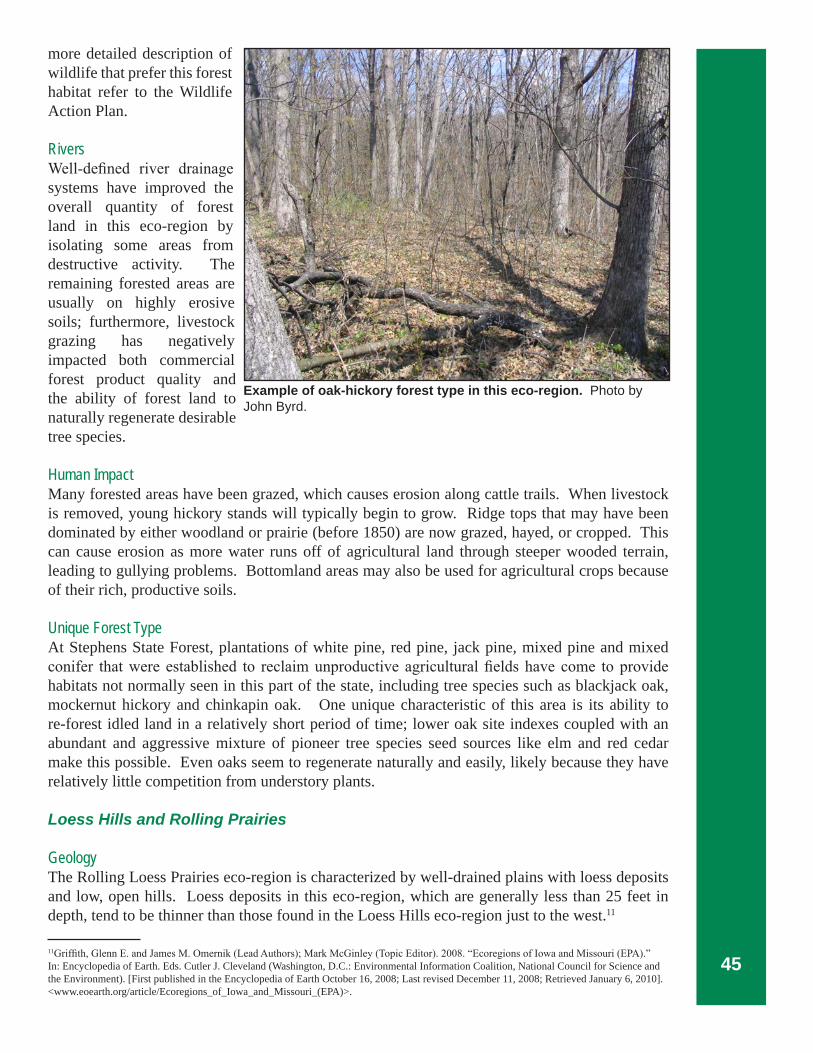
RiversWell-defined river drainage systems have improved the overall quantity of forest land in this eco-region by isolating some areas from destructive activity. The remaining forested areas are usually on highly erosive soils; furthermore, livestock grazing has negatively impacted both commercial forest product quality and the ability of forest land to naturally regenerate desirable tree species. Human ImpactMany forested areas have been grazed, which causes erosion along cattle trails. When livestock is removed, young hickory stands will typically begin to grow. Ridge tops that may have been dominated by either woodland or prairie (before 1850) are now grazed, hayed, or cropped. This can cause erosion as more water runs off of agricultural land through steeper wooded terrain, leading to gullying problems. Bottomland areas may also be used for agricultural crops because of their rich, productive soils.
Unique Forest TypeAt Stephens State Forest, plantations of white pine, red pine, jack pine, mixed pine and mixed conifer that were established to reclaim unproductive agricultural fields have come to provide habitats not normally seen in this part of the state, including tree species such as blackjack oak, mockernut hickory and chinkapin oak. One unique characteristic of this area is its ability to re-forest idled land in a relatively short period of time; lower oak site indexes coupled with an abundant and aggressive mixture of pioneer tree species seed sources like elm and red cedar make this possible. Even oaks seem to regenerate naturally and easily, likely because they have relatively little competition from understory plants.
Loess Hills and Rolling Prairies
GeologyThe Rolling Loess Prairies eco-region is characterized by well-drained plains with loess deposits and low, open hills. Loess deposits in this eco-region, which are generally less than 25 feet in depth, tend to be thinner than those found in the Loess Hills eco-region just to the west.11
Example of oak-hickory forest type in this eco-region. Photo by John Byrd.
11Griffith, Glenn E. and James M. Omernik (Lead Authors); Mark McGinley (Topic Editor). 2008. “Ecoregions of Iowa and Missouri (EPA).” In: Encyclopedia of Earth. Eds. Cutler J. Cleveland (Washington, D.C.: Environmental Information Coalition, National Council for Science and the Environment). [First published in the Encyclopedia of Earth October 16, 2008; Last revised December 11, 2008; Retrieved January 6, 2010]. <www.eoearth.org/article/Ecoregions_of_Iowa_and_Missouri_(EPA)>.

46
Area of Forest and Forest Cover TypeThis eco-region covers an area of slightly more than 3.3 million acres, of which just 73,553 are forest. Despite its relatively small amount of forest cover, it contained only 71,433 acres of forest in the mid-nineteenth century, making it one of only three eco-regions in the state to have actually gained forest land since the beginning of statehood. Ridge top forests are dominated by bur oak and shagbark hickory. North-facing slopes contain a lot of black oak whereas south-facing slopes are dominated by bur oak and red cedar. Benches and valleys are favorite spots for walnut, elm, basswood and ash while silver maple, green ash, hackberry, river birch, elm and cottonwood are typically found in floodplains.
WildlifeForest wildlife in this region includes deer, turkey and a variety of songbirds. For a more detailed description refer to the Wildlife Action Plan.
RiversThe three rivers in the region, the Nishnabotna, Boyer, and Soldier, are primarily used for agricultural field drainage, which increases the productivity of row cropping. Due to intense farming practices, very little bottomland forests remains within the region’s riparian zones.
Human ImpactAgriculture dominates the landscape in this eco-region, pushing the forests to the least productive soils on steep terrain.
Unique Forest TypeThe deep ravines and north facing coves have allowed black walnut, red oak, bur oak, basswood, hackberry, and Kentucky coffee tree to grow very well.
Northwest Iowa Loess Prairie
GeologyEvidence of the tundra and glacier that once made up this eco-region has been covered by layers of windblown loess and modified by erosion from a network of streams. Broad valleys and open uplands roll to the horizon, creating landscapes reminiscent of the ranch country of the Dakotas. Time and weather have exposed tips of the state’s oldest bedrock, the Sioux Quartzite, which pokes to the surface in northwest Lyon County. The ancient reddish rock formed from sediments in coastal waters more than 1.6 billion years ago. The famous Pipestone quarries in southwestern Minnesota are in this same distinct red rock formation, which is regarded as sacred ground by Native American tribes. Ironically, the state’s youngest bedrock - sandstone, shale, chalk and limestone, which are less than 100 million years old - lies directly against the oldest; these newer sediments formed in shallow seas confined by cliffs of the old Sioux Quartzite.
Area of Forest and Forest Cover TypeAccording to historical estimates from the 1850’s, this eco-region contained the least amount of forest of any region in the state both in terms of total acres (9,660 acres) and as a percentage of total land (0.3%); though forest cover has grown to 40,114 acres (a gain of more than 300%), the region is still one of the least-forested areas of the state. Bur oak and hickory are found on upland sites while silver maple and cottonwood grow on bottomland sites.

47
WildlifeWildlife found in the region’s forests includes deer, turkey and a variety of songbirds (see the Wildlife Action Plan for a more detailed description).
RiversAs in the Loess Hills and Rolling Prairie eco-region, the two primary rivers in this region, the Rock and Floyd, are used to drain agricultural fields, and very little bottomland forest remains within the region’s riparian areas.
Human ImpactAgriculture dominates the landscape in this eco-region, and the little forest land that remains is on steep slopes that are unsuitable for farming.
Paleozoic Plateau
Geology The scenic eco-region is characterized by narrow valleys deeply carved into Paleozoic-era sedimentary rock as well as a near-absence of glacial deposits. Fossil-bearing strata in this region originated as sediment on tropical sea floors between 300 and 550 million years ago. Rock layers vary in resistance to erosion, producing bluffs, waterfalls and rapids. Shallow limestone, coupled with the dissolving action of groundwater, yields numerous caves, springs and sinkholes.
The bedrock of this region is primarily limestone, dolomite, sandstone and shale. The limestone and dolomite are relatively porous due to the affects of slightly acidic rain, which has, over the course of thousands of years, dissolved portions of this bedrock to create crevasses, caves and sink-holes.
Soils are shallow to non-existent on the numerous steep slopes. Exposed bedrock and outcroppings are common features. Most of this area consists of well drained uplands. The soils are primarily derived from accumulations of loess.
Now close to the surface in the Paleozoic Plateau, the ancient sediments in this region are subject to erosion from rain water and melting snow that seeps into cracks and fissures in the rock. This action has resulted in the presence of the sinkholes, springs and caves common in this area, which are collectively referred to as Karst topography (landforms for which rock outcroppings and sinkholes are common). Sinkholes can be problematic because they provide direct access for contaminated surface water to pollute the ground water. The existence of this Karst landscape accounts for the many unique microclimates in this area, as well as the cold water streams. Springs are also very common in parts of the region where limestone overlies less porous sandstone or shale and groundwater is forced to the surface as a result.
The Karst topography within this eco-region contains interesting geologic features called algific talus slopes. These slopes are usually rocky and typically occur on steep, north-facing slopes. In special situations, cold winter air will circulate through deep cracks in these slopes. Often there are sinkholes near the top of the slopes that directly connect with these cracks. This plumbing system can run from the top all the way to the bottom of the slopes, which in turn can cause frost to form deep into the hillside. In the summer, cool air spills out from the cracks in the side of the slopes from the still frozen ground and creates a micro-climate that can support plants that would otherwise perish in Iowa’s hot climate. The endangered Iowa Pleistocene Snail (Discus macclintocki) and Northern Wild Monkshood flower (Aconitum noveboracense) exist only on

48 An algific slope. Photo by Gary Beyer.
these special sites. Other unique species which can be found on these slopes include Golden Saxifrage (Chrysosplenium iowenses), Mountain Maple (Acer spicatum), Yellow Birch (Betula alleghaniensis), Balsam Fir (Abies balsamea) and Canadian Yew (Taxus canadensis).
The eastern half of the Paleozoic Plateau is often referred to as the Driftless Area, which was thought to be untouched by the most recent periods of glaciation in the Pleistocene Era. Although this has been found to be untrue by geologists, there is a striking difference in landscape features between the Driftless Area and the remainder of the state, where glacial deposits heavily mask the effect of local bedrock.
Natural FeaturesNatural features in this region include limestone bluffs, cold water streams and algific slopes. The Mississippi River bluffs allow for spectacular views from 400 feet above the water’s surface. Many small caves and rock outcrops can be seen from below. Traveling west from the Mississippi, the terrain becomes gentler everywhere except in the major river and creek channels, where abrupt changes in topography are prevalent.
ArchaeologyRich in prehistoric culture, this area of Iowa contains many known archaeological sites. The presence of Native American Effigy Mounds (burial mounds in the shape of animals) was one of the reasons that parts of the original Yellow River State Forest were transferred to the National Park Service in 1949 and became Effigy Mounds National Monument. Other sites that have archaeological significance can be found within the borders of Yellow River State Forest, including Paint Rock, numerous Native American camps and the site of the first Native American Mission school west of the Mississippi river (located in the Yellow River unit of Yellow River State Forest).

49
Area of Forest and Forest Cover TypeThis eco-region has traditionally been, by percentage, the most heavily forested area of the state and it continues to maintain that distinction today. The combination of topography, forest cover and increased precipitation creates rich diverse communities of plants and wildlife. Of the 1,327,836 acres of forest that existed when Iowa became a state, only 480,545 or 36% still remains.
This eco-region is dominated by upland forest types, with bottomland forests making up a small percentage of the total forest area. White oak and red oak trees dominate the ridge tops, with more red oak occurring on the north and east aspects. Bur oak, black oak and, in some cases, chinkapin oak are common on the steeper south and west aspects. The trees on these slopes tend to be short and scrubby in appearance, producing poor quality timber but providing important wildlife habitat.
A larger mix of central hardwoods can also be found on upland sites throughout this region. Species like hard maple, basswood, black cherry, black walnut, butternut, white ash, black ash, hackberry, shagbark hickory, bitternut hickory, white elm and red elm are common along with the oaks. This mix of tree species reflects the randomness caused by years of past disturbances from pasturing, harvesting and abandonment.
Along narrow bottomlands species like white elm, rock elm, black ash and hackberry are typical. On wider streams and river valleys more bur oak, swamp white oak, green ash, willow, cottonwood, boxelder, silver maple and some black walnut can be found.
The forest of the Paleozoic eco-region has been dominated by oak species especially red, white and bur oak. Most of the mature trees are over 120 years old and are being replaced by maple species, primarily sugar maple, and bitternut hickory. Flood plains in the Paleozoic Plateau are usually narrow with abrupt vertical rock walls as boundaries, and they typically contain bottomland hardwoods such as soft maple and cottonwood.
Most of the woodlands are found along or adjacent to rivers. There are some larger blocks (greater than 2,000 acres) that are not near rivers and many small blocks of 5 to 100 acres that are the remnants of the large timber blocks that have been cleared away for agricultural production.
WildlifeMost forest landowners manage their lands for white tail deer and wild turkey, and since the oak-hickory forest type is common here, not much effort is needed to maintain these wildlife species. Some landowners manage for early successional habitat that is typically comprised of young, dense cover and that contains a heavy component of aspen. This creates habitat for game birds like ruffed grouse and American woodcock. Edge feathering is encouraged to create brushy habitat on the forest borders, which helps limit the impact of parasitism to song bird nests by brown-headed cowbirds.
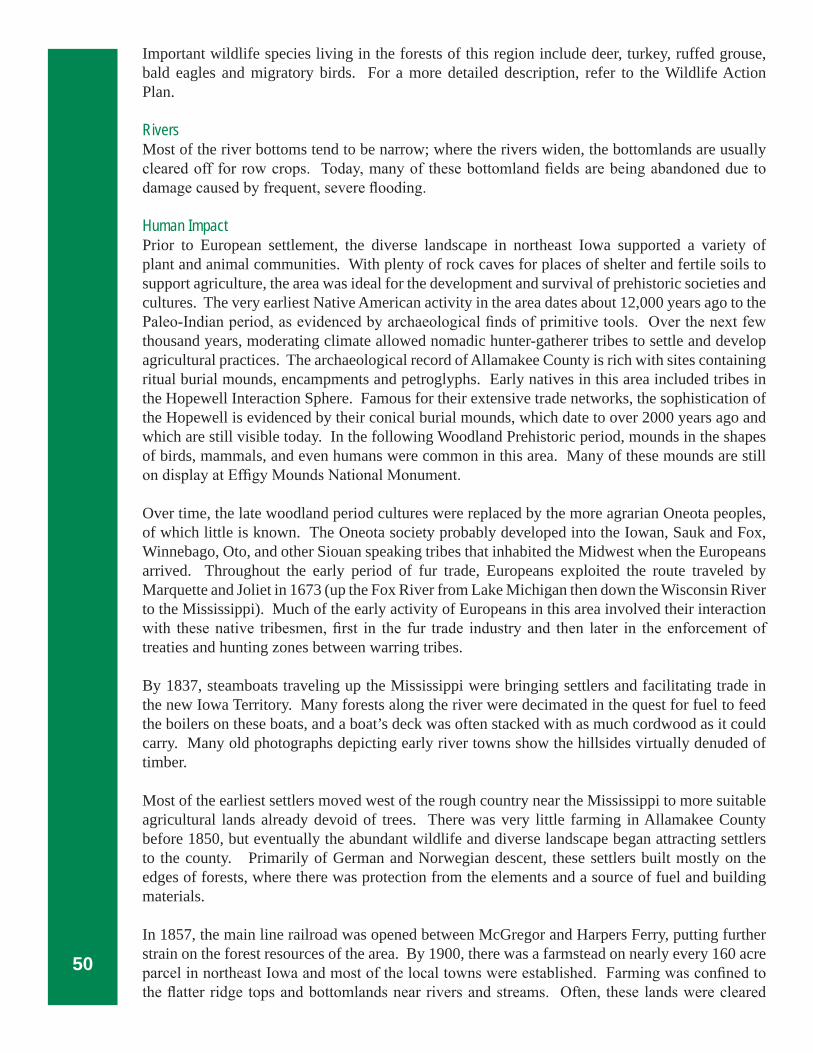
White pine in northeast Iowa. Photo by Bruce Blair.
50
Important wildlife species living in the forests of this region include deer, turkey, ruffed grouse, bald eagles and migratory birds. For a more detailed description, refer to the Wildlife Action Plan.
RiversMost of the river bottoms tend to be narrow; where the rivers widen, the bottomlands are usually cleared off for row crops. Today, many of these bottomland fields are being abandoned due to damage caused by frequent, severe flooding.
Human ImpactPrior to European settlement, the diverse landscape in northeast Iowa supported a variety of plant and animal communities. With plenty of rock caves for places of shelter and fertile soils to support agriculture, the area was ideal for the development and survival of prehistoric societies and cultures. The very earliest Native American activity in the area dates about 12,000 years ago to the Paleo-Indian period, as evidenced by archaeological finds of primitive tools. Over the next few thousand years, moderating climate allowed nomadic hunter-gatherer tribes to settle and develop agricultural practices. The archaeological record of Allamakee County is rich with sites containing ritual burial mounds, encampments and petroglyphs. Early natives in this area included tribes in the Hopewell Interaction Sphere. Famous for their extensive trade networks, the sophistication of the Hopewell is evidenced by their conical burial mounds, which date to over 2000 years ago and which are still visible today. In the following Woodland Prehistoric period, mounds in the shapes of birds, mammals, and even humans were common in this area. Many of these mounds are still on display at Effigy Mounds National Monument.
Over time, the late woodland period cultures were replaced by the more agrarian Oneota peoples, of which little is known. The Oneota society probably developed into the Iowan, Sauk and Fox, Winnebago, Oto, and other Siouan speaking tribes that inhabited the Midwest when the Europeans arrived. Throughout the early period of fur trade, Europeans exploited the route traveled by Marquette and Joliet in 1673 (up the Fox River from Lake Michigan then down the Wisconsin River to the Mississippi). Much of the early activity of Europeans in this area involved their interaction with these native tribesmen, first in the fur trade industry and then later in the enforcement of treaties and hunting zones between warring tribes.
By 1837, steamboats traveling up the Mississippi were bringing settlers and facilitating trade in the new Iowa Territory. Many forests along the river were decimated in the quest for fuel to feed the boilers on these boats, and a boat’s deck was often stacked with as much cordwood as it could carry. Many old photographs depicting early river towns show the hillsides virtually denuded of timber.
Most of the earliest settlers moved west of the rough country near the Mississippi to more suitable agricultural lands already devoid of trees. There was very little farming in Allamakee County before 1850, but eventually the abundant wildlife and diverse landscape began attracting settlers to the county. Primarily of German and Norwegian descent, these settlers built mostly on the edges of forests, where there was protection from the elements and a source of fuel and building materials.
In 1857, the main line railroad was opened between McGregor and Harpers Ferry, putting further strain on the forest resources of the area. By 1900, there was a farmstead on nearly every 160 acre parcel in northeast Iowa and most of the local towns were established. Farming was confined to the flatter ridge tops and bottomlands near rivers and streams. Often, these lands were cleared

51
of timber to make way for corn, potatoes, and wheat. The Yellow River was the site of several sawmills and grist mills during this time period.
The mining of coal eventually took the strain off local timber as a source of fuel for boats and trains, and forests began to grow back in areas not being used for farming. Prairie fires which once burned unchecked were a relic of the past, gone with the Native American culture. The landscape had changed dramatically in a span of about 65 years.
While early riverboat traffic was instrumental to local development, it also consumed a lot of fuel from forests adjacent to the Mississippi River. As settlement continued, the railroads expanded into the area with even greater demand for fuel wood, and forests along the Mississippi and its tributaries were cut heavily to supply this demand. Many of the earliest settlers preferred to build close to forests for a source of fuel and building materials, further increasing the demand on local forests. Much land was also cleared for farming.
Today, local land use is mostly agricultural, with farming on the flatter ridge tops and on the bottomlands next to creeks and rivers. Livestock grazing is prevalent on the steeper open grounds. Agriculture has heavily impacted the forests in this region, mostly due to land clearing and grazing. During the 1990’s forests were squared up by planting trees in agriculture fields, and with the high commodity prices between 2006 and 2009, bulldozers were used to remove forest cover to straighten out fields.
Due to its rugged terrain, few places in this eco-region remain to be converted to agriculture. Land clearing is also slowing down because landowners are beginning to realize the value of timber and to see forests as an important part of a healthy farm operation. More recreational users own land within this region as well, and these owners tend to value the forest land that they have. However, the region’s forests are still threatened by community growth and construction of new homes.
Major communities in the area include Waukon, Lansing, and Marquette, as well as nearby Prairie du Chien, Wisconsin. The smaller communities of Harpers Ferry, Waterville, and Rossville account for most of the local population.
Unique Forest TypeThere are several unique tree species types, including white pine, yellow birch, paper birch and butternut.
Loess Hills
GeologyHere, uncommonly thick deposits of loess create a distinct landscape. The silt, ground by glaciers, was carried down the Missouri River by seasonal melt water from winter snow pack and by spring and summer floods. During drier periods, especially between 28,000 and 12,000 years ago, vast quantities of loose silt were swept from the broad valley and re-deposited, with the deepest accumulation within 10 miles of the Missouri River. Subsequent erosion has sculpted the tan deposits into an array of peaked hills and narrow ridge crests with steep diverging side slopes.
The formation is only one to 15 miles wide but extends nearly 200 miles along the Missouri River from near Sioux City, Iowa south to St. Joseph, Missouri. Loess deposits are found in many parts of the world, but nowhere else, except in China, do they reach as high as in Iowa.

52
Area of Forest and Forest Cover TypeThis eco-region is a thin sliver of land stretched from north to south covering an area just over 1 million acres of land. Today there are 133,620 acres of forest cover compared to 121,291 acres at the time of statehood, a gain of 10%. Forests along ridge-tops are dominated by bur oak and shagbark hickory. Black oak is common on north-facing slopes, while bur oak and red cedar are found on south-facing slopes. Benches and valleys are favorite spots for walnut, elm and ash. Floodplain tree species include silver maple, green ash, hackberry, river birch, elm and cottonwood.
WildlifeDeer, turkey and a variety of songbirds benefit most from forests in this eco-region, while bald eagles nest in large trees along the Missouri River. For a more detailed description of wildlife in this eco-region, refer to the Wildlife Action Plan.
RiversThe Floyd and Soldier rivers are used primarily for agricultural drainage, and little bottomland riparian forests exists in the region today.
Human ImpactAgriculture dominates the landscape in this eco-region, pushing the forests to the least productive soils on steep terrain.
Unique Forest TypeThe deep ravines and north facing coves have allowed black walnut, red oak, bur oak, hackberry and coffee tree to grow very well.
Missouri Alluvial Plains
GeologyRivers weave throughout Iowa, eroding and depositing sediment (alluvium) on their adjoining plains. Backwater sloughs and oxbow lakes on larger floodplains mark former channel meanders. Most rivers originated during melting of various ice sheets that covered all or parts of Iowa. Some alluvial plains (see map above) appear unusually wide for their river’s size, owing to the large volume of melt water floods that once flowed through them.
Area of Forest and Forest Cover TypeThis eco-region is a thin sliver of land stretched from north to south covering an area of 645,272 acres. Today there are only 15,737 acres in forest cover compared to 90,041 acres at the beginning of statehood, a loss of 83%. Ridge tops are dominated by bur oak and shagbark hickory. North-facing slopes contain black oak and black walnut while south-facing slopes contain bur oak and red cedar. Benches and valleys are favorite spots for walnut, elm and ash. Floodplain tree species include silver maple, green ash, hackberry, river birch, elm and cottonwood.
WildlifeGame species that depend on the forest types in the region are deer and turkey, and non-game species include bald eagles, herons and songbirds. For a more detailed description, refer to the Wildlife Action Plan.
RiversThe Boyer and Soldier rivers are used primarily for agricultural drainage, and very little bottomland riparian areas exist in the region today.

53
Human ImpactThis region has lost its most productive forest soils to agriculture. Forests that remain are mostly found on steep or rolling terrain and are used for grazing livestock.
Unique Forest TypeThe region’s deep ravines and north-facing coves have allowed black walnut, red oak, bur oak, hackberry, and Kentucky coffee tree to grow very well.
Interior River Lowlands
Area of Forest and Forest Cover TypeThis eco-region is the smallest in Iowa with a total land area of 393,422 acres. There were an estimated 115,249 acres of forest at the beginning of statehood compared to only 43,711 acres today, a loss of 62%. A mix of white oak, red oak, bur oak and shagbark hickory are most commonly found on uplands, which also contain some elm and ash. Along riparian areas species like cottonwood, silver maple, boxelder, bitternut hickory, ash, swamp white oak and black walnut are most common.
WildlifeGame species in this region are deer and turkey, while non-game species include bald eagles, herons and songbirds. For a more detailed description of the eco-region’s wildlife, refer to the Wildlife Action Plan.
RiversThe majority of the forest left in this eco-region is along the rivers. Flooding over the past couple of years has caused significant damage to young tree plantings.
Young black walnut stand. Photo by Lisa Louck.
54
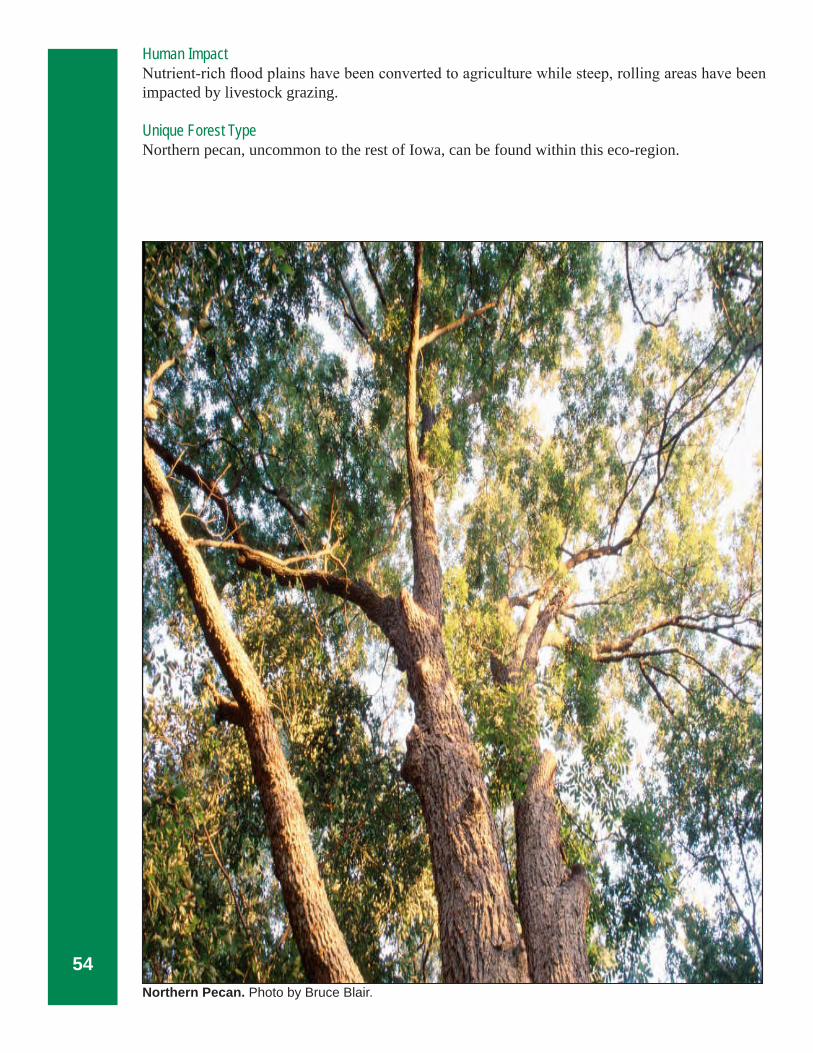
Human ImpactNutrient-rich flood plains have been converted to agriculture while steep, rolling areas have been impacted by livestock grazing.
Unique Forest TypeNorthern pecan, uncommon to the rest of Iowa, can be found within this eco-region.
Northern Pecan. Photo by Bruce Blair.
55
Iowa Forest DensityThe Forest Inventory and Analysis (FIA) Program of the U.S. Forest Service conducts surveys within Iowa every year to collect information needed to assess Iowa’s forests. There are both permanent and random plots that are measured during each year within Iowa. Since it takes one year to measure 20% of the total number of plots, it takes 5 years to complete an entire inventory cycle within Iowa. FIA reports on the status and trends in forested areas and locations; on the species, size, and health of trees; on total tree growth, mortality, and removals by harvest; on wood production and utilization rates by various products; and on forest land ownership.
This data enables anyone to see how things have changed from past conditions as well as projecting how forests are likely to appear 10 to 50 years from now. This data helps foresters to evaluate whether current forest management practices are sustainable in the long run and to assess whether current policies will allow the next generation to enjoy Iowa’s forests as we do today.
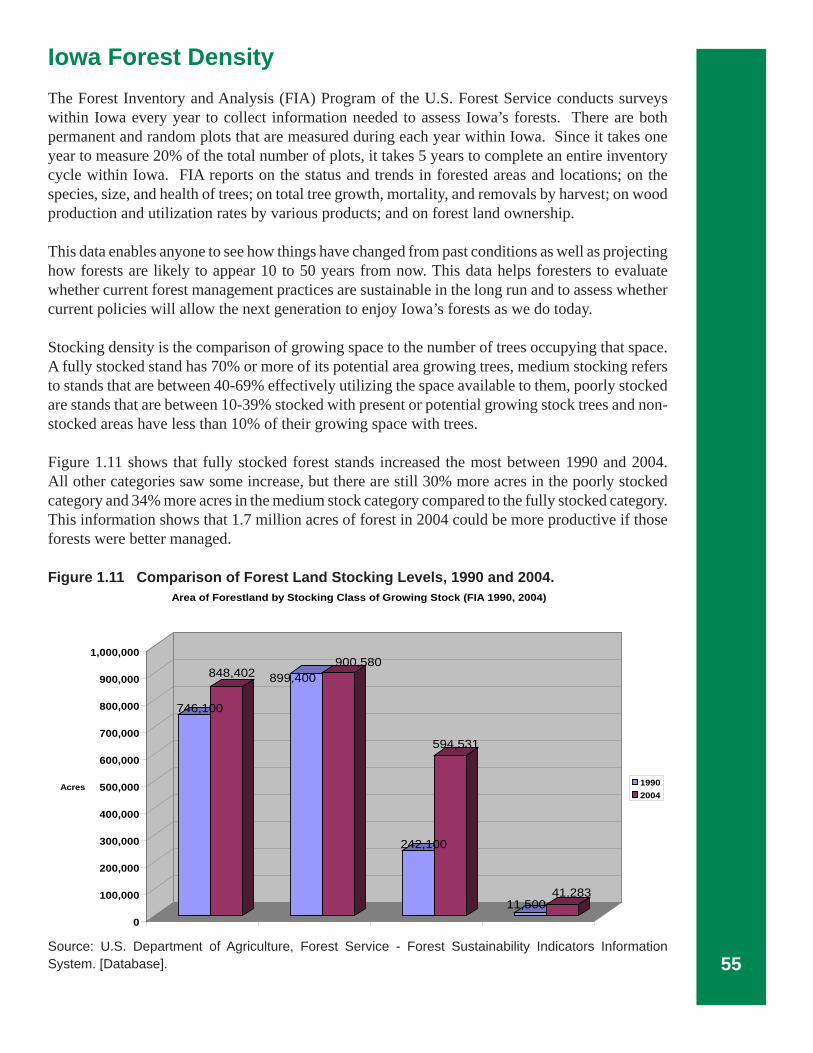
Stocking density is the comparison of growing space to the number of trees occupying that space. A fully stocked stand has 70% or more of its potential area growing trees, medium stocking refers to stands that are between 40-69% effectively utilizing the space available to them, poorly stocked are stands that are between 10-39% stocked with present or potential growing stock trees and non-stocked areas have less than 10% of their growing space with trees.
Figure 1.11 shows that fully stocked forest stands increased the most between 1990 and 2004. All other categories saw some increase, but there are still 30% more acres in the poorly stocked category and 34% more acres in the medium stock category compared to the fully stocked category. This information shows that 1.7 million acres of forest in 2004 could be more productive if those forests were better managed.
Figure 1.11 Comparison of Forest Land Stocking Levels, 1990 and 2004.
Source: U.S. Department of Agriculture, Forest Service - Forest Sustainability Indicators Information System. [Database].
746,100
848,402 899,400900,580
242,100
594,531
11,50041,283
0
100,000
200,000
300,000
400,000
500,000
600,000
700,000
800,000
900,000
1,000,000
Acres
Poorly Stocked Medium Stocked Fully Stocked Over Stocked
Area of Forestland by Stocking Class of Growing Stock (FIA 1990, 2004)
19902004

56
For comparison, in 1959 there were 500,000 acres of poorly stocked forests within the 2.5 million acres of forest land. During the 1950’s, over half of Iowa’s forest contained only 6% sawtimber volume. In other words, full forest stands did not grow in many areas, which hurt the productivity level of Iowa forests. In the years proceeding the 1950’s, large areas of forest were overcut, neglected and poorly stocked. In 60 years, Iowa has improved the stocking levels within its forests, but there is still a lot of room for improvement. It is ironic that in a state that places so much emphasis on yield in agricultural production, yield within forests has continued to lag so far behind.
A poorly-stocked forest, like a sparsely seeded agricultural field, cannot approach either its biological or economic potential. Iowa forest landowners with poorly stocked stands of timber are losing money, wildlife habitat, and are suffering from declining soil and water quality. While there are farm and natural resource conservation service centers in each of Iowa’s 99 counties, there are only 16 district foresters to serve the more than 150,000 forest landowners in the state.
Looking at forest stocking levels is one way to evaluate how well a stand of trees is growing relative to its potential. However, even a fully-stocked stand can paint a misleading picture because species and quality of the trees within it are not taken into consideration. For example, a bitternut hickory/ ironwood/ black locust stand may be considered fully-stocked from the perspective of timber volume growing potential, but it may have limited value from the perspective of timber, water quality, biodiversity and wildlife habitat.
Figure 1.12 shows that poorly-stocked and medium-stocked stands of timber have made up between 31% and 44% of Iowa’s forests over the past 20 years. Meanwhile, fully-stocked stands have made up no more than 22% of Iowa’s forest acres sine 1950.
Figure 1.12 Comparison of Stocking Levels on Iowa Forest Land, 1950-2007.Year Total Forest
AcresPoorly StockedAcres
Percentage Medium Stocked Acres
Percentage
1950 2,500,000 500,000 201990 2,054,795 750,861 37 908,136 442003 2,665,150 858,046 32 878,148 332004 2,748,718 8958,607 31 932,292 34
2005 2,878,942 932,835 32 1,016,850 352006 3,008,399 1,013,837 34 1,030,913 342007 3,054,000 1,051,537 34 1,036,548 34Year Total Forest
AcresFully StockedAcres
Percentage OverstockedAcres
Percentage
1950 2,500,0001990 2,054,795 242,346 12 11,500 0.52003 2,665,150 588,825 22 35,043 12004 2,748,718 596,412 22 42,977 22005 2,878,942 516,908 18 43,699 22006 3,008,399 513,950 17 35,750 12007 3,054,000 488,956 16
Source: Miles, P.D.
In 2007, 1,051,537 acres were in the poorly-stocked category and 1,036,548 acres were in the medium category, meaning that Iowa forests did not produce 70% of their timber and carbon sequestering potential during this time.

57
Figure 1.13 shows that Iowa forests had 2.9 billion cubic feet of growth in 2007 under all stocking levels combined. Poorly-stocked forest stands underperformed by 1.6 billion cubic feet while medium-stocked forest stands underperformed by 1.0 billion cubic feet. This means that an estimate 2.6 billion cubic feet of growth was lost for all Iowa forest landowners. Figure 1.13 Potential Growing Stock Versus Actual Growing Stock in Iowa in 2007.
Source: Miles, P.D.
These growth values are enormous to comprehend, but they do demonstrate that Iowa forests can have a huge impact on the wood available for industry-level utilization. It also shows that Iowa’s forests can grow a 47% greater volume of wood within existing forested areas if better forest management was exercised on the state’s existing 3 million acres of forest.
Population TrendsIowa has 946 communities spread across the state, with the largest twenty accounting for approximately 50% of total population.12 Between April 1, 2000 and July 1, 2006, 633 of these communities experienced some degree of population decline. Iowa’s population increased by 666,074 between 2000 and 2007, and Des Moines, the capitol, is still the largest community with a population of 193,886. In 2006 there were 130 communities with populations greater than 2,500, up from the 127 communities in 2000. Communities with less than 2,500 people are defined as being rural. As with other Midwestern states, Iowa is feeling the effect of rural flight as more people are moving out of the countryside to urban areas with better job opportunities and greater conveniences. The migration of people from rural areas to cities increases pressure to build around urban centers; Polk County, for example, has lost 3,000 acres of open space to development annually since the early 1990s.
When people choose a home in Iowa, a place still uncluttered and livable, they often do so because they recognize what a treasure there is in this “land between two rivers.” Individuals, business people, government leaders, and private interest groups all share a responsibility for making decisions about how the land is developed. Each generation determines whether the natural communities and human communities will prosper.
12U.S. Census Bureau, Iowa QuickFacts. <http://quickfacts.census.gov/qfd/states/19000.htm> February 18, 2009.
StockingDensity
Acres
488,956
Volume of Growing Stock in 2007 (cubic feet)
Lost potential of Growing Stock Volume (cubic feet)
Full Stocking
Medium Stocking
PoorStocking
Totals
1,036,548
1,051,537
3,054,000
1,132,282,575
1,215,087,803
599,383,624
2,946,754,002
0
1,014,431,101
1,605,635,097
2,620,066,198
Iowa forests are growing 53% of their potential
based on stocking levels.

58
The town of Marquette in Clayton County characterizes the numer-ous small communities that dot the Iowa landscape. Photo by Lowell Washburn.
The relationship between people and the land they own can be visibly seen as people drive through the countryside. As landownership changes hands from one owner to the next, land use can vary dramatically. More Iowans are nearing retirement, and the population increase is slow. In the next twenty years, the state’s 2008 population of roughly 3 million people may only grow by 3 to 6 percent. There are more residents age seventy-five or older than there are age five or younger.
As Iowa’s population becomes more diverse, people of different cultural and religious backgrounds may look at the land and its resources in different ways. To some Iowans, the land is a resource to be exploited for profit, while others see it as a resource to be managed and conserved. New residents may bring nontraditional land ethics and customs. To many, land has spiritual and natural values and should be maintained for future generations.
More than 90 percent of Iowa’s land is privately owned, often by older people. Two-thirds of the land belongs to individuals age fifty-five and older, while nearly 20 percent belongs to owners over the age of seventy-four. The average age for a person owning a farm has risen from 48 years of age in 1982 to 54 years of age in 2002.13 A 2002 survey of Iowa woodland owners found that 86 percent were over the age of 45. As more farmers and forest landowners near retirement age, choices regarding land use will become more and more significant.
One property in five will likely change hands within the next ten to twenty years, as older landowners pass their land to the newer, younger generations. These new landowners may decide to use land differently from the older owners, who were more likely to have had their land rooted in state’s agricultural tradition. The passing of this property to new owners may also lead to the further fragmentation and parcelization of an already fragile landscape.
Over the last ten years an increasing amount of forest land has been transferred from farmers to those who do not depend on farming for their living. Forest Service studies suggest that these new owners primarily own the land for recreational, aesthetic or spiritual reasons. Often these landowners have little or no experience with woodland management and are unaware that woodland management assistance is available. However, they may be more likely to implement forest management practices that improve the health, wildlife habitat and aesthetic quality of their woodland as well. Reaching these new types of forest landowners will require different approaches than were used in the past. Information on proper plant selection, identification and control options for invasive
13<www.nass.usda.gov/Statistics by Sunject/Demographics/index.asp> February 18,2010.
59
species, the importance of biological diversity, beneficial silvicultural techniques workshops and outreach campaigns can provide forest landowners with hands-on learning necessary to empower them to conserve and enhance their forest resources.
Ensuring that children are aware of natural resources and the benefits that trees provide will also be important as more people gravitate to urban areas. Engaging this audience in outdoor classrooms will give them hands-on experiences to help imprint knowledge that they can appreciate as they continue to grow.
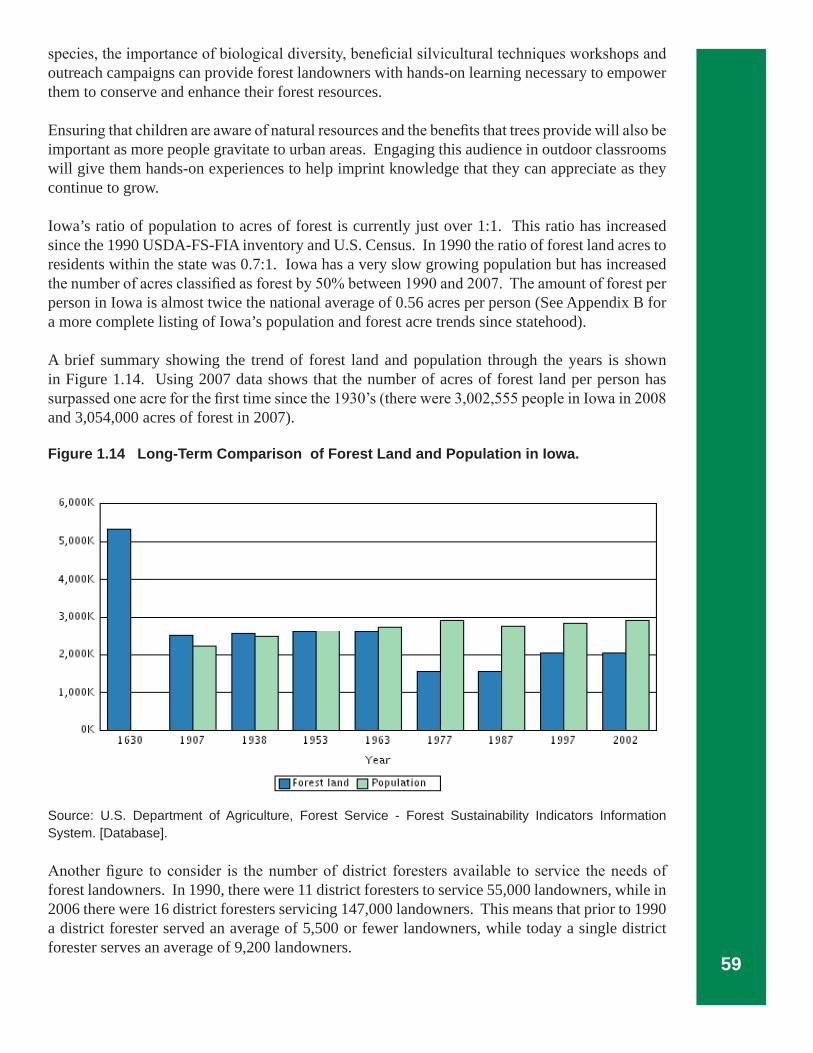
Iowa’s ratio of population to acres of forest is currently just over 1:1. This ratio has increased since the 1990 USDA-FS-FIA inventory and U.S. Census. In 1990 the ratio of forest land acres to residents within the state was 0.7:1. Iowa has a very slow growing population but has increased the number of acres classified as forest by 50% between 1990 and 2007. The amount of forest per person in Iowa is almost twice the national average of 0.56 acres per person (See Appendix B for a more complete listing of Iowa’s population and forest acre trends since statehood).
A brief summary showing the trend of forest land and population through the years is shown in Figure 1.14. Using 2007 data shows that the number of acres of forest land per person has surpassed one acre for the first time since the 1930’s (there were 3,002,555 people in Iowa in 2008 and 3,054,000 acres of forest in 2007).
Source: U.S. Department of Agriculture, Forest Service - Forest Sustainability Indicators Information System. [Database].
Another figure to consider is the number of district foresters available to service the needs of forest landowners. In 1990, there were 11 district foresters to service 55,000 landowners, while in 2006 there were 16 district foresters servicing 147,000 landowners. This means that prior to 1990 a district forester served an average of 5,500 or fewer landowners, while today a single district forester serves an average of 9,200 landowners.
Figure 1.14 Long-Term Comparison of Forest Land and Population in Iowa.

60
The impact from people settling Iowa on the forest resource in Iowa has been significant. Most forests have been cleared, heavily grazed, overcut or high-graded at some time over the past 160 years, and those that remain are typically irregularly-shaped pieces on rough land or along water corridors. Woodlands are impacted the most during tough economic times, when landowners need to come up with additional sources of income or cheaper methods to heat their homes. In times of prosperity, these woodlands are usually not harvested. These reasons for harvesting do not allow for the sustainable management needed to adequately regenerate desirable tree species, and leads not only to the decline in forest habitat for wildlife but to declines in both income for future landowners and timber for the wood industry.
Public Forest LandThe Department of Natural Resources purchases land to manage and protect natural resources, to maintain unique ecosystems for future generations, to maintain a pool of biodiversity for future generations and to provide recreational opportunities to all the people of the state. Through their land acquisition program, wetlands, forests, scenic areas, prairies, wildlife and fish habitat, rare species habitat, and other resources are being protected and managed. Opportunities for hunting, fishing, bird-watching, and enjoyment of the outdoors are provided by these areas.
In 2008 Iowa had 816,000 acres of area in public ownership of which slightly less than 637,000 acres were classified as land. An additional 600,000 acres of roadside rights-of-way and more than 40,000 acres of railroad corridors could be managed to improve habitat and scenery. This area represents less than 4% of Iowa’s total land area. Iowa added 6,150 acres of public land at a cost of approximately $11 million dollars during state fiscal year 2008.
Within the land category, 279,666 acres (44%) of public areas are classified as forest. In 2002 public agencies owned over 9% of the forest land in Iowa, just a slight increase from 8% in 1974. Public forest land allows for different management activities depending on which agency within the DNR (Forestry, Parks or Wildlife) oversees a certain property.
The Forestry Bureau manages 34,597 acres of forest on its 45,230 acres of public land, with the remaining areas in roads, lakes, prairie or cropland. State forest areas are subdivided into 10 state forests that represent all of the major forest habitat types of Iowa along with a range of ages. These forests are mainly managed for timber production, wildlife habitat and water and air quality.
The State Parks Bureau has 31,703 acres of forest on its 57,754 acres of public land. Some of these areas have some of the oldest trees growing on them. The State Wildlife Bureau has the largest holding of forest with 94,547 acres within its 347,852 acres of public land. Public areas are important for maintaining the state’s native biological diversity, which is often much harder to preserve on private lands.
Forest management is allowed on areas managed by the Wildlife and Forestry Bureaus. Parks and Preserves generally do not practice active management, an approach that allows for succession on their properties. Salvage sales are an exception, and often take place after strong windstorms, flooding or tornados cause damage to their resources.
Legislation in 1965 created the Iowa State Preserves System to identify and preserve, for this and future generations, portions of Iowa’s natural pre-historical and historical heritage, and to maintain preserved lands as nearly as possible in their natural condition. By 2007, 94 parcels had

61
been dedicated into the Preserves System. These preserves range from less than 1 acre to 845 acres and incorporate a total area of almost 10,000 acres. Some sites are owned by individuals or private conservation organizations; others are owned by cities and counties, and still many more are owned by the State. Preserves are managed according to plans developed cooperatively by landowners, the Preserves Board, the preserve manager and DNR staff. Management may be handled by the owner or delegated to another group.
Another large pubic landowning body is the 99 County Conservation Boards, which collectively own the second largest amount of forest habitat. Counties own over 143,000 acres of property, of which 65,354 acres are covered in forest.
Federal agencies own 190,000 acres of land within Iowa, of which 37,632 acres are forested. The U.S. Army Corps of Engineers and the USDI Fish and Wildlife Service own the most land. Iowa still has a smaller proportion of public land than almost any other state in the country and has no National Forests. The federal agencies that do own property manage their land as wildlife refuges, flood control and navigational systems with accompanying recreation areas.
Figure 1.15 shows where there are contiguous areas of 2,000 acres or more public land in the state.
Figure 1.15 Public Land Locations with more than 2000 Acres.
Figure 1.16 shows where public land ownership is located across the state with an adjoining table that breaks down the ownership by agency using land cover classes. The DNR Wildlife Bureau owns the most forest area of any public agency, followed by all of the county conservation boards combined and the DNR Forestry Bureau.
Source: Kathryne Clark.

62
Figure 1.16 Public Land Ownership and Forest Acreage in Iowa, 2002.
Source: Kathryne Clark using satellite land cover from 2002 and public lands database.
About 40% of the acres of publicly owned land are on highly erodible soils, indicating that there is a need for permanent vegetation on these areas to improve water quality, stabilize soil and improve habitat for wildlife. The average corn suitability rating for the land owned by the DNR is 32 on a scale of 100, which shows that most DNR-owned land is not suitable for agriculture.
Forest LegacyAs part of the 1990 Farm Bill, Congress created the Forest Legacy Program to identify and protect environmentally important private forest lands threatened by conversion to non-forest uses. This program promotes the concept of protecting “working forests” and allowing continuation of traditional forest uses as long as it follows a State Forester approved forest stewardship plan.
63
Conservation easements are a voluntary, legal means to protect and preserve land. There are many types of conservation easements such as wetlands easements, angler and hunter access easements, trail and portage easements and forest, farm, ranchland protection easements. Conservation easements assist in protecting and improving water quality, wildlife habitat and natural resources in general. They are used to promote the personal desires of the landowner as well as to preserve, protect and improve the overall quality and character of the natural resources for future generations.
Goals of the Forest Legacy Program in Iowa
1. To protect environmentally important private forests that are threatened by conversion to non-forest uses such as agriculture, gravel pits/mining and residential or commercial development. 2. To protect Iowa’s publicly-owned or permanently-protected forested tracts from environmental threats caused by the development of nearby forest areas. 3. To prevent and reverse the fragmentation/parcelization of Iowa’s contiguous forests by reconnecting parcels of land and keeping forests in contiguous parcels.
4. To preserve the beauty and public enjoyment of Iowa’s forested landscape.
Critical Issues/Definitions for Iowa’s Forest Legacy Program
Iowa’s land and its forest component is one of the most disturbed and altered landscapes in North America. Rare is the acre of Iowa forest that has not been impacted by agriculture from crop management or livestock grazing. In order to uniformly identify the critical impacts and management needs of Iowa’s forests, the following uniform definitions of important Legacy terminology were accepted by the Iowa Department of Natural Resources and the State Forest Stewardship Committee.
Environmentally important forest – a forest that contains one or more of the following important public values:
1. Scenic or significant view shed values such as overlooks, vistas or is visible from main highways or public trails;
2. Recreation opportunities for public access for such uses as hunting, fishing, hiking, biking etc.;
3. Riparian areas that are adjacent to major waterways, drinking water supplies and public lakes;
4. Unique and/ or contiguous fish and wildlife habitat;
5. Known threatened and endangered plant and animal species dependent upon forest habitat;
6. Known unique archeological, cultural and geological resources that could be lost or damaged;

64
7. Opportunities for the continuation of traditional forest uses, such as management, timber harvesting and other commodity use and outdoor recreation that benefit economic values in neighboring communities.
A forested area will be considered environmentally important if it also contains one or more of the following public values:
8. Borders or enhances the natural values of existing federal, state or local government-owned or permanently protected forests or non governmental organizations forests NGOs) or other permanently protected forests;
9. Protects and enhances water quality and watershed values of a public drinking water supply;
10. Contains unique or isolated tree species and forest stand conditions (old growth or oak savanna);
11. Key to minimizing local forest fragmentation;
12. Allows opportunities for continuation of traditional forest management and use.
In order to better understand these criteria, it is important to clarify some key terms:
Traditional forest use is defined as utilization of the forest or its parts in a sustainable way for wood production, wildlife habitat, outdoor recreation, scenic enjoyment, watershed protection and erosion control.
Threatened forest is one that could be converted to non-forest or seriously altered forests due to ownership change, conversion to agriculture, gravel/mining and/or residential/commercial development. Forests could be threatened through non-native invasive plant introductions, which impact the survival of native vegetation.
Protection is the process of stopping conversion of forests to non-traditional forest uses or preventing serious forest alteration that prevents sustainability through legal means.
Forest management is the process of ensuring long-term sustainability through active silviculture and other forestry methods.
Forest Stewardship Plan is a management plan developed by a professional forester and approved by the Iowa DNR to examine all the values of the forests with the objectives of ownership to ensure a sustainable forest.
Eligibility criteria for a Forest Legacy Area
To be eligible as an Iowa Forest Legacy Area, an area’s forest land must meet all of the following criteria:1.) Potential Forest Legacy Areas must be considered environmentally important forest according to the aforementioned criteria and must contain one or more of the following characteristics or public values:

65
• scenic resources; • public recreation; • riparian areas; • unique, rare, threatened or endangered species; • archeological, cultural or geologic features; • borders or is close to existing public or permanently protected forests; • unique or isolated tree species/stand conditions and provides opportunities for continuation of traditional forest uses (traditional/non-traditional forest products utilization, watershed protection and recreational opportunities such as hiking, bird watching, hunting and fishing).
2.) Forested areas could be threatened by present or future conversion to non-forest uses by ownership change, conversion to agricultural use, gravel pits/mining and/or residential/ commercial development. Forests could also be threatened by non-native invasive plants, which spread and replacing native vegetation.
Figure 1.17 shows designated Forest Legacy areas in Iowa. These areas were created from recommendations by the State Forest Stewardship Committee. For a description of each area refer to Appendix C (the assessment of need and Secretary of Agriculture’s acceptance letter can also be found in Appendix C).
Figure 1.17 Forest Legacy Areas in Iowa.
Source: Kathryne Clark.
In Iowa, the Forest Legacy application process is open year-round to any interested forest owner, but priorities are given to the following: tracts that (1) possess a forest stewardship plan; (2) are close to or adjoin protected lands such as parks, forests, etc; (3) properties that are threatened by conversion to non-forest use, and; (4) landowners that are willing to contribute in-kind to the 25% match requirement.

66
Figure 1.18 shows where, when and how many acres of Forest Legacy easements have been successfully established.
Figure 1.18 Forest Legacy Program Easements.Landowner County Year AcresLansing BigLake
Allamakee 2005 35
Effigy Allamakee 2005 192Cold Air Slope
Winneshiek 2005 165
White Water DubuqueJacksonJones
2005 417
Stephen’sForest
Clarke 2005 60
Caves Jones 2007 140Franklin Allamakee 2008 209PattersonCreek
Allamakee 2008 358
Source: Jeff Goerndt, State Forest Section Chief, Iowa DNR Forestry Bureau.
The Forest Legacy Program helps preserve permanent vegetation on properties whose owners have a strong desire to prevent any development on these areas. The landowners who enroll in these programs are not only looking beyond their lifetime, but ensuring that future Iowans will benefit from the beauty, serenity, wildlife and inspiration these properties possess.
The Iowa Forest Legacy Program will be implemented according the Iowa Forest Legacy Program Assessment of Need (AON), which was approved by the Secretary of Agriculture on March 7, 2002. A copy of the State Lead Agency designation letter, Forest Legacy Area descriptions, and the AON approval letter can be found in Appendix C. The AON remains unchanged since the approval in March 7 of 2002.
Urban ForestsAs the first non-indigenous people began to settle Iowa, population centers sprang up along the state’s river corridor systems. These areas provided water for drinking, cleaning and powering equipment, and timber for building, heating, and cooking. Figure 1.19 shows just how important rivers are to communities in the state today, as virtually every major population center is located on or near a river.
The rural heritage of most Iowans has historically had an influence on land use priorities. However, as more people have gravitated toward cities, this connection to nature has been compromised. Land has been re-shaped to suit developer needs and increase community tax bases. Once paved or developed, a forest can almost never be restored to its original state, and in Iowa, green infrastructure and preservation is typically regarded as being more costly than beneficial.
“Recreational development is a job not
of building roads into lovely country, but of
building receptivity into the . . . human mind.”
- Aldo Leopold

67
Figure 1.19 Iowa’s Major Rivers and Community Locations.
Source: Kathryne Clark using satellite land cover from 2002.
Census data shows that over 85% of Iowans are classified as “urban” because they live in communities of 2,500 people or more.14 As Iowa’s population continues to gravitate toward urban
and suburban areas, increased pressure will be placed on the forest resources surrounding these areas. Though some trees may remain for aesthetic reasons, the forest ecosystem will be disrupted enough to make it unsuitable for the survival of many native plants and animals. Opportunities and challenges exist in developing strategies to work with small woodland owners, homeowners and developers in these urban/rural interface areas.
More people are choosing to live in or near for-ests. Photo by Mark Vitosh.
Near urban areas, more than 18,000 forest acres were lost per year from
1992 through 1997.
14U.S. Census Bureau, Iowa Quick Facts.

68
Figure 1.20 shows that in 2002, over 15% of Iowa’s forest was harvested to accommodate land changes such as housing developments, agricultural expansions, new road systems and new businesses; what’s more, shopping malls, highways, suburbs, and factories now cover three-quarters of a million acres of the state, the equivalent of two counties. Iowa lost more than 18,000 forest acres per year from 1992 through 1997 to urban development.
Figure 1.20 Growing Stock Removals on Iowa Timberland based on Land Change.
Source: U.S. Department of Agriculture, Forest Service - Forest Sustainability Indicators Information System. [Database].
There is a need to continue to plant trees in core community areas and to replace aging or dying trees and in new developments that have little or no existing tree cover. There is also a need to protect mature trees from urban sprawl and to plant a diversity of trees in new developments. Pressure to build homes on acreages is also leading to the conversion of forests near urban areas. This parcelization removes most of the functionality of those forests.
As emerald ash borer, bur oak blight, gypsy moth, and other pests continue to affect areas in and around Iowa, communities are going to have to look for ways to reduce their susceptibility to these problems. Unfortunately, inventory data does not exist for most communities in the state, which makes planning for such problems virtually impossible, and without planning urban forestry programs are reactionary rather than proactive. Good information, good planning and
The expansion of suburban areas from Iowa’s larger cities is one way in which Iowa’s landscape is being transformed. Photo by Drake Hokanson.
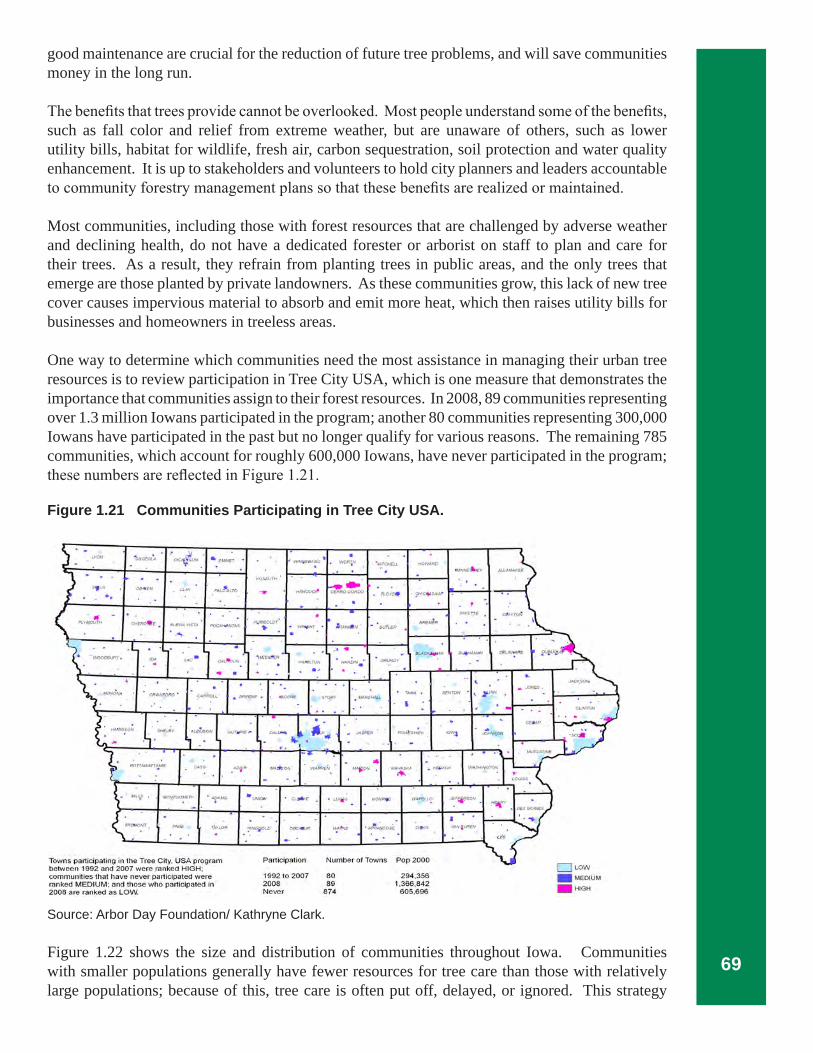
69
good maintenance are crucial for the reduction of future tree problems, and will save communities money in the long run.
The benefits that trees provide cannot be overlooked. Most people understand some of the benefits, such as fall color and relief from extreme weather, but are unaware of others, such as lower utility bills, habitat for wildlife, fresh air, carbon sequestration, soil protection and water quality enhancement. It is up to stakeholders and volunteers to hold city planners and leaders accountable to community forestry management plans so that these benefits are realized or maintained.
Most communities, including those with forest resources that are challenged by adverse weather and declining health, do not have a dedicated forester or arborist on staff to plan and care for their trees. As a result, they refrain from planting trees in public areas, and the only trees that emerge are those planted by private landowners. As these communities grow, this lack of new tree cover causes impervious material to absorb and emit more heat, which then raises utility bills for businesses and homeowners in treeless areas.
One way to determine which communities need the most assistance in managing their urban tree resources is to review participation in Tree City USA, which is one measure that demonstrates the importance that communities assign to their forest resources. In 2008, 89 communities representing over 1.3 million Iowans participated in the program; another 80 communities representing 300,000 Iowans have participated in the past but no longer qualify for various reasons. The remaining 785 communities, which account for roughly 600,000 Iowans, have never participated in the program; these numbers are reflected in Figure 1.21.
Figure 1.21 Communities Participating in Tree City USA.
Source: Arbor Day Foundation/ Kathryne Clark.
Figure 1.22 shows the size and distribution of communities throughout Iowa. Communities with smaller populations generally have fewer resources for tree care than those with relatively large populations; because of this, tree care is often put off, delayed, or ignored. This strategy
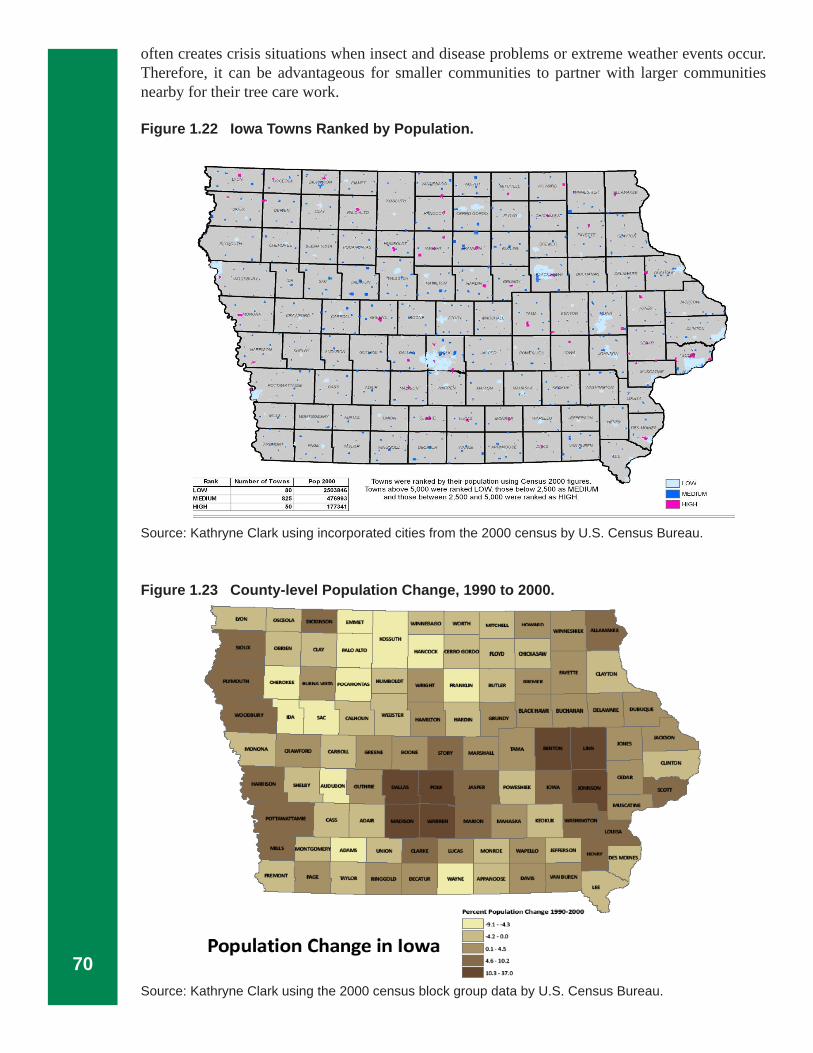
70
often creates crisis situations when insect and disease problems or extreme weather events occur. Therefore, it can be advantageous for smaller communities to partner with larger communities nearby for their tree care work.
Figure 1.22 Iowa Towns Ranked by Population.
Source: Kathryne Clark using incorporated cities from the 2000 census by U.S. Census Bureau.
Figure 1.23 County-level Population Change, 1990 to 2000.
Source: Kathryne Clark using the 2000 census block group data by U.S. Census Bureau.

71
Figure 1.24 shows where community boundaries have grown into existing forested areas; roughly 48,000 acres of forest in the state have been impacted in this way between 1990 and 2000.15
Figure 1.24 Community Growth into Existing Forest Areas, 1990 to 2000,
Source: Kathryne Clark using 9HD0030 housing density change provide by U.S. Forest Service and satellite land cover from 2002.
The black lines drawn on Figure 1.25 show the eco-region boundaries for Iowa. The Southern Iowa Rolling Loess Prairie, one of the biggest forest areas in the state, contains some of Iowa’s largest communities and has experienced a relatively high level of population growth; it has also experienced the largest forest loss in the state with the decline of over 1.1 million acres, roughly one-third of the 3.6 million total acres of lost forest area for the whole state.
48,000 acres of forest were impacted by
urban development from 1990-2000.
15U.S. Census Bureau, Population Division, (301) 457-2422, Released June 28, 2007. <www.iowadatacenter.org>

72
Figure 1.25 Community-level Population Growth Rates in Different Eco-regions, 1990-2000.
Source: Kathryne Clark using U.S. Census Bureau 2000 census, eco-region boundaries of Iowa, incorporated cities from the 2000 census by U.S. Census Bureau.
Over half a million people in 18 communities throughout the state depend on surface water for their drinking water supply; Figure 1.26 shows these communities and their water sources. It is crucial that the watersheds that drain into these water systems are kept in permanent natural vegetation if this drinking water is to remain safe and clean.
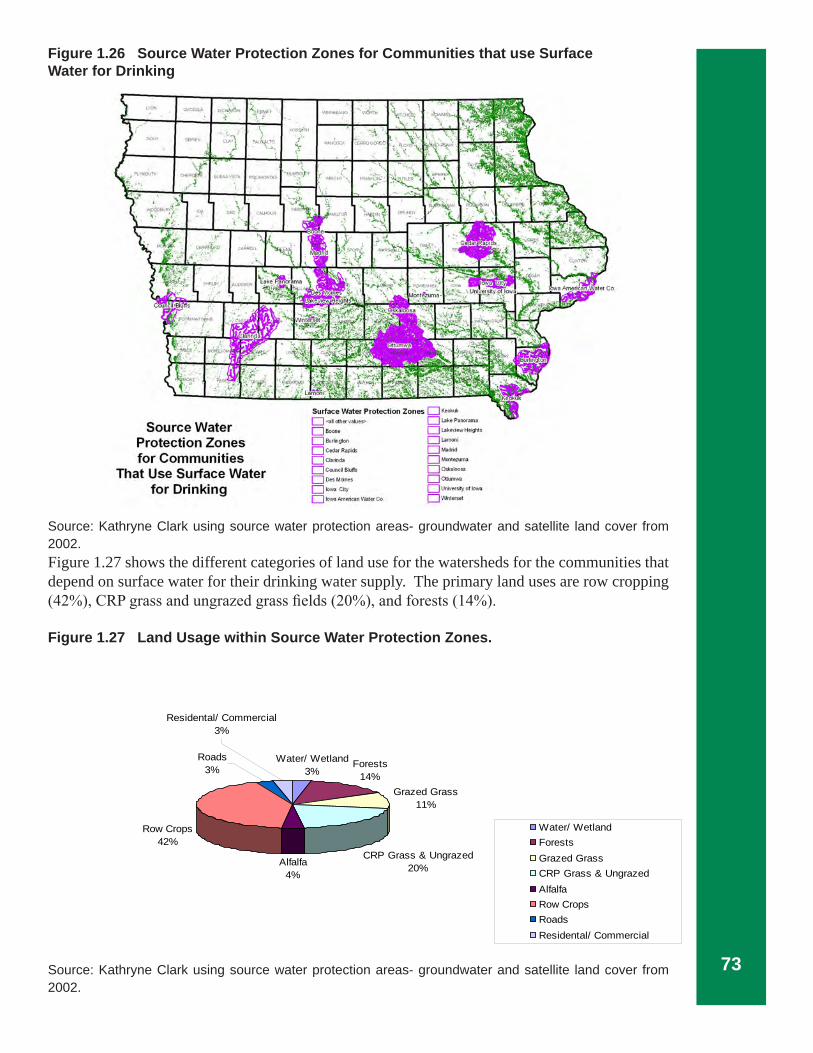
73
Figure 1.26 Source Water Protection Zones for Communities that use Surface Water for Drinking
Source: Kathryne Clark using source water protection areas- groundwater and satellite land cover from 2002.Figure 1.27 shows the different categories of land use for the watersheds for the communities that depend on surface water for their drinking water supply. The primary land uses are row cropping (42%), CRP grass and ungrazed grass fields (20%), and forests (14%).
Figure 1.27 Land Usage within Source Water Protection Zones.
Source: Kathryne Clark using source water protection areas- groundwater and satellite land cover from 2002.
Land Usage within Source Water Protection Zones
Water/ Wetland3%
Forests14%
Grazed Grass11%
CRP Grass & Ungrazed20%Alfalfa
4%
Row Crops42%
Roads3%
Residental/ Commercial3%
Water/ WetlandForestsGrazed GrassCRP Grass & UngrazedAlfalfaRow CropsRoadsResidental/ Commercial

74
A viable nursery and tree-care industry is crucial for the maintenance and replacement of urban trees, including those damaged by storms and other natural disasters. Growing trees from Iowa native seed sources can provide long lasting, healthy tree material for homeowners. A tree’s long-term performance depends upon the extent to which factors such as space, soil, drainage, and sun exposure are considered; furthermore, regular maintenance during a tree’s early years can prevent such problems as cracking, limb breakage, and decay.
The map in Figure 1.28 shows the communities that would most benefit from increased tree planting; these communities have less than average tree cover and greater than average populations, urbanized areas and impervious surface areas. Increasing tree canopy in communities that have the most need provides many economic and environmental benefits, such as increased energy efficiency, local climate modification, improved air quality, water quality and quantity, decreased soil erosion, increased aesthetics, noise reduction and increased property values.
Figure 1.28 Communities that would Benefit Most from Tree Plantings.
Source: Kathryne Clark using Maryland method and incorporated cities from the 2000 census by U.S. Census Bureau.
Residential tree planting programs provide homeowners opportunities to plant trees at reduced costs. A partnership between utility companies in Iowa, DNR Forestry and County Conservation Boards encourages the planting of five to ten thousand more landscape trees in Iowa annually. Nursery stock selection, poor insect and disease resistance and disturbed soil profiles are often limiting factors in a homeowner’s ability to plant a variety of native local eco-type plants. Trees offered through residential programs could be better selected if the communities had good community forest inventory data.
Figure 1.29 shows the forest canopy cover for communities in Iowa. There are 97 communities with over 16% tree cover and 280 communities with 5 to 16% cover, but the majority of communities in Iowa have a tree cover of less than 5%; this reflects a need to improve tree canopy cover within these communities, especially if their citizens value the benefits that trees provide.
Ankeny
Spencer
Altoona
Le Mars
Carroll
Fairfield
Harlan
Perry
Creston
Grinnell
Clarinda
Sheldon
Mount Pleasant
Knoxville
Dyersville
Hampton
Cresco
Sioux Center
Washington
Clarion
Waukon
Winterset
Storm Lake
Milford
Eagle Grove
Osage
Spirit Lake
EmmetsburgGarner
Wilton
TiptonBelle Plaine
Shenandoah
Orange City
Sibley
New Hampton
Carter Lake
Rock Valley
Sergeant Bluff
Arnolds Park
Lakeside
Arnolds Park
LINN
LEE
SAC
TAMA
IDA
SIOUXCLAY
IOWA
LYON
POLK
CASS
KOSSUTH
PAGE
JASPER
ADAIR
BENTONJONES
DAVIS
CLAYTON
STORY
FAYETTE
CEDAR
CLINTON
BOONE
PLYMOUTH
MONONA
DALLAS
MILLS
FLOYD
SHELBY
OBRIEN
HARDIN
WAYNE
BUTLER
WOODBURYWEBSTER
WRIGHT
MARION KEOKUK
TAYLOR
SCOTT
JACKSON
GREENE
HARRISON
UNION
GUTHRIE
LUCAS
WARREN
JOHNSON
HENRY
DUBUQUE
CRAWFORDCARROLL
MADISON
ADAMS
FRANKLIN
MAHASKA
CALHOUN GRUNDY
POTTAWATTAMIE
HANCOCK
LOUISA
HAMILTON
DECATUR
EMMET
ALLAMAKEEWINNESHIEK
CLARKE
WORTH
PALO ALTO
MARSHALL
HOWARD
FREMONT
DELAWARE
CHEROKEE BREMER
BUCHANAN
RINGGOLD
POWESHIEK
MONROE
MITCHELL
WAPELLO
BUENA VISTA
AUDUBON
BLACK HAWK
VAN BUREN
CHICKASAW
POCAHONTAS
WASHINGTON
APPANOOSE
OSCEOLA
HUMBOLDT
MUSCATINE
CERRO GORDO
JEFFERSON
DES MOINES
WINNEBAGO
MONTGOMERY
DICKINSON
Phase I Towns
Using the Maryland Method, the towns shown should be prioritized for tree planting assistance.

75
Figure 1.29 Percent Forest Canopy Cover of Iowa Communities.
Source: Kathryne Clark using satellite land cover from 2002 and incorporated cities from the 2000 census by U.S. Census Bureau.There are many different issues to consider when setting priorities for communities. A composite map in Figure 1.30, which uses the data from Figures 1.21, 1.22, 1.24, 1.26, 1.28, and 1.29, shows which communities are most in need of tree inventories, management plans, focused residential tree plantings, and other types of planning (see Appendix D for a list of these communities). These areas typically have limited financial and human resources, which makes efficient resource allocation essential. Though the point is not to draw the focus away from other communities, it is important that the communities shown in Figure 1.30 receive the greatest attention, since they lack the numerous benefits that these other, more heavily-forested communities enjoy.
Figure 1.30 Community Priority Map.
Source: Kathryne Clark.