10 - Bombay Stock Exchange · Mumbai 400 001 Dear Madam! Sir, The Market Operations Department...
233
Corporate Relations Department BSE Limited, 1 st Floor, New Trading Wing Rotunda Building, P J Towers Dalal Street, Fort Mumbai 400 001 Dear Madam! Sir, The Market Operations Department National Stock Exchange of India Limited Exchange Plaza, 5 th Floor Plot No CIl, G Block Bandra-Kurla Complex Bandra (E), Mumbai 400 051 i h August, 2018 Sub: Submission of the 146 th Annual Report of Peninsula Land Limited for the Financial Year 2017-2018. Ref: Regulation 34 of the Securities and Exchange Board of India (Listing Obligations and Disclosure Requirements) Regulations, 2015. Scrip Code: BSE: 503031 & NSE: PENINLAND Pursuant to Regulation 34 of the Securities and Exchange Board of India (Listing Obligations and Disclosure Requirements) Regulati os, 2015, kindly find n 10 d the 146 th Ann ual Report of Peninsula Land Limited for the Financial Year 2017-2018 as approved and adopted by the members at the 146 1h Annual Gen ral Me ting of the Company held on Monday, 6 th August, 2018. Request you to take the same on record. For Peninsula Land Limited Rajashekbar Reddy Company Secretary & Compliance Officer Encl: As above PENINSULA LAND LIMITED 1, Peninsula Spenta, Mathuradas Mills, Senapati Bapat Marg, Lower Parel, Mumbai 400 013. India. Phone : + 91 2266229300 Fax : +91 22 6622 9302 E mail : Info@pen insul a.co. in U RL : www. penl nsula.co.in ASHOK PI RAMAL GROUP
Transcript of 10 - Bombay Stock Exchange · Mumbai 400 001 Dear Madam! Sir, The Market Operations Department...

Corporate Relations Department
BSE Limited, 1 st Floor, New Trading Wing
Rotunda Building, P J Towers Dalal Street, Fort Mumbai 400 001
Dear Madam! Sir,
The Market Operations Department National Stock Exchange of India Limited Exchange Plaza, 5th Floor Plot No CIl, G Block Bandra-Kurla Complex Bandra (E), Mumbai 400 051
i h August, 2018
Sub: Submission of the 146th Annual Report of Peninsula Land Limited for the Financial Year 2017-2018.
Ref: Regulation 34 of the Securities and Exchange Board of India (Listing Obligations and Disclosure Requirements) Regulations, 2015.
Scrip Code: BSE: 503031 & NSE: PENINLAND
Pursuant to Regulation 34 of the Securities and Exchange Board of India (Listing Obligations and Disclosure Requirements) Regulati os, 2015, kindly find n 10 d the 146th Annual Report of Peninsula Land Limited for the Financial Year 2017-2018 as approved and adopted by the members at the 1461h Annual Gen ral Me ting of the Company held on Monday, 6th
August, 2018.
Request you to take the same on record.
For Peninsula Land Limited
Rajashekbar Reddy Company Secretary & Compliance Officer
Encl: As above
PENINSULA LAND LIMITED 1, Peninsula Spenta, Mathuradas Mills, Senapati Bapat Marg, Lower Parel, Mumbai 400 013. India.
Phone : + 91 2266229300 Fax : +91 22 6622 9302 Email : [email protected] URL : www.penlnsula.co.in ~
ASHOK PI RAMAL GROUP


Corporate Information Board of Directors Ms. Urvi A. PiramalNon-Executive ChairpersonMr. Rajeev A. PiramalExecutive Vice-Chairman& Managing DirectorMr. Mahesh S. GuptaGroup Managing DirectorMr. Nandan A. PiramalWhole-Time DirectorMs. Bhavna DoshiIndependent DirectorLt. Gen. Deepak Summanwar (Retd.)Independent DirectorMr. Sudhindar KhannaIndependent DirectorMr. Sajit SuvarnaIndependent Director(June 5, 2017 onwards)
Group CFOMr. Dinesh Jain
CFOMr. Bharat Sanghavi
Company SecretaryMr. Rajashekhar Reddy
Statutory AuditorsS R B C & CO LLPChartered Accountants
Bankers/Financial InstitutionsAllahabad BankAxis Bank LimitedHDFC Bank LimitedHDFC LimitedICICI Bank LimitedJM Financial Products LimitedKotak Mahindra Bank LimitedL&T Finance LimitedRBL Bank LimitedStandard Chartered BankState Bank of India
Registered AddressPeninsula SpentaMathuradas Mills Compound, Senapati Bapat Marg,Lower Parel, Mumbai – 400 013. CIN: - L17120MH1871PLC000005
FORWARD-LOOKING STATEMENTIn this Annual Report, we have disclosed forward-looking information to enable investors to comprehend our prospects and take investment decisions. This report and other statements – written and oral – that we periodically make contain forward-looking statements that set out anticipated results based on the management’s plans and assumptions. We have tried, wherever possible, to identify such statements by using words such as ‘anticipate’, ‘estimate’, ‘expects’, ‘projects’, ‘intends’, ‘plans’, ‘believes’, and words of similar substance in connection with any discussion of future performance. We cannot guarantee that these forward-looking statements will be realised, although we believe we have been prudent in our assumptions. The achievements of results are subject to risks, uncertainties and even inaccurate assumptions. Should known or unknown risks or uncertainties materialise, or should underlying assumptions prove inaccurate, actual results could vary materially from those anticipated, estimated or projected. Readers should keep this in mind. We undertake no obligation to publicly update any forward-looking statement, whether as a result of new information, future events or otherwise.
The Year in Review
Statutory Reports
Financial Statements
02 Introducing Peninsula Land
04 Vice-Chairman & Managing Director’s Message
06 Operational Highlights
08 Financial Highlights
10 Opportunities Unfolding
12 Pioneering Excellence
14 Strong Competencies
16 People
18 Corporate Social Responsibility
20 Notice
33 Directors’ Report
52 Corporate Governance Report
70 Management Discussion and Analysis
78 Standalone Financial Statements
145 Consolidated Financial Statements
Contents

Built for Challenges. Preparing for Growth.2017-18 was a year that tested our resolve. Given the overall slowdown in the real estate sector for the last couple of years, Peninsula Land too has not remained isolated from the current sentiment in the real estate market. But still facing the indifference surrounding the sector, we have sharpened focus on timely execution of projects within approved budget and stringent evaluation of the potential opportunities coming our way. We firmly believe that in the long run good execution is the key to success in the real estate industry in India.
We responded by evolving our business model, adapting to newer realities and ensuring that we continue to strive to create enduring value. We are confident that these strategies will translate into encouraging outcomes in the ensuing fiscal and allow us to remain on-track to achieve our larger vision.
We are passionately moving ahead to create a better world anchoring our belief on the core values of respect, integrity, service and excellence in all undertakings. Our track record on execution quality and timelines gives us credibility with our customers.

2 Peninsula Land Limited
The Year in Review
Destination for world‑class properties
Track Record of Performance
287Team size
20+Years of experience
3Cities under geographic focus*
7.4Of project development track record
7.8Of projects under development and in the pipeline
Peninsula Land develops premium‑quality projects in the domains of retail, commercial and residential. Since 1997, the Company delivered several landmark properties, it has a robust pipeline of high‑quality projects.
The Company is known for its professional management, international quality and value additions across its projects. Over the years, it has garnered industry‑specific knowledge and is well poised to meet the key challenges in developing properties.
Introducing Peninsula Land
mn sq. ft.
mn sq. ft.
*Mumbai, Pune and Bengaluru
One of the first real estate companies to get listed on BSE
Developed Mumbai’s first luxurious residential tower in Central Mumbai – Ashok Towers
Built Mumbai’s first retail mall – Crossroads
Set a commercial benchmark in Lower Parel with Peninsula Corporate Park
Re-developed Mumbai’s first textile mill project
01
02
03
04
05
The Year in Review
2 Peninsula Land Limited

3Annual Report 2017-18
Built for challenges. Preparing for growth.
To become the most trusted Real Estate Developer in India by:
Pillars of Strength
Vision
ExperienceEntrenched experience spanning over two decades in project execution and management provides capability to obtain timely permissions, which is key for effective execution and profitability
PlanningWell researched concept planning provides enriching end‑user experience with accurate estimates, efficient project management and effective cost control
Long-standing relationshipsEnjoy enduring relationships with construction contractors, material and service providers, channel partners, capital providers and customers
State-of-the-art technologyBest‑in‑class designs and engineering expertise backed by sophisticated equipment, skilled team and competent leadership
Quality complianceDelivers projects adhering to international quality standards leading to quality consistency, derived from process discipline
Robust teamProficient team with established and structured corporate processes that facilitate smooth project execution
Building distinctive capabilities in sales and marketing, project management and development
Inculcating a high‑ performance culture
Being the partner of choice
1. 2. 3.
3Annual Report 2017-18
Built for challenges. Preparing for growth.

Vice-Chairman & Managing Director’s Message
Dear Shareholders,
It gives me great pleasure to address you while highlighting your Company’s performance during Financial Year (FY) 2017‑18. The strategy of your company has been to enhance revenues while executing projects on time and in reducing the debt of the Company. To that end, during the year 2017‑18, we successfully closed sale of 3 land parcels one each in Mumbai, Pune and Bengaluru. Your Company has also made good progress towards monetisation of some other non‑core assets during 2017‑18, the results of which you should see in the next year. During the year 2017‑18, the Company sold 4,05,293 sq. ft. across its projects compared to 5,73,299 sq. ft. during 2016‑17, the reduction being primarily due to impact of GST. The revenue for 2017‑18 stood at `673 crore compared to `454 crore in 2016‑17, registering a growth of 48.24%.
India’s real estate sector saw two major reforms in the fiscal – the Real Estate (Regulation & Development) Act (RERA) and the Goods and Services Tax Act (GST). Rollout of reforms like that of GST and RERA will spur the growth of the real estate sector in the long run. Immediately after the introduction of
Delivering through challenges
GST, there has been a lot of resistance in sales of high‑value ticket sizes, since an effective post‑GST levy of 12% has led to considerable escalation in ticket size for the buyer. The savings assessed in any on‑going project, due to introduction of GST, have only been partial since substantial construction progress has taken place in most of our projects. Moreover, the percentage of land cost, as a proportion of the total project cost, in most of the projects located in Mumbai, is very high and is exempt from GST. Hence, the benefits accruing due to the introduction of GST that could be passed on to existing customers have been limited. With GST in place, however, customers should see real benefit in the near future from reduced construction costs, in new projects.
Within the residential asset class, Peninsula Land Ltd. has been catering to the demand in the premium and ultra‑luxury segment, in which, the demand has been muted because of the considerable increase in absolute value of taxes, post introduction of GST. Although the Company has been doing reasonably well in this segment, the overall macro‑economic situation has
We have entered affordable housing by launching the addressOne Brand which is aimed at providing affordable luxury to consumers.
Rajeev A. PiramalExecutive Vice-Chairman & Managing Director
The Year in Review
4 Peninsula Land Limited

limited the growth in this segment. In the context of the present Government’s vision of “Housing for All” by 2022 and several initiatives and policies planned around the vision, your Company has now embarked on addressing the needs in the affordable housing segment through our development at Gahunje, in Pune. We have entered the affordable housing segment by launching the “addressOne” project which is aimed at providing affordable luxury to consumers.
Exploring new opportunities
The Company is also closely evaluating the opportunities in the mid‑income housing segment and also scouting for opportunities in commercial asset class to add to the portfolio. We are also carefully monitoring the changing trends in real estate like commercial REITS, to prepare for the future.
Growth strategy
With the focus on future growth, the business strategy is built on the following pillars:
a) Efficient capital structure
The Company is working towards managing an optimal capital structure with alignment of cash inflows from sale of Inventory with cash outflows towards construction cost, debt servicing etc.
b) Commercial portfolio
The Company is looking to grow our commercial portfolio.
c) Residential
The Company is also looking forward to acquire new projects in Mumbai, Pune and Bengaluru under Asset light models. However, the focus will be to acquire projects in which the time to market from the point of acquisition is minimal.
Our people
At the end of the day, Peninsula Land’s strongest asset is our people. They enable us to deliver on our purpose. It is an honour and a privilege to lead a team of such passionate and creative thinkers. We are united by a commitment to our purpose, to our customers and to our community.
Looking ahead
The key challenges are stagnation in market prices and the inability to match current inventory costs vis–a‑vis pricing of inventory in new projects launched after introduction of GST. Further, customers have been fence‑sitters for
a long time with the consideration that market prices have not yet bottomed out. However, the right product along with the right pricing is seeing traction in the market.
Going forward, your Company plans to go about executing on‑going projects within envisaged time frame, reduce debt by monetising non‑core land parcels and by adopting asset‑light models in the acquisition of any new projects. We expect to achieve sales volumes and sales price realisation in each of our projects amidst the tough environment in the real estate space. Towards this objective, the Company is revamping the entire sales and marketing Organisational structure and approach, to make it more effective. Simultaneously, the Company is also working to create a unique value preposition to position ourselves in the market in addition to scouting opportunities across different asset classes and geographies to diversify risks and grow further.
In closing, I would like to thank all of our customers, consumers and shareholders for your continued support.
Regards,
Rajeev A. PiramalExecutive Vice‑Chairman & Managing Director
D673 cr 2017-18 Revenue
5Annual Report 2017-18
Built for challenges. Preparing for growth.

6 Peninsula Land Limited
The Year in Review
Showcasing resilience in a challenging year
Operational HighlightsDespite a challenging year on the account of weak consumer sentiments and changes in regulatory framework, we demonstrated resilience. During the year, we
Sold 4,05,293 sq. ft. during 2017‑18 as against 5,73,299 sq. ft. during 2016‑17
Completed new sales value of C635 crore during 2017‑18 vis‑à‑vis C904 crore during 2016‑17
Recorded collections worth C635 crore for 2017‑18 compared to C557 crore during 2016‑17
Delivered two residential projects
Project Sq. ft. No. of units
Ashok Astoria (Phase 1), Nashik 4,98,108 338
Ashok Meadows, Pune 5,07,484 336
Total 10,05,592 674
D433 cr Sold non-core land parcels/assets
•
•
•
•
The Year in Review
6 Peninsula Land Limited

7Annual Report 2017-18
Built for challenges. Preparing for growth.
Out of the land parcels available with the Company, it has commenced the project planning process in respect of following land parcels and plan to launch them in near future.
Project/Land Saleable Area Planned Location Development
Model
Celestia Spaces, Sewree, Phase 2 15,00,000 Mumbai JV
addressOne, Gahunje# 28,00,000 Pune Owned
Ashok Astoria, Phase 2 Plotted land 40,000 Nasik Owned
Ashok Astoria, Phase 3 Development 3,60,000 Nasik Owned
Note: Saleable area potential mentioned above is subject to requisite approvals. # Phase 1 of Project addressOne launched
We are also going strong with several projects nearing completion
Ongoing Projects (cumulative as on March 31, 2018)
Future Development
ProjectsSaleable
Area (sq. ft. in 000’s)
Location PLL Share (%)
No. of units sold
Area Sold (sq. ft. in
000’s)
Sales Value (D in crore)
Average Realisation
(D / sq. ft.)
Collections (D in crore)
ResidentialBishopsgate 93 Mumbai 50% 10 78 540 69,619 447Celestia Spaces – PLL share 490 Mumbai 100% 167 324 734 22,630 351Carmichael Residences 146 Mumbai 40% 16 83 642 76,896 370Salsette 27 915 Mumbai 57% 204 332 925 27,864 209Ashok Meadows – Phase 1* 507 Pune 55% 332 499 249 4,999 240Peninsula Heights, JP Nagar 620 Bengaluru 80% 88 366 358 9,784 235Ashok Astoria Phase 1* 498 Nashik 100% 277 432 153 3,544 141Ashok Nirvaan 352 Lonavala 25% 13 101 65 6,467 57Ashok Beleza 200 Goa 58% 26 66 38 5,741 33Ashok Beleza (Plot A) 115 Goa 58% 18 111 22 1,939 19
Total 3,936 1,151 2,392 3,726 2,102
* Completed projects
7Annual Report 2017-18
Built for challenges. Preparing for growth.

Profit & Loss Metrics
Navigating a challenging business landscape
Financial Highlights
Revenue
372
294
303
454
673
(` in crore)
2013
-14
2014
-15
2015
-16
2016
-17
2017
-18
EBITDA
155
120
128 72 149
(` in crore)
2013
-14
2014
-15
2015
-16
2016
-17
2017
-18
Profit After Tax
49 (6)
17
(143
)
(327
)
(` in crore)
2013
-14
2014
-15
2015
-16
2017
-18
2016
-17
Earnings Per Share (Basic)
1.76
(0.2
3)
0.62
(5.1
3)
(11.
72)
(`)
2013
-14
2014
-15
2015
-16
2017
-18
2016
-17
The Year in Review
Peninsula Land Limited8

Balance Sheet Metrics
Total Assets
3,10
0
3,62
6
3,98
3
4,13
8
3,68
8
(` in crore)
2013
-14
2014
-15
2015
-16
2016
-17
2017
-18
Shareholders’ Fund
1,53
2
1,50
6
1,85
5
1,70
5
1,37
8
(` in crore)
2013
-14
2014
-15
2015
-16
2016
-17
2017
-18
Debt Equity Ratio
0.84
1.16
0.95
1.23
1.43
(%)
2013
-14
2014
-15
2015
-16
2016
-17
2017
-18
Book Value Per Share
54.8
8
53.9
5
66.4
2
61.0
6
49.3
5
(`)
2013
-14
2014
-15
2015
-16
2016
-17
2017
-18
Built for challenges. Preparing for growth.
Annual Report 2017-18 9

Gearing to leverage emerging opportunities The Government of India is implementing structural reforms across industries to propel the country to the next level of development. It rolled out two major regulatory changes in 2017‑18 – Real Estate (Regulation & Development) Act (RERA) and Goods & Services Tax (GST) Act – that are likely to have major impact on the real estate segment.
Opportunities Unfolding
Other government initiatives such as relaxation of the FDI norms for our sector, focus on affordable housing and smart cities, and Benami Transaction Act will have a positive impact on our sector. These initiatives are expected to facilitate availability of capital and usher in an era of transparency in the segment. This will infuse comfort to customers and investors and will eventually be positive for all stakeholders. A system with streamlined and timely approval processes will be very beneficial for the long‑term growth of the real estate sector and economy at large.
Delivering ‘Housing for All’
Foraying into affordable housing
To accomplish the mammoth task of ‘Housing for All by 2022’, the government has designed several initiatives, including grant of infrastructure status to affordable housing and unveiled the Pradhan Mantri Awas Yojana (PMAY) (Urban) scheme.
We launched the first phase of the 51‑acre project 'addressOne' located at Gahunje outside Pune. The project falls under the Pradhan Mantri Awas Yojana (PMAY) and is designed by architect Hafeez Contractor.
Although 2017‑18 remained slow and challenging for the real estate sector across India, reinforced by an overall weak consumer sentiment, we expect this trend to reverse soon. Going forward, initiatives like ‘Housing for All’ and Pradhan Mantri Awas Yojana (PMAY) (Urban) that are focused on providing homes for all Indians will serve as growth drivers for the industry.
As India gears to address the shortage of housing and the gap in availability and accessibility of finance in this segment, we are mobilising our resources to tap these opportunities. At Peninsula Land, we are fully committed to work with the Government of India and contribute towards its aim of attaining Housing for All.
We are well poised to leverage the opportunities presented by the current economic environment and government policies.
The Year in Review
10 Peninsula Land Limited

11Annual Report 2017-18
Built for challenges. Preparing for growth.

Since 1997, we have delivered an attractive portfolio of projects including residential, commercial, information technology parks and retail. We are known for developing world‑class properties that redefine the relevant micro markets.
We continue to grow in the traditional real estate sector while investing in new cutting‑edge projects that showcase our pioneering capabilities and expertise. Our projects are spread across price points in Mumbai,
Pioneering excellence through the years
Pioneering Excellence
Near the centre of Pune’s thriving IT industry, Hinjawadi2 and 3 BHK apartmentsGarden flats on podium levelClubhouse with state-of-the-art amenities
Ashok Meadows, Pune•
•••
Peninsula Corporate Park, Lower Parel, Mumbai
Golden mile of South Mumbai Landmark commercial destinationin the heart of Lower ParelOne of Mumbai’s largest commercial complex with open spaces5 modern multi-storied commercial buildings
••
•
•
Residential complex spread across vast green spaces, nearSula VineyardsInspired by Art Deco architectureModern amenities surrounded by natureBayside Plaza – An urban shopping experience down your street
Ashok Astoria Phase I, Nashik•
••
•
South Mumbai’s first premium shopping mall-cum-multiplexTotal area: 2,59,000 sq. ft.Flaunts some of the biggest international brands8 floors of multi-storied parkingfor 485 cars
CR2 Mall, Nariman Point, Mumbai•
•
••
The Year in Review
12 Peninsula Land Limited

Ashok Gardens, Sewri, Mumbai2, 3, 4, 5 BHK apartments and4 BHK duplexesProminent landmark of Sewri6-fold appreciation for residentsPanaromic views of harbour,sea and city Huge landscaped areaWell-equipped clubhouse
•
•••
••
Ashok Towers, Parel, Mumbai2, 3, 4 and 5 BHK apartmentsGarden duplexes and penthousesLifestyle that redefines Lower Parel10-fold appreciation for residentsFull-sized cricket pitch cumfootball groundWell-equipped clubhouse
•••••
•
Crossroads, Haji Ali, MumbaiFirst luxury mall of South Mumbai Total area: 1,50,000 sq. ft.Houses several international brandsShopping and entertainment spaces at Mumbai’s cherished seaside promenade at Haji Ali
••••
Centre Point, Parel, Mumbai4-storey ultra-modern commercial edificeEquipped with cutting-edge communication and security systemsConnected to the most prominent business, retail and entertainment centres of the city
•
•
•
Peninsula Business Park, Lower Parel, Mumbai
Golden mile of South Mumbai Landmark commercial destinationin the heart of Lower ParelOver 1.2 million sq. ft. ofcommercial workspaceClear view of the Arabian Sea and Mahalaxmi Race courseLow e-energy efficient glass
••
•
•
•
Peninsula Centre, Parel, MumbaiState-of-the-art business complexNew-age sophisticated office spacesWell connected to the Western andCentral suburbs
•••
Bengaluru, Nashik, Pune, Goa and Lonavala. We have already executed over 7.4 million sq. ft. of property and we are poised to deliver similar volume in the next five to seven years.
Our objective is to provide our customers with best‑in‑class properties and be a leader in each product space. We are working towards creating a niche for the Company based on our competency, industry knowhow
and experience and set a benchmark for superior architecture.
Some of our most recognised projects are Peninsula Business Park, Ashok Towers, Ashok Gardens, Crossroads and Peninsula Corporate Park.
We have been highly appreciated for the following projects:
13Annual Report 2017-18
Built for challenges. Preparing for growth.

Strengthening capabilities to achieve visionWe believe our vision drives us to deliver the best for our people, customers, investors and communities. Our vision is evident in the distinctive quality, design and appearance of our signature properties. It is the beacon of tomorrow’s living, shopping and work spaces, which we expect to transform substantially, integrating technology and sustainability practices.
Strong Competencies
“The perception is that the builder is trying to hide something, at Peninsula Land you don’t get that feeling – so that is a big plus.”
“The upmarket feel that comes through, thanks to the layout of the design and the details that the developer has put in – this is very good.”
Mr. Harsh Khiraiya
Mr. K V S Prakash
Customer testimonials
The Year in Review
14 Peninsula Land Limited

Focus on quality
Quality is the way of life at Peninsula Land. We follow a quality management system and comply with all relevant quality standards. Over the years, our emphasis on quality has enabled us to be recognised as a quality‑focused real estate developer, garnering trust of our customers and investors.
Differentiated designs
Unique designs have always been the hallmark of our projects. We have consistently focused on design and aesthetics, which have helped us deliver best‑in‑class experience to our customers and strengthen the value proposition of our brand.
Future plans
We believe there are infinite possibilities and opportunities in the current industry landscape including affordable housing. Going forward, we will acquire new projects in micro markets of Mumbai, Pune and Bengaluru following asset light model of development. Affordable housing has been identified as a new area of growth for the Company and we will also explore development opportunities in office space.
State-of-the-art technology
We believe technology plays a critical role in helping us deliver world‑class properties. We have always adopted leading‑edge technologies to complete our projects on time and within budget. Technology also helps enhance the durability and safety of our projects.
Inspired by innovation
We have created a culture that encourages non‑linear thinking and challenges the status quo to release new ideas and creativity. We invest significantly to drive innovation and develop several landmark projects. Our approach to innovation facilitated our ability to introduce several firsts in western India’s skyline.
To make our vision a reality, it is essential that we strengthen our abilities, including
15Annual Report 2017-18
Built for challenges. Preparing for growth.Built for challenges. Preparing for growth.

Putting people at the heart of our business
People
Our people are vital to our business and without them we would not be able to build sustainable projects where people want to live, work and shop. We believe that a skilled, engaged and productive workforce is essential for the achievement of our strategic objectives.
Acquiring and developing talentWe have future‑ready HR systems and processes that go hand‑in‑hand with the demands of the business. We have a scalable talent acquisition system, which seamlessly interacts with the industry to onboard talent.
Training and development programmes are essential to help our people sharpen their skills. Therefore, we use the right mix of classroom, online and certification courses for training and upskilling our team. These training modules cater to the soft and functional skill requirements and aim at building leaders for future.
Building a merit-based cultureWe have established a culture of meritocracy, openness and innovation where ideation and cross‑functional collaboration are encouraged. We emphasise on accountability, openness and feedback to ensure the sustenance of the Company’s entrepreneurial culture.
Periodic rewards and recognition platforms are used to recognise our employees who have demonstrated our values and those who have made the business impact through their hard‑work and dedication.
We further ensure that our people comply to the code of business conduct and fair business practices. At Peninsula Land, we are building an organisation that embraces diversity without any bias in providing employment opportunities.
The Year in Review
16 Peninsula Land Limited

During 2017-18, we focused on developing the following aspects:
Capability and capacity building through training and development
Improve HR service delivery through appropriate policies and procedures to establish long-term labour relationships
Talent management with emphasise on rewarding superior performance
Adherence to our desired organisational culture and safety behaviours
Critical skills building and succession planning to achieve long-term strategic objectives
17Annual Report 2017-18
Built for challenges. Preparing for growth.

Helping improve the quality of life
Corporate Social ResponsibilityAt Peninsula Land, our commitment to responsible business practices is embedded in everything we do. Moreover, we believe corporates and communities co‑exist symbiotically deriving synergies from another. Therefore, we endeavour to make a positive impact on our customers, consumers, employees and the wider community. We undertake our social responsibility initiatives through the Urvi Ashok Piramal Foundation (UAPF). The foundation primarily operates in the areas of health, vocational training, environment and education.
Providing healthcare facilitiesFor tribal children
UAPF offers special healthcare facilities through Mobile Health Units (MHU) to school children in tribal areas. The programme covers 34 tribal residential ashram schools, reaching 18,000 children per week for eradicating scabies. UAPF controls the programme through five MHUs at Raigad District, Shahapur and Murbad at Thane District, Maharashtra.
The programme focuses on helping the children develop personal and environmental hygiene habits through peer education and continuous health sessions. Our team’s regular interaction with the children, along with periodic sessions on health and hygiene and dispensing quality medication has made a difference. Besides, all children are annually screened for anaemia, growth deficiency and tonics are accordingly administered. Twice in a year deworming camps are also conducted, and height and weight of the children are measured. The health data of each child is maintained in Tabs as all the MHUs are digitalised.
Earlier, children had to travel almost 15 to 20 kms to find a doctor or medicines. Today, with continuous intervention of UAPF, there is a significant change in the health of the children. They are now more alert and receptive with improved social skills. The foundation has noticed a spurt in the children’s participation in school activities.
For people residing near forests and forest guards
UAPF launched MHU services in September 2017 for people living in the buffer zone of the Bor forest and for the forest guards, at the behest of the forest department. In the initial phase, 21 villages comprising 20,000 people will be covered. The MHU van is equipped with modern devices and offers medicines on its weekly visits. Along with regular health check ups and treatment, special camps were also conducted. The MHU screened over 500 people and addressed issues of anemia, women’s general health and hygiene in the last six months through three such camps. The forest department wants the foundation to gradually reach the remaining 25 villages by launching a second van.
UAPF manages similar programmes near Nagpur for the rural and tribal villages at Butibori and Pench, located respectively in Madhya Pradesh and Maharashtra. Apart from this, health check‑up camps with the help of Forest Department was organised for Bor Forest employees and the villagers. The team also organised Haemoglobin screening camp for patients with the help of women’s self‑help groups (SHGs).
The Year in Review
18 Peninsula Land Limited

Eye-care on wheels
The ‘Netra Vasant’ programme runs at Jhunjhunu district, Rajasthan and focuses on providing vision care in the district. The Mobile Vision Care van covers the entire district treating refractive errors. It conducts eye screening camps, distributes spectacles free of cost and performs free cataract surgries at the base hospital. The project has completed three years and serves all eight zones of the district. Through the accredited social health activist (ASHA Workers) training, the programme is maximising its reach. The ASHA workers motivate people to attend the eye camps and also conduct initial screening of patients and then provide referrals. The ASHA workers are properly trained under this programme.
Empowering rural women
UAPF has initiated a sustainable livelihoods programme for empowering rural women in Rajasthan’s Jhunjhunu district. The programme invested in developing hand block printing, a rich tradition of the state, where local women are trained in the art of block printing using traditional wooden handmade blocks. The local staff source the raw materials including fabrics and colours.
Rekh is the brand name of hand block printed products, which are eco‑friendly, safe to use and primarily chemical free. UAPF helps serve two objectives with this initiative. It provides women the path towards sustainable development and helps preserve a traditional art form.
9,174No. of patients examined
18,000No. of children covered through MHU
19Annual Report 2017-18
Built for challenges. Preparing for growth.

20 Peninsula Land Limited
Statutory Reports
Notice
Notice is hereby given that the 146th Annual General Meeting (AGM) of the members of Peninsula Land Limited will be held at Hall of Culture, Nehru Centre, Dr. Annie Besant Road, Worli, Mumbai – 400 018 on Monday, August 6, 2018, at 03:00 p.m. to transact the following businesses:
Ordinary Business:1. To receive, consider and adopt the Standalone and Consolidated
Financial Statements of the Company for the Financial Year ended March 31, 2018 and the Reports of the Directors and Auditors thereon.
2. To appoint a Director in place of Mr. Nandan A. Piramal, Whole-Time Director (DIN: 00045003) who retires by rotation and is eligible for re-appointment.
3. To ratify the appointment of SRBC & Co. LLP, Chartered Accountants, Mumbai (Firm Registration No. 324982E/ E300003) as the Statutory Auditor of the Company, for the remaining term of four years upto the conclusion of the Annual General Meeting to be held in the year 2022. The Statutory Auditors were appointed at the 145th Annual General Meeting held on August 29, 2017 for a period of 5 years.
Special Business:4. To consider and approve managerial
remuneration payable to Mr. Rajeev A. Piramal, Executive Vice-Chairman and Managing Director.
To consider and if thought fit, to pass, the following resolution as a Special Resolution:
“RESOLVED THAT pursuant to the provisions of Section 197 and 198 read with Schedule V and other applicable provisions, if any, of the Companies Act, 2013, the Companies (Appointment and Remuneration of Managerial Personnel) Rules, 2014 (including any statutory modification(s) or re-enactment thereof for the time being in force) and provisions of the Articles of Association of the Company and subject to such other Statutory / Regulatory approvals as may be required, the consent of the Company be and is hereby accorded to pay remuneration as mentioned below, to Mr. Rajeev A. Piramal – Executive Vice-Chairman and Managing Director, not exceeding the limits based on the effective capital of the Company as prescribed under Section – II of the Schedule V to the Companies Act, 2013, w.e.f. April 1, 2018 for the remaining period of his present tenure of appointment upto October 25, 2020, with the authority to the Nomination and Remuneration Committee of the Board to alter and vary the remuneration as it may deem fit and to fix the quantum, composition and periodicity of the remuneration payable to Mr. Rajeev A. Piramal, Executive Vice-Chairman and Managing Director, including the payment of commission as may be determined, provided that the annual remuneration including commission does not exceed the limit mentioned hereinafter and that the following perquisites shall not be included in the computation of the ceiling on remuneration prescribed under Schedule V of the Companies Act, 2013:
a. contribution to provident fund, superannuation fund or annuity fund to the extent these either singly or put together are not taxable under the Income Tax Act, 1961;
b. gratuity payable at a rate not exceeding half a month’s salary for each completed year of service; and

21Annual Report 2017-18
Built for challenges. Preparing for growth.
c. encashment of leave at the end of tenure.
(Amount in ` )Remuneration
Basic Salary ` 1,20,00,000 p.a.PerquisitesLeave Travel Allowance ` 2,50,000 p.a.Medical Reimbursement At actualsMedical Insurance As per Rules of the CompanyAccident Insurance As per Rules of the CompanyCar & Phone As per Rules of the CompanyLeave encashment At the end of TenureGratuity 15 days basic for each completed
yearProvident Fund 12% on ̀ 15,000/- p.m.= ̀ 21,600 p.a.Superannuation Fund NilCommission As may be determined by the Board
of Directors
RESOLVED FURTHER THAT all the Directors of the Company and the Company Secretary be and are hereby severally authorized to do all such acts, deeds, matters and things, including but not limited to filing of necessary forms and returns with the Registrar of Companies, as may be required to give effect to the foregoing resolution.”
5. To consider and approve managerial remuneration payable to Mr. Nandan A. Piramal, Whole-Time Director.
To consider and if thought fit, to pass, the following resolution as a Special Resolution:
“RESOLVED THAT pursuant to the provisions of Section 197 and 198 read with Schedule V and other applicable provisions, if any, of the Companies Act, 2013, the Companies (Appointment and Remuneration of Managerial Personnel) Rules, 2014 (including any statutory modification(s) or re-enactment thereof for the time being in force) and provisions of the Articles of Association of the Company and subject to such other Statutory / Regulatory approvals as may be required, the consent of the Company be and is hereby accorded to pay remuneration as mentioned below, to Mr. Nandan A. Piramal – Whole-Time Director, not exceeding the limits based on the effective capital of the Company as prescribed under Section – II of the Schedule V to the Companies Act, 2013, w.e.f. April 1, 2018 for the remaining period of his present tenure of appointment upto October 25, 2020, with the authority to the Nomination and Remuneration Committee of the Board to alter and vary the remuneration as it may deem fit and to fix the quantum, composition and periodicity of the remuneration payable to Mr. Nandan A. Piramal – Whole-Time Director, including the payment of commission as may be determined, provided that the annual remuneration including commission does not exceed the limit mentioned hereinafter and that the following perquisites shall not be
included in the computation of the ceiling on remuneration prescribed under Schedule V of the Companies Act, 2013:
a. contribution to provident fund, superannuation fund or annuity fund to the extent these either singly or put together are not taxable under the Income Tax Act, 1961;
b. gratuity payable at a rate not exceeding half a month’s salary for each completed year of service; and
c. encashment of leave at the end of tenure.
(Amount in `)Remuneration
Basic Salary ` 99,00,000 p.a.PerquisitesLeave Travel Allowance ` 2,50,000 p.a.Medical Reimbursement At actualsMedical Insurance As per Rules of the CompanyAccident Insurance As per Rules of the CompanyCar & Phone As per Rules of the CompanyLeave encashment At the end of TenureGratuity 15 days basic for each completed yearProvident Fund 12% on ` 15,000/- p.m. = ` 21,600 p.a.Superannuation Fund NilCommission As may be determined by the Board of
Directors
RESOLVED FURTHER THAT all the Directors of the Company and the Company Secretary be and are hereby severally authorized to do all such acts, deeds, matters and things, including but not limited to filing of necessary forms and returns with the Registrar of Companies, as may be required to give effect to the foregoing resolution.”
6. To consider and approve managerial remuneration payable to Mr. Mahesh S. Gupta, Group Managing Director.
To consider and if thought fit, to pass, the following resolution as a Special Resolution:
“RESOLVED THAT pursuant to the provisions of Section 197 and 198 read with Schedule V and other applicable provisions, if any, of the Companies Act, 2013, the Companies (Appointment and Remuneration of Managerial Personnel) Rules, 2014 (including any statutory modification(s) or re-enactment thereof for the time being in force) and provisions of the Articles of Association of the Company and subject to such other Statutory / Regulatory approvals as may be required, the consent of the Company be and is hereby accorded to pay remuneration as mentioned below, to Mr. Mahesh S. Gupta – Group Managing Director, not exceeding the limits based on the effective capital of the Company as prescribed under Section – II of the Schedule V to the Companies Act, 2013, w.e.f. April 1, 2018 for the remaining period of his present tenure of appointment upto October 25, 2020, with the authority to the Nomination

22 Peninsula Land Limited
Statutory Reports
Notice Continued
and Remuneration Committee of the Board to alter and vary the remuneration as it may deem fit and to fix the quantum, composition and periodicity of the remuneration payable to Mr. Mahesh S. Gupta – Group Managing Director, including the payment of commission as may be determined, provided that the annual remuneration including commission does not exceed the limit mentioned hereinafter and that the following perquisites shall not be included in the computation of the ceiling on remuneration prescribed under Schedule V of the Companies Act, 2013:
a. contribution to provident fund, superannuation fund or annuity fund to the extent these either singly or put together are not taxable under the Income Tax Act, 1961;
b. gratuity payable at a rate not exceeding half a month’s salary for each completed year of service; and
c. encashment of leave at the end of tenure.(Amount in `)
Remuneration
Basic Salary ` 1,20,00,000 p.a.
Perquisites
Reimbursement of Medical expenses including hospitalization for self and family
• Medical Expenses: Amount equivalent to one Month’s Salary p.a.
• Hospitalisation and critical illness: at actuals
Reimbursement of expenses for Gas, Electricity, society and incidental charges, repairs & maintenance of residence (including society/condominium maintenance charges)
At actuals
Club Membership 2 Clubs
Reimbursement of car fuel, mainte-nance & Driver Salary
2 cars & 2 drivers at actuals
Phone at Residence & Mobiles Self & Family Members
Insurance premium for medical and hospitalization policy
Self & Family Members
Personal Accident Insurance Self & Family Members
Leave Travel Allowance and reimbursement of personal travelling expenses for self and family
Amount equivalent to one Month’s Salary p.a.
Leave Encashment Maximum accumulation of 365 days
Gratuity 15 days basic for each completed year
Provident Fund As per Rules of the Company
Superannuation Fund N.A.
Commission As may be determined by the Board of Directors
RESOLVED FURTHER THAT all the Directors of the Company and the Company Secretary be and are hereby severally authorized to do all such acts, deeds, matters and things, including but not limited to filing of necessary forms and returns with the Registrar of Companies, as may be required to give effect to the foregoing resolution.”
7. Issue of Non-Convertible Debentures on Private Placement Basis
To consider and if thought fit, to pass, the following resolution as a Special Resolution:
“RESOLVED THAT pursuant to the provisions of Section 42, 71 and other applicable provisions, if any, of the Companies Act, 2013 read with the Rules made thereunder (including any statutory modification or re-enactment thereof for the time being in force) and subject to rules/ regulations/ guidelines issued by Securities and Exchange Board of India (“SEBI”) or any other appropriate/ statutory authorities and pursuant to the provisions of the Articles of Association of the Company, the consent of the Company be and is hereby accorded to make offer(s) of Non-Convertible Debentures to be issued and alloted in one or more series within a period of one year, on private placement basis to such persons as may be identified by the Board of Directors (including any Committee of the Company authorised in this regard), upto an overall amount of ` 1500 Crores (Rupees One Thousand Five Hundred Crores only) on such terms and conditions as may be decided by the Board or a Committee, as the case may be, from time to time.
RESOLVED FURTHER THAT all the Directors of the Company or the Company Secretary or any other persons authorised by the Board or any Committees be and are hereby severally authorized to do all such acts, deeds, things and to execute all such documents, undertaking as may be necessary for giving effect to the foregoing resolutions.
RESOLVED FURTHER THAT the foregoing resolutions shall come into effect immediately on approval of the shareholders and a copy of this resolution certified to be a true copy by any of the Directors of the Company or the Company Secretary be furnished to any parties concerned with respect to the issue of the Securities.”
NOTES:
1) A MEMBER ENTITLED TO ATTEND AND VOTE AT THE ANNUAL GENERAL MEETING (THE “MEETING”) IS ENTITLED TO APPOINT A PROXY TO ATTEND AND VOTE ON A POLL INSTEAD OF HIMSELF AND THE PROXY NEED NOT BE A MEMBER OF THE COMPANY. PROXIES, TO BE EFFECTIVE, MUST BE RECEIVED BY THE COMPANY NOT LESS THAN 48 HOURS BEFORE THE MEETING.

23Annual Report 2017-18
Built for challenges. Preparing for growth.
A person can act as a proxy on behalf of members not exceeding fifty and holding in the aggregate not more than ten percent of the total share capital of the Company carrying voting rights. A member holding more than ten percent of the total share capital of the Company carrying voting rights may appoint a single person as proxy and such person shall not act as a proxy for any other person or shareholder.
2) Corporate members intending to send their authorized representatives to attend the Meeting are requested to send to the Company a certified copy of the Board Resolution authorizing their representative to attend and vote on their behalf at the Meeting.
3) MEMBER/ PROXY SHOULD BRING THE ATTENDANCE SLIP SENT HEREWITH, DULY FILLED IN, FOR ATTENDING THE MEETING.
4) The proxy shall not have the right to speak at the meeting.
5) The details pursuant to the Regulation 36(3) of the SEBI (Listing Obligations and Disclosure Requirements) Regulations, 2015 read with Clause 1.2.5 of the Secretarial Standards-2 regarding the approval of remuneration of Directors are annexed to this notice.
6) An Explanatory Statement as required under Section 102(1) of the Companies Act, 2013 in respect of the Special Business to be transacted at the Meeting is annexed hereto.
7) The Register of Members and Share Transfer Books of the Company will remain closed from July 28, 2018 to August 6, 2018 (both days inclusive).
8) All relevant documents referred in the Explanatory Statement shall be open for inspection, upto two days prior to the said Meeting, at the Registered Office of the Company on all working days during 12.00 p.m. to 02.00 p.m. and at the Meeting.
The Register of Proxies lodged for this meeting shall be available for inspection by any member, upon lodging a written request three days before the commencement of the meeting. Proxies will be available for inspection during the period beginning 24 hours before the time fixed for the commencement of the meeting and ending with the conclusion of the meeting.
9) Members holding shares in physical form are requested to address all their correspondence including change of address, mandates etc. to the Share Transfer Agents viz. Freedom Registry Limited, Plot No. 101/102, 19th Street, MIDC Area, Satpur, Nashik – 422 007 and the Members holding shares in dematerialised form should approach their respective Depository Participants for the same.
10) Members holding shares in physical form are requested to submit a copy of their PAN card and Bank Account details
with the Company or the Share Transfer Agent as per the directives of the Securities and Exchange Board of India. Since shares of the Company are traded on the Stock Exchanges compulsorily in demat mode, shareholders holding shares in physical mode are strongly advised to get their shares dematerialised.
11) The shareholders who are holding shares in demat form and have not yet registered their e-mail IDs, are requested to register their e-mail IDs with their Depository Participant at the earliest, to enable the Company to use the same for serving documents to them electronically, hereinafter. Shareholders holding shares in physical form may kindly register their e-mail IDs with the Share Transfer Agent by sending an e-mail at [email protected]. The Annual Report of the Company and other documents proposed to be sent through e-mail would also be hosted on the Company’s website www.peninsula.co.in.
12) Members holding shares in single name and in physical form are advised to make a nomination in respect of their shareholding in the Company and those Members who hold shares singly in dematerialised form are advised to make a nomination through their Depository Participants. The nomination form can be downloaded from the Company’s website www.peninsula.co.in.
13) Members desiring any information regarding accounts are requested to write to the Company in advance, so as to enable the management to keep the information ready at the meeting.
14) E-Voting:
a) In terms of Section 108 of the Companies Act, 2013 read with the Companies (Management and Administration) Rules, 2014, as amended, and Regulation 44 of SEBI (Listing Obligations and Disclosure Requirements) Regulations, 2015, the Company is pleased to provide the e-voting facility (the “Remote e-voting”) to its Members holding Shares in physical or dematerialised form, as on the cut-off date, being July 27, 2018, to exercise their right to vote by electronic means on any or all of the businesses specified in the accompanying Notice.
b) In terms of the Companies (Management and Administration) Rules, 2014 with respect to the voting through electronic means, the Company is also offering the facility for voting by way of Physical Ballot at the AGM. The Members attending the Meeting should note that those who are entitled to vote but have not exercised their right to vote by Remote e-voting, may vote at the AGM through Ballot for all businesses specified in the accompanying Notice. The Members who have exercised their right to vote by remote e-voting may attend the AGM but shall not be entitled to vote at the AGM. The voting rights of the

24 Peninsula Land Limited
Statutory Reports
Members shall be in proportion to their share in the paid-up equity share capital of the Company as on the cut-off date being July 27, 2018.
c) The Company has appointed Mr. Dhrumil Shah, of M/s Dhrumil M. Shah & Co., Practicing Company Secretaries (FCS No. 8021), as the Scrutinizer for conducting the Remote e-voting and the voting process at the AGM in a fair and transparent manner and he has communicated his willingness to be appointed as such and will be available for same.
d) Once the vote on a resolution is cast by a member, the member shall not be allowed to change it subsequently or cast the vote again.
e) The members who have cast their vote by Remote e-voting may also attend the AGM but shall not be entitled to cast their vote again.
f) The Company has engaged the services of Central Depository Services (India) Limited (“CDSL”) as the Agency to provide e-voting facility.
g) Voting rights shall be reckoned on the paid-up value of shares registered in the name of the member/ beneficial owner (in case of electronic shareholding) as on the cut-off date i.e. July 27, 2018. A person, whose name is recorded in the register of members or in the register of beneficial owners maintained by the Depositories as on the cut-off date only shall be entitled to vote.
h) The Scrutinizer, after scrutinizing the votes cast at the meeting, through remote e-voting and ballot, will not later than 48 hours of conclusion of the Meeting, make a consolidated Scrutinizer’s Report and submit the same to the Chairperson or any other person as authorized by her. The results declared along with the consolidated Scrutinizer’s Report shall be hosted on the website of the Company www.peninsula.co.in and on the website of CDSL viz. www.evotingindia.com. The results shall simultaneously be communicated to the Stock Exchanges.
i) Subject to receipt of requisite number of votes, the Resolutions shall be deemed to be passed on the date of the Meeting, i.e. August 6, 2018.
The instructions for shareholders voting electronically are as under:
(i) The voting period begins on August 1, 2018 at 10.00 a.m. and ends on August 5, 2018 at 5.00 p.m. During this period shareholders of the Company, holding shares either in physical form or in dematerialised form, as on the cut-off date (record date) of July 27, 2018 may cast their vote electronically. The e-voting module shall be disabled by CDSL for voting thereafter.
(ii) The shareholders should log on to the e-voting website www.evotingindia.com.
(iii) Click on Shareholders/Members.
(iv) Now Enter your User ID
a. For CDSL: 16 digits beneficiary ID,
b. For NSDL: 8 Character DP ID followed by 8 Digits Client ID,
c. Members holding shares in Physical Form should enter Folio Number registered with the Company.
(v) Next enter the Image Verification as displayed and Click on Login.
(vi) If you are holding shares in demat form and had logged on to www.evotingindia.com and voted on an earlier voting of any Company, then your existing password is to be used.
(vii) If you are a first time user follow the steps given below:
For Members holding shares in Demat Form and Physical Form
PAN Enter your 10 digit alpha-numeric PAN issued by Income Tax Department (Applicable for both demat shareholders as well as physical shareholders)
• Members who have not updated their PAN with the Company/Depository Participant are requested to use the first two letters of their name and the 8 digits of the sequence number in the PAN field.
The sequence number is printed on the address label affixed to the Annual Report and will also be mentioned in the email which will be sent to the Shareholders whose email ID’s are registered with the Company.
• In case the sequence number is less than 8 digits enter the applicable number of 0’s before the number after the first two characters of the name in CAPITAL letters. Eg. If your name is Ramesh Kumar with sequence number 1 then enter RA00000001 in the PAN field.
Dividend Bank Details OR Date of Birth (DOB)
Enter the Dividend Bank Details or Date of Birth (in dd/mm/yyyy format) as recorded in your demat account or in the Company records in order to login.
• If both the details are not recorded with the depository or Company please enter the member id / folio number in the Dividend Bank details field as mentioned in instruction (iv).
(viii) After entering these details appropriately, click on “SUBMIT” tab.
Notice Continued

25Annual Report 2017-18
Built for challenges. Preparing for growth.
(ix) Members holding shares in physical form will then directly reach the Company selection screen. However, members holding shares in demat form will now reach ‘Password Creation’ menu wherein they are required to mandatorily enter their login password in the new password field. Kindly note that this password is to be also used by the demat holders for voting for resolutions of any other Company on which they are eligible to vote, provided that Company opts for e-voting through CDSL platform. It is strongly recommended not to share your password with any other person and take utmost care to keep your password confidential.
(x) For Members holding shares in physical form, the details can be used only for e-voting on the resolutions contained in this Notice.
(xi) Click on the EVSN for Peninsula Land Limited on which you choose to vote.
(xii) On the voting page, you will see “RESOLUTION DESCRIPTION” and against the same the option “YES/NO” for voting. Select the option YES or NO as desired. The option YES implies that you assent to the Resolution and option NO implies that you dissent to the Resolution.
(xiii) Click on the “RESOLUTIONS FILE LINK” if you wish to view the entire Resolution details.
(xiv) After selecting the resolution you have decided to vote on, click on “SUBMIT”. A confirmation box will be displayed. If you wish to confirm your vote, click on “OK”, else to change your vote, click on “CANCEL” and accordingly modify your vote.
(xv) Once you “CONFIRM” your vote on the resolution, you will not be allowed to modify your vote.
(xvi) You can also take a print of the votes cast by clicking on “Click here to print” option on the Voting page.
(xvii) If a demat account holder has forgotten the changed password then Enter the User ID and the image verification code and click on Forgot Password & enter the details as prompted by the system.
(xviii) Shareholders can also cast their vote using CDSL’s mobile app m-Voting available for android based mobiles. The m-Voting app can be downloaded from Google Play Store. Apple and Windows phone users can download the app from the App Store and the Windows Phone Store respectively. Please follow the instructions as
prompted by the mobile app while voting on your mobile.
(xix) Note for Non–Individual Shareholders and Custodians
• Non-Individual shareholders (i.e. other than Individuals, HUF, NRI etc.) and Custodian are required to log on to www.evotingindia.com and register themselves as Corporates.
• A scanned copy of the Registration Form bearing the stamp and sign of the entity should be emailed to [email protected].
• After receiving the login details a Compliance User should be created using the admin login and password. The Compliance User would be able to link the account(s) for which they wish to vote on.
• The list of accounts linked in the login should be emailed to [email protected] and on approval of the accounts they would be able to cast their vote.
• A scanned copy of the Board Resolution and Power of Attorney (POA) which they have issued in favour of the Custodian, if any, should be uploaded in PDF format in the system for the scrutinizer to verify the same.
(xx) In case you have any queries or issues regarding e-voting, you may refer the Frequently Asked Questions (“FAQs”) and e-voting manual available at www.evotingindia.com, under help section or write an email to [email protected] or address the same to Mr. Rakesh Dalvi, Manager, Central Depository Services (India) Limited, A-Wing, 25th floor, Marathon Futurex, N M Joshi Marg, Lower Parel (E), Mumbai – 400 013, Tel.: 18002 25533
By Order of the Board For PENINSULA LAND LIMITED
Sd/-Registered Office: Rajashekhar Reddy Peninsula Spenta, Company Secretary &Mathuradas Mills Compound, Compliance OfficerSenapati Bapat Marg,Lower Parel, Mumbai – 400 013
Place: Mumbai Date: May 23, 2018

26 Peninsula Land Limited
Statutory Reports
EXPLANATORY STATEMENT PURSUANT TO SECTION 102 (1) OF COMPANIES ACT, 2013
Item No.s 4, 5 and 6
Mr. Rajeev A. Piramal and Mr. Mahesh S. Gupta were re-appointed as Executive Vice-Chairman and Managing Director and Group Managing Director respectively, by way of Special Resolutions passed by the members at the 143rd Annual General Meeting of the Company held on August 28, 2015 with effect from October 26, 2015 for a period of five years upto October 25, 2020.
Mr. Nandan A. Piramal was appointed as Whole-Time Director of the Company by way of a Special Resolution passed by the members of the Company at the 144th Annual General Meeting of the Company held on August 5, 2016 with effect from October 26, 2015 for a period of five years upto October 25, 2020.
Further, vide the Special Resolutions as mentioned above, the members also approved the remuneration payable to Mr. Rajeev A. Piramal, Mr. Nandan A. Piramal and Mr. Mahesh S. Gupta (hereinafter collectively referred to as “Executive Directors”), including the minimum remuneration to be paid in case the Company has no profits or the profits of the Company are inadequate to pay the remuneration, for a period of three years from their respective effective dates of appointment.
Since the term of remuneration approved by the shareholders of the Company will expire on October 25, 2018, the consent of the members of the Company is sought by way of Special Resolution for the approval of remuneration payable to the Executive Directors w.e.f. April 1, 2018. The Nomination and Remuneration Committee at its meeting held on May 23, 2018 has recommended the managerial remuneration, which was further approved and recommended by the Board at its meeting held on May 23, 2018, for the approval of members. The proposed terms of Remuneration are broadly the same as the existing terms of the Remuneration. The Board recommends passing of the Resolutions at Item No.s 4, 5 and 6 as Special Resolutions.
None of the Directors or Key Managerial Personnel of the Company or their relatives except Ms. Urvi A. Piramal, Mr. Rajeev A. Piramal, Mr. Nandan A. Piramal and Mr. Mahesh S. Gupta is concerned or interested in the resolutions at Items No.s 4, 5 and 6.
The Information as required to be annexed to the Explanatory Statement as per the second proviso to para (B) (iv) of Schedule V of the Companies Act, 2013 is as under:
I. General Information:
(1) Nature of Industry:
Real Estate and Construction.
Company information:
Peninsula Land Limited (“PLL”) was originally incorporated under the name, The Morarjee Goculdas Spg. & Wvg. Co. Ltd. on August 10, 1871 under Act No. 10 of 1866 of the Legislative Council of India. Its registered office is located at Peninsula Spenta, Mathuradas Mills Compound, Senapati Bapat Marg, Lower Parel, Mumbai 400 013, India. CIN: L17120MH1871PLC000005.
PLL is a real estate development Company with a diversified portfolio that comprises commercial, residential and retail developments in western and southern India.
(2) Date or expected date of commencement of commercial production:
Not Applicable as the Company is already in Operations.
(3) In case of new Companies, expected date of commencement of activities as per project approved by financial institutions appearing in the prospectus:
Not Applicable.
(4) Financial performance based on given indicators:
(` in Crores)Particulars For the
year ended March
31, 2018 (Audited)
For the year ended
March 31, 2017
(Audited)
For the year ended
March 31, 2016
(Audited)
For the year ended
March 31, 2015
(Audited)
For the year ended
March 31, 2014
(Audited)
Total Income
673.36 453.89 235.86 294.03 372.37
Profit Before Tax
(315.27) (102.03) (44.85) (18.47) 50.10
Profit After Tax
(327.33) (143.10) (29.97) (6.32) 49.14
(5) Foreign Investments or collaborations, if any:
The Company has not entered into any foreign collaboration. As per the shareholding pattern as on March 31, 2018, foreign investments in the Company are as under:
Category No. of Shareholders
No. of Shares
% of Shareholding
Foreign Institutional Investor’s (FIIs)
7 1,44,29,516 5.17
Overseas Corporate Bodies
1 2,50,000 0.09
Non- Resident Indian(NRI) 455 13,96,622 0.50
Notice Continued

27Annual Report 2017-18
Built for challenges. Preparing for growth.
II. Information about the Appointee:
(1) Background Details:
• Mr. Rajeev A. Piramal – Executive Vice Chairman and Managing Director
Mr. Rajeev A Piramal is the Executive Vice-Chairman and Managing Director of Peninsula Land Ltd and leads all aspects of the business from strategy to operations.
Under his leadership, Peninsula Land has grown robustly, developed over 7.4 mn. sq. ft. in the residential, commercial and retail sectors. Another 7.8 mn. sq. ft. of premium real estate is under development and in the pipeline. He has transformed Peninsula Land from a Mumbai based company to one with operations spread across eight cities in four states.
After completing his BBA (Bachelor in Business Administration) from Baldwin Wallace College, Cleveland, USA, he began his career as a management trainee at Nicholas Piramal. In early 2001, he entered the real estate sector and became a Director at Peninsula Land Limited.
In the last 15 years that he has been associated with the real estate sector, Mr. Piramal has played an instrumental role in developing some of the landmark projects in Mumbai. He was part of the team that developed the first textile mill land in Mumbai, after the government opened up development of mill land. Peninsula Corporate Park was developed on textile mill land in Central Mumbai and this project transformed Lower Parel into a new age business district.
He also played a crucial part in the development of the first mall in India: Crossroads. Mr. Piramal was in charge of the operations of Crossroads that brought in a new concept of shopping to India.
Peninsula Business Park, Peninsula Technopark, Ashok Towers and Ashok Gardens are some of the other iconic projects developed under his leadership.
In 2005, Mr. Piramal took over as the Executive Vice-Chairman of the company. In 2012, he took on the additional responsibility as Managing Director of the Company. Mr. Piramal has created Peninsula Land as a strong brand. He firmly believes that quality and timely execution of projects are the key factors leading to success in the real estate business.
• Mr. Nandan A. Piramal – Whole-Time Director
Mr. Nandan A. Piramal heads sales and marketing at Peninsula Land Ltd which has projects spread across
six locations in India. The entire gamut of marketing initiative: from developing marketing tools to sales is led by him.
He conceptualized and implemented marketing tools that have transformed project launches and improved sales in all the projects. Projects launched under him include Peninsula Heights in Bengaluru, Carmichael Residences at Carmichael Road, Celestia Spaces at Sewree and Salsette 27 at Byculla – all three in Mumbai. During the year, he launched Peninsula Land’s first project in the affordable housing segment, addressOne at Gahunje in Pune.
Mr. Piramal started his career as Vice Chairman in Pyramid Retail after completing his education in London. He was in charge of handling all aspects of the retail business from business strategy to expansion. Under his leadership, the number of retail stores increased to 40.
He also conceptualized and launched Corporate Social Responsibility (CSR) at Ashok Piramal Group. The CSR projects include mobile health vans providing medical aid at peoples’ doorsteps and vocational training institutes: training unemployed people to gain employment.
Mr. Nandan A. Piramal is an alumnus of University College, London.
• Mr. Mahesh S. Gupta – Group Managing Director
Mr. Mahesh S. Gupta, Group Managing Director at Ashok Piramal Group, oversees all businesses of the Group which comprises of real estate, textiles, auto components, cutting tools and renewable energy.
Mr. Gupta has about 4 decades of professional experience in the areas of Business Management and all dimensions of finance.
In his current role since 2005, he formulates the Group’s business strategy, steers the Group to achieve its goals and plays a significant role in guiding each business to attain profitable and sustained growth. Under his stewardship, the Group formulated an aggressive plan which has seen the businesses grow by leaps and bounds. Mr. Gupta leverages his in-depth understanding of the businesses to enhance the growth of the Group.
Earlier he had been associated with Piramal Enterprises Ltd. for about 17 years as Group CFO and was also on the board of several companies, including whole-time director of Nicholas Piramal Ltd. (now Piramal Enterprise Ltd.). During this tenure, he was part of the core team which was instrumental in transforming Nicholas Piramal from a small

28 Peninsula Land Limited
Statutory Reports
enterprise to amongst the top three Pharmaceutical Companies, mainly through mergers and acquisitions.
He has also worked with the RPG group as Group CFO and Management Board Member. The RPG Group comprises of companies such as CEAT Limited, KEC International Ltd., CESE Ltd., Philips Carbon Black Ltd., RPG Life Sciences Ltd., Saregama Ltd., Zensar Technologies Ltd. etc.
Mr. Gupta has received a number of recognitions for his business acumen. He was awarded the CFO of the Year Award, Special Commendation for Financial Excellence (Mergers & Acquisitions Category) in 2001 by IMA (formerly known as EIU), New Delhi.
He is on the Board of several Public listed Companies such as Peninsula Land Limited, Morarjee Textiles Limited, CEAT Limited and RPG Life Sciences Limited. From time to time he has also been associated with various Committees of The Institute of Chartered Accountants of India (ICAI) as co-opted member, Member Governing Council of Indian Association Corporate CFOs & Treasurers (InACT), Advisory Board of Chennai Business School.
Mr. Gupta has an Honours Degree in B.Com; LL.B (Gen.) Fellow Member of The Institute of Chartered Accountants and The Institute of Company Secretaries of India. He had an outstanding academic record and has been a Third Rank Holder and a Silver Medalist in Company Secretaries Final examination.
(2) Remuneration proposed and Past Remuneration :
The remuneration proposed to be paid during the remaining tenure of their directorships is detailed in the respective Resolutions. Remuneration paid in the past is as under:
• Mr. Rajeev A. PiramalParticulars For
FY 2017-18 Amount in `
For FY 2016-17
Amount in `
For FY 2015-16
Amount in `
Salary & Allowances 1,20,00,000 1,20,00,000 1,25,00,000Perquisite 39,600 39,600 39,600Company’s contribution to Provident Fund and Superannuation Fund
21,600 21,600 21,600
Total 1,20,61,200 1,20,61,200 1,25,61,200
• Mr. Nandan A. PiramalParticulars For
FY 2017-18 Amount in `
For FY 2016-17
Amount in `
For FY 2015-16
Amount in `
Salary & Allowances 99,00,000 99,00,000 42,84,677Perquisite 39,600 - 17,139
Particulars For FY 2017-18
Amount in `
For FY 2016-17
Amount in `
For FY 2015-16
Amount in `
Company’s contribution to Provident Fund and Superannuation Fund
21,600 21,600 10,800
Total 99,61,200 99,21,600 43,12,616
• Mr. Mahesh S. GuptaParticulars For
FY 2017-18 Amount in `
For FY 2016-17
Amount in `
For FY 2015-16
Amount in `
Salary & Allowances 1,27,47,958 1,23,71,217 1,20,70,890
Perquisite 6,79,283 4,38,772 6,46,841
Company’s contribution to Provident Fund and Superannuation Fund
14,40,000 15,40,000 15,40,000
Total 1,48,67,241 1,43,49,989 1,42,57,731
(3) Recognition or Awards:
Mr. Rajeev A. Piramal is Co-chair for the Real Estate Sector of Federation of Indian Chambers of Commerce and Industry (FICCI) and is a member of the Young Presidents Organisation.
Mr. Mahesh S. Gupta has received a number of recognitions for his business and professional acumen. He was awarded the CFO of the Year Award, Special Commendation for Financial Excellence (Mergers & Acquisitions Category) by IMA (formerly known as EIU), New Delhi.
(4) Job profile and suitability:
Mr. Rajeev A. Piramal spearheads the real estate business of the Ashok Piramal Group. Mr. Piramal is the chief strategist and leverages his in-depth understanding of the business to enhance the growth of the Company.
Mr. Piramal leads a strong team of managers with a mission of delivering premium value to all stakeholders. With a vision and keen understanding of the dynamic market trends, Mr. Piramal has grown Peninsula Land Limited from Mumbai based to multiple locations real estate Company.
His implicit sense of business has enabled Peninsula Land Limited to carve a niche for itself in the Real Estate Sector.
Mr. Nandan A. Piramal heads sales and marketing at Peninsula Land Limited which has projects spread across six locations in India. The entire gamut of
Notice Continued

29Annual Report 2017-18
Built for challenges. Preparing for growth.
marketing initiative: from developing marketing tools to sales is led by him.
He conceptualized and implemented marketing tools that have transformed project launches and improved sales in all the projects. Projects launched under him include Peninsula Heights in Bengaluru, Carmichael Residences at Carmichael Road, Celestia Spaces at Sewree and Salsette-27 at Byculla – all three in Mumbai. During the year, he launched Peninsula Land’s first project in the affordable housing segment, addressOne at Gahunje in Pune.
Mr. Mahesh S. Gupta has about 4 decades of professional experience in business management and in all aspects of Corporate Finance such as treasury management, mergers and acquisitions, strategic planning, direct taxation, company law matters, etc. He is in the current position for about 13 years. Mr. Mahesh Gupta has helped in the Group achieve its goals. Under his stewardship, the Group formulated an aggressive plan which has seen the businesses grow by leaps and bounds.
(5) Comparative remuneration profile with respect to industry, size of the Company, profile of the position and person:
The proposed remuneration is comparable and competitive, considering the industry, size of the Company, the academic accolades, experience and expertise offered by the managerial persons.
(6) Pecuniary relationship directly or indirectly with the Company, or relationship with the Managerial Personnel:
Besides the remuneration and perquisites as stated above:
Mr. Rajeev A. Piramal also holds 9,21,365 equity shares in the Company and he is son of Ms. Urvi A. Piramal – Non-Executive Chairperson of the Company and brother of Mr. Nandan A. Piramal, Whole-Time Director of the Company. He has no other direct or indirect pecuniary relationship with the Company.
Mr. Nandan A. Piramal also holds 9,21,365 shares in the Company and he is son of Ms. Urvi A. Piramal - Non-Executive Chairperson of the Company and brother of Mr. Rajeev A. Piramal – Executive Vice Chairman and Managing Director of the Company. He has no other direct or indirect pecuniary relationship with the Company.
Mr. Mahesh S. Gupta also holds 300 equity Shares in the Company. He has no other direct or indirect pecuniary relationship with the Company or relationship with managerial personnel.
III. Other Information:
(1) Reasons of loss or inadequate profits:
The Real Estate Sector depends largely on regulatory approvals which are constantly undergoing changes and various amendments are being brought out in law, which puts this sector under constant compliance pressure.
The prolonged slowdown in the economic activity, weak consumer sentiments, high interest rate, slump in the Real Estate Sector coupled with the poor liquidity conditions and the applicability of the Guidance Note on Recognition of Revenue by Real Estate Developers. The Company has been making necessary efforts to improve its performance and has been aggressively pursuing and implementing its strategies, including launch of new projects and cost reduction initiatives. The results of these initiatives are likely to be felt in the coming years.
Owing to the above factors, the financial performance of the Company is not as per the expectations.
(2) Steps taken or proposed to be taken for improvement
The Company has a number of ongoing projects/ projects in the pipeline at Lonavala, Nashik, Goa, Bangalore, Pune and Mumbai which will enable it to improve financial performance in years to come. The details are more specifically given in the Management Discussion and Analysis, which is a part of this Annual Report. The Company has been aggressively pursuing and implementing its strategies to complete execution of its projects on time and reduce costs and enhance time efficiency.
(3) Expected increase in productivity and profits
Though the Real Estate Sector is witnessing a continued slowdown, in anticipation of revival of the overall economy in future, the aforesaid steps taken/to be taken by the Company are expected to improve the Company’s performance and profitability.
Item No. 7
In view of the existing and future financial requirements of the Company to support its business operations, the Company is in need of additional funds. Apart from Bank Loans, the Company had raised funds through issue of Non-Convertible Debentures (NCDs) on Private Placement basis under Section 42 of the Companies Act, 2013, by virtue of the prior approval of shareholders granted through Special Resolution.
Further, as per the provisions of Section 42 of the Companies Act, 2013 and Rules made thereunder, the prior approval of shareholders through Special Resolution shall be valid for

30 Peninsula Land Limited
Statutory Reports
all the offers or invitations for such NCDs during one year. Accordingly, the approval of the shareholders would be required again for the fresh offer of NCDs.
The Board of Directors accordingly recommends the Special Resolution set out at Item No. 7 of the accompanying notice for
the approval of the members.
None of the Directors, Key Managerial Personnel of the Company or their relatives is concerned or interested in the aforesaid resolution.
Details of the Directors seeking re- appointment/ approval for payment of managerial remuneration at this Annual General Meeting [Pursuant to Regulation 36 (3) of the SEBI (Listing Obligations and Disclosure Requirements) Regulations, 2015 read with Clause 1.2.5 of the Secretarial Standard-2]
Name of the Director Mr. Rajeev A. Piramal Mr. Nandan A. Piramal Mr. Mahesh S. Gupta
Date of Birth 12/05/1976 01/04/1981 30/06/1956Age 42 years 37 years 62 yearsDate of Appointment 26/10/2015 26/10/2015 26/10/2015Date of first appointment on the Board
27/07/2004 26/10/2016 26/10/2005
Qualifications Bachelor in Business Administrator from Baldwin Wallace College, Cleveland, USA.
Alumnus of University College, London.
Chartered Accountant (CA), Company Secretary (CS), B.Com, LL.B (Gen.)
Experience/ Expertise in specific functional areas
In the last 15 years that he has been associated with the real estate sector, Mr. Piramal has played an instrumental role in developing some of the landmark projects in Mumbai. He was part of the team that developed the first textile mill land in Mumbai, after the government opened up development of mill land. Peninsula Corporate Park was developed on textile mill land in Central Mumbai and this project transformed Lower Parel into a new age business district.
He also played a crucial part in the development of the first mall in India: Crossroads. Mr. Piramal was in charge of the operations of Crossroads that brought in a new concept of shopping to India.
Peninsula Business Park, Peninsula Technopark, Ashok Towers and Ashok Gardens are some of the other iconic projects developed under his leadership.
Mr. Nandan A. Piramal heads the sales and marketing teams at Peninsula Land Limited, which has eight residential Real Estate Projects in Western and Southern India.
He has conceptualized and implemented marketing tools that have transformed project launches. He has also revolutionized the traditional sales model to a more global and effective one. Projects launched under him include Peninsula Heights in Bengaluru, Carmichael Residences at Carmichael Road, Celestia Spaces at Sewree and Salsette 27 at Byculla – all three in Mumbai. During the year, he launched Peninsula Land’s first project in the affordable housing segment, addressOne at Gahunje in Pune..
Mr. Piramal began his career as Vice Chairman at Piramyd Retail – India’s first international standard Shopping Mall. He was responsible for handling all aspects of the business, including strategy and expansion. Under his leadership, the company went from a private company with 2 Stores to a public Listed Entity with 40 Retail Stores.
In his current role since 2005, he has been playing the role of formulating the Group’s business strategy, steering the Group to achieve its goals and a significant role in guiding each business to attain profitable and sustained growth. Under his stewardship, the Group formulated an aggressive plan which has seen the businesses grow by leaps and bounds. Mr. Gupta leverages his in-depth understanding of the businesses to enhance the growth of the Group.
He had been associated with Piramal Enterprises Ltd. for about 17 years, as Group CFO and was also on the board of several companies, including whole-time director of Nicholas Piramal Ltd (now Piramal Enterprises Ltd). During this tenure, he was part of the core team which was instrumental in transforming Nicholas Piramal from a small enterprise to amongst the top three Pharmaceutical Companies, mainly through mergers and acquisitions.
Terms and Conditions of Appointment
As per the details provided in the resolution.
Retiring by rotation and being eligible, proposed for re-appointment.
As per the details provided in the resolution.
Remuneration to be paid As per Resolution given at Sr. No. 4 of this Notice.
As per Resolution given at Sr. No. 5 of this Notice.
As per Resolution given at Sr. No. 6 of this Notice.
Notice Continued

31Annual Report 2017-18
Built for challenges. Preparing for growth.
Remuneration last drawn As decided in the Annual General Meeting held on August 28, 2015.
As decided in the Annual General Meeting held on August 5, 2016.
As decided in the Annual General Meeting held on August 28, 2015.
Directorship in other companies
• Peninsula Pharma Research Centre Private Limited
• HEM Infrastructure and Property Developers Private Limited
• Goodhome Realty Limited
• Planetview Mercantile Company Private Limited
• Inox Mercantile Company Private Limited
• Rockfield Trading Private Limited
• Peninsula Investment Management Company Limited
• Goodtime Real Estate Development Private Limited
• PenBrook Capital Advisors Private Limited (formerly known as Peninsula Brookfield Investment Managers Private Limited)
• Piramal Football Foundation
• High Life Event Management Consultancy Private Limited
• Pune Football Club Limited
• PMP Auto Components Private Limited
• Piramal Renewable Energy Private Limited
• HEM Infrastructure and Property Developers Private Limited
• Inox Mercantile Company Private Limited
• Miranda Few Tools Private Limited
• Rockfield Trading Private Limited
• Piramal Football Foundation
• Ashok Piramal Management Corporation Limited
• High Life Event Management Consultancy Private Limited
• Pune Football Club Limited
• Morarjee Textiles Limited
• RPG Life Sciences Limited
• CEAT Limited
• PMP Auto Components Private Limited
• Shobla Hydro Power Private Limited
• HEM Infrastructure and Property Developers Private Limited
• Piramal Infrastructure Private Limited
• Peninsula Investment Management Company Limited
• Peninsula Holdings and Investments Private Limited
• Goodtime Real Estate Development Private Limited
• Piramal Equitation Private Limited
Membership of Committees in other Public Limited Companies (includes only Audit & Stakeholders Relationship Committee)
• Peninsula Investment Management Company Limited - Audit Committee
• Goodtime Real Estate Development Private Limited - Audit Committee
Nil • Morarjee Textiles Limited - Stakeholders Relationship Committee
• RPG Life Sciences Limited - Stakeholders Relationship Committee
• RPG Life Sciences Limited - Audit Committee
• CEAT Limited - Audit Committee
• CEAT Limited - Stakeholders Relationship Committee
No. of shares held in the Company as on March 31, 2018
9,21,365 Equity Shares 9,21,365 Equity Shares 300 Equity Shares
Number of Board meetings attended during the year
5 (Five) 4 (Four) 5 (Five)
Relationship with other Directors or KMPs
1. Ms. Urvi A. Piramal (Mother)
2. Mr. Nandan A. Piramal (Brother)
1. Ms. Urvi A. Piramal (Mother)
2. Mr. Rajeev A. Piramal (Brother)
-

32 Peninsula Land Limited
Statutory Reports
Route Map to the venue of the MeetingAddress of the Venue
Hall of Culture, Nehru Centre, Dr. Annie Besant Road, Worli, Mumbai – 400 018.
Notice Continued

33Annual Report 2017-18
Built for challenges. Preparing for growth.
Directors’ Report
3. Operations of the Company On a Standalone basis, the Total Revenue for
the Financial Year ended March 31, 2018 stood at `673.36 Crores as against `453.89 Crores for the corresponding Financial Year ended March 31, 2017. The Company incurred a loss before tax of `315.27 Crores for the Financial Year ended March 31, 2018 as against loss of `102.03 Crores for the Financial Year ended March 31, 2017. The loss after tax was `326.90 Crores for the Financial Year ended March 31, 2018 as against loss of `143.16 Crores for the Financial Year ended March 31, 2017.
On a Consolidated basis, the Total Revenue for the Financial Year ended March 31, 2018 was `714.80 Crores as against ̀ 390.38 Crores for the corresponding Financial Year ended March 31, 2017. The Company incurred a loss before tax of `454.36 Crores for the Financial Year ended March 31, 2018 as against a loss of `177.13 Crores for the Financial Year ended March 31, 2017. The loss after tax was `458.18 Crores for the Financial Year ended March 31, 2018 as against loss of `219.65 Crores for the Financial Year ended March 31, 2017.
4. Share Capital The Paid-up Equity Share Capital as on March
31, 2018 was `55.90 Crores. During the Financial Year, the Company has neither issued any shares nor has granted stock options or sweat equity.
5. Debentures During the Financial Year, Non-Convertible
Debentures aggregating to `90.00 Crores were issued on a Private Placement Basis and were listed on BSE Limited. Non-Convertible Debentures aggregating to ̀ 490.43 Crores were redeemed, during the Financial Year 2017-18.
6. Dividend Your Board of Directors does not recommend
any dividend on the Equity Share of the Company for the Financial Year ended March 31, 2018.
7. Particulars of Loans, Guarantees or Investments Details of Loans, Guarantees and Investments
covered under the provisions of Section 186 of the Companies Act, 2013 are given in the
2. Financial Results (` in Crores)
Particulars For the Financial Year ended
March 31, 2018
For the Financial Year ended
March 31, 2017Total Revenue 673.36 453.89Profit/(Loss) before Tax for the year (before exceptional item)
(135.34) (102.03)
Exceptional Items (179.93) -Profit/(Loss) before Tax for the year (315.27) (102.03)Loss after Tax ( Including OCI) (326.90) (143.16)Profit Brought Forward from Previous Year 749.50 943.31Net Profit available for appropriation 422.60 800.15Appropriation :Less:Transfer to Capital Redemption Reserve - -Transfer to Debenture Redemption Reserve (45.87) (70.24)Dividend paid on Equity Shares - (5.58)Distribution Tax Thereon - (1.14)Add:Recoupment of Debenture Redemption Reserve 97.19 26.31Retained Earnings/(Losses) carried forward 473.92 749.50
Dear Shareholders, 1. Your Directors have pleasure in presenting their 146th Annual Report
and the Audited Accounts for the Financial Year ended March 31, 2018 together with the Independent Auditor’s Report thereon.

34 Peninsula Land Limited
Statutory Reports
note no. 8 and note no. 16 to the Standalone Financial Statements, forming part of this Annual Report.
8. State of Company’s Affairs and Business Review The details of the Company’s affairs including its
operations and projects are more specifically given in the Management Discussion and Analysis Report, which forms part of this Annual Report.
9. Corporate Social Responsibility During the Financial Year 2017-18, the Company was not
under any statutory obligation to make any contribution towards the Corporate Social Responsibility activities and hence has not made any contribution in this regard.
As mandated under Section 135 of the Companies Act, 2013, the Composition of Corporate Social Responsibility Committee is given in the Report on Corporate Governance, forming part of this Annual Report. Corporate Social Responsibility Policy of the Company is hosted on the website of the Company www.peninsula.co.in.
10. Business Risk Management The Company is exposed to inherent uncertainties owing to
the sector in which it operates. A key factor in determining a Company’s capacity to create sustainable value is the ability and willingness of the Company to take risks and manage them effectively and efficiently. Many types of risks exist in the Company’s operating environment and emerge on a regular basis due to many factors such as changes in regulatory framework, economic fundamentals etc. In order to evaluate, identify and mitigate these business risks, the Company has a robust Risk Management framework. This framework seeks to create transparency, ensure effective risk mitigation process and thereby minimize adverse impact on the business objectives and enhance the Company’s competitive advantage. The Business risks as identified are reviewed and a detailed action plan to mitigate the identified risks is drawn up and its implementation is monitored. The key risks and mitigation actions are placed before the Audit Committee of the Company.
Further, the Company has constituted a Risk Management Committee (RMC) in accordance with the provisions of the Companies Act, 2013. The details in this regard are more specifically given in the Corporate Governance Report which forms a part of this Annual Report.
11. Internal Control Systems and their Adequacy The Company has an Internal Control System,
commensurate with the size, scale and complexity of its operations. The scope of the Internal Audit as defined in the Internal Audit Charter covers the evolution of
Internal Control System. To maintain its objectivity and independence, the Internal Auditor reports to the Chairperson of the Audit Committee. The Internal Auditor monitors and evaluates the efficacy and adequacy of the internal control system in the Company, its compliance with operating systems, accounting procedures and policies at all locations of the Company. Based on the Report of Internal Auditor, process owners undertake corrective actions in their respective areas and thereby strengthen the controls. Significant audit observations and corrective actions thereon are presented to the Audit Committee.
12. Vigil Mechanism / Whistle Blower Policy The Company has adopted a Whistle Blower Policy for
Directors and employees to report genuine concerns and to provide for adequate safeguards against victimization of persons who may use such mechanism.
The functioning process of this mechanism has been more elaborately mentioned in the Corporate Governance Report annexed to this Annual Report. The said policy is hosted on the website of the Company www.peninsula.co.in.
13. Subsidiary Companies
The Company has 27 (Twenty-Seven) Subsidiaries (including direct and step-down subsidiaries), 3 (Three) Joint Ventures and 3 (Three) Associates as on March 31, 2018.
The Company does not have any material Subsidiaries as on March 31, 2018. A policy on material Subsidiaries has been formulated by the Company and posted on the website of the Company www.peninsula.co.in.
A statement containing the salient features of the Financial Statements of Company’s aforesaid Subsidiaries, Joint Ventures and Associates is annexed in the prescribed Form AOC-1 to this Report as “Annexure–A.”
The Company will provide the Financial Statements of the Subsidiaries / step-down Subsidiaries, Joint Ventures and Associates (collectively referred as “Subsidiaries”) and the related information to any member of the Company who may be interested in obtaining the same. The Financial Statements of the Subsidiaries will also be kept open for inspection at the Registered Office of the Company and that of the respective Subsidiaries. The Consolidated Financial Statements of the Company, forming part of this Annual Report, includes the Financial Statements of its Subsidiaries. The Financial Statements of Subsidiaries are also hosted on the website of the Company www.peninsula.co.in.
14. Directors/ Key Managerial Personnel During the Financial Year, upon the recommendation of
the Nomination and Remuneration Committee, the Board
Directors’ Report Continued

35Annual Report 2017-18
Built for challenges. Preparing for growth.
of Directors appointed Mr. Sajit Suvarna (DIN: 01481316) as an Independent Director of the Company for a term of 5 (five) years with effect from June 5, 2017. The appointment was ratified at the 145th Annual General Meeting held on August 29, 2017. Mr. Suvarna being an independent Director is not liable to retire by rotation.
The Company has complied with the requirement of appointing Key Managerial Personnel as per the provisions of Section 203 of the Companies Act, 2013.
None of the following executive Directors viz. Mr. Rajeev A. Piramal, Mr. Nandan A. Piramal and Mr. Mahesh S. Gupta ("Executive Directors") has received any remuneration from any subsidiaries of the Company.
In accordance with the provisions of Sub-Section (6) of Section 152 of the Companies Act, 2013 and the Articles of Association of the Company, Mr. Nandan A. Piramal (DIN:00045003) is liable to retire by rotation at the ensuing Annual General Meeting and being eligible, offers himself for re-appointment. Your Directors recommend re-appointment of Mr. Nandan A. Piramal.
The term of remuneration of Exective Directors as approved by the members expires on October 25, 2018, approval of the members is hence sought to pay remuneration to the Executive Directors for their remaining tenure. The details are mentioned in the Notice of the Annual General Meeting forming a part of this Annual Report.
All the Independent Directors have furnished declaration in accordance with the provisions of Section 149 (7) of the Companies Act, 2013 regarding meeting the criteria of independence as provided under Section 149 (6).
15. Board Evaluation Regulation 17 and 25 of SEBI (Listing Obligations and
Disclosure Requirements) Regulations, 2015 read with Schedule IV and other applicable provisions of the Companies Act, 2013, mandates a formal evaluation to be done by the Board of its own performance and that of its Committees and individual Directors and that the Independent Directors shall evaluate non-independent Directors and the Chairperson of the Board.
The Company has, on the advice of the Directors, appointed Hrcraft Business Consulting Private Limited (Hrcraft), a professional business consultant specialized in feedback exercises, to carry out the assignment in a fair and transparent manner. The performance evaluation forms were circulated to all the Directors and they have provided their inputs on the same. A Report of the evaluation was then forwarded to the Chairperson and the respective Directors to maintain the confidentiality of the Report.
Based on the inputs provided by Hrcraft, the Independent Directors at their Meeting held on March 19, 2018, evaluated
performance of the Chairperson, non-independent Directors of the Company and the performance of the Board as a whole.
Pursuant to provisions of Section 178 of the Companies Act, 2013, the Nomination and Remuneration Committee at its meeting held on May 23, 2018, has also carried out evaluation of every Director’s performance and the Board has carried out formal annual evaluation of its own performance and that of its Committees and individual Directors. Further, the evaluation of the Independent Directors was carried out by the entire Board, excluding the Director being evaluated.
The Directors were satisfied with the evaluation results, which reflect the overall engagement of the Board and its Committees and on the basis of the Report of the said evaluation, the present term of appointment of Independent Directors shall be continued with the Company.
16. Remuneration Policy The Board has, on the recommendation of the Nomination
and Remuneration Committee, framed a policy for selection and appointment of Directors, Key Managerial Personnel, Senior Management and their remuneration. The details of the policy are more particularly mentioned in the Corporate Governance Report, which forms a part of this Annual Report.
17. Meetings of the Board and its Committees During the Financial Year, the Board met on five occasions,
the Audit Committee met on four occasions, the Nomination and Remuneration Committee met on two occasions and the Corporate Social Responsibility Committee met on two occasions. The gap between two consecutive Board Meetings and Audit Committee Meetings was within the limits prescribed under the Companies Act, 2013 and the SEBI (Listing Obligations and Disclosure Requirements) Regulations, 2015.
The details of the Meetings are more specifically given in the Corporate Governance Report, which forms a part of this Annual Report.
18. Directors’ Responsibility Statement Pursuant to Section 134 (5) of the Companies Act, 2013
(“the Act”), we hereby state that:
i) in the preparation of the annual Accounts, the applicable accounting standards have been followed along with proper explanation relating to material departures, if any;
ii) your Directors have selected such accounting policies and applied them consistently and made judgments and estimates that are reasonable and prudent so as

36 Peninsula Land Limited
Statutory Reports
to give a true and fair view of the state of affairs of the Company as at March 31, 2018 and its loss for the year ended on that date;
iii) your Directors have taken proper and sufficient care for the maintenance of adequate accounting records in accordance with the provisions of the Act for safeguarding the assets of the Company and for preventing and detecting fraud and other irregularities;
iv) your Directors have prepared the Annual Accounts for the year ended March 31, 2018 on a going concern basis;
v) your Directors have laid down internal financial controls which are followed by the Company and that such internal financial controls are adequate and are operating effectively;
vi) your Directors have devised proper systems to ensure compliance with the provisions of all applicable laws and that such systems are adequate and operating effectively.
19. Related Party Transactions The Related Party Transactions that were entered into
during the Financial Year were on an arm’s length basis and in the ordinary course of business. There were no materially significant Related Party Transactions entered into by the Company with Promoters, Directors or Key Managerial Personnel which may have a potential conflict with the interest of the Company at large.
Details of the Related Party Transactions are given in Form AOC-2 which is enclosed as “Annexure-B.”
The Related Party Transactions were placed before the Audit Committee and also the Board for its approval, wherever required. Prior omnibus approval of the Audit Committee was also obtained for the transactions that were of repetitive nature. The transactions entered into pursuant to the omnibus approval of the Audit Committee were placed before the Audit Committee for its review on a quarterly basis. The Company has framed a policy on Related Party Transactions for the purpose of identification and monitoring of such transactions. The details of Related Party Transactions entered into by the Company are more particularly given in the Note No. 40 of the Standalone Financial Statements.
The policy on Related Party Transactions as approved by the Board is hosted on the Company’s website www.peninsula.co.in.
None of the Directors/ KMPs or their relatives has any pecuniary relationships or transactions vis-à-vis the Company, other than their shareholding, if any, in the Company.
20. Deposits Your Company has not accepted or renewed any deposits
under Chapter V of the Companies Act, 2013, during the Financial Year 2017-18.
21. Auditorsa) Statutory Auditors
S R B C & Co. LLP, Chartered Accountants, Mumbai (Firm Registration No. 324982E/E300003) were appointed as the Statutory Auditors of the Company in terms of Section 139 of the Companies Act, 2013 for a period of 5 (five) years commencing from conclusion of 145th Annual General Meeting upto the conclusion of the 150th Annual General Meeting of the Company to be held in the year 2022, subject to the ratification by shareholders of the Company at every Annual General Meeting. However, the Companies (Amendment) Act, 2017, has removed the requirement of the Annual ratification of appointment of Statutory Auditors of the Company by the shareholders. The Board hence recommends ratification of appointment of S R B C & Co. LLP as Statutory Auditors of the Company for the remaining term of 4 (four) years from the Financial Year 2018-19 to 2021-22 at the ensuing Annual General Meeting.
The Auditor’s Report on the Standalone and Consolidated Financial Statement of the Company for the Financial Year 2017-18, does not contain any qualification, reservation or adverse remark.
The Directors of your Company confirm that no instances of frauds or mis-management were reported by the Statutory Auditor under Section 143 (12) of the Companies Act, 2013.
b) Secretarial Auditor
Pursuant to the provisions of Section 204 of the Companies Act, 2013 read with the Companies (Appointment and Remuneration of Managerial Personnel) Rules, 2014 as amended from time to time, the Company has appointed M/s. Dhrumil M. Shah & Co., Company Secretary in Practice, to undertake the Secretarial Audit of the Company. The report on the Secretarial Audit is annexed as “Annexure-C.”
22. Corporate Governance Report and Management Discussion & Analysis Report The Corporate Governance Report together with the
Certificate on Corporate Governance issued by Mr. Nilesh G. Shah, Practicing Company Secretary (FCS: 4554), confirming compliance with the conditions of Corporate Governance as stipulated under Regulation 34 of the SEBI (Listing Obligations and Disclosure Requirements) Regulations, 2015 and the Management Discussion &
Directors’ Report Continued

37Annual Report 2017-18
Built for challenges. Preparing for growth.
Analysis Report given in this Annual Report form an integral part of this Report.
23. Extract of Annual Return The details forming part of the extract of the Annual Return
in form MGT - 9 is annexed herewith as “Annexure-D” to this Report.
24. Particulars of Employees The information required pursuant to Section 197 (12) of
the Companies Act, 2013 read with Rule 5 of the Companies (Appointment and Remuneration of Managerial Personnel) Rules, 2014 in respect of employees of the Company will be provided on request. In terms of Section 136 of the Act, the Reports and accounts are being sent to the members and others entitled thereto, excluding the information on employees’ particulars mentioned in Section 197 (12) of the Companies Act, 2013 and Rule 5 of the Companies (Appointment and Remuneration of Managerial Personnel) Rules, 2014, which is available for inspection by the members at the Registered Office of the Company during business hours on working days of the Company up to the date of the Annual General Meeting. If any member is interested in inspecting the same, such member may write to the Company Secretary in advance.
25. Conservation of Energy and Technology Absorption In view of the nature of activities which are being carried
on by the Company, provisions regarding Conservation of Energy and Technology Absorption read with Section 134 (3) (m) of the Companies Act, 2013 and Rule 8 (3) of the Companies (Accounts) Rules, 2014 are not applicable.
26. Foreign Exchange earnings and outgo During the Financial Year 2017-18, expenditure in foreign
currencies in terms of actual outflow amounted to `1,09,81,273/- on account of professional and consultancy fees, travelling and raw materials. The Company has not earned any foreign exchange during the Financial Year 2017-18.
27. Significant and Material Orders There were no significant and material orders passed by
any Regulators or Courts or Tribunals during the Financial Year ended March 31, 2018 impacting the going concern status and Company’s operations in future.
28. Prevention of Sexual Harassment of Women at Workplace The Company has adopted an Anti-Sexual Harassment
Policy in line with the requirements of The Sexual
Harassment of Women at Workplace (Prevention, Prohibition and Redressal) Act, 2013. The Company has constituted an Internal Complaints Committee (ICC) to redress the complaints received regarding sexual harassment. During the year under review, no complaints were received by the Committee for Redressal.
29. Prevention of Insider Trading Your Company has adopted a Code of Conduct for
prevention of Insider Trading and Code of Fair Disclosure of Unpublished Price Sensitive Information to ensure prevention of Insider Trading in the Organisation.
30. Change in the Nature of Business (if any) There is no material change in the type of business the
Company is carrying.
31. Material Changes and commitments occurred between the end of the Financial Year and the date of the report There were no reportable material changes or
commitment, occurred between the end of the Financial Year and the date of this report, which may have any effect on the financial position of the Company.
32. Secretarial Standards The Company has complied with the applicable Secretarial
Standards during the Financial Year 2017-18.
33. Acknowledgement The Directors express their deep gratitude and thank
the Central and State Governments as well as their respective Departments and Development Authorities connected with the business of the Company, contractors and consultants and also Banks, Financial Institutions, Debenture Trustees, Shareholders, Debenture-Holders and Employees of the Company for their continued support and encouragement.
By Order of the BoardFor Peninsula Land Limited
Sd/-Urvi A. Piramal
Non-Executive Chairperson
Place: MumbaiDate: May 23, 2018

38 Peninsula Land Limited
Statutory Reports
Directors’ Report ContinuedA
NN
EXU
RE
– A
FOR
M N
O. A
OC
- 1
Stat
emen
t con
tain
ing
salie
nt fe
atur
es o
f the
fina
ncia
l sta
tem
ent o
f sub
sidi
arie
s/as
soci
ate
com
pani
es/j
oint
ven
ture
s(P
ursu
ant t
o fir
st p
rovi
so to
sub
-sec
tion
(3) o
f sec
tion
129
read
with
rul
e 5
of C
ompa
nies
(Acc
ount
s) R
ules
, 201
4)
Part
A -
Sub
sidi
arie
s
( `
in C
rore
s)Sr
. N
o.N
ame
of th
e su
b-si
diar
ySh
are
capi
tal /
Co
ntri
-bu
tion
Re-
serv
es &
su
rplu
s
Tota
l as
sets
Tota
l Lia
bili-
ties
(Exc
lud-
ing
Shar
e ca
pita
l and
R
eser
ves
&
Surp
lus)
Inve
st-
men
tsTu
rn-
over
(In-
clud
es
Oth
er
Inco
me)
Profi
t be
fore
ta
xatio
n
Prov
i-si
on fo
r ta
xatio
n
Oth
er
Com
pre-
hens
ive
Inco
me
Net
of
Tax
Profi
t af
ter
taxa
tion
Pro-
pose
d D
ivid
end
% o
f Sh
are
hold
ing
Rem
arks
1Ar
gent
o R
eal E
stat
e LL
P#
-
-
-
-
-
-
-
-
-
-
-
99%
Subs
idia
ry o
f PH
IPL
2Ea
stga
te R
eal E
stat
e D
evel
oper
s LL
P@
0.0
1 (0
.01)
0.0
1 0
.01
-
-
(0.0
0) -
-
(0
.00)
-
99%
Subs
idia
ry o
f PH
IPL
3G
oodt
ime
Rea
l Es
tate
Dev
elop
men
t Pr
ivat
e Li
mite
d
3.5
1 1
38.2
1 1
,297
.49
1,1
55.7
6 -
0
.17
(19.
34)
0.0
3 (0
.13)
(19.
44)
-
57.2
6%Su
bsid
iary
4G
oren
a R
eal e
stat
e LL
P#
-
-
-
-
-
-
-
-
-
-
-
99%
Subs
idia
ry o
f PH
IPL
5In
ox M
erca
ntile
Co
mpa
ny P
riva
te
Lim
ited
0.0
1 (1
1.09
) 7
7.08
8
8.16
-
-
(1
2.04
) (3
.71)
(8.3
3) -
10
0%Su
bsid
iary
of
PHIP
L
6M
axis
Rea
l est
ate
LLP
# -
-
-
-
-
-
-
-
-
-
-
99
%Su
bsid
iary
of
PHIP
L7
Mid
land
Tow
nshi
p Pr
ivat
e Li
mite
d 0
.01
(0.0
1) 0
.00
0.0
0 -
-
(0
.00)
-
-
(0.0
0) -
10
0%Su
bsid
iary
of
PLL
8N
ebus
tar
Rea
l es
tate
LLP
# -
-
-
-
-
-
-
-
-
-
-
99
%Su
bsid
iary
of
PHIP
L9
Pavu
rott
i Rea
l Est
ate
Priv
ate
Lim
ited
0.1
0 (0
.22)
81.
01
81.
13
-
-
(0.0
3) -
-
(0
.03)
-
56.0
0%Su
bsid
iary
10Pe
nins
ula
Cros
sroa
ds P
riva
te
Lim
ited
18.
00
19.
45
42.
96
5.5
2 -
4
.77
2.4
1 0
.48
-
1.9
3 -
10
0.00
%Su
bsid
iary
11Pe
nins
ula
Faci
lity
Man
agem
ent
Serv
ices
Lim
ited
1.0
0 8
.39
4.4
7 3
.00
7.9
3 0
.87
(1.3
9) (0
.44)
-
(0.9
5) -
10
0%Su
bsid
iary
of
PHIP
L
12Pe
nins
ula
Hol
ding
s an
d In
vest
men
ts
Priv
ate
Lim
ited
-PH
IPL
0.0
1 3
3.55
6
2.35
3
16.9
4 2
88.1
4 3
.05
(89.
21)
(24.
91)
-
(64.
30)
-
100.
00%
Subs
idia
ry
13Pe
nins
ula
Inte
grat
ed
Land
Dev
elop
ers
Priv
ate
Lim
ited
@ 0
.50
(0.0
4) 0
.46
0.0
1 -
-
(0
.00)
-
-
(0.0
0) -
10
0%Su
bsid
iary
of
PHIP
L
14 P
enin
sula
In
vest
men
t M
anag
emen
t Co
mpa
ny L
imite
d
-PIM
CL
10.
00
2.1
3 9
.46
14.
50
17.
17
0.1
1 (1
.16)
-
-
(1.1
6) -
75
.01%
Subs
idia
ry o
f PH
IPL
15Pe
nins
ula
Meg
a-Ci
ty
Dev
elop
men
t Pri
vate
Li
mite
d
@ 0
.01
(0.4
2) 0
.01
0.4
2 -
-
(0
.06)
(0.0
2) (0
.04)
-
100%
Subs
idia
ry o
f PH
IPL
16Pe
nins
ula
Meg
a Pr
oper
ties
Priv
ate
Lim
ited
@ 0
.01
(0.0
3) -
0
.02
-
-
(0.0
0) (0
.00)
(0.0
0) -
10
0%Su
bsid
iary

39Annual Report 2017-18
Built for challenges. Preparing for growth.
( ` in
Cro
res)
Sr.
No.
Nam
e of
the
sub-
sidi
ary
Shar
e ca
pita
l /
Cont
ri-
butio
n
Re-
serv
es &
su
rplu
s
Tota
l as
sets
Tota
l Lia
bili-
ties
(Exc
lud-
ing
Shar
e ca
pita
l and
R
eser
ves
&
Surp
lus)
Inve
st-
men
tsTu
rn-
over
(In-
clud
es
Oth
er
Inco
me)
Profi
t be
fore
ta
xatio
n
Prov
i-si
on fo
r ta
xatio
n
Oth
er
Com
pre-
hens
ive
Inco
me
Net
of
Tax
Profi
t af
ter
taxa
tion
Pro-
pose
d D
ivid
end
% o
f Sh
are
hold
ing
Rem
arks
17Pe
nins
ula
Meg
a To
wns
hip
Dev
elop
ers
Lim
ited
0.0
5 0
.04
0.1
2 0
.02
-
(0.0
8) (0
.01)
(0.0
7) -
10
0%Su
bsid
iary
18Pe
nins
ula
Phar
ma
Res
earc
h Ce
ntre
Pr
ivat
e Li
mite
d
0.0
1 (5
.07)
30.
94
36.
00
-
-
(4.9
0) (1
.51)
-
(3.3
9) -
10
0%Su
bsid
iary
of
PHIP
L
19Pe
nins
ula
Trus
tee
Lim
ited
0.1
0 0
.11
0.2
3 0
.02
0.0
2 0
.01
0.0
1 -
70
.00%
Subs
idia
ry o
f PH
IPL
20Pl
anet
view
M
erca
ntile
Com
pany
Pr
ivat
e Li
mite
d
0.0
1 (4
.09)
24.
41
28.
49
-
(3.8
9) (1
.20)
(2.6
9) -
10
0%Su
bsid
iary
of
PHIP
L
21R
egen
a R
eal e
stat
e LL
P#
-
-
-
-
-
-
-
-
-
-
99%
Subs
idia
ry o
f PH
IPL
22R
R R
eal E
stat
e D
evel
opm
ent
Priv
ate
Lim
ited
0.0
1 (1
3.23
) 2
4.65
3
7.87
-
0
.02
(6.2
2) (1
.53)
(4.7
0) -
10
0%Su
bsid
iary
of
PHIP
L
23Sk
etch
Rea
l Est
ate
Priv
ate
Lim
ited
@ 0
.01
(0.0
9) 0
.06
0.1
4 -
(0
.08)
-
-
(0.0
8) -
10
0%Su
bsid
iary
of
PHIP
L24
Take
now
Pro
pert
y D
evel
oper
s Pr
ivat
e Li
mite
d
0.0
1 (2
.47)
0.7
0 3
.16
-
-
(0.4
5) (0
.13)
(0.3
2) -
10
0%Su
bsid
iary
of
PHIP
L
25To
pval
ue R
eal E
stat
e D
evel
opm
ent L
td *
0.1
0 (4
1.89
) 3
0.14
7
1.93
1
77.6
1 (1
04.9
7) (1
9.24
) (8
5.73
) -
10
0%Su
bsid
iary
of
PHIP
L26
Wes
tgat
e R
eal e
stat
e D
evel
oper
s LL
P 4
3.13
(0
.10)
43.
09
0.0
6 (0
.02)
(0.0
2) -
84
.99%
Subs
idia
ry o
f PH
IPL
Acqu
ired
Con
trol
w
.e.f
31.0
3.20
1827
Goo
dhom
e R
ealty
Li
mite
d
* 0
.10
18.
87
305
.54
286
.57
54.3
8%Su
bsid
iary
28R
ockfi
rst R
eal E
stat
e Li
mite
d *
0.1
0 (1
41.4
1) 8
0.03
2
21.3
4 54
.38%
Subs
idia
ry
29R
R M
ega
City
B
uild
ers
Lim
ited
* 0
.10
15.
84
152
.90
136
.96
54.3
8%Su
bsid
iary
30Tr
uew
in R
ealty
Li
mite
d *
0.1
0 (4
8.36
) 9
9.04
1
47.3
0 54
.38%
Subs
idia
ry
Not
e:
1 #
Cap
ital C
ontr
ibut
ion
to L
LPs
wri
tten
-off
dur
ing
the
year
as
ther
e w
ere
no o
pera
tions
/ a
ctiv
ity in
the
LLP
s an
d ap
plic
atio
n fo
r di
ssou
tion
of L
LP fi
led
with
MC
A on
11.
12.2
017
2 @
- In
dica
tes
entit
y is
yet
to c
omm
ence
ope
ratio
ns
3 *
Con
trol
in th
ese
entit
ies
(whi
ch w
ere
earl
ier
asso
ciat
es)
wer
e ac
quir
ed o
n 3
1.03
.201
8 fr
om w
hich
dat
e th
ese
are
cons
olid
ated
as
subs
idia
ries
.
Fo
r an
d on
beh
alf o
f the
Boa
rd o
f Dir
ecto
rs o
f Pen
insu
la L
and
Lim
ited
Sd
/-
Sd/-
Sd
/-
Sd/-
Urv
i A. P
iram
al
Raj
eev
A. P
iram
al
Mah
esh
S. G
upta
N
anda
n A.
Pir
amal
N
on E
xecu
tive
Chai
rper
son
Exec
utiv
e Vi
ce-C
hair
man
&
Gro
up M
anag
ing
Dir
ecto
r W
hole
-Tim
e D
irec
tor
D
IN 0
0044
954
Man
agin
g D
irec
tor
DIN
000
4681
0 D
IN 0
0045
003
DIN
000
4498
3
Sd
/-
Sd/-
Sd
/-
B
havn
a D
oshi
B
hara
t San
ghav
i R
ajas
hekh
ar R
eddy
Pl
ace
: Mum
bai
Dir
ecto
r Ch
ief F
inan
cial
Offi
cer
Com
pany
Sec
reta
ryD
ate:
May
23,
201
8 D
IN 0
0400
508

40 Peninsula Land Limited
Statutory ReportsSt
atem
ent c
onta
inin
g sa
lient
feat
ures
of t
he fi
nanc
ial s
tate
men
t of s
ubsi
diar
ies/
asso
ciat
e co
mpa
nies
/joi
nt v
entu
res
(Pur
suan
t to
first
pro
viso
to s
ub-s
ectio
n (3
) of s
ectio
n 12
9 re
ad w
ith r
ule
5 of
Com
pani
es (A
ccou
nts)
Rul
es, 2
014)
St
atem
ent p
ursu
ant t
o Se
ctio
n 12
9 (3
) of t
he C
ompa
nies
Act
, 201
3 re
late
d to
Ass
ocia
te C
ompa
nies
and
Joi
nt V
entu
res
Part
B: A
ssoc
iate
s an
d Jo
int V
entu
res
( ` in
Cro
res)
Sr.
No.
Nam
e of
Ass
ocia
tes/
Join
t Ve
ntur
esSh
ares
of A
ssoc
iate
/Joi
nt V
entu
res
held
by
the
com
pany
on
the
year
end
Profi
t / L
oss
for
the
year
Rem
arks
Late
st
audi
ted
bala
nce
shee
t
No.
of
Shar
esAm
ount
of
Inve
stm
ent
in A
ssoc
i-at
es /
Join
t Ve
ntur
e
Exte
nt o
f H
oldi
ng %
Des
crip
tion
of h
ow th
ere
is s
igni
fican
t in
fluen
ce
Rea
son
why
th
e as
so-
ciat
e /j
oint
ve
ntur
e is
no
t con
soli-
date
d
Net
wor
th a
t-tr
ibut
able
to
Shar
ehol
ding
as
per
late
st
audi
ted
Bal
-an
ce S
heet
Cons
ider
ed
in C
onso
li-da
tion
Not
Con
-si
dere
d in
Co
nsol
ida-
tion
1B
ridg
evie
w R
eal E
stat
e D
evel
opm
ent
LLP
-Ref
er
Not
e 1
31-M
ar-1
8 -
50
.00%
Shar
e in
Pro
fit
/ (Lo
ss)
Ref
er
Not
e 1
(10.
48)
-
(6.4
0)Jo
int V
entu
re
Entit
y
2G
oodh
ome
Rea
lty L
imite
d
-Ref
er N
ote
1 &
431
-Mar
-18
14,
000
0.0
1 14
.00%
Shar
ehol
ding
18.
97
-
(12.
79)
Asso
ciat
es
-till
31
.03.
2018
3H
em In
fras
truc
ture
and
pr
oper
ty d
evel
oper
s Pr
ivat
e Li
mite
d
31-M
ar-1
855
8,17
1 7
6.22
57
.44%
Shar
ehol
ding
54.
13
5.1
5 -
Jo
int V
entu
re
Entit
y
4JM
Rea
lty M
anag
emen
t Pr
ivat
e Li
mite
d- R
efer
N
ote
3
31-M
ar-1
8 5
,000
0
.01
50.0
0%Sh
areh
oldi
ng (0
.65)
(0.6
8)As
soci
ates
5Pe
nins
ula
Bro
okfie
ld
Trus
tees
Pri
vate
Lim
ited
31-M
ar-1
8 1
0,00
0 0
.01
50.0
0%Sh
areh
oldi
ng 0
.05
0.0
1 Jo
int V
entu
re
of P
HIP
L6
PenB
rook
Cap
ital A
dvis
ors
Priv
ate
Lim
ited
(form
erly
kn
own
as P
enin
sula
B
rook
field
Inve
stm
ent
Man
ager
s P
riva
te L
imite
d)
(PB
CAPL
)- R
efer
Not
e 2
31-M
ar-1
8 1
4,90
0 0
.01
37.2
6%Sh
areh
oldi
ng 6
.06
0.4
9 Jo
int V
entu
re
of P
IMCL
7Se
w E
ngin
eeri
ng (I
ndia
) pr
ivat
e Li
mite
d- R
efer
N
ote
3
31-M
ar-1
898
9,30
0 6
.54
26.0
0%Sh
areh
oldi
ngAs
soci
ates
8R
ockfi
rst R
eal E
stat
e Li
mite
d -R
efer
Not
e 1
& 4
31-M
ar-1
814
.00%
Shar
ehol
ding
Ref
er N
ote
1 &
4 1
41.3
1 -
(1
7.92
)As
soci
ates
-t
ill
31.0
3.20
189
RA
Rea
lty V
entu
res
LLP
-Ref
er N
ote
131
-Mar
-18
-
40.0
0%Sh
are
in P
rofit
/ (
Loss
)R
efer
Not
e 1
&4
(24.
48)
(2.5
1)As
soci
ates
En
tity
10R
R M
ega
City
Bui
lder
s Li
mite
d -R
efer
Not
e 1
& 4
31-M
ar-1
814
.00%
Shar
e in
Pro
fit
/ (Lo
ss)
Ref
er N
ote
1 &
4 1
5.94
0
.35
Asso
ciat
es
-till
31
.03.
2018
Directors’ Report Continued

41Annual Report 2017-18
Built for challenges. Preparing for growth.
( ` in
Cro
res)
Sr.
No.
Nam
e of
Ass
ocia
tes/
Join
t Ve
ntur
esSh
ares
of A
ssoc
iate
/Joi
nt V
entu
res
held
by
the
com
pany
on
the
year
end
Profi
t / L
oss
for
the
year
Rem
arks
Late
st
audi
ted
bala
nce
shee
t
No.
of
Shar
esAm
ount
of
Inve
stm
ent
in A
ssoc
i-at
es /
Join
t Ve
ntur
e
Exte
nt o
f H
oldi
ng %
Des
crip
tion
of h
ow th
ere
is s
igni
fican
t in
fluen
ce
Rea
son
why
th
e as
so-
ciat
e /j
oint
ve
ntur
e is
no
t con
soli-
date
d
Net
wor
th a
t-tr
ibut
able
to
Shar
ehol
ding
as
per
late
st
audi
ted
Bal
-an
ce S
heet
Cons
ider
ed
in C
onso
li-da
tion
Not
Con
-si
dere
d in
Co
nsol
ida-
tion
11Tr
uew
in R
ealty
Lim
ited
-Ref
er N
ote
1 &
431
-Mar
-18
14.0
0%Sh
are
in P
rofit
/ (
Loss
)R
efer
Not
e 1
&4
(6.7
9)As
soci
ates
-t
ill
31.0
3.20
1812
Penb
rook
Inve
stm
ent
Man
ager
LLP
(PIM
LLP)
31
-Mar
-18
37.2
5%Sh
are
in P
rofit
/ (
Loss
) (0
.01)
Subs
idia
ry o
f PB
IMPL
As p
er In
dian
Ac
coun
ting
Stan
dard
(IN
D A
S)
28, t
he
prop
ortio
nate
sha
re o
f pr
ofit
or lo
ss o
f As
soci
ates
and
Joi
nt V
entu
res
is c
onsi
dere
d un
der
Equi
ty
met
hod,
and
whe
re th
e N
et in
vest
men
t in
the
Asso
ciat
es o
r Jo
int v
entu
res
is n
egat
ive,
the
n th
e sh
are
of L
oss
in th
e Co
nsol
idat
ed r
esul
ts o
f the
com
pany
is
con
side
red
as Z
ero.
PenB
rook
Cap
ital A
dvis
ors
Priv
ate
Lim
ited
is a
Joi
nt V
entu
re o
f a S
tep
dow
n Su
bsid
iary
, whe
re th
e co
mpa
ny h
as a
n eq
uity
sta
ke o
f 75
.01%
and
thus
the
effe
ctiv
e sh
are
of th
e pr
ofit o
r Lo
ss a
nd N
et w
orth
in th
is J
V is
con
side
red
at 3
7.26
%.
No
Asso
ciat
e or
JV
have
bee
n liq
uida
ted
or s
old
duri
ng th
e ye
ar. H
owev
er, S
ew E
ngin
eeri
ng (I
ndia
) Pv
t Ltd
& J
M R
ealty
Man
agem
ent P
vt L
td a
re b
eing
hel
d as
inv
estm
ents
for
sale
as
on 3
1.03
.201
8 an
d he
nce
not c
onso
lidat
ed.
Cont
rol i
n th
ese
asso
ciat
e en
titie
s w
ere
acqu
ired
on
31.
03.2
018
from
whi
ch d
ate
thes
e ar
e co
nsol
idat
ed a
s su
bsid
iari
es.
Fo
r an
d on
beh
alf o
f the
Boa
rd o
f Dir
ecto
rs o
f Pen
insu
la L
and
Lim
ited
Sd
/-
Sd/-
Sd
/-
Sd/-
Urv
i A. P
iram
al
Raj
eev
A. P
iram
al
Mah
esh
S. G
upta
N
anda
n A.
Pir
amal
N
on E
xecu
tive
Chai
rper
son
Exec
utiv
e Vi
ce-C
hair
man
&
Gro
up M
anag
ing
Dir
ecto
r W
hole
-Tim
e D
irec
tor
D
IN 0
0044
954
Man
agin
g D
irec
tor
DIN
000
4681
0 D
IN 0
0045
003
DIN
000
4498
3
Sd
/-
Sd/-
Sd
/-
B
havn
a D
oshi
B
hara
t San
ghav
i R
ajas
hekh
ar R
eddy
Pl
ace
: Mum
bai
Dir
ecto
r Ch
ief F
inan
cial
Offi
cer
Com
pany
Sec
reta
ryD
ate:
May
23,
201
8 D
IN 0
0400
508

42 Peninsula Land Limited
Statutory Reports
ANNEXURE – BFORM NO. AOC-2
(Pursuant to clause (h) of sub-section (3) of section 134 of the Companies Act, 2013 and Rule 8 (2) of the Companies (Accounts) Rules, 2014)
Form for disclosure of particulars of contracts/arrangements entered into by the company with related parties referred to in sub-section (1) of section 188 of the Companies Act, 2013 including certain arm’s length transactions under third proviso thereto
1. Details of contracts or arrangements or transactions not at arm’s length basis:
(a) Name(s) of the related party and nature of relationship
(b) Nature of contracts/ arrangements/ transactions
(c) Duration of the contracts/ arrangements/ transactions
(d) Salient terms of the contracts or arrangements or transactions including the value, if any
(e) Justification for entering into such contracts or arrangements or transactions NOT APPLICABLE
(f) Date(s) of approval by the Board
(g) Amount paid as advances, if any
(h) Date on which the special resolution was passed in general meeting as required under first proviso to section 188
2. Details of material contracts or arrangement or transactions at arm’s length basis:
(a) Name(s) of the related party and nature of relationship
(b) Nature of contracts/ arrangements/ transactions
(c) Duration of the contracts/ arrangements/ transactions NOT APPLICABLE
(d) Salient terms of the contracts or arrangements or transactions including the value, if any
(e) Date(s) of approval by the Board, if any
(f) Amount paid as advances, if any
By Order of the Board For Peninsula Land Limited
Sd/-Urvi A. Piramal
Non - Executive ChairpersonPlace: MumbaiDate: May 23, 2018
Directors’ Report Continued

43Annual Report 2017-18
Built for challenges. Preparing for growth.
ANNEXURE – C
FORM NO MR-3
SECRETARIAL AUDIT REPORTFOR THE FINANCIAL YEAR ENDED MARCH 31, 2018
[Pursuant to Section 204(1) of the Companies Act, 2013 and rule 9 of the Companies (Appointment and Remuneration of Managerial Personnel) Rules, 2014]
To,The Members,PENINSULA LAND LIMITED
I have conducted the Secretarial Audit of the compliance of applicable statutory provisions and the adherence to good corporate practices by PENINSULA LAND LIMITED (hereinafter called “the Company”). Secretarial Audit was conducted in a manner that provided me a reasonable basis for evaluating the corporate conducts/statutory compliances and expressing my opinion thereon.
Based on my verification of the company’s books, papers, minute books, forms and returns filed and other records maintained by the company and also the information provided by the Company, its officers, agents and authorized representatives during the conduct of Secretarial Audit, I hereby report that in my opinion, the company has, during the Financial Year ended on March 31, 2018 complied with the statutory provisions listed hereunder and also that the Company has proper Board-processes and compliance-mechanism in place to the extent, in the manner and subject to the reporting made hereinafter:
I have examined the books, papers, minute books, forms and returns filed and other records maintained by the Company for the Financial Year ended March 31, 2018 according to the provisions of:
i. The Companies Act, 2013 (the Act) and the rules made thereunder;
ii. The Securities Contracts (Regulation) Act, 1956 (‘SCRA’) and the rules made thereunder;
iii. The Depositories Act, 1996 and the Regulations and Bye-laws framed thereunder;
iv. Foreign Exchange Management Act, 1999 (“FEMA”) and the rules and regulations made thereunder to the extent of Foreign Direct Investment and Overseas Direct Investment and External Commercial Borrowings.
v. The following Regulations and Guidelines prescribed under the Securities and Exchange Board of India Act, 1992 (‘SEBI Act’):-
a. The Securities and Exchange Board of India (Substantial Acquisition of Shares and Takeovers) Regulations, 2011;
b. The Securities and Exchange Board of India (Prohibition of Insider Trading) Regulations, 2015.
c. The Securities and Exchange Board of India (Issue of Capital and Disclosure Requirements) Regulations, 2009: - Not applicable to the company for the Financial Year ended March 31, 2018.
d. Securities and Exchange Board of India (Share Based Employee Benefits) Regulations, 2014: - Not applicable to the company for the Financial Year ended March 31, 2018.
e. The Securities and Exchange Board of India (Issue and Listing of Debt Securities) Regulations, 2008;
f. The Securities and Exchange Board of India (Registrars to an Issue and Share Transfer Agents) Regulations, 1993 regarding the Companies Act and dealing with client: - Not applicable to the company for the Financial Year ended March 31, 2018.
g. The Securities and Exchange Board of India (Delisting of Equity Shares) Regulations, 2009: - Not applicable to the company for the Financial Year ended March 31, 2018;
h. The Securities and Exchange Board of India (Buyback of Securities) Regulations, 1998:- Not applicable to the company for the Financial Year ended March 31, 2018; and
i. The Securities and Exchange Board of India (Listing Obligations and Disclosure Requirements) Regulations, 2015.
vi. Other applicable laws to the Company.
I have also examined compliance with the applicable clauses of the Secretarial Standards issued by The Institute of Company Secretaries of India (ICSI).
During the period under review the Company has complied with the provisions of the Act, Rules, Regulations, Guidelines, Standards, etc. as mentioned above.
I further report that the Board of Directors of the Company is duly constituted with proper balance of Executive, Non-Executive, Independent Directors and Woman Directors. The changes in the composition of the Board of Directors that took place during the period under review were carried out in compliance with the provisions of the Act.
Adequate notice is given to all Directors to schedule Board and Committee Meetings, agenda and detailed notes on agenda were sent seven days in advance and a system

44 Peninsula Land Limited
Statutory Reports
Directors’ Report Continued
exists for seeking and obtaining further information and clarifications on the agenda items before the meeting and for meaningful participation at the meeting.
All the decisions have been taken unanimously and no dissent recorded in Board Meetings.
I further report that there are adequate systems and processes in the company commensurate with the size and operations of the company to monitor and ensure compliance with applicable laws, rules, regulations and guidelines.
I further report that during the period the company had issued Non-Convertible Debentures aggregating to Rs. 90 Crores by way of private placement basis.
I further report that during the period the company had redeemed, Non-Convertible Debentures aggregating to Rs. 490.43 Crores.
For Dhrumil M Shah & Co.
Sd/-Place: Mumbai Dhrumil M ShahDate: May 23, 2018 Practicing Company Secretary
CP 8978; FCS 8021
This Report is to be read with my letter of even date which is annexed as Annexure - I and forms an integral part of this report.
Annexure I
(to the Secretarial Audit Report)
To,The Members,PENINSULA LAND LIMITED
My report of even date is to be read along with this letter:
1) Maintenance of Secretarial record is the responsibility of the Management of the Company. My responsibility is to express an opinion on these Secretarial Records based on my audit.
2) I have followed the audit practices and processes as were appropriate to obtain reasonable assurance about the correctness of the contents of the Secretarial records. The verification was done on test basis to ensure that correct facts are reflected in the Secretarial records. I believe that the processes and practices, I followed provide a reasonable basis for my opinion.
3) I have not verified the correctness and appropriateness of financial records and Books of Accounts of the Company.
4) Wherever required, I have obtained the Management Representation about the compliance of Laws, Rules and Regulations and happening of events etc.
5) The compliance of the provisions of Corporate and other applicable Laws, Rules, Regulations, Standards is the responsibility of the Management. My examination was limited to the verification of procedures on test basis.
6) The Secretarial Audit report is neither an assurance as to the future viability of the Company nor the efficiency or effectiveness with which the Management has conducted the affairs of the Company.
For Dhrumil M Shah & Co.
Sd/-Place: Mumbai Dhrumil M ShahDate: May 23, 2018 Practicing Company Secretary CP 8978; FCS 8021

45Annual Report 2017-18
Built for challenges. Preparing for growth.
ANNEXURE – D FORM NO. MGT-9
Extract of Annual Return As on the Financial Year ended on March 31, 2018
[Pursuant to section 92(3) of the Companies Act, 2013 and rule 12(1) of the Companies (Management and Administration) Rules, 2014]
I. REGISTRATION AND OTHER DETAILS: 1 CIN L17120MH1871PLC000005
2 Registration Date August 10, 1871
3 Name of the Company Peninsula Land Limited
4 Category/Sub-Category of the Company Public Limited Company
5 Address of the Registered office and Contact details Peninsula Spenta, Mathuradas Mills Compound, Senapati Bapat Marg, Lower Parel, Mumbai - 400 013, Maharashtra. Contact No. 022 - 66229300 E-mail: [email protected].
6 Whether listed Company (Yes/No) Yes
7 Name, Address and Contact details of Registrar and Transfer Agent, if any
Freedom Registry Limited, Plot No. 101/102, 19th Street, MIDC Area, Satpur, Nashik - 422 007 Tel No: 0253-2354032 Fax No. 0253-2351126 Email: [email protected]
II. PRINCIPAL BUSINESS ACTIVITIES OF THE COMPANY: All the business activities contributing 10% or more of the total turnover of the company shall be stated
Sr. No. Name and Description of Main Product / Services NIC Code of the Product % to total turnover of the Company
1 Construction (Real Estate) 4100 100%
III. PARTICULARS OF HOLDING, SUBSIDIARY AND ASSOCIATE COMPANIES: Sr. No.
Name and Address of Company CIN/GIN Holding/ Subsidiary /Associate
% of shares held
Applicable Section
1 Peninsula Holdings and Investments Pvt. Ltd.# U67190MH2008PTC179576 Subsidiary 100.00% 2(87)2 Peninsula Mega Properties Pvt. Ltd.# U70100MH2006PTC159538 Subsidiary 100.00% 2(87)3 Peninsula Crossroads Pvt. Ltd.# U51900MH2000PTC126692 Subsidiary 100.00% 2(87)4 Peninsula Mega Township Developers Ltd.# U70200MH2007PLC167082 Subsidiary 100.00% 2(87)5 Goodtime Real Estate Development Pvt. Ltd.# U70102MH2008PTC184961 Subsidiary 57.26% 2(87)6 Pavurotti Real Estate Pvt. Ltd.# U70100MH1995PTC084292 Subsidiary 56.00% 2(87)7 Midland Township Pvt. Ltd. # U51909MH2011PTC218102 Subsidiary 100.00% 2(87)8 *Inox Mercantile Company Pvt. Ltd.# U51900MH2006PTC160212 Subsidiary 100.00% 2(87)9 *Peninsula Facility Management Services Ltd.# U55101MH1999PLC118542 Subsidiary 100.00% 2(87)10 *Peninsula Investment Management Company Ltd.# U67110MH2005PLC158070 Subsidiary 75.01% 2(87)11 *Peninsula Pharma Research Centre Pvt. Ltd.
Peninsula Centre, H. No. 850, Porvorim-Bardez, Goa North Goa, 403521.
U00304GA2006PTC004532 Subsidiary 100.00% 2(87)
12 *Peninsula Trustee Ltd.# U65991MH2005PLC158045 Subsidiary 70.00% 2(87)13 *Planetview Mercantile Company Pvt. Ltd. # U51109MH2006PTC161379 Subsidiary 100.00% 2(87)
14 *RR Real Estate Development Pvt. Ltd.# U45400MH2007PTC171261 Subsidiary 100.00% 2(87)15 *Takenow Property Developers Pvt. Ltd.# U70102MH2008PTC179575 Subsidiary 100.00% 2(87)

46 Peninsula Land Limited
Statutory Reports
Sr. No.
Name and Address of Company CIN/GIN Holding/ Subsidiary /Associate
% of shares held
Applicable Section
16 *Peninsula Integrated Land Developers Pvt. Ltd. # U70109MH2007PTC167090 Subsidiary 100.00% 2(87)17 *Peninsula Mega-City Development Pvt. Ltd. # U70100MH2006PTC159676 Subsidiary 100.00% 2(87)18 *HEM Infrastructure and Property Developers Pvt. Ltd.# U45200MH2006PTC160048 Subsidiary 57.43% 2(87)19 *Sketch Real Estate Pvt. Ltd.# U70100MH2011PTC218090 Subsidiary 100.00% 2(87)20 *Topvalue Real Estate Development Limited# U70200MH2008PLC185165 Subsidiary 100.00% 2(87)21 Argento Real Estate LLP # AAA-3308 Subsidiary 99.00% 2(87)22 Eastgate Real Estate Developers LLP # AAA-2751 Subsidiary 99.00% 2(87)23 Gorena Real Estate LLP # AAA-3346 Subsidiary 99.00% 2(87)24 Maxis Real Estate LLP # AAA-3339 Subsidiary 99.00% 2(87)25 Nebustar Real Estate LLP # AAA-3309 Subsidiary 99.00% 2(87)26 Westgate Real Estate Developers LLP # AAA-2166 Subsidiary 84.99% 2(87)27 Regena Real Estate LLP # AAA-3310 Subsidiary 99.00% 2(87)28 JM Realty Management Private Limited
132, Bayside Mall,1st Floor Haji Ali Road, Tardeo Mumbai, Maharashtra 400034.
U45200MH2007PTC168953 Associates 50.00% 2(6)
29 Peninsula Brookfield Trustee Private Limited # U67190MH2011PTC224167 Associates 50.00% 2(6)30 PenBrook Capital Advisors Private Limited (Formerly
known as Peninsula Brookfield Investment Managers Private Limited )#
U74120MH2011PTC224370 Associates 37.26% 2(6)
31 SEW Engineering (India) Private Limited 104, Hanuman Industrial Estate, 42-G D Ambedkar Road, Wadala, Mumbai, Maharashtra 400031.
U40100MH1998PTC113861 Associates 26.00% 2(6)
32 RA Realty Ventures LLP 113-A, Mittal Tower, Nariman Point, Mumbai Maharashtra 400021
AAC-1032 Associates 40.00% 2(6)
33 Bridgeview Real Estate Development LLP# AAB-9755 Associates 50.00% 2(6)
*step down subsidiary through Peninsula Holdings and Investments Pvt. Ltd. # Registered Office - Peninsula Spenta, Mathuradas Mills Compound, Senapati Bapat Marg, Lower Parel, Mumbai - 400 013, Maharashtra
IV SHARE HOLDING PATTERN (Equity Share Capital Breakup as percentage of Total Equity)
i. Category-wise Share Holding
S. No
Category of Shareholders No. of Shares held at the beginning of the year No of Shares held at the end of the year % Change during the
yearDemat Physical Total % of Total Shares
Demat Physical Total % of Total Shares
A Promoters1 Indiana Individual/HUF 5586110 0 5586110 2.00% 5586110 0 5586110 2.00% 0.00%b Central Govt. 0 0 0 0.00% 0 0 0 0.00% 0.00%c State Govt. 0 0 0 0.00% 0 0 0 0.00% 0.00%d Bodies Corp. 66414 0 66414 0.02% 66414 0 66414 0.02% 0.00%e Bank/FI 0 0 0 0.00% 0 0 0 0.00% 0.00%f Any Other
i. ESOP/ ESOS 1000000 0 1000000 0.36% 1000000 0 1000000 0.36% 0.00%ii. Trusts 148929248 0 148929248 53.34% 148929248 0 148929248 53.34% 0.00%Sub-Total-A-(1) 155581772 0 155581772 55.72% 155581772 0 155581772 55.72% 0.00%
2 Foreign
a NRI-Individuals 0 0 0 0.00% 0 0 0 0.00% 0.00%b Other Individuals 0 0 0 0.00% 0 0 0 0.00% 0.00%c Body Corporate 0 0 0 0.00% 0 0 0 0.00% 0.00%d Bank/FI 0 0 0 0.00% 0 0 0 0.00% 0.00%e Any Other 0 0 0 0.00% 0 0 0 0.00% 0.00%
Sub-Total-A-(2) 0 0 0 0.00% 0 0 0 0.00% 0.00%Total Shareholding of Promoters (A1+A2)
155581772 0 155581772 55.72% 155581772 0 155581772 55.72% 0.00%
Directors’ Report Continued

47Annual Report 2017-18
Built for challenges. Preparing for growth.
S. No
Category of Shareholders No. of Shares held at the beginning of the year No of Shares held at the end of the year % Change during the
yearDemat Physical Total % of Total Shares
Demat Physical Total % of Total Shares
B Public Shareholding1 Institutiona Mutual Funds 0 25045 25045 0.01% 3010000 4795 3014795 1.08% 1.07%b Bank/FI 840502 51710 892212 0.32% 818841 38960 857801 0.31% -0.01%c Cen. Govt. 0 0 0 0.00% 0 0 0 0.00% 0.00%d State Govt. 0 0 0 0.00% 0 0 0 0.00% 0.00%e Venture Capital 0 0 0 0.00% 0 0 0 0.00% 0.00%f Insurance Co. 12649883 2500 12652383 4.53% 12584471 2500 12586971 4.51% -0.02%g FIIs 21414198 9250 21423448 7.67% 14429516 0 14429516 5.17% -2.50%h Foreign Portfolio
Corporate0 0 0 0.00% 0 0 0 0.00% 0.00%
i Foreign Venture Capital Fund
0 0 0 0.00% 0 0 0 0.00% 0.00%
j Others 0 0 0 0.00% 0 0 0 0.00% 0.00%Sub-Total-B(1) 34904583 88505 34993088 12.53% 30842828 46255 30889083 11.06% -1.47%
2 Non-Institutiona Body Corporate
i. Indian 28124817 99555 28224372 10.11% 31914433 68120 31982553 11.46% 1.35%ii. Overseas 0 250000 250000 0.09% 0 250000 250000 0.09% 0.00%
b Individuali. Individual
shareholders holding nominal share capital upto Rs. 1Lakh
33999083 4599360 38598443 13.82% 41186433 3808500 44994933 16.12% 2.29%
ii. Individual shareholders holding nominal share capital in excess of Rs.1Lakh
19364665 475665 19840330 7.11% 12059564 475665 12535229 4.49% -2.62%
c Othersi. NRI 1162441 54750 1217191 0.44% 1342372 54250 1396622 0.50% 0.06%ii. Clearing Member 496024 0 496024 0.18% 757693 0 757693 0.27% 0.09%iii. Investor Education
and Protection Fund0 0 0 0.00% 813335 0 813335 0.29% 0.29%
Sub-Total-B (2) 83147030 5479330 88626360 31.75% 88073830 4656535 92730365 33.21% 1.47%Total Public Shareholding (B1+B2)
118051613 5567835 123619448 44.28% 118916658 4702790 123619448 44.28% 0.00%
C Share held by Custodian for GDRs & ADRs
0 0 0 0.00% 0 0 0 0.00% 0.00%
Total C 0 0 0 0.00% 0 0 0 0.00% 0.00%Grand Total (A+B+C) 273633385 5567835 279201220 100.00% 274498430 4702790 279201220 100.00% 0.00%
ii. Shareholding of Promoters:
Sr. No.
Shareholders Name Shareholding at the beginning of the year Shareholding at the end of the year % change in share-
holding during the
year
No. of Shares
% of total shares of the
Company
% of shares Pledged /
encumbered to total shares
No. of shares
% of total Shares of the
company
% of shares Pledged /
encumbered to total shares
1 Ms. Urvi A. Piramal 2792015 1.00% 0.00% 2792015 1.00% 0.00% 0.00%2 Mr. Rajeev A. Piramal 921365 0.33% 0.00% 921365 0.33% 0.00% 0.00%3 Mr. Harshvardhan A. Piramal 921365 0.33% 0.00% 921365 0.33% 0.00% 0.00%4 Mr. Nandan A. Piramal 921365 0.33% 0.00% 921365 0.33% 0.00% 0.00%5 Ms. Kalpana Singhania 30000 0.01% 0.00% 30000 0.01% 0.00% 0.00%6 Powerjet Carriers and Transporters
Pvt. Ltd.66414 0.02% 0.00% 66414 0.02% 0.00% 0.00%
7 Morarjee Goculdas Spinning & Weaving Company Limited Senior Employees Stock Option Scheme through its trustees Ms. Urvi A. Piramal and Mr. Mahesh S. Gupta
1000000 0.36% 0.00% 1000000 0.36% 0.00% 0.00%

48 Peninsula Land Limited
Statutory Reports
Sr. No.
Shareholders Name Shareholding at the beginning of the year Shareholding at the end of the year % change in share-
holding during the
year
No. of Shares
% of total shares of the
Company
% of shares Pledged /
encumbered to total shares
No. of shares
% of total Shares of the
company
% of shares Pledged /
encumbered to total shares
8 Ashok Piramal Group Real Estate Trust through its Trustee Ms. Urvi A. Piramal
148929248 53.34% 14.99% 148929248 53.34% 14.99% 0.00%
Total 155581772 55.72% 14.99% 155581772 55.72% 14.99% 0.00%
iii. Change in Promoters’ Shareholding –
(There is no change in the Shareholding of the Promoter Group)
iv. Shareholding Pattern of top ten shareholders
(other than Directors, Promoters and Holders of GDRs and ADRs):
Sr. No.
For each of the top 10 Shareholders Shareholding at the Beginning of the year – April 1, 2017
Cumulative Shareholding during the year
Date Transaction No. of Shares
% of total shares of the
Company
No. of Shares
% of total shares of the
Company1 Franklin Templeton Investment Funds - - 19885667 7.12% 19885667 7.12%
22.12.2017 Sold in market -1535000 -0.55% 18350667 6.57%29.12.2017 Sold in market -788473 -0.28% 17562194 6.29%05.01.2018 Sold in market -991406 -0.36% 16570788 5.93%09.02.2018 Sold in market -516654 -0.19% 16054134 5.75%16.02.2018 Sold in market -718884 -0.26% 15335250 5.49%23.02.2018 Sold in market -471585 -0.17% 14863665 5.32%02.03.2018 Sold in market -236037 -0.08% 14627628 5.24%09.03.2018 Sold in market -246142 -0.09% 14381486 5.15%16.03.2018 Sold in market -337792 -0.12% 14043694 5.03%23.03.2018 Sold in market -215472 -0.08% 13828222 4.95%31.03.2018 Sold in market -160379 -0.06% 13667843 4.89%
2 Employees Provident Fund managed by Franklin Templeton Asset Management Malaysia SDN. BHD.
- - 1460430 0.52% 1460430 0.52%28.04.2017 Sold in market -323892 -0.11% 1136538 0.41%05.01.2018 Sold in market -605826 -0.22% 530712 0.19%09.02.2018 Sold in market -20761 -0.01% 509951 0.18%16.02.2018 Sold in market -20600 -0.01% 489351 0.18%23.02.2018 Sold in market -13485 -0.01% 475866 0.17%02.03.2018 Sold in market -14713 -0.01% 461153 0.16%09.03.2018 Sold in market -681 -0.00% 460472 0.16%16.03.2018 Sold in market -4316 -0.00% 456156 0.16%23.03.2018 Sold in market -13044 -0.01% 443112 0.15%31.03.2018 Sold in market -11074 -0.00% 432038 0.15%
3 The Oriental Insurance Company Limited - - 1370230 0.49% 1370230 0.49%4 United India Insurance Company Limited - - 1000000 0.36% 1000000 0.36%5 IIFL India Growth Fund - - 0 0.00% 0 0.00%
01.12.2017 Market Purchase 1000000 0.36% 1000000 0.36%08.12.2017 Market Purchase 1000000 0.36% 2000000 0.72%12.01.2018 Market Purchase 1500000 0.54% 3500000 1.26%02.02.2018 Market Purchase 100000 0.04% 3600000 1.30%31.03.2018 Sold in Market -590000 -0.21% 3010000 1.09%
6 New Deal Multitrade Pvt. Ltd. - - 12404106 4.44% 12404106 4.44%7 Life Insurance Corporation of India - - 7411369 2.65% 7411369 2.65%8 Shrikrishna Finvest & Capital Management Pvt. Ltd. - - 4710645 1.69% 4710645 1.69%9 Mr. Ashish Dhawan - - 3680000 1.32% 3680000 1.32%
14.04.2017 Sold in Market -792811 -0.28% 2887189 1.04%21.04.2017 Sold in Market -357189 -0.13% 2530000 0.91%28.04.2017 Sold in Market -350000 -0.12% 2180000 0.79%
Directors’ Report Continued

49Annual Report 2017-18
Built for challenges. Preparing for growth.
Sr. No.
For each of the top 10 Shareholders Shareholding at the Beginning of the year – April 1, 2017
Cumulative Shareholding during the year
Date Transaction No. of Shares
% of total shares of the
Company
No. of Shares
% of total shares of the
Company12.05.2017 Sold in Market -97864 -0.04% 2082136 0.75%19.05.2017 Sold in Market -113582 -0.04% 1968554 0.71%26.05.2017 Sold in Market -188554 -0.07% 1780000 0.64%09.06.2017 Sold in Market -123157 -0.04% 1656843 0.60%16.06.2017 Sold in Market -76843 -0.03% 1580000 0.57%07.07.2017 Sold in Market -500000 -0.18% 1080000 0.39%14.07.2017 Sold in Market -828949 -0.30% 251051 0.09%21.07.2017 Sold in Market -251051 -0.09% 0 0.00%
10 Highend Mercantile Private Limited - - 4241308 1.52% 4241308 1.52%11 Mr. Mahesh Shrikrishna Gupta Jointly With
Mr. Narendra Aneja - as Trustees of PLL - ESOP- - 3411307 1.22% 3411307 1.22%
12 General Insurance Corporation of India - - 2500000 0.90% 2500000 0.90%13 Mr. Bishwanath Prasad Agrawal - - 1700000 0.61% 1700000 0.61%
28.04.2017 Sold in Market -510000 -0.18% 1190000 0.43%05.05.2017 Sold in Market -1190000 -0.43% 0 0.00%
V. Shareholding of Director and Key Managerial Personnel: Sr. No.
For Each of the Directors and KMP Shareholding at the beginning of the year – April 1, 2017
Shareholding at the end of the year – March 31, 2018
Name of the Director/KMP No. of Shares % of Total Shares of the company
No. of Shares % of total Shares of the company
1 Ms. Urvi A. Piramal 2792015 1.00% 2792015 1.00%2 Mr. Rajeev A. Piramal 921365 0.33% 921365 0.33%3 Mr. Nandan A. Piramal 921365 0.33% 921365 0.33%4 Mr. Mahesh S. Gupta 300 0.00% 300 0.00%5 Ms. Bhavna Doshi 500 0.00% 500 0.00%6 Lt. Gen. Deepak Summanwar (Retired) 0 0.00% 0 0.00%7 Mr.Sudhindar Khanna 0 0.00% 0 0.00%8 Mr. Sajit Suvarna* 0 0.00% 0 0.00%9 Mr.Bharat Sanghavi 15,395 0.01% 13,395 0.00%10 Mr. Rajashekhar Reddy 10,000 0.00% 10,000 0.00%
*Mr. Sajit Suvarna was appointed as an Independent Director of the Company w.e.f. June 5, 2017.
V INDEBTEDNESS Indebtedness of the Company including interest outstanding / accrued but not due for payment
(` in Crores)Particulars Secured Loans
Excluding DepositsUnsecured Loans Deposits Total Indebtedness
Indebtedness at the beginning of the financial year 01.04.20171) Principal Amount 1831.16 273.38 0.00 2104.54
2) Interest due but not paid 0.00 0.00 0.00 0.00
3) Interest accrued but not due 77.67 0.00 0.00 77.67Total of (1+2+3) 1908.83 273.38 0.00 2182.21Change in Indebtedness during the Financial YearAddition 901.14 0.00 0.00 901.14Reduction 978.70 60.59 0.00 1039.29Net Change -77.56 -60.59 0.00 -138.15Indebtedness at the end of the Financial Year- 31.03.20181) Principal Amount 1753.60 212.79 0.00 1966.39
2) Interest due but not paid 0.00 0.00 0.00 0.00
3) Interest accrued but not due 128.04 0.00 0.00 128.04Total of (1+2+3) 1881.64 212.79 0.00 2094.43

50 Peninsula Land Limited
Statutory Reports
VI REMUNERATION OF DIRECTORS AND KEY MANAGERIAL PERSONNEL:A. Remuneration to Managing Director, Whole-Time Directors and / or Manager:
(Amount in `)
Sr. No.
Particulars of Remuneration Name of MD/ WTD/ Manager Total Amount Mr. Rajeev A. Piramal,
MDMr. Nandan A. Piramal
WTDMr. Mahesh Gupta,
Group - MD1 Gross Salary
(a) Salary as per provisions contained in section 17(1) of the Income Tax Act, 1961
1,20,00,000 99,00,000 1,27,47,958 3,46,47,958
(b) Value of perquisites u/s 17(2) of the Income Tax Act, 1961
39,600 39,600 6,79,283 7,58,483
(c) Profits in lieu of salary under Section 17(3) of the Income Tax Act, 1961
- - - -
2 Stock Option - - - -3 Sweat Equity - - - -4 Commission - - - -
- As % of Profit - - - -- Others, Specify - - - -
5 Others, please specify - - - -Company's Contribution to Provident Fund and Superannuation Fund
21,600 21,600 14,40,000 14,83,200
Total (A) 1,20,61,200 99,61,200 1,48,67,241 3,68,89,641Ceiling as per the Act 10% of the net profits of the Company/ as specified in Schedule V of the Companies
Act, 2013, as the case may be.
B. Remuneration of other Directors:
I. Independent Directors: (Amount in ` )
Sr. No.
Particulars of Remuneration Name of the Directors Total Amount
Ms. Bhavna Doshi Lt. Gen. Deepak Summanwar (Retd.)
Mr. Sudhindar Khanna
Mr. Sajit Suvarna
1 Fee for attending Board and Committee Meetings
4,10,000 4,10,000 1,20,000 95,000 10,35,000
2 Commission - - - - -3 Others - - - - -
Total (I) 4,10,000 4,10,000 1,20,000 95,000 10,35,000
II. Other Non-Executive Directors:- (Amount in ` )
Sr. No.
Other Non-Executive Directors Ms. Urvi A. Piramal Total Amount
1 Fee for attending Board and Committee Meetings 2,70,000 2,70,0002 Commission - -3 Other - -
Total (II) 2,70,000 2,70,000Total B = (I+II) 13,05,000Total Managerial Remuneration (A+B) 3,81,94,641Overall Ceiling as per the Act 11% of the Net profit of the Company/ as specified in
Schedule V of the Companies Act, 2013, as the case may be.
Directors’ Report Continued

51Annual Report 2017-18
Built for challenges. Preparing for growth.
C. Remuneration to Key Managerial Personnel Other than MD/Manager/WTD (Amount in ` )
Sr. No.
Particulars of Remuneration Name of the KMP Total AmountMr. Bharat Sanghavi
(CFO)Mr. Rajashekhar Reddy
(CS)
1 Gross Salary(a) Salary as per provisions contained in section 17(1) of the
Income Tax Act, 19611,07,51,292 53,21,389 1,60,72,681
(b) Value perquisites u/s 17(2) of the Income Tax Act, 1961 - - -(c) Profits in lieu of salary under Section 17(3) of the Income
Tax Act, 1961- - -
2 Stock Option - - -3 Sweat Equity - - -4 Commission - - -
- As % of Profit - - -- Others, Specify - - -
5 Others, please specify - - -Company's Contribution to Provident Fund and Superannuation Fund
5,82,358 3,26,592 9,08,950
Total (C) 1,13,33,650 56,47,981 1,69,81,631Ceiling as per the Act N. A.
VII PENALTIES / PUNISHMENT/ COMPOUNDING OF OFFENCES: NoneType Section of the
Companies ActBrief Description Details of Penalty/
Punishment/ Compounding Fees imposed
Authority (RD/ NCLT/ Court)
Appeal made, if any
A. Company Penalty - - - - - Punishment - - - - - Compounding - - - - -B. Directors Penalty - - - - - Punishment - - - - - Compounding - - - - -C. Other Officers in Default Penalty - - - - - Punishment - - - - - Compounding - - - - -

52 Peninsula Land Limited
Statutory Reports
Corporate Governance Report
Your Directors are pleased to present your Company’s Report on Corporate Governance for the Financial Year ended March 31, 2018.
1. COMPANY’S PHILOSOPHY ON CODE OF GOVERNANCE Corporate Governance encompasses laws, procedures,
practices and implicit rules that determine the Management’s ability to make sound decisions. It is also about maximizing shareholder’s value legally, ethically and on a sustainable basis with the combination of voluntary practices and compliance with laws and regulations leading to effective control and management of the organization. Corporate Governance provides a roadmap for a Company to make decisions based on the rule of law which benefits
the stakeholders. Good Corporate Governance leads to long term shareholder’s value creation and enhances interest of other stakeholders.
Peninsula Land Limited is respected in the Industry for its professional style of management and best business practices. It believes Corporate Governance is a way of life, rather than a mere legal compulsion. Its core values are based on integrity, respect for the law and compliance thereof, emphasis on product quality and a caring spirit. Peninsula Land Limited is committed to uphold its core values of customer focus, performance, leadership and quality. It also focuses on the need to provide a sustainable competitive return for its investors. Peninsula Land Limited believes that good governance generates goodwill among business partners, customers and investors and earns respect from society at large.

53Annual Report 2017-18
Built for challenges. Preparing for growth.
Peninsula Land Limited’s core objective is to conduct the business in such a way as to create the value that can be sustained over the long term for customers, stakeholders, employees and business partners. The Board of Peninsula Land Limited endeavors to achieve this by leveraging the resources at its disposal and fostering an environment for growth and development of human resources.
2. BOARD OF DIRECTORS (“BOARD”)
2.1. Composition and Category of the Board
The Board has an optimum combination of Executive and Non-Executive Directors. The Board, as on March 31, 2018,
comprised of 8 (eight) Directors, out of which 4 (four) were Independent Directors. The Board, headed by Ms. Urvi A. Piramal as the Non – Executive Chairperson, consists of eminent personalities with expertise and experience in diversified fields of specialization. As on March 31, 2018, the Board consisted of three Executive Directors, Mr. Rajeev A. Piramal, Executive Vice-Chairman and Managing Director, Mr. Mahesh S. Gupta, Group-Managing Director and Mr. Nandan A. Piramal, Whole-Time Director. Other than the three aforementioned Executive Directors and the Non - Executive Chairperson all other members of the Board are Independent Directors.
The composition of the Board and Category of each Director during the year 2017-18 is given below:
Category Name of Directors Designation No. of shares held as on March 31, 2018
Promoter Directors Ms. Urvi A. Piramal Non - Executive Chairperson 27,92,015Mr. Rajeev A. Piramal Executive Vice - Chairman and
Managing Director9,21,365
Mr. Nandan A. Piramal Whole - Time Director 9,21,365Professional Executive Director
Mr. Mahesh S. Gupta Group - Managing Director 300
Independent Directors Ms. Bhavna Doshi Director 500Lt. Gen. Deepak Summanwar (Retd.) Director NilMr. Sudhindar Khanna Director NilMr. Sajit Suvarna* Director Nil
*Mr. Sajit Suvarna was appointed as Independent Director w.e.f. June 5, 2017.
2.2. Directors Profile
Brief Profile of the Directors and the nature of their expertise in specific functional areas is given below:
Ms. Urvi A. Piramal Ms. Urvi A. Piramal, Chairperson of Ashok Piramal
Group, oversees a professionally managed business conglomerate with business interest in real estate, textiles, auto components, cutting tools and renewable energy.
She is the guiding force behind the Group’s sustained and profitable growth: which is bringing the Group companies closer to realizing her vision of touching the lives of one in five people across the globe.
Ms. Piramal has a Bachelor of Science degree and has attended the Advance Management Program at Harvard Business School. She is a member of Technology and Quality Improvement Committee of IMC since its inception in 1994, and also the Chairperson of Supply Chain & Retail business (Internal Trade) Committee (04-05).
Ms. Piramal has received a number of awards for her contribution to business. She was awarded the Qimpro Gold Standard Award for excellence in Managing Quality Improvement programmes across the Group. She has won the outstanding Woman Industrialist Award presented by the Marinelines Junior Chamber and the Yami Woman
Award for her outstanding contribution to business.
She also has to her credit the Cheminor Award from the Indian Institute of Materials Management. She was honoured with the Giants International Award in recognition of her outstanding contribution to business in 2015.
She is a Trustee of the Piramal Education Trust, Ashok G Piramal Trust, Urvi Ashok Piramal Foundation (UAPF) which has been set up for the underprivileged and Conservation Wildlands Trust. Through these trusts, Ms. Piramal has initiated social projects in Rajasthan, Maharashtra and Madhya Pradesh.
She is also on the board of Population First, an NGO working on creating awareness for the girl child. Ms. Piramal is a wildlife enthusiast and has published two books – “My Wildside: India and Africa”. She spends her leisure time reading, listening to music and traveling extensively.
Mr. Rajeev A. Piramal Mr. Rajeev A Piramal is the Executive Vice-Chairman and
Managing Director of Peninsula Land Limited and leads all aspects of the business from strategy to operations.
Under his leadership, Peninsula Land has grown robustly, developed over 7.4 mn. sq. ft. in the residential, commercial and retail sectors. Another 7.8 mn. sq. ft. of premium

54 Peninsula Land Limited
Statutory Reports
Corporate Governance Report Continued
real estate is under development and in the pipeline. He has transformed Peninsula Land from a Mumbai based company to one with operations spread across eight cities in four states.
After completing his BBA (Bachelor in Business Administration) from Baldwin Wallace College, Cleveland, USA, he began his career as a management trainee at Nicholas Piramal. In early 2001, he entered the real estate sector and became a Director at Peninsula Land Limited.
In the last 15 years that he has been associated with the real estate sector, Mr. Piramal has played an instrumental role in developing some of the landmark projects in Mumbai. He was part of the team that developed the first textile mill land in Mumbai, after the government opened up development of mill land. Peninsula Corporate Park was developed on textile mill land in Central Mumbai and this project transformed Lower Parel into a new age business district.
He also played a crucial part in the development of the first mall in India: Crossroads. Mr. Piramal was in charge of the operations of Crossroads that brought in a new concept of shopping to India.
Peninsula Business Park, Peninsula Technopark, Ashok Towers and Ashok Gardens are some of the other iconic projects developed under his leadership.
In 2005, Mr. Piramal took over as the Executive Vice-Chairman of the company. In 2012, he took on the additional responsibility as Managing Director of the Company. Mr. Piramal has created Peninsula Land as a strong brand. He firmly believes that quality and timely execution of projects are the key factors leading to success in the real estate business.
Mr. Nandan A. Piramal Mr. Nandan A. Piramal heads sales and marketing at
Peninsula Land Limited which has projects spread across six locations in India. The entire gamut of marketing initiative: from developing marketing tools to sales is led by him.
He conceptualized and implemented marketing tools that have transformed project launches and improved sales in all the projects. Projects launched under him include Peninsula Heights in Bengaluru, Carmichael Residences at Carmichael Road, Celestia Spaces at Sewree and Salsette 27 at Byculla – all three in Mumbai. During the year, he launched Peninsula Land’s first project in the affordable housing segment, addressOne at Gahunje in Pune.
Mr. Piramal started his career as Vice Chairman in Pyramid Retail after completing his education in London. He was in charge of handling all aspects of the retail business from business strategy to expansion. Under his leadership, the number of retail stores increased to 40.
He also conceptualized and launched Corporate Social Responsibility (CSR) at Ashok Piramal Group. The CSR projects include mobile health vans providing medical aid at peoples’ doorsteps and vocational training institutes: training unemployed people to gain employment.
Mr. Piramal is an alumnus of University College, London.
Mr. Mahesh S. Gupta Mr. Mahesh S. Gupta, Group Managing Director at Ashok
Piramal Group, oversees all businesses of the Group which comprises of real estate, textiles, auto components, cutting tools and renewable energy.
Mr. Gupta has about 4 decades of professional experience in the areas of Business Management and all dimensions of finance.
In his current role since 2005, he formulates the Group’s business strategy, steers the Group to achieve its goals and plays a significant role in guiding each business to attain profitable and sustained growth. Under his stewardship, the Group formulated an aggressive plan which has seen the businesses grow by leaps and bounds. Mr. Gupta leverages his in-depth understanding of the businesses to enhance the growth of the Group.
Earlier he had been associated with Piramal Enterprises Ltd. for about 17 years as Group CFO and was also on the board of several companies, including whole-time director of Nicholas Piramal Ltd (now Piramal Enterprise Ltd). During this tenure, he was part of the core team which was instrumental in transforming Nicholas Piramal from a small enterprise to amongst the top three Pharmaceutical Companies, mainly through mergers and acquisitions.
He has also worked with the RPG group as Group CFO and Management Board Member. The RPG Group comprises of companies such as CEAT Limited, KEC International Ltd., CESE Ltd, Philips Carbon Black Ltd, RPG Life Sciences Ltd, Saregama Ltd, Zensar Technologies Ltd. etc.
Mr. Gupta has received a number of recognitions for his business acumen. He was awarded the CFO of the Year Award, Special Commendation for Financial Excellence (Mergers & Acquisitions Category) in 2001 by IMA (formerly known as EIU), New Delhi.
He is on the Board of several Public listed Companies such as Peninsula Land Limited, Morarjee Textiles Limited, CEAT Limited and RPG Life Sciences Limited. From time to time he has also been associated with various Committees of The Institute of Chartered Accountants of India (ICAI) as co-opted member, Member Governing Council of Indian Association Corporate CFOs & Treasurers (InACT), Advisory Board of Chennai Business School.
Mr. Gupta has an Honours Degree in B.Com; LL.B (Gen). Fellow Member of The Institute of Chartered Accountants

55Annual Report 2017-18
Built for challenges. Preparing for growth.
and The Institute of Company Secretaries of India. He had an outstanding academic record and has been a Third Rank Holder and a Silver Medalist in Company Secretaries Final examination.
Ms. Bhavna Doshi Ms. Bhavna Doshi is an Independent Director of the
Company. Ms. Bhavna Doshi is a Fellow Member of the Institute of Chartered Accountants of India and holds a Masters Degree in Commerce from Mumbai University. She has rich experience of over three decades providing advisory services in the fields of taxation, accounting, corporate and regulatory matters. She is former partner of Bharat S Raut & Co (full member firm of KPMG in India). She also serves as an Independent Director on the Board of several Listed Companies.
Ms. Doshi has served as an elected member of the Council of Institute of Chartered Accountants of India, a body set up by an Act of Parliament for regulation and development of accountancy profession. She has served as a member of the Compliance Advisory Panel of International Federation of Accountants, headquartered at New York and has also served on the Government Accounting Standards Advisory Board of the Comptroller and Auditor General of India. She was president of the IMC, a Chamber of Commerce headquartered at Mumbai.
Lt. Gen. Deepak Summanwar (Retd.) Lt. General Deepak Summanwar (Retd.), UYSM, AVSM,
VSM is an Independent Director of the Company. Lt. General Deepak Summanwar (Retd.) holds a Post Graduate Diploma in Marketing with distinction, a Postgraduate Degree in Business Administration with specialization in Finance from Solvay Business School & Vrije University of Brussels, Masters Degree in Defence and Strategic studies from Madras University. He has also successfully completed the Higher Command Course from the Army War College, Mhow, this course is equated with an M. Phil in Strategy and Management by the Devi Ahilya University, Indore. Senior Strategic Management Course from College of Defence Management, Secundrabad. The General is a graduate of the National Defence Academy, Defence Services Staff College and the Army War College. He has also participated in a program for Independent Directors conducted by the ASSOCHAM and CII.
Lt. General Deepak Summanwar (Retd.) retired from the Army after forty years of service. Nearly half of this was in the forward areas and combat zones. He commanded a Mountain Division in Kargil Sector during Operation Parakram with Pakistan, a Brigade in Anti-Militancy operations in Kupwara Sector of Kashmir and a Battalion in Counter Insurgency operations in Manipur. He has been in charge of Operational planning in the IPKF Headquarters for the Operations in Sri Lanka, Director in the Military
Operations, Additional Director General of Perspective Planning and Public Information (Spokesperson for the Army). The General retired as Director General of Military Intelligence for the Country in 2007. He has taken part in International and National deliberations and has represented the Country in Sri Lanka at JOC in Colombo during the IPKF operations, the Pacific Armies Conference and the Indo US Strategic Dialogues on Military to Military Cooperation at the Pentagon in Washington.
Lt. General Summanwar (Retd.) was responsible in setting up Educational and Women’s Upliftment Programs and Skill Development Courses in the far-flung areas of North Eastern States, Ladakh (in collaboration with CII) and militancy areas of J&K. He possesses wide expertise and skills in management, environmental security and risk assessment and analysis, leadership and decision making. He has been decorated five times for his gallantry and distinguished service and has received twenty operational and service medals.
Post retirement, the General has been nominated as an Independent Director on the Board of Peninsula Land Limited, GOL Offshore Limited (resigned in March 2014) and Waterbase Limited, all Companies Listed on the BSE Limited, Director of PICA Corporation, USA (till March 2014, currently advisor); Regional Director of ESi 911, USA; Senior Advisor to GSA Exhibitions, United Kingdom; Dynamik Offshore Ltd., Dubai and Trina Solar, China (till March 2014); Associate of Burrill Green and Co., United Kingdom; Trustee of The Kunzru Institute of Defence Studies, India and a member of the Institute of Defence and Strategic Analysis. He has an extremely broad network of contacts and is as an independent consultant and advisor to Companies setting up business in India.
Mr. Sudhindar Khanna Mr. Sudhindar Khanna is an Independent Director of the
Company. Mr. Khanna is a Chartered Accountant from the Institute of Chartered Accountants of England and Wales (after being placed first in the UK Financial exams and 3rd in the Intermediate exams/Best paper in Law) and received a First Class Bachelor in Economics from St. Stephens College, New Delhi. Mr. Khanna joined Accenture, London as a Senior Consultant in the year 1977 and spent the next ten years working for major Public Sector Clients and almost all major Banks and Insurance Companies in the UK. Mr. Khanna was responsible for the start of Accenture offshore IT and BPO in India, which has since grown to over 60,000 people.
Mr. Khanna possesses wide experience in advising clients in strategy, re-engineering and technology across a range of Industries at the Chairman / CEO level in approximately 20 countries. Mr. Khanna retired from Accenture after 30 years of service. His last position in Accenture was that of Global Managing Partner, based in London.

56 Peninsula Land Limited
Statutory Reports
Mr. Khanna speaks at a variety of global conferences and interacts with the media globally. He serves on the Boards of Ashok Leyland Limited, Canara HSBC Oriental Bank of Commerce Life Insurance Company Limited, HCL Technologies Limited, etc.
Mr. Sajit Suvarna Mr. Sajit Suvarna is a partner of DSK Legal-one of the
reputed law firms in the country. He is registered with the Bar Council of Maharashtra and Goa and holds Bachelor’s Degrees in Commerce and Law. He is a registered Solicitor with the Supreme Court of England & Wales and the Bombay Incorporated Law Society.
He heads the real estate practice in DSK Legal and specialises in transactions, advisory work and any solutions in the real estate and construction sector. His expertise in the sector is under:
• Real estate/ land acquisition,• Real estate development including residential/
commercial developments, affordable housing, retail, hospitality, healthcare, education, townships, SEZs, information technology parks, etc.,
• Real Estate Private Equity and investment,• Real estate finance,• Real estate litigation and dispute resolution,• Corporate structuring,• Real Estate Investment Trusts.
He is sought after by leading property developers, property owners, government entities/ agencies, corporate houses,
warehousing and logistic companies, hotel operators, educational institutions, offshore and domestic funds/ lenders, investors, contractors, financial institutions for his strategic and solution based legal advice on complex real estate transactions. He is well regarded by clients of his pragmatic approach and commercial awareness and for his exceptional service oriented attitude.
He has assisted governmental agencies in various Smart City initiatives, which are a part of the Smart City Mission initiated by Honorable Prime Minister. He also assisted the Ministry for Social Justice and Special Assistance, Government of Maharashtra, in acquisition of house in London where Dr. Babasaheb Ambedkar (Architect of Indian Constitution) lived, which has now been converted into a memorial.
He is also a regular speaker at seminars on legal development and current issues in real estate and construction law, including the recently enacted Real Estate Regulation and Development Act, 2016.
2.3. Attendance at Board Meetings, Last Annual General Meeting, relationship between Directors inter-se, No. of Directorships and Committee Memberships/ Chairpersonships
The details of attendance of each Director at the Board Meetings held during the Financial Year and the last Annual General Meeting (AGM), along with the number of Companies and Committees where she/he is a Director/ Member/ Chairperson and the relationship between the Directors inter-se, as on March 31, 2018, are given below:
Name Relationship with other Directors Attendance No. of Board/ Committees (other than Peninsula Land Limited) as at March 31, 2018
Board Meetings A.G.M. (held on August 29, 2017)
No. of other Directorships
CommitteesHeld Attended Chairperson /
ChairmanMember
Ms. Urvi A. Piramal (Non – Executive Chairperson)
Mother of Mr. Rajeev A. Piramal & Mr. Nandan A. Piramal
5 5 Yes 6 - -
Mr. Rajeev A. Piramal (Executive Vice-Chairman & Managing Director)
Son of Ms. Urvi A. Piramal and Brother of Mr. Nandan A. Piramal
5 5 No 8 - 2
Mr. Nandan A. Piramal (Whole-Time Director)
Son of Ms. Urvi A. Piramal and Brother of Mr. Rajeev A. Piramal
5 4 Yes 4 - -
Mr. Mahesh S. Gupta (Group- Managing Director)
None 5 5 Yes 7 2 3
Ms. Bhavna Doshi (Independent Director)
None 5 5 Yes 9 4 4
Lt. Gen. Deepak Summanwar (Retd.) (Independent Director)
None 5 5 No 1 - 1
Mr. Sudhindar Khanna (Independent Director)
None 5 2 No 3 - 1
Mr. Sajit Suvarna* (Independent Director)
None 3 1 No - - -
*Mr. Sajit Suvarna was appointed as Independent Director w.e.f. June 5, 2017.
Corporate Governance Report Continued

57Annual Report 2017-18
Built for challenges. Preparing for growth.
The Directorships held by Directors as mentioned above, do not include Alternate Directorships, Directorships in Foreign Companies, Companies registered under Section 8 of the Companies Act, 2013 and Private Limited Companies.
None of the Directors is a Director in more than 20 Companies or more than 10 Public Limited Companies or acts as an Independent Director in more than 7 Listed Companies. None of the executive Directors acts as Independent Director of more than three listed entities. None of the Directors is a member in more than 10 Committees or is Chairperson of more than 5 Committees amongst the Companies mentioned above. The Committees considered for the above purpose are those specified in the Securities and Exchange Board of India (Listing Obligations and Disclosure Requirements) Regulations, 2015 (i.e. Audit Committee and Stakeholders’ Relationship Committee.)
2.4. Meetings of the Board of Directors
5 (Five) Board Meetings were held during the Financial Year 2017-18 and the gap between two consecutive Board Meetings did not exceed one hundred and twenty days.
The dates on which the Meetings were held are as follows:
Sr. No.
Date of Meeting Board Strength No. of Directors present
1 April 24, 2017 7 72 May 9, 2017 7 53 July 31, 2017 8 64 November 2, 2017 8 65 February 5, 2018 8 8
2.5. Shares and Convertible Instruments held by Non – Executive Directors
The details of shares held by Non-Executive Directors as on March 31, 2018 are as under:
Sr. No.
Name of the Director Number of Shares held
1 Ms. Urvi A. Piramal (Non – Executive Chairperson)
27,92,015
2 Ms. Bhavna Doshi (Independent Director)
500
3 Lt. Gen. Deepak Summanwar (Retd.) (Independent Director)
0
4 Mr. Sudhindar Khanna (Independent Director)
0
5. Mr. Sajit Suvarna (Independent Director)
0
The Company has not issued any convertible instruments.
2.6. Details of Directors being appointed/ re-appointed
As per the provisions of the Companies Act, 2013, two-third of the total number of Directors, other than Independent Directors, should be liable to retire by rotation. One-third of these Directors are required to retire every year and if eligible, these Directors qualify for re-appointment. Independent Directors of the Company are not liable for retirement by rotation. At the ensuing Annual General Meeting, Mr. Nandan A. Piramal (DIN: 00045003) retires by rotation, and being eligible, offers himself for re-appointment.
Further, the profile of Director Mr. Nandan A. Piramal along with additional information required under Regulation 36(3) of the Securities and Exchange Board of India (Listing Obligations and Disclosure Requirements) Regulations, 2015 is provided separately by way of an Annexure to the Notice of the Annual General Meeting.
2.7. Familiarization Program imparted to Independent Directors
As required by the Securities and Exchange Board of India (Listing Obligations and Disclosure Requirements) Regulations, 2015 and the provisions of the Companies Act, 2013, the Board has framed a Familiarization Program for the Independent Directors of the Company in order to update them with the nature of industry in which the Company operates and business model of the Company in order to familiarize them with their roles, rights, responsibilities, etc. The details of the abovementioned Familiarization Program is uploaded on the website of the Company www.peninsula.co.in.
During the Financial Year 2017-18, the Company arranged presentations by the representatives of KPMG to help the Independent Directors understand the Real Estate (Regulation and Development) Act, 2016 (RERA) and its implementation at the Company, Ernst and Young on Goods and Service Tax Act, 2017 (GST) and Kotak Institutional Equities on trends and current position of Real Estate Sector.
2.8. Performance Evaluation
During the Financial Year, the performance evaluation process was carried out by the Company. In this regard, the Board had engaged an independent Agency possessing the requisite experience in carrying out such evaluation, in order to maintain the confidentiality and effectiveness of evaluation process, as suggested by the Directors at their Meeting held on November 2, 2017. The findings were shared individually with the respective Board Members as well as the Chairperson.
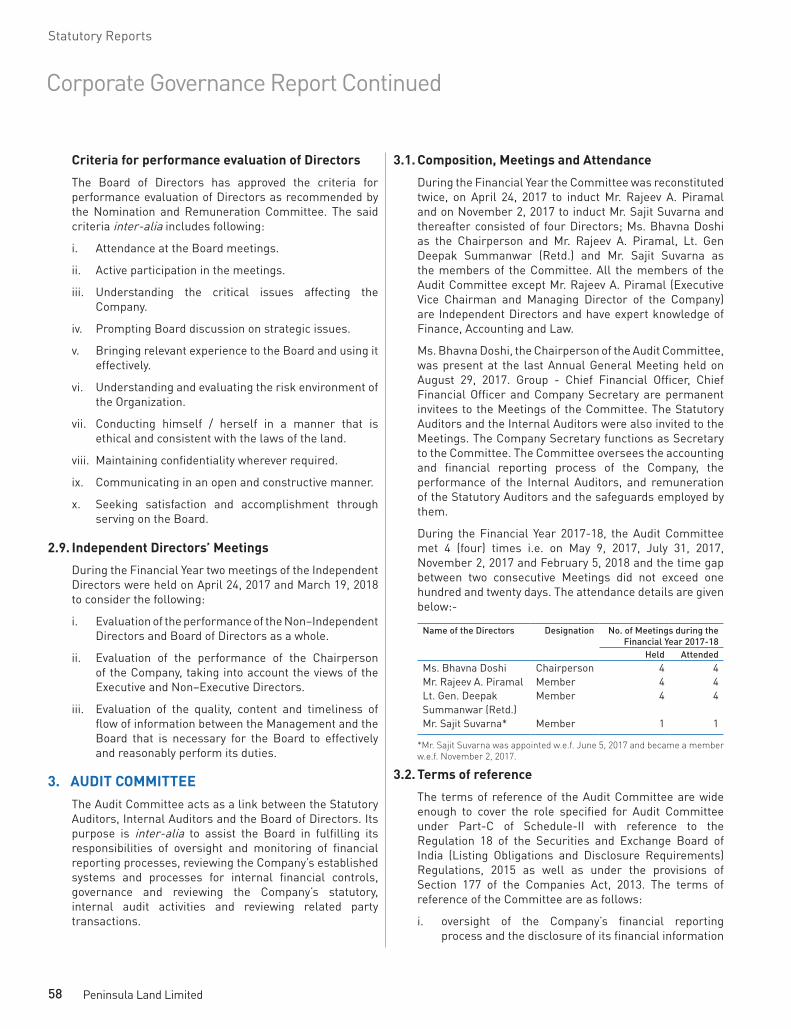
58 Peninsula Land Limited
Statutory Reports
Criteria for performance evaluation of Directors
The Board of Directors has approved the criteria for performance evaluation of Directors as recommended by the Nomination and Remuneration Committee. The said criteria inter-alia includes following:
i. Attendance at the Board meetings.
ii. Active participation in the meetings.
iii. Understanding the critical issues affecting the Company.
iv. Prompting Board discussion on strategic issues.
v. Bringing relevant experience to the Board and using it effectively.
vi. Understanding and evaluating the risk environment of the Organization.
vii. Conducting himself / herself in a manner that is ethical and consistent with the laws of the land.
viii. Maintaining confidentiality wherever required.
ix. Communicating in an open and constructive manner.
x. Seeking satisfaction and accomplishment through serving on the Board.
2.9. Independent Directors’ Meetings
During the Financial Year two meetings of the Independent Directors were held on April 24, 2017 and March 19, 2018 to consider the following:
i. Evaluation of the performance of the Non–Independent Directors and Board of Directors as a whole.
ii. Evaluation of the performance of the Chairperson of the Company, taking into account the views of the Executive and Non–Executive Directors.
iii. Evaluation of the quality, content and timeliness of flow of information between the Management and the Board that is necessary for the Board to effectively and reasonably perform its duties.
3. AUDIT COMMITTEE The Audit Committee acts as a link between the Statutory
Auditors, Internal Auditors and the Board of Directors. Its purpose is inter-alia to assist the Board in fulfilling its responsibilities of oversight and monitoring of financial reporting processes, reviewing the Company’s established systems and processes for internal financial controls, governance and reviewing the Company’s statutory, internal audit activities and reviewing related party transactions.
3.1. Composition, Meetings and Attendance
During the Financial Year the Committee was reconstituted twice, on April 24, 2017 to induct Mr. Rajeev A. Piramal and on November 2, 2017 to induct Mr. Sajit Suvarna and thereafter consisted of four Directors; Ms. Bhavna Doshi as the Chairperson and Mr. Rajeev A. Piramal, Lt. Gen Deepak Summanwar (Retd.) and Mr. Sajit Suvarna as the members of the Committee. All the members of the Audit Committee except Mr. Rajeev A. Piramal (Executive Vice Chairman and Managing Director of the Company) are Independent Directors and have expert knowledge of Finance, Accounting and Law.
Ms. Bhavna Doshi, the Chairperson of the Audit Committee, was present at the last Annual General Meeting held on August 29, 2017. Group - Chief Financial Officer, Chief Financial Officer and Company Secretary are permanent invitees to the Meetings of the Committee. The Statutory Auditors and the Internal Auditors were also invited to the Meetings. The Company Secretary functions as Secretary to the Committee. The Committee oversees the accounting and financial reporting process of the Company, the performance of the Internal Auditors, and remuneration of the Statutory Auditors and the safeguards employed by them.
During the Financial Year 2017-18, the Audit Committee met 4 (four) times i.e. on May 9, 2017, July 31, 2017, November 2, 2017 and February 5, 2018 and the time gap between two consecutive Meetings did not exceed one hundred and twenty days. The attendance details are given below:-
Name of the Directors Designation No. of Meetings during the Financial Year 2017-18
Held AttendedMs. Bhavna Doshi Chairperson 4 4Mr. Rajeev A. Piramal Member 4 4Lt. Gen. Deepak Summanwar (Retd.)
Member 4 4
Mr. Sajit Suvarna* Member 1 1
*Mr. Sajit Suvarna was appointed w.e.f. June 5, 2017 and became a member w.e.f. November 2, 2017.
3.2. Terms of reference
The terms of reference of the Audit Committee are wide enough to cover the role specified for Audit Committee under Part-C of Schedule-II with reference to the Regulation 18 of the Securities and Exchange Board of India (Listing Obligations and Disclosure Requirements) Regulations, 2015 as well as under the provisions of Section 177 of the Companies Act, 2013. The terms of reference of the Committee are as follows:
i. oversight of the Company’s financial reporting process and the disclosure of its financial information
Corporate Governance Report Continued

59Annual Report 2017-18
Built for challenges. Preparing for growth.
to ensure that the Financial Statement is correct, sufficient and credible;
ii. recommendation for appointment, remuneration and terms of appointment of Auditors of the Company;
iii. approval of payment to Statutory Auditors for any other services rendered by the Statutory Auditors;
iv. reviewing, with the management, the annual financial statements and Auditor's Report thereon before submission to the Board for approval, with particular reference to:
a) matters required to be included in the Director’s Responsibility Statement; to be included in the Board’s Report in terms of clause (c) of sub-section (3) of Section 134 of the Companies Act, 2013;changes, if any, in accounting policies and practices and reasons for the same;
b) changes, if any, in accounting policies and practices and reasons for the same;
c) major accounting entries involving estimates based on the exercise of judgment by management;
d) significant adjustments made in the financial statements arising out of audit findings;
e) compliance with listing and other legal requirements relating to financial statements;
f) disclosure of any related party transactions;
g) modified opinion(s) in the draft audit Report;
v. reviewing, with the management, the quarterly Financial Statements before submission to the Board for approval;
vi. reviewing, with the management, the statement of uses / application of funds raised through an issue (public issue, rights issue, preferential issue etc.), the statement of funds utilized for purposes other than those stated in the offer document / prospectus / notice and the Report submitted by the monitoring agency monitoring the utilisation of proceeds of a public or rights issue, and making appropriate recommendations to the Board to take up steps in this matter;
vii. reviewing and monitoring the Auditor’s independence & performance, and effectiveness of audit process;
viii. approval or any subsequent modification of transactions of the Company with related parties;
ix. scrutiny of inter-corporate loans and investments;
x. valuation of undertakings or assets of the Company, wherever it is necessary;
xi. evaluation of internal financial controls and risk management systems;
xii. reviewing, with the management, performance of statutory and internal Auditors, adequacy of the internal control systems;
xiii. reviewing the adequacy of internal audit function, if any, including the structure of the internal audit department, staffing and seniority of the official heading the department, reporting structure coverage and frequency of internal audit;
xiv. discussion with internal Auditors of any significant findings and follow up there on;
xv. reviewing the findings of any internal investigations by the internal Auditors into matters where there is suspected fraud or irregularity or a failure of internal control systems of a material nature and reporting the matter to the Board;
xvi. discussion with Statutory Auditors before the audit commences, about the nature and scope of audit as well as post-audit discussion to ascertain any area of concern;
xvii. to look into the reasons for substantial defaults in the payment to the depositors, debenture holders, shareholders (in case of non-payment of declared dividends) and creditors;
xviii. to review the functioning of the Whistle–Blower mechanism;
xix. approval of appointment of Chief Financial Officer after assessing the qualifications, experience and background, etc. of the candidate;
Further, the Audit Committee shall have full access to information contained in the records of the Company in connection with investigation into any matter in relation to its terms of reference or as may be referred to it by the Board.
4. NOMINATION AND REMUNERATION COMMITTEE
4.1. Composition, Meeting and Attendance
During the Financial Year the committee was reconstituted on April 24, 2018 to induct Ms. Bhavna Doshi and thereafter consisted of three Directors out of which two were Independent Directors; Lt. Gen. Deepak Summanwar (Retd.) as the Chairman and Ms. Urvi A. Piramal and Ms. Bhavna Doshi as the members of the committee.
During the Financial Year 2017–18, the Nomination and Remuneration Committee met twice on April 24, 2017 and February 5, 2018. The details of the Meetings held during

60 Peninsula Land Limited
Statutory Reports
the year and attendance of Directors are incorporated in the following table:-
Name of the Director Designation No. of Meetings during the Financial Year 2017-18
Held AttendedLt. Gen Deepak Summanwar (Retd.)
Chairman 2 2
Ms. Bhavna Doshi Member 2 2Ms. Urvi A. Piramal Member 2 2
4.2. Terms of reference
The Committee determines the remuneration of the Executive Directors, Non-Executive Directors and Senior Management Personnel including Key Managerial Personnel. The terms of reference of the Nomination and Remuneration Committee are wide enough to cover the matters specified under Part D of Schedule II with reference to Regulation 19(4) of the Securities and Exchange Board of India (Listing Obligations and Disclosure Requirements) Regulations, 2015 as well as under the provisions of Section 177 of the Companies Act, 2013, which are as under:
i. Formulation of the criteria for determining qualifications, positive attributes and independence of a director and recommend to the board of directors a policy relating to, the remuneration of the directors, key managerial personnel and other employees;
ii. Specification of manner and criteria for effective evaluation of performance of Board, its committees and individual directors, to be carried out either by the board or by an independent external agency and review its implementation and compliance.
iii. Devising a policy on diversity of board of directors;
iv. Identifying persons who are qualified to become directors and who may be appointed in senior management in accordance with the criteria laid down, and recommend to the board of directors their appointment and removal.
v. Whether to extend or continue the term of appointment of the independent director, on the basis of the report of performance evaluation of independent directors.
4.3. Remuneration Policy
Pursuant to the provisions of Section 178 of the Companies Act, 2013, the Company has formulated a Policy on the appointment of person as Director and evaluation of Directors & Senior Management Personnel (SMP). An extract of the Policy covering remuneration for the Directors, Key Managerial Personnel (KMP) and other employees is reproduced below:
i. The terms of employment and remuneration of MD, WTD, KMPs and SMPs shall be competitive in order to ensure that the Company can attract and retain competent talent.
ii. The remuneration policy shall ensure that:
a. The level and composition of remuneration is reasonable and sufficient to attract, retain and motivate Directors, KMPs and SMPs of the quality to run the Company successfully.
b. Relationship of remuneration to performance is clear and meets appropriate performance benchmarks.
c. Remuneration to Directors, KMPs and SMPs involves a balance between fixed and variable pay reflecting short and long term performance and goals set by the Company.
iii. While determining the remuneration and incentives for the MD, WTD and KMPs, the following shall be considered:
a. Pay and employment conditions with peers/ elsewhere in the competitive market.
b. Benchmarking with industry practices.c. Performance of the individual.d. Company’s performance.
iv. For the benchmarking with industry practice, criteria of size, complexity, data transparency and geographical area shall also be given due consideration.
v. The pay structures shall be appropriately aligned across levels in the Company.
The detailed policy on the appointment of person as Director and evaluation of Directors & Senior Management Personnel of the Company is hosted on the website of the Company www.peninsula.co.in.
5. REMUNERATION OF DIRECTORS5.1. Remuneration paid to Non-Executive Directors of the Company
The Non-Executive Directors of the Company were paid sitting fees for attending each Meeting of the Board of Directors, Audit Committee and Nomination and Remuneration Committee thereof and Meeting of Independent Directors during the Financial Year 2017-18.
The Non-Executive Directors do not have any other pecuniary relationship with the Company apart from receiving dividend for the Shares held by them, if any, and sitting fees and reimbursement of expenses incurred for attending Meetings of the Board and Committees thereof.
Corporate Governance Report Continued

61Annual Report 2017-18
Built for challenges. Preparing for growth.
The Company has not granted any stock option to any of its Non-Executive Directors.
The details of the sitting fees paid during the Financial Year 2017-18 are given below:
Name of the Director Designation as on March 31, 2018
Sitting Fees (`)
Ms. Urvi A. Piramal Non-Executive Chairperson
2,70,000
Ms. Bhavna Doshi Independent Director 4,10,000Lt. Gen. Deepak Summanwar (Retd.)
Independent Director 4,10,000
Mr. Sudhindar Khanna Independent Director 1,20,000Mr. Sajit Suvarna* Independent Director 95,000
*Mr. Sajit Suvarna was appointed as Independent Director w.e.f. June 5, 2017.
5.2. Remuneration paid to the Executive Directors of the Company
The remuneration of the Executive Directors is determined on the recommendation of the Nomination and Remuneration Committee and approved by the Board of Directors and Shareholders. Any change in remuneration is also effected in the same manner and/or in line with the applicable statutory approvals.
The remuneration package of the Executive Directors comprises of Salary and Allowances, contribution to Provident Fund and Superannuation Fund and Commission. No Bonus or Pension is paid and no Stock Options were granted to any of the Executive Directors.
The details of Remuneration for Financial Year 2017-18 are summarized below:
(Amount in `)Name of the Directors Designation Salary &
AllowancesPerquisite Company’s contribution
to Provident Fund and Superannuation Fund
Mr. Rajeev A. Piramal Executive Vice-Chairman and Managing Director
1,20,00,000 39,600 21,600
Mr. Nandan A. Piramal Whole-Time Director 99,00,000 39,600 21,600Mr. Mahesh S. Gupta Group Managing Director 1,27,47,958 6,79,283 14,40,000
The tenure of office of the Executive Directors of the Company is 5 years from their respective dates of appointment. There is no provision for payment of severance fees.
6. STAKEHOLDERS’ RELATIONSHIP COMMITTEE
6.1. Composition, Meeting and Attendance
The Committee consists of three Directors namely, Lt. Gen. Deepak Summanwar (Retd.), an Independent Director, as the Chairman and Mr. Rajeev A. Piramal and Mr. Mahesh S. Gupta as its members.
Name of the Director Designation No. of Meetings during the Financial Year 2017-18
Held Attended
Lt. Gen Deepak Summanwar (Retd.)
Chairman - -
Mr. Rajeev A. Piramal Member - -Mr. Mahesh S. Gupta Member - -
6.2. Terms of Reference
i. To consider and resolve the grievances of all the security holders
ii. To review and deal with complaints and queries received from the Shareholders, Debenture holders, Deposit holders and other security holders of the Company.
iii. To review and deal with responses to the letters received from the Ministry of Corporate Affairs, the Stock Exchanges, the Depositories, the Securities and Exchange Board of India (SEBI) and other regulatory authorities.
iv. To review and act upon such other grievances as the Board of Directors delegate to the Committee from time to time.
6.3. Company Secretary & Compliance Officer
Name of the Company Secretary and the Compliance Officer
Mr. Rajashekhar Reddy
Designation Company Secretary and Senior General Manager – Group Legal
6.4. Details of Shareholders’ Complaints
Complaints Pending as on April 1, 2017
Complaints Received during the Year
Complaints Resolved during the Year
Complaints Pending as on March 31, 2018
Nil Nil Nil Nil
7. CORPORATE SOCIAL RESPONSIBILITY COMMITTEE
7.1. Composition, Meetings and Attendance
The Corporate Social Responsibility Committee consists of Ms. Urvi A. Piramal (Chairperson), Mr. Rajeev A. Piramal

62 Peninsula Land Limited
Statutory Reports
and Ms. Bhavna Doshi as its Members. During the Financial Year, the Corporate Social Responsibility Committee met twice, on May 9, 2017 and November 2, 2017.
Name of the Director Designation No. of Meetings during the Financial Year 2017-18
Held AttendedMs. Urvi A. Piramal Chairperson 2 2Mr. Rajeev A. Piramal Member 2 2Ms. Bhavna Doshi Member 2 2
7.2. Terms of Reference
i. Formulate and recommend to the Board, a Corporate Social Responsibility (CSR) Policy which shall indicate the activities to be undertaken by the Company as specified in the Schedule VII of the Companies Act, 2013.
ii. Recommend the amount of expenditure to be incurred on the CSR activities.
iii. Monitor the CSR policy of the Company from time to time.
iv. Such other matters the Board may delegate from time to time.
8. RISK MANAGEMENT Business Risk Evaluation and Management is an ongoing
process within the Company. The Company has a robust risk management framework to identify, monitor and minimize risks as also to identify business opportunities. For the identification, assessment and minimization of the risk, the Board constituted a Risk Management Committee to frame the Risk Management framework and to implement and monitor the same.
8.1. Composition of the Committee
The Risk Management Committee consists of five members with Mr. Rajeev A. Piramal - Executive Vice-Chairman and Managing Director, as the Chairman and Mr. Mahesh S. Gupta - Group Managing Director, Mr. Sudhindar Khanna - Independent Director, Mr. Dinesh Jain - Group CFO and Mr. Bharat Sanghavi - CFO as its members.
8.2. Terms of Reference
i. To identify potential Business Risks.
ii. To analyze the Risk and develop Risk mitigation plans, as per the Risk Management Policy.
iii. Reporting of Risk environment to the Board.
iv. To create awareness among the employees to assess risks on a continuous basis.
9. GENERAL BODY MEETINGS AND POSTAL BALLOT:9.1. Location and time, where Annual General Meeting (AGM) / Extra-Ordinary General Meeting (EGM) for the last three years were held, is given below:
Financial Year
AGM / EGM
Date Time Location
2014-15 143rd AGM
August 28, 2015
3.00 p.m. Hall of Culture, Nehru Center, Dr. Annie Besant Road, Worli, Mumbai - 400 018.
2015-16 144th
AGMAugust 5, 2016
3.00 p.m. Hall of Culture, Nehru Center, Dr. Annie Besant Road, Worli, Mumbai - 400 018.
2016-17 145th AGM
August 29, 2017
3.00 p.m. Hall of Culture, Nehru Center, Dr. Annie Besant Road, Worli, Mumbai - 400 018.
9.2. Special Resolutions passed in the previous three Annual General Meetings (AGM):
AGM Date of AGM Special Resolution143rd August 28,
2015Resolution No. 5: Re-appointment of Mr. Rajeev A. Piramal (DIN: 00044983), as Executive Vice – Chairman and Managing Director of the Company.
Resolution No. 6: Re-appointment of Mr. Mahesh S. Gupta (DIN: 00046810), as the Group Managing Director
Resolution No. 7: Issue of Non-Convertible Debentures on Private Placement Basis.
144th August 5, 2016
Resolution No. 5: Appointment of Mr. Nandan A. Piramal (DIN: 00045003) as Whole-Time Director of the Company.
Resolution No. 6: Issue of Non-Convertible Debentures on Private Placement Basis
Resolution No. 7: Alteration of Object Clause No. 13 of the Memorandum of Association.
145th August 29, 2017
None
9.3. Postal Ballot
During the Financial Year 2017-18 the following Special Resolutions were passed through Postal Ballot:
Corporate Governance Report Continued

63Annual Report 2017-18
Built for challenges. Preparing for growth.
a. Increase of the existing borrowing limits of the Company u/s 180(1)(c) of the Companies Act, 2013.
b. Creation of pledge, mortgage and/or charge on all or any part of movable/ immovable properties of the Company u/s 180(1)(a) of the Companies Act, 2013.
c. Issuance of Non-Convertible Debentures (NCDs) on Private Placement Basis.
The Notices of Postal Ballot were sent out on May 8, 2017 to the members whose names appeared in the Register of Members / list of Beneficial Owners as on April 28, 2017. Mr. Dhrumil M. Shah of M/s Dhrumil M. Shah and Co., Practising Company Secretary, Mumbai was appointed as the Scrutinizer for conducting the entire Postal Ballot
(including e-voting) process in a fair and transparent manner. In accordance with the provisions of Section 110 of the Companies Act, 2013, the company had also provided e-voting facility through Central Depository Services (India) Limited, to the members for voting on the aforementioned resolutions. The voting by way of physical Ballot Form was open till June 7, 2017 and e-voting facility was open from June 5, 2017 at 10.00 a.m. to June 7, 2017 till 5.00 p.m.
The Results of the Postal Ballot were disclosed to the stock exchanges on June 8, 2017 and simultaneously hosted on the website of the Company and on the Website of Central Depository Services (India) Limited. All the resolutions were passed with the requisite majority.
No. of Shares on which Votes
Polled
Resolution (a) Resolution (b) Resolution (c)In Favour Against In Favour Against In Favour Against
Promoter 155581772 100.00% - 100.00% - 100.00% -Non-Promoter 46178628 99.94% 0.06% 99.92% 0.08% 99.96% 0.04%
As on the date of this report the company does not propose to pass any Resolutions via Postal ballot.
10. MEANS OF COMMUNICATION The Quarterly Results were published in Business
Standard (English) and Sakal (Marathi) for part of the Financial Year and were thereafter published in Active Times (English) and Mumbai Lakshadeep (Marathi) and simultaneously hosted on the Company’s website www.peninsula.co.in and also submitted with the BSE Limited (BSE) and National Stock Exchange of India Limited (NSE).
The Management Discussion and Analysis Report forms a part of this Annual Report. The investors’ presentations and the transcripts of the investors’ conference call organized by the analysts are hosted on the website of the Company www.peninsula.co.in.
The Company’s website www.peninsula.co.in contains a separate dedicated section ‘Investors Relations’ where all the disclosures and information hosted for the benefit of the shareholders is available. The Annual Report of the Company is also available on the website in a user friendly and downloadable form.
11. GENERAL SHAREHOLDER INFORMATION
11.1. 146th Annual General Meeting
Date Time Venue
August 6, 2018 03.00 p.m. Hall of Culture, Nehru Centre, Dr. Annie Besant Road, Worli, Mumbai – 400 018.
11.2. Financial Year: 2017-18
11.3. Book Closure
The Register of Members and Share transfer books of the Company will remain closed from July 28, 2018 to August 6, 2018 (both days inclusive).
11.4. Listing of Securities on Stock Exchanges
a) Listing on Stock Exchanges (Equity Shares)
The BSE Limited (BSE) Phiroze Jeejeebhoy Towers, Dalal Street, Mumbai - 400 001.
National Stock Exchange of India Limited (NSE) Exchange Plaza, Bandra Kurla Complex, Mumbai - 400 051.
Name of the Exchange Stock Code
BSE Limited (BSE) 503031
National Stock Exchange of India Limited (NSE) PENINLAND
ISIN Demat INE138A01028
b) Listing on Wholesale Debt Market (BSE).
The Non-Convertible Debentures of the Company are Listed on the Wholesale Debt Market segment of BSE Limited.
The Company has paid Annual Listing Fees for the Financial Year 2017-18 to BSE Limited and National Stock Exchange of India Limited within the specified due date.

64 Peninsula Land Limited
Statutory Reports
11.5. Stock Market Data
The high / low of the market price of the shares of the Company is given below:
Months BSE Limited (BSE) National Stock Exchange of India Limited (NSE)
High (`) Low (`) Sensex (closing) High (`) Low (`) CNX NIFTY (Closing)
April, 2017 30.20 18.95 29918.40 30.30 18.75 9304.05May, 2017 27.45 19.00 31145.80 27.55 18.90 9621.25June, 2017 22.20 18.00 30921.61 22.45 18.50 9520.90July, 2017 23.60 18.65 32514.94 23.70 18.60 10077.10August, 2017 22.15 17.20 31730.49 22.20 17.10 9917.90September, 2017 28.40 19.20 31283.72 28.50 19.10 9788.60October, 2017 35.00 23.65 33213.13 34.90 23.70 10335.30November, 2017 39.45 27.65 33149.35 39.65 27.50 10226.55December, 2017 38.60 32.75 34056.83 38.60 32.70 10530.70January, 2018 44.00 32.35 35965.02 44.00 32.40 11027.70February, 2018 34.45 25.25 34184.04 34.70 25.00 10492.85March, 2018 29.20 19.60 32968.68 29.10 19.55 10113.70
Sources: BSE, NSE websites
Stock Performance v/s BSE Sensex and CNX Nifty
The performance of Peninsula Land Limited’s Equity Shares relative to the BSE Sensex and CNX Nifty is given in the charts below:
The Securities of the Company were not suspended from trading
11.6. Distribution of Shareholding as on March 31, 2018
Slab of shareholding
No. of share-
holders
% of share-
holders
No. of shares % of shares held
0001 to 5000 50,804 96.60% 2,84,67,844 10.20%5001 to 10000 907 1.73% 70,11,181 2.51%10001 to 20000 444 0.84% 64,43,275 2.31%20001 to 30000 170 0.32% 42,31,088 1.52%30001 to 40000 72 0.14% 25,90,455 0.93%40001 to 50000 43 0.08% 20,33,910 0.73%50001 to 100000 80 0.15% 57,65,880 2.07%100001 & Above 74 0.14% 22,26,57,587 79.75%Total 52,594 100.00% 27,92,01,220 100.00%
11.7. Shareholding Pattern as on March 31, 2018
Category No. of Share-
holders
No. of shares held
% of shares
held
A Promoters Holding 1 Indian promoters 7 15,45,81,772 55.37%2 Foreign promoters -- -- --
Category No. of Share-
holders
No. of shares held
% of shares
held
3 Persons acting in concert -- -- --Sub Total (1+2+3) / Total A 7 15,45,81,772 55.37%
B Non Promoters Holding4 Institutional Investorsa Mutual Funds and UTI 3 30,15,545 1.08%b Banks, Financial
Institutions, Insurance Companies(Central/ State Govt., Institutions/ Non Govt. Institutions)
27 1,34,44,022 4.82%
c Foreign Institutional Investors
7 1,44,29,516 5.17%
Sub-total (4a+4b+4c) 37 3,49,93,088 11.06%5 Non- Institutionala Investor Education and
Protection Fund (IEPF)1 813335 0.29%
b Private Corporate Bodies 809 3,19,82,553 11.46%c Overseas Corporate Bodies 1 2,50,000 0.09%d Indian Public 51,190 5,41,18,855 19.38%
Price v/s CNX Nifty
50
40
30
20
10
0
Month
Pric
e
CNX
Nift
y
11500
11000
10500
10000
9500
9000
8500
8000
High (`) Low (`) CNX Nifty (closing)
Apr-17
May-17
Jun-17
Jul-17
Aug-17
Sep-17
Oct-17
Nov-17
Dec-17
Jan-18
Feb-18
Mar-18
Corporate Governance Report Continued
Price v/s BSE Snesex
50
40
30
20
10
0
Month
Pric
e
BSE
Sen
sex
40,000.0035,000.0030,000.0025,000.00 20,000.0015,000.0010,000.005,000.000.00
High (`) Low (`) Sensex (closing)
Apr-17
May-17
Jun-17
Jul-17
Aug-17
Sep-17
Oct-17
Nov-17
Dec-17
Jan-18
Feb-18
Mar-18

65Annual Report 2017-18
Built for challenges. Preparing for growth.
Category No. of Share-
holders
No. of shares held
% of shares
held
e Non Resident Indians 455 13,96,622 0.50%f Clearing Member 92 7,57,693 0.27%
Sub-total (5a+5b+5c+5d+5e+5f)
52,548 8,93,19,058 31.99%
Total B 52,585 1,2,02,08,141 43.05%C Non Promoter - Non
Public - ESOP Trust 2 44,11,307 1.58%Grand total (A+B+C) 52,594 27,92,01,220 100.00%
Shareholding
Promoters 55.37% Indian Public 19.38% Private Corporate Bodies 11.46% Foreign Institutional Investors 5.15% Banks, Financial Institutions,
Insurance Companies 4.82% Non Promoter-Non Public-
ESOP Trust 1.58% Mutual Funds and UTI 1.08% Non Resident Indians 0.50% Investor Education and
Proctection Fund 0.29 Clearing Member 0.27% Overseas Corporate Bodies 0.09%
11.8. Share Transfer Agent
Freedom Registry Limited has been appointed as one point agency for dealing with shareholders. Shareholders’ correspondence should be addressed to the Company’s Share Transfer Agent at the address mentioned below:
Registered Offi ce: Freedom Registry Limited
Plot No. 101/102, 19th Street, MIDC Area Satpur, Nashik – 422 007Tel: (0253) – 2354 032 Fax: (0253) – 2351 126E-mail:[email protected]
Mumbai Liasioning Offi ce: Freedom Registry Limited
104, Bayside Mall, 35, C. M. M. Malviya Marg,Tardeo Road, Haji Ali, Mumbai – 400 034.Tel: (022) – 2352 5589
11.9. Share Transfers System (Physical Form)
The Board has delegated the authority for approving transfer, transmission, etc. of the Company’s equity shares to the Share Transfer Committee comprising of Ms. Urvi A. Piramal, Mr. Rajeev A. Piramal, Mr. Nandan A. Piramal, Mr. Mahesh S. Gupta, Directors of the Company, and Mr. Dinesh Jain, Group Chief
Financial offi cer. The Share Certifi cates in physical form are generally processed and returned within 15 days from the date of receipt, if the application and supporting documents are complete in all respects.
For administrative convenience and to facilitate speedy approvals, authority has also been delegated to Senior Executives to approve share transfers.
A summary of the transfers / transmissions so approved by the Committee and the authorized Executives is placed at every Board Meeting.
The Company obtains from a Company Secretary in practice, half-yearly certifi cate of compliance with the share transfer formalities, within the stipulated period, as required under Regulation 40 (9) of the SEBI (Listing Obligations and Disclosure Requirements) Regulations, 2015 and the same is duly fi led with the Stock Exchanges within stipulated time prescribed under the SEBI (Listing Obligations and Disclosure Requirements) Regulations, 2015.
The Company undergoes, Reconciliation of Share Capital Audit on a quarterly basis in accordance with the SEBI (Depositories and Participants) Regulations, 1996. Dhrumil M. Shah & Co., Practicing Company Secretary, has been appointed by the Company to conduct the said audit for the Financial Year 2017-18. The Reconciliation of Share Capital Audit Reports issued by Dhrumil M. Shah & Co., which are submitted to the Stock Exchanges within the stipulated period, inter-alia, confi rm that the equity shares of the Company held in dematerialized form and in physical form tally with the issued and paid-up equity share capital of the Company.
11.10. Dematerialization of shares and liquidity
As at March 31, 2018, 27,44,98,430 Equity Shares representing 98.32% of the Company’s paid-up Equity Share Capital have been dematerialized.
Trading in Equity Shares of the Company is permitted only in dematerialized form, as per the notifi cation issued by SEBI.
Shareholders seeking demat/ remat of their shares need to approach their Depository Participants (DP) with whom they maintain their respective demat accounts. The DP will generate an electronic request and will send the physical share certifi cates to the Share Transfer Agent of the Company. Upon receipt of the request and share certifi cates, the Share Transfer Agent will verify the same. Upon verifi cation, the Share Transfer Agent will request National Securities Depository Limited (NSDL)/ Central Depository Services (India) Limited (CDSL) to confi rm the demat request. The demat account of the

66 Peninsula Land Limited
Statutory Reports
respective shareholder will be credited with equivalent number of shares. In case of rejection of the request, the same shall be communicated to the shareholder.
In case of remat, upon receipt of the request from the shareholder, the DP generates a request and verifi cation of the same is done by the Share Transfer Agent. The Share Transfer Agent then requests NSDL/ CDSL to confi rm the same. Approval of the Company is sought and equivalent numbers of shares are issued in physical form to the shareholder. The share certifi cate is dispatched within one month from the date of issue of shares in physical form.
No of Shares held in Demat and Physical Mode
No. of Shares in Demat Mode 98.32%
No. of Shares in Physical Mode 1.58%
Liquidity The shares of the Company are frequently traded on the
Stock Exchange.
11.11. Outstanding GDRs/ ADRs/ Warrants or any Convertible Instruments
There are no outstanding ADRs/ GDRs/ Warrants or any convertible instruments.
11.12. Address for correspondence
Name : Mr. Rajashekhar Reddy E-mail : [email protected] Tel. No : +91-22-66229300 Fax No : +91-22-66229302
The Registered Offi ce and correspondence address: 1, Peninsula Spenta,
Mathuradas Mills Compound,Senapati Bapat Marg, Lower Parel, Mumbai – 400 013.
11.13. Details of Debenture Trustees
IDBI Trusteeship Services Ltd Asian Building, Ground Floor, 17 R. Kamani Marg, Ballard Estate, Mumbai – 400001Email : [email protected], [email protected]: www.idbitrustee.comTel.: +91-022-4080 7000; Fax: +91-022-66311776
Axis Trustee Services Limited Axis House, Ground Floor, Wadia International Centre, Pandurang Budhkar Marg, Worli Mumbai-400025 Email: [email protected] Website: www.axistrustee.com Tel: +91-022-62260054/ 0050 Fax: +91-022-43253000
Vistra ITCL (India) Limited(formerly known as IL & FS Trust Company Limited)The IL & FS Financial Centre, Plot No. C-22, G Block, 7th Floor, Bandra Kurla Complex, Bandra (East), Mumbai - 400051Email : [email protected]: www.vistraitcl.comTel: +91-22-26593535; Fax: +91-22-26533297
12. OTHER DISCLOSURES
12.1. Materially signifi cant related party transactions, pecuniary or business relationship with the Company
There have been no materially signifi cant related party transactions, pecuniary transactions or relationships that may have potential confl ict with the interests of the Company at large.
Pursuant to the requirements of Securities and Exchange Board of India (Listing Obligations and Disclosure Requirements) Regulations, 2015, the Company has formulated the policies on Material subsidiaries and on dealing with Related Party Transactions. The same are hosted on the website of the Company www.peninsula.co.in.
12.2. Details of non – compliance, penalties, strictures imposed by the Stock Exchanges or Securities and Exchange Board of India
Except for a one-off instance of delayed fi ling of Annual Report for the Year 2014-15 with the Stock Exchanges, there were no other instances of non-compliance by the Company, nor have any penalties or strictures been imposed by the Securities and Exchange Board of India or any other statutory authority during the last three years on any matter related to the capital markets.
12.3. Whistle Blower Policy/ Vigil Mechanism
The Company has established a vigil mechanism for Directors and Employees to report their genuine concerns about unethical behavior, actual or suspected fraud or violation of the Company’s Code of Conduct. The mechanism provides for adequate safeguards against victimization of the Whistle Blower. The mechanism provides for addressing the complaints to Complaints Redressal Committee and direct access to the Chairperson of the Audit Committee in exceptional circumstances.
Corporate Governance Report Continued
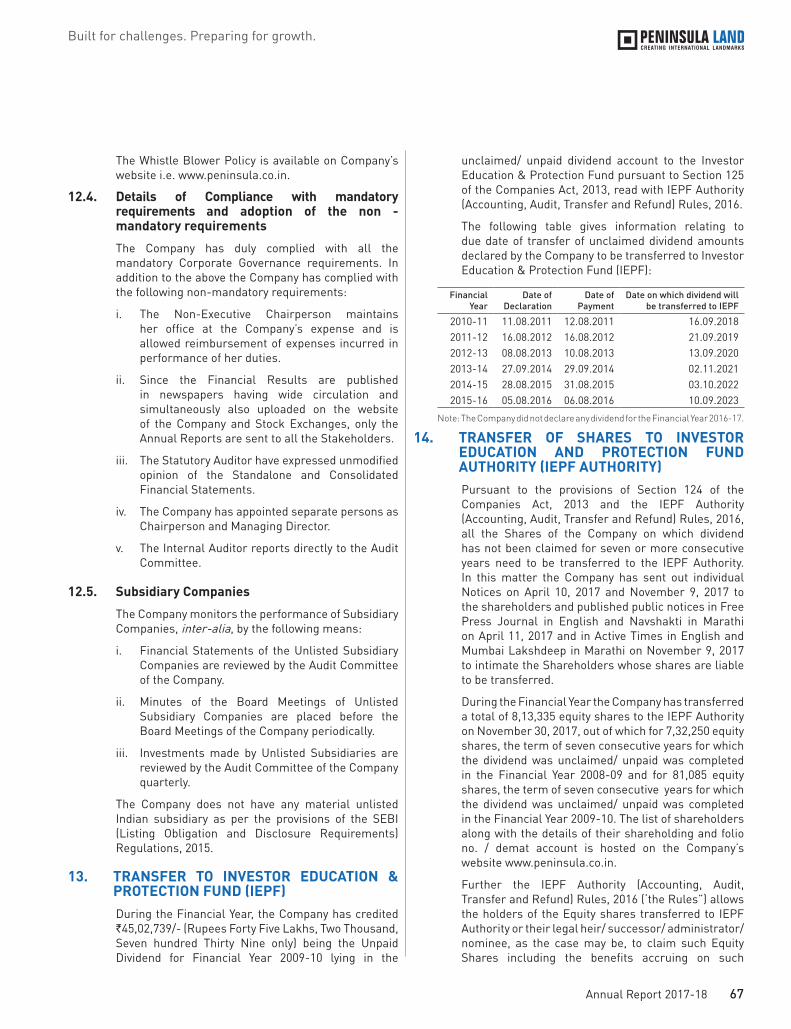
67Annual Report 2017-18
Built for challenges. Preparing for growth.
The Whistle Blower Policy is available on Company’s website i.e. www.peninsula.co.in.
12.4. Details of Compliance with mandatory requirements and adoption of the non - mandatory requirements
The Company has duly complied with all the mandatory Corporate Governance requirements. In addition to the above the Company has complied with the following non-mandatory requirements:
i. The Non-Executive Chairperson maintains her office at the Company’s expense and is allowed reimbursement of expenses incurred in performance of her duties.
ii. Since the Financial Results are published in newspapers having wide circulation and simultaneously also uploaded on the website of the Company and Stock Exchanges, only the Annual Reports are sent to all the Stakeholders.
iii. The Statutory Auditor have expressed unmodified opinion of the Standalone and Consolidated Financial Statements.
iv. The Company has appointed separate persons as Chairperson and Managing Director.
v. The Internal Auditor reports directly to the Audit Committee.
12.5. Subsidiary Companies
The Company monitors the performance of Subsidiary Companies, inter-alia, by the following means:
i. Financial Statements of the Unlisted Subsidiary Companies are reviewed by the Audit Committee of the Company.
ii. Minutes of the Board Meetings of Unlisted Subsidiary Companies are placed before the Board Meetings of the Company periodically.
iii. Investments made by Unlisted Subsidiaries are reviewed by the Audit Committee of the Company quarterly.
The Company does not have any material unlisted Indian subsidiary as per the provisions of the SEBI (Listing Obligation and Disclosure Requirements) Regulations, 2015.
13. TRANSFER TO INVESTOR EDUCATION & PROTECTION FUND (IEPF)
During the Financial Year, the Company has credited `45,02,739/- (Rupees Forty Five Lakhs, Two Thousand, Seven hundred Thirty Nine only) being the Unpaid Dividend for Financial Year 2009-10 lying in the
unclaimed/ unpaid dividend account to the Investor Education & Protection Fund pursuant to Section 125 of the Companies Act, 2013, read with IEPF Authority (Accounting, Audit, Transfer and Refund) Rules, 2016.
The following table gives information relating to due date of transfer of unclaimed dividend amounts declared by the Company to be transferred to Investor Education & Protection Fund (IEPF):
Financial Year
Date of Declaration
Date of Payment
Date on which dividend will be transferred to IEPF
2010-11 11.08.2011 12.08.2011 16.09.20182011-12 16.08.2012 16.08.2012 21.09.20192012-13 08.08.2013 10.08.2013 13.09.20202013-14 27.09.2014 29.09.2014 02.11.20212014-15 28.08.2015 31.08.2015 03.10.20222015-16 05.08.2016 06.08.2016 10.09.2023
Note: The Company did not declare any dividend for the Financial Year 2016-17.
14. TRANSFER OF SHARES TO INVESTOR EDUCATION AND PROTECTION FUND AUTHORITY (IEPF AUTHORITY)
Pursuant to the provisions of Section 124 of the Companies Act, 2013 and the IEPF Authority (Accounting, Audit, Transfer and Refund) Rules, 2016, all the Shares of the Company on which dividend has not been claimed for seven or more consecutive years need to be transferred to the IEPF Authority. In this matter the Company has sent out individual Notices on April 10, 2017 and November 9, 2017 to the shareholders and published public notices in Free Press Journal in English and Navshakti in Marathi on April 11, 2017 and in Active Times in English and Mumbai Lakshdeep in Marathi on November 9, 2017 to intimate the Shareholders whose shares are liable to be transferred.
During the Financial Year the Company has transferred a total of 8,13,335 equity shares to the IEPF Authority on November 30, 2017, out of which for 7,32,250 equity shares, the term of seven consecutive years for which the dividend was unclaimed/ unpaid was completed in the Financial Year 2008-09 and for 81,085 equity shares, the term of seven consecutive years for which the dividend was unclaimed/ unpaid was completed in the Financial Year 2009-10. The list of shareholders along with the details of their shareholding and folio no. / demat account is hosted on the Company’s website www.peninsula.co.in.
Further the IEPF Authority (Accounting, Audit, Transfer and Refund) Rules, 2016 (‘the Rules”) allows the holders of the Equity shares transferred to IEPF Authority or their legal heir/ successor/ administrator/ nominee, as the case may be, to claim such Equity Shares including the benefits accruing on such

68 Peninsula Land Limited
Statutory Reports
shares, if any, from the IEPF Authority upon following the procedure as set out in the Rules. The Rules are available on the website of the IEPF Authority at www.iepf.gov.in. Further for the convenience of the shareholders of the Company an access link to the refund webpage of IEPF Authority is available on the Company’s website www.peninsula.co.in. Should the shareholders have any queries in the matter they may address it to the Share Transfer Agent or to the Company on the dedicated E-mail address and Phone Number (as stated below).
E-mail address : [email protected] Mobile : +91 91520 41660
15. NON–COMPLIANCE OF ANY REQUIREMENT OF CORPORATE GOVERNANCE REPORT
The Company has complied with all mandatory requirements as mentioned in Schedule V, Para C, sub-paras (2) to (10) of Securities and Exchange Board of India (Listing Obligations and Disclosure Requirements) Regulations, 2015 along with some of the non-mandatory requirements.
16. COMPLIANCE WITH SECURITIES AND EXCHANGE BOARD OF INDIA (LISTING OBLIGATIONS AND DISCLOSURE REQUIREMENTS) REGULATIONS, 2015
The Company has complied with all the requirements as specified in the Securities and Exchange Board of India (Listing Obligations and Disclosure Requirements) Regulations, 2015 including the Corporate Governance requirements specified
under Regulation 17 to 27 and clauses (b) to (i) of sub-regulations (2) of Regulation 46. The Quarterly Report on Corporate Governance, containing details of compliances, is submitted with BSE Limited and National Stock Exchange of India Limited within statutory timelines. The report is also hosted on the Company's website www.peninsula.co.in.
17. DISCLOSURES WITH RESPECT TO SUSPENSE ACCOUNT/ UNCLAIMED SUSPENSE ACCOUNT
Sr. No.
Particulars Status
1 Aggregate number of shareholders and the outstanding shares in the suspense account lying at the beginning of the year i.e. as on April 1, 2017
Nil
2 Number of shareholders who approached issuer for transfer of shares from suspense account during the year 2017-2018
Nil
3 Number of shareholders to whom shares were transferred from suspense account during the year 2017-2018
Nil
4 Aggregate number of shareholders and the outstanding shares in the suspense account lying at the end of the year March 31, 2018
Nil
By Order of the BoardFor Peninsula Land Limited
Sd/-
Urvi A. Piramal Non-Executive Chairperson Place: MumbaiDate: May 23, 2018
Corporate Governance Report Continued

69Annual Report 2017-18
Built for challenges. Preparing for growth.
Declaration regarding Compliance by Board Members and Senior Management Personnel with the Company’s Code of ConductTo,
The Members of Peninsula Land Limited
Declaration by the Managing Director under SEBI (Listing Obligations and Disclosure Requirement) Regulations, 2015
I, Rajeev A. Piramal, Executive Vice-Chairman & Managing Director of Peninsula Land Limited hereby declare that all the members of the Board of Directors and Senior Management Personnel have affirmed compliance with the Code of Conduct for the Financial Year ended March 31, 2018.
Sd/-
Rajeev A Piramal Executive Vice-Chairman & Managing Director
Place: MumbaiDate: May 23, 2018
CERTIFICATE ON CORPORATE GOVERNANCE
To the Members of Peninsula Land Limited Mumbai
We have examined the compliance with conditions of Corporate Governance by Peninsula Land Limited (‘the Company’), for the year ended on March 31, 2018, as stipulated in SEBI (Listing Obligations and Disclosure Requirements) Regulations, 2015 to the extent applicable.
The compliance with conditions of Corporate Governance is the responsibility of the management. Our examination was limited to the procedures and implementation thereof adopted by the Company for ensuring the compliance of the conditions of the Corporate Governance. It is neither an audit nor an expression of opinion on the financial statements of the Company.
In our opinion and to the best of our information and according to the explanations given to us and the representations made by the management, we certify that the Company has complied with the conditions of Corporate Governance as stipulated in the above mentioned Regulations.
We further state that such compliance is neither an assurance as to the future viability of the Company nor the efficiency or effectiveness which the management has conducted the affairs of the Company.
For Nilesh Shah & AssociatesCompany Secretaries
Sd/-
(Nilesh Shah)Partner (FCS - 4554)
C.P.No: 2631
Date: May 23, 2018 Place: Mumbai

Statutory Reports
70 Peninsula Land Limited
Management Discussion and Analysis
Economic Overview
Global Economy
The global economy sprung a positive surprise in 2017 with broad-based improvement in most countries. Pickup in investment, stable earnings and gradual tightening of monetary policies of the world’s leading economies were instrumental in driving this surge. The US economy benefited from implementation of tax reforms (lower corporate tax rates, allowing full expensing of investment, etc.), robust activity and favourable monetary policies in 2017. Consequently, the US GDP grew 2.3% in 2017 which is a good 80 basis points improvement over 2016. The year also witnessed Eurozone posting a 10-year high growth of 2.5% on strong domestic demand and higher exports. The upswing in world trade enabled China to post its highest growth since 2015. Riding high on the strong momentum in its exports, the world’s second largest economy grew 6.9% in 2017.
All-round improvement in global economies rubbed off favourably on the global real estate market which registered decade-high investments and leasing volumes in 2017. As per Prequin, investment volumes grew 20% in 2017 as compared to 2016. China and Hong Kong topped the list of private equity deals in the real estate sector in 2017. As against 1.2 times increase in global real estate deal value since 2013, this metric has grown by 3.3 times in Asia in the same period.
Global Growth
Particulars In % Projections
2016 2017 2018 2019
World Output 3.2 3.7 3.9 3.9Advanced Economies 1.7 2.3 2.3 2.2United States 1.5 2.3 2.7 2.5Euro Area 1.8 2.4 2.2 2.0Japan 0.9 1.8 1.2 0.9United Kingdom 1.9 1.7 1.5 1.5Other Advanced Economies* 2.3 2.7 2.6 2.6Emerging Market and Developing Economies 4.4 4.7 4.9 5.0China 6.7 6.8 6.6 6.4India** 7.1 6.7 7.4 7.8
* Excludes the G7 (Canada, France, Germany, Italy, Japan, United Kingdom, United States) and euro area countries** For India, data and forecasts are presented on a fiscal year basis and GDP from 2011 onwards is based on GDP at market prices with 2011/12 as the base year
Source: International Monetary Fund (IMF)

Built for challenges. Preparing for growth.
71Annual Report 2017-18
Outlook
Against this backdrop, it is not surprising that International Monetary Fund (IMF) raised its global growth estimates for 2018 and 2019 to 3.9% from 3.5% in 2017. As strength in both investments and global trade is expected to continue, economies with large exports stand to benefit the most. Monetary policies around the world are expected to normalise over the next two years to realign liquidity and interest rates with the higher growth. Buoyant investments coupled with an uptick in capital expenditure incurred by corporates will be the other drivers of global growth in 2018.
Indian Economy
India retained its position as the world’s fastest growing major economy in the January-March quarter. India’s GDP growth accelerated to 7.7% in the March quarter – the fastest pace of growth in seven quarters. Strong growth in the agriculture, manufacturing, and construction sectors contributed to the overall growth. For the full year (2017-18), GDP expanded at 6.7%.
The Reserve Bank of India (RBI) adopted an accommodative policy stance in 2017-18 and kept key rates largely unchanged.
The index of consumer price inflation stood at 4.28% in March 2018, slowing for the third straight month from a 17-month high supported by stable price components and particularly from food and beverages. Industrial growth recovered with the IIP registering an impressive growth rate of 7.5% in January 2018 compared to 2.4% in January 2017. The cumulative growth for April-January 2017-18 stood at 3.7% in contrast to 5.1% growth during April-January 2016-17.
Even as banks continue to grapple with burgeoning bad loans, a host of reputed corporates have stepped up focus on housing loans with some even setting up dedicated housing/affordable housing funds to finance projects. Thus, both consumers and good developers are able to get support from the financial institutions. With improving disclosure standards and transparency across the sector, most banks and NBFCs are warming up to extend loans to reputed developers. Some reputed corporate houses are focusing dedicatedly on providing funding to developers via various instruments and are also exploring acquisition financing keenly.
Annual GDP Growth Rate (%)
8.2
2015
-16
7.1
2016
-17
6.7
2017
-18
Source: Central Statistics Office (CSO)
Outlook
Indian economic growth is likely to pick up in 2018-19. Though there are upside risks to inflation, this metric is expected to remain range-bound in the short-term. As global economy is expected to grow at a healthy rate, India’s exports too are likely to improve in the coming year. Disruptions caused by GST implementation will smoothen out gradually and benefit economic activity across the country. Continued focus on reforms will be instrumental in boosting India’s economic growth. Higher tax revenues and increasing formalisation across sectors are among the key benefits of GST and will ensure long-term and consistent growth of the economy.
Continued focus on reforms will be instrumental in boosting India’s economic growth.

Statutory Reports
72 Peninsula Land Limited
Management Discussion and Analysis
Real Estate Industry OverviewThe Indian real estate sector has changed significantly over the past couple of years. With a firm eye on improving transparency, disclosure standards and customer convenience, the Government implemented a host of reforms. The prominent reforms include Real Estate (Regulation and Development) Act (RERA), Goods and Services Tax (GST) Act and Real Estate Investment Trusts (REITs). All these measures are beneficial for the sector over the medium-to longer-term horizon.
However, adoption of these reforms required developers to make significant alterations to their business models as well as practices. Even as GST implementation required a complete overhaul of their accounting policies, RERA required developers to spell out project completion timelines and adhere to them strictly. Such disruptions led to a virtual freeze on new launches in the sector.
As per Cushman & Wakefield data, residential new unit launches in India’s top eight cities fell 35% to ~74,000 units
in 2017. Affordable housing was the only segment to register growth in 2017 with new launch growth of 6%. Slower pace of new launches and adoption of stricter project timelines led to gradual reduction in inventories held by developers.
Positively, implementation of above reforms improved customer as well as investor confidence in the sector. Some of the largest investments (private equity, venture capital) took place in the real estate sector in 2017. The second largest employment generating sector in the country is thus well poised to benefit from these path-breaking reforms in the coming years.
Rising per capita income, continuing urbanisation, increasing number of nuclear families are key macro trends that will fuel growth of the real estate sector. Favourable Government policies, interest subvention and other incentives offered to home buyers will aid the demand scenario.
Government Initiatives
In a bid to clean up the practices in the real estate sector – particularly those adopted by the small and unorganised developers – the Government of India implemented a host of reforms in the past few years. These reforms aim to address issues such as red-tape, delay in approvals, slower project execution, handover of flats and lack of transparency and revitalise the sector. Some of the prominent reforms and their impact on the sector are explained below.
Real Estate (Regulation and Development) Act (RERA)
DEVELOPERS Registration with RERA a must Keep aside 70% of sale proceeds separately and use
them only for construction of the project Can’t charge for areas outside the walls
BUYERS Increased transparency in transactions Easy access to information of the project Timely possession, no cost over runs
RERA IMPACT
INTERMEDIARIES/BROKERS Cant sell/market or advertise a project without
registering the Company with RERA All advertisements/marketing must have registration
number Must maintain separate accounts & records for
each project
INVESTORS/PE FUNDS Lower misrepresentation of facts Higher transparency/regulations to aid returns Higher interest from long-term PE investors
Favourable Government policies, interest subvention and other incentives offered to home buyers will aid the demand scenario.

Built for challenges. Preparing for growth.
73Annual Report 2017-18
The above section explains in detail the impact of RERA on various stakeholders of the real estate sector. The Act, implemented from May 1, 2017, has regulated allocation of revenue collected as sale proceeds by developers while mandating registration and streamlining the charges levied by developers. In case of brokers and other intermediaries, the Act seeks to promote marketing and selling of only those projects that are registered under RERA. The Act is largely customer friendly and aims to improve transparency in transactions and ensure timely possession of under-construction homes. Adherence to this law will make the sector more attractive to long-term investors who seek reliable facts, better transparency and disclosure from the developers.
Despite the moderate pace of RERA implementation, large organised developers are already seeing some green shoots. Rising compliance and regulatory requirements under RERA and GST have made erstwhile business models of small unorganised developers redundant. Developers who fail to meet the RERA guidelines and/or project completion timelines will end up paying heavy penalties – which has led to most small developers reworking their business models and practices. While some have shut shop, most are looking to form joint development agreements and marketing agreements with their larger peers. This scenario offers interesting growth opportunities for large players who enjoy strong brand equity and have adopted industry leading practices since past many years. Under RERA, customer grievance redressal is gathering pace as most state governments have set up dedicated tribunals to resolve conflicts.
Goods and Services Tax (GST)
The GST brought under-construction properties under the tax net. In the pre-GST period, a service tax/VAT of ~6% was levied on under-construction properties. Under GST, an effective rate of 12% (excluding stamp duty/registration) was initially levied on under-construction projects. The builders can claim input tax credit which was not available earlier. However, given that GST is an add-on cost over and above the overall price of a property, it dampened home-buyers’
sentiments to some extent. Most reputed builders extended GST discounts to the end consumers which in turn pruned their own net realisations.
Responding to the pleas made by industry players to rationalise the tax incidence, the Government provided some relief and announced a concessional GST rate of 8% (from 12%) for the affordable housing segment. The change is a step in the right direction and will further boost the prospects of this segment. Similar concessions can also be given to projects that do not fall under the affordable housing segment. Steps like these will boost not just consumption but also employment, as developers will become confident to start new projects.
Implementation of GST will lead to a drop in cash transaction in the real estate industry, besides making their supply chains a lot more organised than before. The Government of India is looking to extend levy of GST on to land as well. When implemented, it will lead to higher transparency in land deals.
Real Estate Investment Trusts (REITs)
The framework and guidelines for REITs was announced in India in 2014 but despite continuous amendments and improvisations, REITs have failed to take off in India. REITs are investment vehicles akin to mutual funds. REITs own, operate and manage a portfolio of income-generating properties and are aimed at delivering regular returns to investors. REITs have proven to be an effective tool globally for fund raising by developers, but Indian investors have not shown much interest in them so far. This trend could change going forward.
Adherence to RERA will make the sector more attractive to long-term investors who seek reliable facts, better transparency and disclosure from the developers.

Statutory Reports
74 Peninsula Land Limited
As per a report by JLL India, there is over $20 billion worth of REIT-able office stock available in India with potential rental yield of up to 7.5%. They believe pickup in office REITs could lead to launch of retail asset REITs. Surely, REITs offer a win-win scenario to both investors in the form of regular returns as well as to the developers who can meet their liquidity requirements through this instrument.
Affordable Housing
To provide ‘Housing for All’ by 2022, the Government has been rolling out incentives to boost demand and to address supply side issues in the affordable housing segment. These include grant of infrastructure status to the affordable housing sector, which will ensure timely and low-cost funding for the sector. Home buyers can also avail incentives such as lower interest rate, credit of the entire subsidy of 20-year loan to the applicant’s loan account, withdrawal of up to 90% from the employees’ provident fund, etc. while purchasing homes in this segment. It is therefore not surprising that many large, reputed developers have ventured into the affordable housing segment.
Policy Initiatives
Extension of the Pradhan Mantri Awas Yojana (PMAY) till March 2022 with continued benefit of interest subsidy to home buyers
Increase of carpet area of homes under the PMAY scheme to extend benefits to more projects – especially in the Tier 2 and Tier 3 cities where home sizes are larger than that in metros
Announcement of eight public-private partnership projects by the Ministry of Housing and Urban Affairs to step up private sector participation in the affordable housing segment
Allocation of `275 billion to the PMAY scheme in Budget 2018-19
Government’s plans to build 100 smart cities will also drive growth of the real estate sector in the future
Outlook
As per a recent report by JLL India, the Indian real estate sector is likely to grow to $180 billion by 2020 compared to $126 billion in 2015. Contribution from the housing sector could also surge to 11% of GDP by 2020 from 5%-6% of GDP levels in 2015. Continued reforms to make the sector customer
and investor friendly, rising urbanisation, surge in number of nuclear families, rising household income are amongst the key drivers for the sector.
As per JLL India, relaxation of Foreign Direct Investment (FDI) policy by the Government has led to an increase of 12% in investments (private equity and debt) in the sector in 2017. Affordable housing, office segment and warehousing and logistics will continue to attract more investments in the future.
Residential Real EstateThe triple whammy of demonetisation, RERA and GST had a bearing on the residential real estate market in 2017. New launches fell for the second year in a row with only new launches in affordable housing witnessing marginal growth in the year. Developers had to realign their business models to comply with RERA and GST. Given the halt on new launches, inventory levels could drop in 2018, which could also be accompanied with price corrections in some markets. The year 2018 is likely to witness improvement in the sector with affordable housing segment leading from the front.
Yearly launches – ResidentialIn ‘000s no. of units
Years Launches Sales
2010 480 3612011 466 3692012 458 3592013 420 3292014 320 2802015 244 2682016 176 2452017 104 228
Mumbai, NCR, Pune, Bengaluru, Chennai, Hyderabad, Kolkata, AhmedabadSource: Knight Frank India
Mumbai
The Mumbai Metropolitan Region (MMR) was on top in terms of new residential launches in 2017 with ~48,000 units being launched. Prices dropped by 10-15% in Mumbai in the year gone by. Apart from the regulatory revolution, clear price discounts for the first time in several years played a significant role across the Mumbai market.
Pune
Pune added close to 14,000 new units in 2017 and was the fourth largest contributor to new residential launches in the year. Effective prices fell at a rapid pace in Pune – down 10-15%. For the first time in this decade (2011 – 2020), there was reduction in quoted prices in Pune. The weighted average prices in Pune residential market reduced by 7% y-o-y.
Management Discussion and Analysis
REITs have proven to be an effective tool globally for fund raising by developers, but Indian investors have not shown much interest in them so far.

Built for challenges. Preparing for growth.
75Annual Report 2017-18
Bengaluru
New launches stood at ~16,000 units in Bengaluru in the year gone by. The fortunes of this city’s real estate market are synced closely with the growth of the IT and ITES sector in the city. North and South zones have witnessed maximum reduction in new launches, registering a y-o-y decline of 66% and 52%, respectively, in H2 2017, as developers have put new project launches on the backburner while they prioritise RERA compliance. On a y-o-y basis too, overall city launches declined by 37% in H2 2017.
Outlook
As the industry settles down post the disruption caused by RERA and GST implementation, the residential market is likely to witness gradual pick up in 2018. Affordable housing will continue to drive growth. Correction in prices coupled with slowing pace of new launches will lead to a fall in inventory levels. As per an analysis done by Cushman & Wakefield, average unsold inventory stood at 50-52% in Mumbai MMR region till August 2017. This in turn will correct the demand-supply mismatch to some extent in the coming years.
Commercial Real EstateSlowdown in the technology sector weighed on the commercial real estate sector in 2017. After falling for two years in a row, new completions registered a 7% growth in 2017 but fell short of demand. This indicates that there is enough demand in the market for additional new completions. Transactions remained largely stable in the previous year with Bengaluru, Mumbai and NCR being the top three cities. Vacancy levels hit a five-year low of 11.6%, reflecting the supply crunch. Vacancy was lowest in Bengaluru, with most technology-focused cities posting single-digit vacancy. The trend of co-working spaces gaining momentum, continued in 2017 as well. More than half of the large deals in the office space were in the IT-ITES and BPO spaces. BFSI and e-commerce occupied the second and third spots in total deals in 2017. Chennai, Hyderabad and Bengaluru witnessed highest growth in rentals on the back of strong pre-commitments.
Yearly trends – CommercialMillion sq. ft.
Years New completions Transactions
2013 35.3 33.62014 36.5 38.62015 34.5 41.12016 30.7 41.62017 32.7 41.7
Mumbai, NCR, Pune, Bengaluru, Chennai, Hyderabad, Kolkata, AhmedabadSource: Knight Frank India
Outlook
Thanks to the low vacancy levels in major cities, pre-commitments are likely to remain at elevated levels in 2018 – particularly in large spaces such as the SEZs. IT-ITES and BPO companies will continue to explore Tier 2 and Tier 3 cities that offer lower rentals and help them keep their costs under check. Companies in the technology, engineering and BFSI sectors will continue to drive demand for office space going forward. Co-working spaces will continue to grow. Rents are likely to stay firm with some rise not being ruled out. As supply improves gradually, vacancy levels are likely to remain stable.
Companies in the technology, engineering and BFSI sectors will continue to drive demand for office space going forward.
Company OverviewA part of the Ashok Piramal Group, Peninsula Land Limited is well-known for creating international landmarks in India. With 20 years of strong track record of real estate development,
Companies in the technology, engineering and BFSI sectors will continue to drive demand for office space going forward.

Statutory Reports
76 Peninsula Land Limited
the Company is a pioneer in the Mumbai real estate market. It has a robust pipeline with major presence in three cities – Mumbai, Pune and Bengaluru. The Company’s project portfolio includes retail ventures, world-class commercial projects and residential complexes, amongst which some of the landmark projects in Mumbai are Peninsula Corporate Park, Peninsula Techno park, Peninsula Business Park, Ashok Towers, Ashok Gardens and Crossroads. With a large bank of professionals and immense experience and knowledge in the real estate sector, the Company has a track record of delivering 7.4 million sq. ft. of project development.
Completion Status of Ongoing Projects
ProjectPercentage completion
(%)
Saleable area
(000’ sq. ft.)
BishopsGate, Mumbai 84 93Celestia Spaces (PLL Share), Mumbai 66 490Carmichael Residences, Mumbai 86 146Salsette 27 Byculla, Mumbai 18 915Peninsula Heights, Bengaluru 66 620Ashok Nirvaan, Lonavala 63 352Ashok Beleza, Goa 99 200
Affordable Housing: The Next Growth Frontier
The affordable housing segment will be a key beneficiary of the Government’s continued thrust on achieving housing for all by
2022. In fact, this segment was the only growing piece in 2017 in the residential real estate market.
While the Government of India has extended a whole host of incentives to home buyers to boost demand, developers are not left out either. Profits earned by projects classified as affordable housing under section 80IB of the Income Tax Act, 1961, are eligible to claim 100% tax exemptions subject to fulfilment of certain criteria. Completion of such a project within five years from approval date is one key criteria to claim this exemption. Large, reputed developers with proven execution track record are best placed to capitalise on the growth opportunity as well as the tax exemptions available in the affordable housing segment.
Peninsula Land is looking to tap into this huge growth opportunity and has recently launched a project ‘addressOne’ in Gahunje, Pune, in this segment. The Company proposes to develop its 51 acre land parcel at Gahunje, Pune, into affordable housing in phases over a period of time. Designed by renowned architect Hafeez Contractor, the project falls under the PMAY scheme and will offer all amenities offered by luxurious residential projects at affordable price points. The project is located strategically in the Gahunje region, which has good potential for development in the coming years.
The units are priced attractively between `18 lakh to `38 lakh. The Company will develop 904 flats in the initial phase spread across 51 four-storeyed buildings having four apartments on each floor. The Company aims to start construction on this project post monsoon of 2018 and will complete it by early 2021.
Management Discussion and Analysis

Built for challenges. Preparing for growth.
77Annual Report 2017-18
This project will be funded via a mix of internal accruals and construction finance availed from banks.
The affordable housing opportunity:
PMAY scheme
Targeted homes by 2022 In lakh
Urban 40.6Rural 95.4
Overall StrategyGoing forward, the Company plans to go about executing ongoing projects within envisaged time frame, reduce debt by monetising non-core land parcels and by adopting asset-light models in the acquisition of any new projects.
Simultaneously, the Company is also working to create a unique value preposition to position ourselves in the market in addition to scouting opportunities across different asset classes and geographies to diversify risks and grow further.
Financial Review
Snapshot (` in crore)
Year 2017-18
Revenue 673EBIDTA 149PAT (327)
Risk ManagementAt Peninsula Land, we have constituted a five-member risk management committee comprising of people with diverse backgrounds to not just oversee but also efficiently manage and mitigate the risks facing the Company. The committee meets regularly and is actively involved in identification of any potential risk and deals with mitigation measures.
Internal Control SystemsEffective internal control systems are of paramount importance for a company like Peninsula Land where every project demands a unique set of employees and partners. The Company through a set of well-established internal control systems promotes adherence to prescribed processes and procedures, ethical conduct, transparent and reliable reporting, periodic monitoring by the designated personnel.
The internal control system ensures timely recording of important transactions, maintenance of financial records, optimal utilisation of the Company’s resources and
preservation of the Company’s assets. It has a professionally managed internal team in place, which carries out the internal audits from time to time. The team reviews the practices carried out by Company in following various SOPs in execution of projects. It suggests benchmark policies followed in the sector to upgrade the methods followed by the Company.
In the beginning of every year, the Audit Committee in consultation with independent internal auditors and the management finalises the audit plan for the year. The Committee also periodically reviews different risk and shares the findings with the management, respective owners and other stakeholders and post discussion takes appropriate action.
Human AssetsPeninsula Land offers its team of 287 professionals a dynamic and rewarding work culture, with the constant endeavour to drive innovation and entrepreneurship. The team focuses on offering value to customers on a continuous basis and is instrumental in driving the Company’s success. Peninsula Land undertakes various employee engagement initiatives and regular reviews to attain a fine balance between performance and commensurate compensation so that the organisational and employee interests are aligned.
Cautionary StatementCertain statements in this report describing the Company’s objectives, projections, estimates, expectations or predictions may be forward-looking statements within the meaning of applicable securities, laws and regulations. Although the expectations are based on reasonable assumptions, the actual results could materially differ from those expressed or implied.
Peninsula Land undertakes various employee engagement initiatives and regular reviews to attain a fine balance between performance and commensurate compensation so that the organisational and employee interests are aligned.

78 Peninsula Land Limited
Financial Statements
Independent Auditor’s ReportTo the Members of Peninsula Land Limited
Report on the Standalone Ind AS Financial StatementsWe have audited the accompanying standalone Ind AS financial statements of Peninsula Land Limited (“the Company”), which comprise the Balance Sheet as at March 31, 2018, the Statement of Profit and Loss, including the statement of Other Comprehensive Income, the Cash Flow Statement and the Statement of Changes in Equity for the year then ended, and a summary of significant accounting policies and other explanatory information.
Management’s Responsibility for the Standalone Ind
AS Financial Statements
The Company’s Board of Directors is responsible for the matters stated in Section 134(5) of the Companies Act, 2013 (“the Act”) with respect to the preparation of these standalone Ind AS financial statements that give a true and fair view of the financial position, financial performance including other comprehensive income, cash flows and changes in equity of the Company in accordance with accounting principles generally accepted in India, including the Indian Accounting Standards (Ind AS) specified under section 133 of the Act., read with the Companies (Indian Accounting Standards) Rules, 2015, as amended. This responsibility also includes maintenance of adequate accounting records in accordance with the provisions of the Act for safeguarding of the assets of the Company and for preventing and detecting frauds and other irregularities; selection and application of appropriate accounting policies; making judgments and estimates that are reasonable and prudent; and the design, implementation and maintenance of adequate internal financial control that were operating effectively for ensuring the accuracy and completeness of the accounting records, relevant to the preparation and presentation of the Ind AS financial statements that give a true and fair view and are free from material misstatement, whether due to fraud or error.
Auditor’s Responsibility
Our responsibility is to express an opinion on these standalone Ind AS financial statements based on our audit. We have taken into account the provisions of the Act, the accounting and auditing standards and matters which are required to be included in the audit report under the provisions of the Act and the Rules made thereunder. We conducted our audit of the standalone Ind AS financial statements in accordance with the Standards on Auditing, issued by the Institute of Chartered Accountants of India, as specified under Section 143(10) of the Act. Those Standards require that we comply with ethical requirements and plan and perform the audit to obtain reasonable assurance about whether the financial statements are free from material misstatement.
An audit involves performing procedures to obtain audit evidence about the amounts and disclosures in the financial statements. The procedures selected depend on the auditor’s judgment,
including the assessment of the risks of material misstatement of the standalone Ind AS financial statements, whether due to fraud or error. In making those risk assessments, the auditor considers internal financial control relevant to the Company’s preparation of the standalone Ind AS financial statements that give a true and fair view in order to design audit procedures that are appropriate in the circumstances. An audit also includes evaluating the appropriateness of accounting policies used and the reasonableness of the accounting estimates made by the Company’s Directors, as well as evaluating the overall presentation of the standalone Ind AS financial statements. We believe that the audit evidence we have obtained is sufficient and appropriate to provide a basis for our audit opinion on the standalone Ind AS financial statements.
Opinion
In our opinion and to the best of our information and according to the explanations given to us, the standalone Ind AS financial statements give the information required by the Act in the manner so required and give a true and fair view in conformity with the accounting principles generally accepted in India, of the state of affairs of the Company as at March 31, 2018, its loss including other comprehensive income, its cash flows and the changes in equity for the year ended on that date.
Other Matter
The Ind AS financial statements of the Company for the year ended March 31, 2017, included in these standalone Ind AS financial statements, have been audited by the predecessor auditor who expressed a modified opinion on those statements on May 9, 2017.
Report on Other Legal and Regulatory Requirements
1. As required by the Companies (Auditor’s report) Order, 2016 (“the Order”) issued by the Central Government of India in terms of sub-section (11) of section 143 of the Act, we give in the Annexure 1 a statement on the matters specified in paragraphs 3 and 4 of the Order.
2. As required by section 143 (3) of the Act, we report that:
(a) We have sought and obtained all the information and explanations which to the best of our knowledge and belief were necessary for the purpose of our audit;
(b) In our opinion, proper books of account as required by law have been kept by the Company so far as it appears from our examination of those books;
(c) The Balance Sheet, Statement of Profit and Loss including the Statement of Other Comprehensive Income, the Cash Flow Statement and Statement of Changes in Equity dealt with by this Report are in agreement with the books of account;

79Annual Report 2017-18
Built for challenges. Preparing for growth.
(d) In our opinion, the aforesaid standalone Ind AS financial statements comply with the Accounting Standards specified under section 133 of the Act, read with Companies (Indian Accounting Standards) Rules, 2015, as amended;
(e) On the basis of written representations received from the directors as on March 31, 2018, and taken on record by the Board of Directors, none of the directors is disqualified as on March 31, 2018, from being appointed as a director in terms of section 164 (2) of the Act;
(f) With respect to the adequacy of the internal financial controls over financial reporting of the Company with reference to these standalone Ind AS financial statements and the operating effectiveness of such controls, refer to our separate Report in Annexure 2 to this report;
(g) With respect to the other matters to be included in the Auditor’s Report in accordance with Rule 11 of the Companies (Audit and Auditors) Rules, 2014, in our opinion and to the best of our information and according to the explanations given to us:
i. The Company has disclosed the impact of pending litigations on its financial position in
its standalone Ind AS financial statements – Refer Note 35 to the standalone Ind AS financial statements;
ii. The Company has made provision, as required under the applicable accounting standards, for material foreseeable losses on long-term contracts (including derivative contracts) – Refer Note 23 to the financial statements.
iii. There were no amounts which were required to be transferred to the Investor Education and Protection Fund by the Company.
For S R B C & CO LLPChartered AccountantsICAI Firm Registration Number: 324982E/E300003
per Sudhir SoniPartnerMembership Number: 41870
Place of Signature: Mumbai
Date: May 23, 2018

80 Peninsula Land Limited
Financial Statements
Independent Auditor’s Report Continued
Annexure 1 referred to in paragraph 1 under the heading “Report on Other Legal and Regulatory Requirements” of our report of even date
Re: Peninsula Land Limited (‘the Company’)
(i) (a) The Company has maintained proper records showing full particulars, including quantitative details and situation of fixed assets.
(b) All fixed assets were physically verified by the management in the previous year in accordance with a planned programme of verifying them once in two years which, in our opinion, is reasonable having regard to the size of the Company and the nature of its assets. No material discrepancies were noticed on such verification.
(c) According to the information and explanations given by the management the title deeds of immovable properties included in property, plant and equipment/ fixed assets are held in the name of the company except 1 number of immovable properties aggregating Rs. 0.055 crores as at March 31, 2018 acquired during merger for which title deed were not available with the Company and hence we are unable to comment on the same.
(ii) The inventory has been physically verified by the management during the year. In our opinion, the frequency of verification is reasonable. No material discrepancies were noticed on such physical verification. Inventories lying with third parties have been confirmed by them as at March 31, 2018 and no material discrepancies were noticed in respect of such confirmations.
(iii) (a) The Company has granted loans to parties covered in the register maintained under section 189 of the Companies Act, 2013. In our opinion and according to the information and explanations given to us, the terms and conditions of the grant of such loans are not prejudicial to the company's interest.
(b) The schedule of repayment of principal and payment of interest in respect of current loans has not been stipulated. These loans are repayable on demand and interest and principal has been received whenever demanded by the Company. Accordingly, we are unable to comment whether the repayments or receipts are regular and unable to report amounts overdue for more than ninety days, if any, as required under paragraph 3 (iii) (c) of the Order. We are informed that the company has not demanded repayment of any
such loan during the year, and thus, there has been no default on the part of the parties to whom the money has been lent. The payment of interest has been regular.
(c) There are no amounts of loans granted to companies, firms or other parties listed in the register maintained under section 189 of the Companies Act, 2013 which are overdue for more than ninety days.
(iv) In our opinion and according to the information and explanations given to us, provisions of section 185 and 186 of the Companies Act 2013 in respect of loans to entities in which directors are interested and in respect of loans and advances given, investments made and, guarantees, and securities given have been complied with by the Company, as applicable.
(v) The Company has not accepted any deposits from the public.
(vi) The Central Government has prescribed the maintenance of cost records for the products/services of the Company under sub-section (1) of Section 148 of the Act and the rules framed there under. However, as represented by the management of the Company, these records are not required to be made and maintained in case the projects are only residential in nature. Accordingly, the Management has not made and maintained the prescribed accounts and records.
(vii) (a) Undisputed statutory dues including provident fund, employees’ state insurance, income-tax, sales-tax, service tax, value added tax, goods and service tax, cess and other statutory dues have generally been regularly deposited with the appropriate authorities though there has been slight delay in few cases. The provisions relating to duty of excise and duty of custom are not applicable to the Company.
(b) According to the information and explanations given to us, no undisputed amounts payable in respect of provident fund, employees’ state insurance, income-tax, service tax, sales-tax, value added tax, goods and service tax, cess and other statutory dues were outstanding, at the year end, for a period of more than six months from the date they became payable. The provisions relating to duty of excise and duty of custom are not applicable to the Company.

81Annual Report 2017-18
Built for challenges. Preparing for growth.
(c) According to the records of the Company, the dues of income-tax, sales-tax, service tax, duty of custom,
duty of excise, value added tax and cess on account of any dispute, are as follows:
Name of the statute Nature of the dues Amount (Rs. In crores)
Period to which the amount relates
Forum where the dispute is pending
Remarks, if any
Maharashtra Value Added Tax Act, 2002 Value Added Tax 49.76 FY 2006 – 07 to FY 2010-11
Deputy Commissioner of Sales Tax Appeals
None
Mumbai Municipal Corporation Act, 1888 Property Tax 0.89 Oct 2012 to Mar 2018
Mumbai High Court None
(viii) In our opinion and according to the information and explanations given by the management, the Company has not defaulted in repayment of loans or borrowings to a financial institution, bank or government or dues to debenture holders.
(ix) In our opinion and according to the information and explanations given by the management, the Company has utilized the monies raised by way of instruments in the nature of Debentures and term loans for the purposes for which they were raised.
(x) Based upon the audit procedures performed for the purpose of reporting the true and fair view of the financial statements and according to the information and explanations given by the management, we report that no fraud by the company or no fraud on the company by the officers and employees of the Company has been noticed or reported during the year.
(xi) According to the information and explanations given by the management, the managerial remuneration has been paid / provided in accordance with the requisite approvals mandated by the provisions of section 197 read with Schedule V to the Companies Act, 2013.
(xii) In our opinion, the Company is not a nidhi company. Therefore, the provisions of clause 3(xii) of the order are not applicable to the Company and hence not commented upon.
(xiii) According to the information and explanations given by the management, transactions with the related parties are in compliance with section 177 and 188 of Companies Act, 2013 where applicable and the details have been disclosed
in the notes to the financial statements, as required by the applicable accounting standards.
(xiv) According to the information and explanations given to us and on an overall examination of the balance sheet, the company has not made any preferential allotment or private placement of shares or fully or partly convertible debentures during the year under review and hence, reporting requirements under clause 3(xiv) are not applicable to the company and, not commented upon.
(xv) According to the information and explanations given by the management, the Company has not entered into any non-cash transactions with directors or persons connected with him as referred to in section 192 of Companies Act, 2013.
(xvi) According to the information and explanations given to us, the provisions of section 45-IA of the Reserve Bank of India Act, 1934 are not applicable to the Company.
For S R B C & CO LLPChartered AccountantsICAI Firm Registration Number: 324982E/E300003
per Sudhir SoniPartnerMembership Number: 41870
Place of Signature: Mumbai
Date: May 23, 2018

82 Peninsula Land Limited
Financial Statements
Independent Auditor’s Report Continued
Annexure 2 to the Independent Auditor’s Report of the even date on the standalone Financials Statements of Peninsula Land LimitedWe have audited the internal financial controls over financial reporting of Peninsula Land Limited (“the Company”) as of March 31, 2018 in conjunction with our audit of the standalone financial statements of the Company for the year ended on that date.
Management’s Responsibility for Internal Financial Controls
The Company’s Management is responsible for establishing and maintaining internal financial controls based on the internal control over financial reporting criteria established by the Company considering the essential components of internal control stated in the Guidance Note on Audit of Internal Financial Controls Over Financial Reporting issued by the Institute of Chartered Accountants of India. These responsibilities include the design, implementation and maintenance of adequate internal financial controls that were operating effectively for ensuring the orderly and efficient conduct of its business, including adherence to the Company’s policies, the safeguarding of its assets, the prevention and detection of frauds and errors, the accuracy and completeness of the accounting records, and the timely preparation of reliable financial information, as required under the Companies Act, 2013.
Auditor’s Responsibility
Our responsibility is to express an opinion on the Company's internal financial controls over financial reporting based on our audit. We conducted our audit in accordance with the Guidance Note on Audit of Internal Financial Controls Over Financial Reporting (the “Guidance Note”) and the Standards on Auditing as specified under section 143(10) of the Companies Act, 2013, to the extent applicable to an audit of internal financial controls and, both issued by the Institute of Chartered Accountants of India. Those Standards and the Guidance Note require that we comply with ethical requirements and plan and perform the audit to obtain reasonable assurance about whether adequate internal financial controls over financial reporting was established and maintained and if such controls operated effectively in all material respects.
Our audit involves performing procedures to obtain audit evidence about the adequacy of the internal financial controls system over financial reporting and their operating effectiveness. Our audit of internal financial controls over financial reporting included obtaining an understanding of internal financial controls over financial reporting, assessing the risk that a material weakness exists, and testing and evaluating the design and operating effectiveness of internal control based on the assessed risk. The procedures selected depend on the auditor’s judgement, including the assessment of the risks of material misstatement of the financial statements, whether due to fraud or error.
We believe that the audit evidence we have obtained is sufficient and appropriate to provide a basis for our audit opinion on the internal financial controls system over financial reporting.
Meaning of Internal Financial Controls Over Financial Reporting
A company's internal financial control over financial reporting is a process designed to provide reasonable assurance regarding the reliability of financial reporting and the preparation of financial statements for external purposes in accordance with generally accepted accounting principles. A company's internal financial control over financial reporting includes those policies and procedures that (1) pertain to the maintenance of records that, in reasonable detail, accurately and fairly reflect the transactions and dispositions of the assets of the company; (2) provide reasonable assurance that transactions are recorded as necessary to permit preparation of financial statements in accordance with generally accepted accounting principles, and that receipts and expenditures of the company are being made only in accordance with authorisations of management and directors of the company; and (3) provide reasonable assurance regarding prevention or timely detection of unauthorised acquisition, use, or disposition of the company's assets that could have a material effect on the financial statements.
Inherent Limitations of Internal Financial Controls Over Financial Reporting
Because of the inherent limitations of internal financial controls over financial reporting, including the possibility of collusion or improper management override of controls, material misstatements due to error or fraud may occur and not be detected. Also, projections of any evaluation of the internal financial controls over financial reporting to future periods are subject to the risk that the internal financial control over financial reporting may become inadequate because of changes in conditions, or that the degree of compliance with the policies or procedures may deteriorate.

83Annual Report 2017-18
Built for challenges. Preparing for growth.
Opinion
In our opinion, the Company has, in all material respects, an adequate internal financial controls system over financial reporting and such internal financial controls over financial reporting were operating effectively as at March 31, 2018, based on the internal control over financial reporting criteria established by the Company considering the essential components of internal control stated in the Guidance Note on Audit of Internal Financial Controls Over Financial Reporting issued by the Institute of Chartered Accountants of India.
For S R B C & CO LLPChartered AccountantsICAI Firm Registration Number: 324982E/E300003
per Sudhir SoniPartnerMembership Number: 41870
Place of Signature: Mumbai
Date: May 23, 2018

84 Peninsula Land Limited
Financial Statements
Standalone Balance Sheetas at 31st March 2018
(` in Crores)Particulars Note No As at
31st March 2018As at
31st March 2017ASSETS
A Non-Current Assets(a) Property, Plant and Equipments 3 148.88 150.82 (b) Investment property 4 290.38 291.76 (c) Intangible assets 5 2.97 3.54 (d) Investments In subsidiaries, joint ventures and associates 6 353.12 355.08 (e) Financial Assets
(i) Investments 7 454.82 479.90 (ii) Loans 8 195.01 253.09 (iii) Other financial assets 9 195.78 124.53
(f) Deferred tax assets (Net) 48 42.00 54.28 (g) Non-current Tax assets (Net) 59.58 52.83 (h) Other non - current assets 10 2.27 2.38
Total (A) 1,744.81 1,768.21 B Current Assets(a) Inventories 11 1,060.05 1,309.21 (b) Financial Assets
(i) Current investments 12 0.99 - (ii) Trade receivables 13 45.08 36.52 (iii) Cash and cash equivalents 14 26.11 77.51 (iv) Bank balances other than (iii) above 15 34.75 46.30 (v) Loans 16 650.41 729.46 (vi) Other financial assets 17 80.06 90.91
(c) Other current assets 18 39.13 79.39 (d) Investments held for sale 19 6.70 -
Total (B) 1,943.28 2,369.30 Total Assets (A)+(B) 3,688.09 4,137.51 EQUITY AND LIABILITIES
A Equity(a) Equity share capital 20 55.90 55.90 (b) Other equity 21 1,321.89 1,648.80
Total (A) 1,377.79 1,704.70 Liabilities
B Non-Current Liabilities(a) Financial liabilities
(i) Long Term Borrowings 22 1,415.85 1,191.00 (ii) Other financial liabilities 23 125.05 135.78
(b) Provisions 24 7.75 3.64 Total (B) 1,548.65 1,330.42
C Current Liabilities(a) Financial Liabilities
(i) Short Term Borrowings 25 225.64 287.29 (ii) Trade payables 26 (a) Micro, small and medium enterprises 0.14 0.61 (b) Other than micro, small and medium enterprises 84.07 133.66 (iii) Other financial liabilities 27 387.62 626.43
(b) Other current liabilities 28 59.83 51.82 (c) Provisions 29 4.35 2.58
Total (C) 761.65 1,102.39 Total Equity & Liabilities (A)+(B)+(C) 3,688.09 4,137.51 Significant Accounting PoliciesThe accompanying notes are an integral part of the financial statements
2
As per our report of even date For and on behalf of the Board of Directors of Peninsula Land LimitedFor S R B C & CO LLP Sd/- Sd/- Sd/- Chartered Accountants Urvi A. Piramal Rajeev A. Piramal Mahesh S. GuptaICAI Firm registration number: 324982E/E300003 Non Executive Chairperson Executive Vice Chairman & Group Managing DirectorSd/- DIN 00044954 Managing Director DIN 00046810 per Sudhir Soni DIN 00044983Partner Sd/- Sd/- Sd/- Sd/- Membership No.: 41870 Nandan A. Piramal Bhavna Doshi Bharat Sanghavi Rajashekhar Reddy Whole Time Director Director Chief Financial Officer Company SecretaryPlace : Mumbai DIN 00045003 DIN 00400508 Date: May 23, 2018

85Annual Report 2017-18
Built for challenges. Preparing for growth.
Standalone Statement of Profit and Lossfor the year ended 31st March 2018
(` in Crores)
Particulars Note No 2017-2018 2016-2017
INCOME(a) Revenue from operations 36 475.40 264.57
(b) Other Income 30 197.96 189.32
Total Income (A) 673.36 453.89
COST OF REALTY SALES(c) Realty cost incurred 44 219.60 244.47
(d) Changes in realty inventories 44 186.14 (3.01)
Cost of Realty Sales (B) 405.74 241.46
EXPENSES(e) Employee benefits expenses 31 49.40 43.77
(f) Finance costs 32 280.27 169.69
(g) Depreciation and amortisation expense 3,4,5 4.06 4.35
(h) Other expenses 33 69.23 96.65
Expenses (C) 402.96 314.46
Total Expenses {D = (B+C)} 808.70 555.92
Profit / (Loss) before Exceptional items and tax {E = (A-D)} (135.34) (102.03)
Exceptional items (F) 53 179.93 -
Profit / (Loss) before Tax {G=(E-F)} (315.27) (102.03)
Tax Expense
(i) Current Tax - 0.04
(j) Deferred Tax 48 12.06 41.03
Total tax expense (H) 12.06 41.07
Profit / (Loss) after tax for the year {I = (G-H)} (327.33) (143.10)
Other Comprehensive Income
(k) (i) Items that will not be reclassified to Statement of profit and loss Re-measurement gains/ (losses) on defined benefit plans
47(b) 0.65 (0.10)
(ii) Income tax effect (0.22) 0.04
Other comprehensive income/(expense) for the year, net of tax (J) 0.43 (0.06)
Total Comprehensive Income for the year, net of tax {K = (I + J)} (326.90) (143.16)
Earning per equity share - Face value of ` 2 (31st March, 2017 ` 2)
42
Basic (In `) (11.72) (5.13)
Diluted (In `) (11.72) (5.13)
Significant Accounting Policies 2
The accompanying notes are an integral part of the financial statements As per our report of even date For and on behalf of the Board of Directors of Peninsula Land LimitedFor S R B C & CO LLP Sd/- Sd/- Sd/- Chartered Accountants Urvi A. Piramal Rajeev A. Piramal Mahesh S. GuptaICAI Firm registration number: 324982E/E300003 Non Executive Chairperson Executive Vice Chairman & Group Managing DirectorSd/- DIN 00044954 Managing Director DIN 00046810 per Sudhir Soni DIN 00044983Partner Sd/- Sd/- Sd/- Sd/- Membership No.: 41870 Nandan A. Piramal Bhavna Doshi Bharat Sanghavi Rajashekhar Reddy Whole Time Director Director Chief Financial Officer Company SecretaryPlace : Mumbai DIN 00045003 DIN 00400508 Date: May 23, 2018

86 Peninsula Land Limited
Financial Statements
(A) Equity share capital (Refer Note No. 20)
(` in Crores)
Particulars 31-Mar-18 31-Mar-17
(a) Balance at the beginning of the reporting year 55.90 55.90
(b) Changes in equity share capital during the year - -
Balance at the end of the reporting year 55.90 55.90
(B) Other Equity (Refer Note No. 21)
(` in Crores)
Particulars Reserves & Surplus Total
Securities Premium
Account
Capital Redemption
Reserve
Debenture Redemption
Reserve
General Reserve Retained earnings
Balance as at April 1, 2016 635.57 0.17 146.18 73.45 943.31 1,798.68
Profit/(Loss) for the year - - - - (143.10) (143.10)
(a) Total Other comprehensive income for the year
- - - - (0.06) (0.06)
(b) Recoupment of Debenture Redemption Reserve
- - (26.31) - 26.31 -
(c) Transfer to Debenture Redemption Reserve
- - 70.24 - (70.24 ) -
(d) Final dividend paid - - - - (5.58) (5.58)
(e) Dividend Distribution Tax thereon
- - - - (1.14) (1.14)
Balance as at March 31,2017 635.57 0.17 190.11 73.45 749.50 1,648.80
Profit/(Loss) for the year (327.33) (327.33)
(a) Total Other comprehensive income for the year
0.43 0.43
(b) Recoupment of Debenture Redemption Reserve
(97.19) 97.19 -
(c) Transfer to Debenture Redemption Reserve
45.87 (45.87) -
Balance as at March 31, 2018 635.57 0.17 138.79 73.45 473.92 1,321.89
As per our report of even date For and on behalf of the Board of Directors of Peninsula Land LimitedFor S R B C & CO LLP Sd/- Sd/- Sd/- Chartered Accountants Urvi A. Piramal Rajeev A. Piramal Mahesh S. GuptaICAI Firm registration number: 324982E/E300003 Non Executive Chairperson Executive Vice Chairman & Group Managing DirectorSd/- DIN 00044954 Managing Director DIN 00046810 per Sudhir Soni DIN 00044983Partner Sd/- Sd/- Sd/- Sd/- Membership No.: 41870 Nandan A. Piramal Bhavna Doshi Bharat Sanghavi Rajashekhar Reddy Whole Time Director Director Chief Financial Officer Company SecretaryPlace : Mumbai DIN 00045003 DIN 00400508 Date: May 23, 2018
Standalone Statement of Changes in Equity (SOCIE) for the year ended 31st March 2018
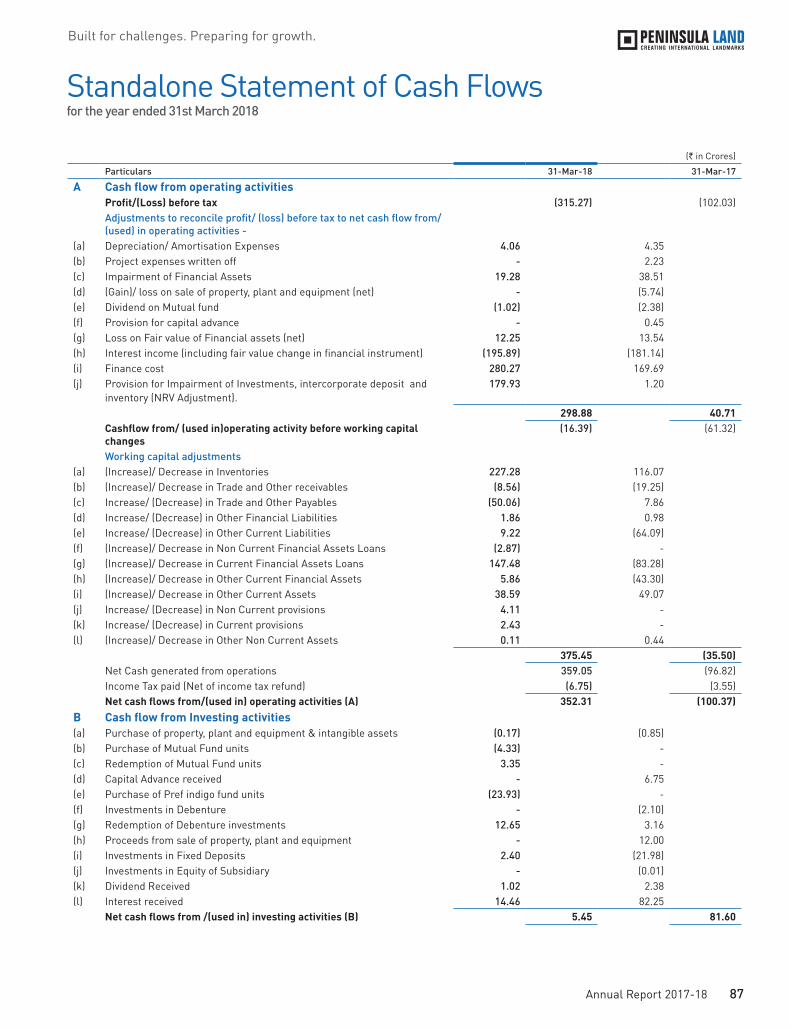
87Annual Report 2017-18
Built for challenges. Preparing for growth.
Standalone Statement of Cash Flows for the year ended 31st March 2018
(` in Crores)
Particulars 31-Mar-18 31-Mar-17
A Cash flow from operating activitiesProfit/(Loss) before tax (315.27) (102.03)Adjustments to reconcile profit/ (loss) before tax to net cash flow from/ (used) in operating activities -
(a) Depreciation/ Amortisation Expenses 4.06 4.35 (b) Project expenses written off - 2.23 (c) Impairment of Financial Assets 19.28 38.51 (d) (Gain)/ loss on sale of property, plant and equipment (net) - (5.74)(e) Dividend on Mutual fund (1.02) (2.38)(f) Provision for capital advance - 0.45 (g) Loss on Fair value of Financial assets (net) 12.25 13.54 (h) Interest income (including fair value change in financial instrument) (195.89) (181.14)(i) Finance cost 280.27 169.69 (j) Provision for Impairment of Investments, intercorporate deposit and
inventory (NRV Adjustment). 179.93 1.20
298.88 40.71 Cashflow from/ (used in)operating activity before working capital changes
(16.39) (61.32)
Working capital adjustments(a) (Increase)/ Decrease in Inventories 227.28 116.07 (b) (Increase)/ Decrease in Trade and Other receivables (8.56) (19.25)(c) Increase/ (Decrease) in Trade and Other Payables (50.06) 7.86 (d) Increase/ (Decrease) in Other Financial Liabilities 1.86 0.98 (e) Increase/ (Decrease) in Other Current Liabilities 9.22 (64.09)(f) (Increase)/ Decrease in Non Current Financial Assets Loans (2.87) - (g) (Increase)/ Decrease in Current Financial Assets Loans 147.48 (83.28)(h) (Increase)/ Decrease in Other Current Financial Assets 5.86 (43.30)(i) (Increase)/ Decrease in Other Current Assets 38.59 49.07 (j) Increase/ (Decrease) in Non Current provisions 4.11 - (k) Increase/ (Decrease) in Current provisions 2.43 - (l) (Increase)/ Decrease in Other Non Current Assets 0.11 0.44
375.45 (35.50)Net Cash generated from operations 359.05 (96.82)Income Tax paid (Net of income tax refund) (6.75) (3.55)Net cash flows from/(used in) operating activities (A) 352.31 (100.37)
B Cash flow from Investing activities(a) Purchase of property, plant and equipment & intangible assets (0.17) (0.85)(b) Purchase of Mutual Fund units (4.33) - (c) Redemption of Mutual Fund units 3.35 - (d) Capital Advance received - 6.75 (e) Purchase of Pref indigo fund units (23.93) - (f) Investments in Debenture - (2.10)(g) Redemption of Debenture investments 12.65 3.16 (h) Proceeds from sale of property, plant and equipment - 12.00 (i) Investments in Fixed Deposits 2.40 (21.98)(j) Investments in Equity of Subsidiary - (0.01)(k) Dividend Received 1.02 2.38 (l) Interest received 14.46 82.25
Net cash flows from /(used in) investing activities (B) 5.45 81.60

88 Peninsula Land Limited
Financial Statements
(` in Crores)
Particulars 31-Mar-18 31-Mar-17
C Cash flow from Financing activities(a) Debentures issued during the year 90.00 708.00 (b) Debentures repaid during the year (490.43) (465.03)(c) Proceeds from loans from Financial Institution 150.00 25.00 (d) Loan Repaid to Financial Institution (245.15) (26.90)(e) Proceeds from Loans from Bank 482.05 205.00 (f) Loan repaid to Bank (114.90) (17.85)(g) Proceeds from Non-current Intercorporate loan 220.43 55.00 (h) Non-current Intercorporate loan paid (184.60) (55.28)(i) Proceeds from Current Borrowings - Commercial paper 205.00 314.00 (j) Repayment towards Current Borrowings - Commercial paper (364.00) (210.00)(k) Proceeds from Current Borrowings - Bank 40.00 - (l) Repayment towards Current Borrowings - Bank (40.00) - (m) Proceeds from Current Borrowings - Others (net) 31.60 (173.26)(n) Repayment towards Current Borrowings - Bank Overdraft (net) 56.65 (15.75)(o) Dividend paid - (6.72)(p) Finance charges paid (245.81) (272.40)
Net cash flows from/(used in) financing activities (C) (409.16) 63.81 Net increase / (decrease) in cash and cash equivalents (A+B+C) (51.40) 45.04 Add: Cash and cash equivalents at the beginning of the year 77.51 32.47 Cash and cash equivalents at the end of the year 26.11 77.51
Notes : 1. Statement of Cash Flows is prepared in accordance with Ind AS 7 as notified by Ministry of Corporate Affairs.2. In Part A of the Cash Flow Statement, figures in brackets indicate deduction made from the net profit for deriving the net cash flow from operating activities. In Part B and Part C, figures in brackets indicate cash outflows.
Components of Cash and Cash equivalents as at Balance Sheet date
Particulars 31-Mar-18 31-Mar-17
I Cash and Cash Equivalents (Refer Note No. 14)(a) Balances with Banks in Current Account 25.95 70.50 (b) Balances with Banks in Deposit Account (Original maturity upto three months) - 6.96 (c) Cash on Hand 0.16 0.05
Total 26.11 77.51
Changes in Liabilities arising from Financing activities as per IND AS 107 Particulars Opening
BalanceCash flow
changesChanges in
Fair valueOther Non Cash
flow changesClosing
Balance
1 Non-current Borrowings 1,681.45 (92.60) 27.91 (1.05) 1,615.71 2 Derivative Liability 135.78 - (27.91) 17.18 125.05 3 Current Borrowings 287.29 (70.75) - 9.10 225.64
Total 2,104.52 (163.35) - 25.23 1,966.40
As per our report of even date For and on behalf of the Board of Directors of Peninsula Land LimitedFor S R B C & CO LLP Sd/- Sd/- Sd/- Chartered Accountants Urvi A. Piramal Rajeev A. Piramal Mahesh S. GuptaICAI Firm registration number: 324982E/E300003 Non Executive Chairperson Executive Vice Chairman & Group Managing DirectorSd/- DIN 00044954 Managing Director DIN 00046810 per Sudhir Soni DIN 00044983Partner Sd/- Sd/- Sd/- Sd/- Membership No.: 41870 Nandan A. Piramal Bhavna Doshi Bharat Sanghavi Rajashekhar Reddy Whole Time Director Director Chief Financial Officer Company SecretaryPlace : Mumbai DIN 00045003 DIN 00400508 Date: May 23, 2018
Standalone Statement of Cash Flows Continued

89Annual Report 2017-18
Built for challenges. Preparing for growth.
Notes forming part of the Standalone Financial Statements
1 Corporate Information Peninsula Land Limited (“the Company”) is a public
limited company engaged primarily in the business of real estate development. The core business activities are carried out under various business models like own development, through subsidiaries, associates, joint ventures and joint development and other arrangements with third parties. The Company also earns income from renting of properties held by it. The Company is domiciled in India and is listed on Bombay Stock Exchange Limited (BSE) and the National Stock Exchange of India Limited (NSE). The registered office of the Company is located at 1, Peninsula Spenta, Mathuradas Mills Compound, Lower Parel, Mumbai 400013. The Company is registered with Ministry of Corporate Affairs under The Companies Act, 2013 with CIN L17120MH1871PLC000005.
The standalone financial statements of the Company for the year ended 31st March, 2018 were authorized and approved for issue by the Board of Directors on 23rd May 2018.
2 Significant Accounting Policies
I. Basis of Preparation of Financial Statements
a. The standalone financial statements of the Company have been prepared in accordance with the Indian Accounting Standards (Ind AS) as notified under section 133 of the Companies Act read with the Companies (Indian Accounting Standards) Rules 2015 (as amended from time to time).
b. The financial statements are prepared on a historical cost basis, except for:
(i) Certain financial assets and liabilities that are measured at fair value (refer accounting policy regarding financial instruments).
(ii) Defined benefit plans – plan assets measured at fair value.
(iii) Land and Buildings classified as property, plant and equipment.
(iv) Derivative financial instruments.
(v) Contingent consideration.
(vi) Non-cash distribution liability.
c. Current / non-current classification
The Company presents assets and liabilities in the balance sheet based on Current/non-current classification. An asset is treated as current when it is:
• Expected to be realized or intended to be sold or consumed in normal operating cycle
• Held primarily for the purpose of trading
• Expected to be realised within twelve months after the reporting period, or
• Cash or cash equivalent unless restricted from being exchanged or used to settle a liability for atleast twelve months after the reporting period
All other assets are classified as non-current.
A liability is treated as current when:
• it is expected to be settled in normal operating cycle
• it is held primarily for the purpose of trading
• it is due to be settled within twelve months after the reporting period, or
• there is no unconditional right to defer its settlement for atleast twelve months after the reporting period.
All other liabilities are classified as non-current.
Deferred tax assets and liabilities are classified as non-current.
The operating cycle is the time between the acquisition of assets for processing and their realisation in cash and cash equivalents. The normal operating cycle in respect of a real estate project under development depends on various factors like signing of sale agreements, size of the project, phasing of the project, type of development, project-specific complexities, technical and engineering factors, statutory approvals needed and the realization of the project receivables into cash & cash equivalents. Based on these factors, the normal operating cycle is generally in the range of 3 to 7 years. Accordingly project related assets & liabilities are classified as current and non-current based on operating cycle of the respective projects. All other assets and liabilities are classified as current or non- current based on an operating cycle of twelve months.
d. Functional and Presentation Currency
The financial statements are presented in Indian Rupee (“INR”) which is also the functional currency of the Company. All values are rounded off to the nearest crore or fraction thereof up to two decimals, except where otherwise indicated. A crore is equivalent to 10 million.
II Use of accounting judgements, assumptions and
estimates
The preparation of financial statements in conformity with recognition and measurement principles of Ind AS requires the management to make judgements, assumptions and

90 Peninsula Land Limited
Financial Statements
Notes forming part of the Standalone Financial Statements
estimates that affect the reported amounts of revenues, expenses, assets and liabilities and accompanying disclosures and the disclosure of contingent liabilities. They are based on historical experience and other factors, including expectations of future events that may have financial impact on the Company and are believed to be prudent and reasonable. Further, the Company bases its assumptions and estimates on parameters available when the financial statements are prepared. Existing circumstances and assumptions about future developments, however, may change due to market changes or circumstances arising beyond the control of the Company. Such changes are reflected in the assumptions and estimates as and when they occur. Uncertainty about the assumptions and estimates could result in outcomes that require material adjustments in future periods to the carrying amount of assets and liabilities and the results of future periods could be affected due to changes in these assumptions and estimates. The differences between the actual results and the estimates are recognized in the periods in which the results are known or materialize. Following are the key areas of judgements, assumptions and estimates which have significant effect on the amounts recognized in the financial statements:
a. Evaluation of Percentage Completion
The Company uses the percentage of completion method for recognition of revenues and costs for its real estate projects. Determination of revenues and costs under the percentage of completion method necessarily involves making estimates, some of which are of a technical nature, concerning, where relevant, the percentages of completion, estimates of costs to completion, the expected revenues from the project or activity and the foreseeable losses to completion. Estimates of project timelines, revenues and costs are reviewed at reporting dates. The effect of changes if any, to such estimates are recognized in the financial statements for the period in which such changes are determined.
b. Estimation of Net Realisable Value (NRV) for inventory property
Inventory property is stated at the lower of cost and net realizable value (NRV).
NRV of completed or developed inventory property is assessed by reference to market conditions, prices and trends existing at the reporting date and is determined by the Company based on comparable transactions observed /identified for similar properties in the same geographical market serving the same real estate segment.
NRV in respect of inventory property under development is assessed with reference to market
prices and trends existing at the reporting date for similar completed property, less the estimated cost to complete construction and an estimate of the time value of money to the date of completion.
c. Impairment of other Non-Financial Assets
The Company assesses at each reporting date whether there is an indication that an asset may be impaired. If any indication exists, or when annual impairment testing for an asset is required, the Company estimates the asset’s recoverable amount. An asset’s recoverable amount is the higher of an asset’s fair value less costs of disposal and its value in use. When the carrying amount of an asset exceeds its recoverable amount, the asset is considered impaired and is written down to its recoverable amount. In assessing value in use, the estimated future cash flows are discounted to their present value using a pre-tax discount rate that reflects current market assessment of the time value of money and the risk specific to the asset. In determining fair value less cost of disposal, recent market transactions are taken into account. If no such transactions can be identified, an appropriate valuation model is used. These calculations are corroborated by valuation multiples or other available fair value indicators. Goodwill is tested for impairment at the end of each reporting period and is not subject to amortisation.
d. Impairment of Financial Assets
The impairment provisions for financial assets are based on assumptions about the risk of default and expected loss rates. The Company uses judgement in making these assumptions and selecting the inputs for impairment calculation, based on Company’s past history, existing market conditions as well as forward looking estimates at the end of each reporting period.
e. Useful life and residual value of Property, Plant and Equipment and Intangible Assets
Useful lives of tangible assets are based on the life prescribed in Schedule II of the Companies Act, 2013. In cases, where the useful lives are different from that prescribed in Schedule II, they are based on technical advice. Assumptions also need to be made when the Company assesses whether an asset may be capitalised and which components of the cost of the asset may be capitalised.
f. Recognition and Measurement of Defined Benefit Obligations
The obligation arising from defined benefit plan is determined on the basis of actuarial assumptions. Key actuarial assumptions include discount rate, expected return on plan assets, trends in salary escalation and

91Annual Report 2017-18
Built for challenges. Preparing for growth.
Notes forming part of the Standalone Financial Statements
attrition rate. The discount rate is determined by reference to market yields at the end of the reporting period on government bonds. The period to maturity of the underlying bonds correspond to the probable maturity of the post employment benefit obligations.
g. Fair Value Measurement of Financial Instruments
When the fair values of the financial assets and liabilities recorded in the Balance Sheet cannot be measured based on the quoted market prices in active markets, their fair value is measured using valuation technique. The inputs to these models are taken from the observable market wherever possible, but where this is not feasible, a review of judgement is required in establishing fair values. Any changes in assumptions could affect the fair value relating to financial instruments.
III Measurement of Fair Values
The Company measures financial instruments, such as investments at fair value at each balance sheet date. Fair value is the price that would be received to sell an asset or paid to transfer a liability in an orderly transaction between market participants at the measurement date. The fair value measurement is based on the presumption that the transaction to sell the asset or transfer the liability takes place either in the principal market for the asset or liability, or in the absence of a principal market, in the most advantageous market for the asset or liability. The principal or the most advantageous market must be accessible by the Company.
The fair value of an asset or a liability is measured using the assumptions that market participants would use when pricing the asset or liability, assuming that market participants act in their economic best interest.
A fair value measurement of a non-financial asset takes into account a market participant’s ability to generate economic benefits by using the asset in its highest and best use or by selling it to another market participant that would use the asset in its highest and best use.
The Company uses valuation techniques that are appropriate in the circumstances and for which sufficient data are available to measure fair value, maximizing the use of relevant observable inputs and minimizing the use of unobservable inputs.
The Company has an established control framework with respect to the measurement of fair values. The Management regularly reviews significant unobservable inputs and valuation adjustments. If third party information is used to measure fair values, then the Management assesses the evidence obtained from third parties to support the conclusion that such valuations meet the requirements of Ind AS, including the level in the fair value
hierarchy in which such valuations should be classified.
When measuring the fair value of a financial asset or a financial liability, the Company uses observable market data as far as possible. Fair values are categorised into different levels in a fair value hierarchy based on the inputs used in the valuation techniques as follows.
Level 1: Quoted prices in active markets for identical assets or liabilities.
Level 2: Inputs other than quoted prices included in Level 1 that are observable for the asset or liability, either directly (i.e. as prices) or indirectly (i.e. derived from prices).
Level 3: Inputs, for the asset or liability that are not based on observable market data.
If the inputs used to measure the fair value of an asset or a liability fall into different levels of the fair value hierarchy, then the fair value measurement is categorised in its entirety in the same level of the fair value hierarchy as the lowest level input that is significant to the entire measurement.
The Company recognises transfers between levels of the fair value hierarchy at the end of the reporting period during which the change has occurred.
IV Property, Plant and Equipment & Depreciation
a. Recognition and Measurement
Items of property, plant and equipment are measured at cost less accumulated depreciation and impairment losses, if any. The cost of an item of property, plant and equipment comprises:
i. its purchase price, including import duties and non refundable purchase taxes after deducting trade discounts and rebates.
ii. any costs directly attributable to bringing the asset to the location and condition necessary for it to be capable of operating in the manner intended by Management.
iii. the initial estimate of the costs of dismantling and removing the item and restoring the site on which it is located, the obligation for which the Company incurs either when the item is acquired or as a consequence of having used the item during a particular period for purposes other than to produce inventories during that period.
iv. borrowing costs relating to acquisition / construction / development of tangible assets, which takes substantial period of time to get ready for its intended use are also included to the extent they relate to the period till such assets are ready to be put to use

92 Peninsula Land Limited
Financial Statements
Notes forming part of the Standalone Financial Statements
v. income and expenses related to the incidental operations, not necessary to bring the item to the location and condition necessary for it to be capable of operating in the manner intended by Management are recognised in Statement of Profit and Loss. If significant parts of an item of property, plant and equipment have different useful lives, then they are accounted for as separate items (major components) of property, plant and equipment.
b. Subsequent Expenditure
Subsequent expenditure related to an item of Property, Plant and Equipment is added to its book value only if it increases the future benefits from the existing asset beyond its previously assessed standard of performance. All other expenses on existing Property, Plant and Equipment, including repair and maintenance expenditure and cost of replacing parts are charged to the Statement of Profit and Loss for the period during which such expenses are incurred.
Expenses incurred for acquisition of capital assets excluding advances paid towards the acquisition of Property, Plant and Equipment outstanding at each Balance Sheet date are disclosed under Capital Work in Progress.
Capital Work in Progress in respect of assets which are not ready for their intended use are carried at cost, comprising of direct costs, related incidental expenses and attributable interest.
Any gain or loss on disposal of an item of property, plant and equipment is recognized in the Statement of Profit and Loss of the Company in the year of disposal.
c. Depreciation
Depreciation is provided from the date the assets are ready to be put to use on straight line method as per the useful life of the tangible assets including property held as Investment as prescribed under Part C of Schedule II of the Companies Act, 2013 except for the following assets where the Management has estimated useful life which differs from the useful life of 60 years as prescribed under the Act.
Assets Balance useful life (years) from the date of acquisition
Building 1 (Spenta) 57
Building 2 (Seaface Park) 39
For these assets, based on assessment of technical expert, the Management believes that the useful lives as given above best represent the period over which Management expects to use these assets. Hence the useful lives for these assets are different from the useful lives as prescribed under Schedule II of the Companies Act, 2013.
Depreciation is calculated on a prorata basis from the date of installation / acquisition till the date the assets are sold or disposed.
Depreciable amount for assets is the cost of an asset or amount substituted for cost, less its estimated residual value.
Leasehold improvements are amortised over the period of lease.
The depreciation methods, useful lives and residual values are reviewed periodically.
d. Reclassification to Investment Property
When the use of a property changes from owner occupied to investment property, the property is reclassified as investment property at its carrying value on the date of reclassification.
V Investment Property
Investment property is property held to earn rental income or for capital appreciation or for both, but not for sale in the ordinary course of business, use in the production or supply of goods or services or for administrative purposes.
Upon initial recognition, an investment property is measured at cost. Subsequent to initial recognition, investment property is measured at cost less accumulated depreciation and accumulated impairment losses, if any.
Based on technical evaluation and consequent advice, the Management believes a period of 60 years as representing the best estimate of the period over which investment properties are expected to be used. Accordingly, the Company depreciates investment property over a period of 60 years.
Though the Company measures investment property using cost based measurement, the fair value of investment property is disclosed in the notes. Fair values, where necessary are determined based on an annual evaluation performed by an accredited external independent valuer.
Investment properties are de-recognized either when they have been disposed off or when they are permanently withdrawn from use and no future economic benefit is expected from their disposal. The difference between the

93Annual Report 2017-18
Built for challenges. Preparing for growth.
Notes forming part of the Standalone Financial Statements
net disposal proceeds and the carrying amount of the asset is recognized in profit or loss in the period of de-recognition.
VI Intangible Assets
a. Recognition and Measurement
Intangible assets are carried at cost less accumulated amortisation and impairment losses, if any. The cost of an intangible asset comprises of its purchase price including any import duties and other taxes (other than those subsequently recoverable from the taxing authorities) and any directly attributable expenditure on making the asset ready for its intended use.
Expenditure on research and development eligible for capitalisation are carried as intangible assets under development where such assets are not yet ready for their intended use.
b. Subsequent Expenditure
Subsequent expenditure is capitalized only if it is probable that the future economic benefits associated with the expenditure will flow to the Company.
c. Amortisation
Intangible assets are amortised over their estimated useful lives on a straight line basis, not exceeding 7 years commencing from the date the asset is available to the Company for its use. The amortization period and the amortization method for an intangible asset with a finite useful life are reviewed atleast at the end of each reporting period.
VII Foreign Currency Transactions / Translations
a. Foreign exchange transactions are recorded at the closing rate prevailing on the dates of the respective transactions or at the contracted rates as applicable.
b. Monetary assets and liabilities denominated in foreign currencies at the reporting date are translated into the functional currency at the exchange rate at that date.
c. Exchange differences arising on the settlement of monetary items or on translating monetary items at rates different from those at which they were translated on initial recognition during the period or in previous financial statements are recognised in the statement of profit and loss in the period in which they arise.
VIII Financial Instruments
A financial instrument is any contract that gives rise to a financial asset of one entity and a financial liability or equity instrument of another entity.
a Financial Assets
i. Classification
The Company classifies financial assets as subsequently measured at amortised cost, fair value through other comprehensive income or fair value through profit or loss on the basis of its business model for managing the financial assets and the contractual cash flow characteristics of the financial asset.
ii. Initial Recognition and Measurement
All financial assets (not measured subsequently at fair value through profit or loss) are recognised initially at fair value plus transaction costs that are attributable to the acquisition of the financial asset. Purchases or sales of financial assets that require delivery of assets within a time frame established by regulation or convention in the market place (regular way trades) are recognised on the trade date, i.e., the date that the Company commits to purchase or sell the asset.
iii. Subsequent Measurement
For purposes of subsequent measurement financial assets are classified into two broad categories:
a. Financial asset at fair value
b. Financial asset at amortised cost
Where assets are measured at fair value, gains and losses are either recognised entirely in the statement of profit and loss (i.e. fair value through profit or loss), or recognised in other comprehensive income (i.e. fair value through other comprehensive income).
iv. Equity Investments
All equity investments other than investment in subsidiaries, joint ventures and associates are measured at fair value. Equity instruments which are held for trading are classified as at Fair Value Through Profit & Loss (FVTPL). For all other equity instruments, the Company decides to classify the same either as at Fair Value through Other Comprehensive Income (FVTOCI) or FVTPL. The Company makes such selection on an instrument by instrument basis. The classification is made on initial recognition and is irrevocable.
If the Company decides to classify an equity instrument as at FVTOCI, then all fair value changes on the instrument excluding dividends are recognised in Other Comprehensive Income

94 Peninsula Land Limited
Financial Statements
Notes forming part of the Standalone Financial Statements
(OCI). There is no recycling of the amounts from OCI to the Statement of Profit and Loss even on sale of such investments.
Equity instruments included within the FVTPL category are measured at fair value with all changes recognised in the Statement of Profit and Loss.
Investment in equity instruments of Subsidiaries, Joint Ventures and Associates are measured at cost.
v. A financial asset mainly debt that meets the following 2 conditions is measured at amortised cost (net off any write down for impairment) unless the asset is designated at fair value through profit or loss under the fair value option.
• Business Model Test : the objective of the Company’s model is to hold the financial asset to collect the contractual cash flows (rather than to sell the instrument prior to its contractual maturity to realise its fair value changes).
• Cash Flow Characteristics Test: The contractual terms of the financial asset give rise on specified dates to cash flows that are solely payment of principal and interest on the principal amount outstanding.
After initial measurement, such financial assets are subsequently measured at amortized cost using the effective interest rate (EIR) method. Amortized cost is calculated by taking into account any discount or premium on acquisition and fees or costs that are an integral part of the EIR. The EIR amortization is included in finance income in the profit or loss. The losses arising from impairment are recognized in the profit or loss. This category generally applies to trade and other receivables.
A financial asset that meets the following 2 conditions is measured at fair value through other comprehensive income unless the asset is designated at fair value through profit or loss under the fair value option.
• Business Model Test : the financial asset is held within a business model whose objective is achieved both by collecting contractual cash flows and selling the financial assets.
• Cash Flow Characteristics Test: The contractual terms of the financial asset give rise on specified dates to cash flows that are solely payment of principal and interest on the principal amount outstanding.
All other financial assets are measured at fair value through profit or loss and gain or loss on such measurement is recognized in the statement of profit & loss.
Even if an instrument meets the two requirements to be measured at amortised cost or fair value through other comprehensive income, a financial asset is measured at fair value through profit or loss if doing so eliminates or significantly reduces a measurement or recognition inconsistency (sometimes referred to as an ‘accounting mismatch’) that would otherwise arise from measuring assets or liabilities or recognising the gains or losses on them on different basis.
vi. De-recognition
A financial asset (or, where applicable, a part of a financial asset or part of a group of similar financial assets) is primarily derecognised when:
• The rights to receive cash flows from the asset have expired, or
• The Company has transferred its rights to receive cash flows from the asset or has assumed an obligation to pay the received cash flows in full without material delay to a third party under a ‘pass-through’ arrangement and either
a) the Company has transferred substantially all the risks and rewards of the asset or
b) the Company has neither transferred nor retained substantially all the risks and rewards of the asset, but has transferred control of the asset.
When the Company has transferred its rights to receive cash flows from an asset or has entered into a pass-through arrangement, it evaluates if and to what extent it has retained the risks and rewards of ownership. When it has neither transferred nor retained substantially all of the risks and rewards of the asset, nor transferred control of the asset, the Company continues to recognise the transferred asset to the extent of the Company’s continuing involvement. In that case, the Company also recognises an associated liability. The transferred asset and the associated liability are measured on a basis that reflects the rights and obligations that the Company has retained.
Continuing involvement that takes the form of a guarantee over the transferred asset is measured at the lower of the original carrying amount of the asset and the maximum amount of consideration that the Company could be required to repay.

95Annual Report 2017-18
Built for challenges. Preparing for growth.
Notes forming part of the Standalone Financial Statements
vii. Impairment of Financial Asset
The Company assesses impairment based on expected credit losses (ECL) model to the following:
• Financial asset measured at amortised cost
• Financial asset measured at fair value through other comprehensive income
Expected credit losses are measured through a loss allowance at an amount equal to:
• 12 months expected credit losses (expected credit losses that result from those default events on the financial instrument that are possible within 12 months after the reporting date) or
• Full lifetime expected credit losses (expected credit losses that result from all possible default events over the life of the financial instrument)
For financial assets other than trade receivables, as per Ind AS 109, the Company recognises 12 months expected credit losses for all originated or acquired financial assets if at the reporting date the credit risk of the financial asset has not increased significantly since its initial recognition. The expected credit losses are measured as lifetime expected credit losses if the credit risk on financial asset increases significantly since its initial recognition.
The Company follows ‘simplified approach’ for recognition of impairment loss allowance on trade receivables, considering historical trend, industry practices and the business environment in which the Company operates or any other appropriate basis.
The Company’s trade receivables do not contain significant financing component and loss allowance on trade receivables is measured at an amount equal to life time expected losses i.e. expected cash shortfall.
The impairment losses and reversals are recognised in Statement of Profit and Loss.
b. Financial Liabilities
i. Classification
The Company classifies all financial liabilities as subsequently measured at amortised cost or at fair value through Profit and Loss.
ii. Initial Recognition and Measurement
All financial liabilities are recognised initially at fair value and in the case of loans and borrowings and payables, net off directly attributable transaction costs.
The Company’s financial liabilities include trade and other payables, loans and borrowings
including bank overdrafts and financial guarantee contracts.
iii. Subsequent Measurement
After initial recognition, interest bearing loans and borrowings are subsequently measured at amortised cost using the Effective Interest Rate (EIR) method. Gains and losses are recognised in the Statement of Profit and Loss when the liabilities are derecognised.
Amortised cost is calculated by taking into account any discount or premium on acquisition and fees or costs that are an integral part of the EIR. The EIR amortisation is included as finance costs in the Statement of Profit and Loss. This category generally applies to interest bearing amortized loans and borrowings.
Trade and other payables These amounts represent liabilities for goods
and services provided to the Company prior to the end of financial year which are unpaid. Trade and other payables are presented as current liabilities unless payment is due within 12 months after reporting period. For trade and other payables maturing within one year from the balance sheet date, the carrying amounts approximate fair value due to the short maturity of these instruments.
Financial guarantee contracts Financial guarantee contracts issued by the
Company are those contracts that require a payment to be made to reimburse the holder for a loss it incurs because the specified debtor fails to make a payment when due in accordance with the terms of a debt instrument. Financial guarantee contracts are recognized initially as a liability at fair value, adjusted for transaction costs that are directly attributable to the issuance of the guarantee. Subsequently, the liability is measured at the higher of the amount of loss allowance determined as per impairment requirements of Ind AS 109 and the amount recognized less cumulative amortization.
iv. Derecognition
A financial liability is derecognised when the obligation under the liability is discharged or cancelled or expires. When an existing financial liability is replaced by another from the same lender on substantially different terms or the terms of an existing liability are substantially modified, such an exchange or modification
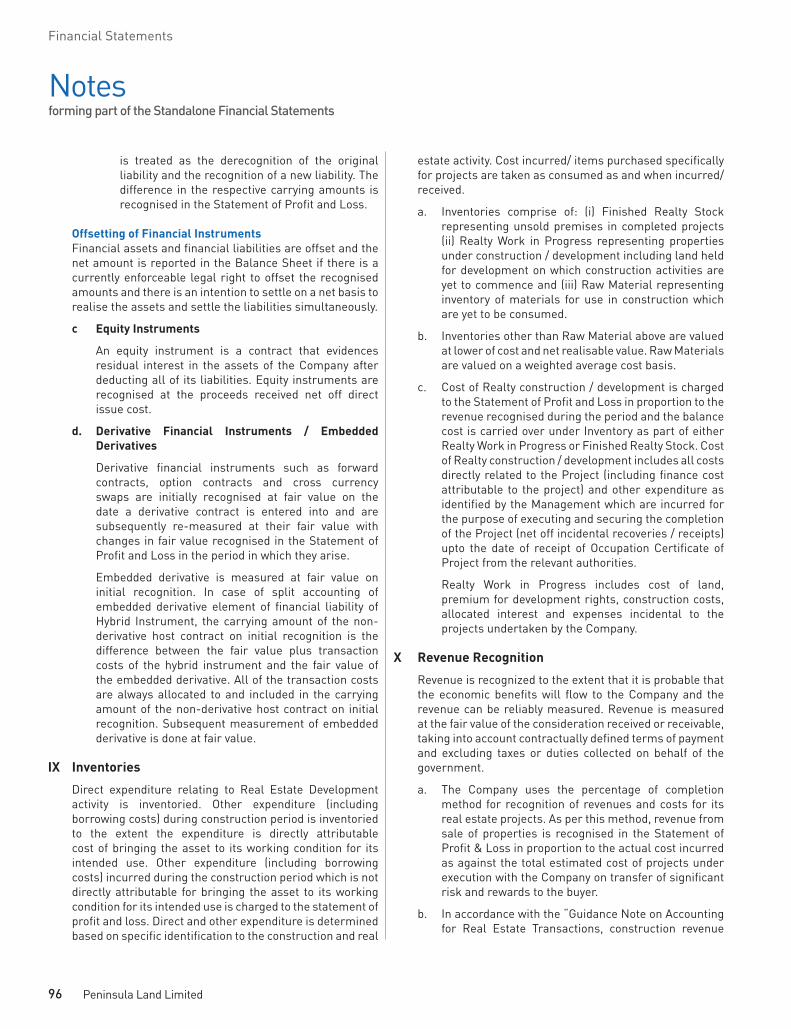
96 Peninsula Land Limited
Financial Statements
Notes forming part of the Standalone Financial Statements
is treated as the derecognition of the original liability and the recognition of a new liability. The difference in the respective carrying amounts is recognised in the Statement of Profit and Loss.
Offsetting of Financial Instruments Financial assets and financial liabilities are offset and the
net amount is reported in the Balance Sheet if there is a currently enforceable legal right to offset the recognised amounts and there is an intention to settle on a net basis to realise the assets and settle the liabilities simultaneously.
c Equity Instruments
An equity instrument is a contract that evidences residual interest in the assets of the Company after deducting all of its liabilities. Equity instruments are recognised at the proceeds received net off direct issue cost.
d. Derivative Financial Instruments / Embedded Derivatives
Derivative financial instruments such as forward contracts, option contracts and cross currency swaps are initially recognised at fair value on the date a derivative contract is entered into and are subsequently re-measured at their fair value with changes in fair value recognised in the Statement of Profit and Loss in the period in which they arise.
Embedded derivative is measured at fair value on initial recognition. In case of split accounting of embedded derivative element of financial liability of Hybrid Instrument, the carrying amount of the non-derivative host contract on initial recognition is the difference between the fair value plus transaction costs of the hybrid instrument and the fair value of the embedded derivative. All of the transaction costs are always allocated to and included in the carrying amount of the non-derivative host contract on initial recognition. Subsequent measurement of embedded derivative is done at fair value.
IX Inventories
Direct expenditure relating to Real Estate Development activity is inventoried. Other expenditure (including borrowing costs) during construction period is inventoried to the extent the expenditure is directly attributable cost of bringing the asset to its working condition for its intended use. Other expenditure (including borrowing costs) incurred during the construction period which is not directly attributable for bringing the asset to its working condition for its intended use is charged to the statement of profit and loss. Direct and other expenditure is determined based on specific identification to the construction and real
estate activity. Cost incurred/ items purchased specifically for projects are taken as consumed as and when incurred/ received.
a. Inventories comprise of: (i) Finished Realty Stock representing unsold premises in completed projects (ii) Realty Work in Progress representing properties under construction / development including land held for development on which construction activities are yet to commence and (iii) Raw Material representing inventory of materials for use in construction which are yet to be consumed.
b. Inventories other than Raw Material above are valued at lower of cost and net realisable value. Raw Materials are valued on a weighted average cost basis.
c. Cost of Realty construction / development is charged to the Statement of Profit and Loss in proportion to the revenue recognised during the period and the balance cost is carried over under Inventory as part of either Realty Work in Progress or Finished Realty Stock. Cost of Realty construction / development includes all costs directly related to the Project (including finance cost attributable to the project) and other expenditure as identified by the Management which are incurred for the purpose of executing and securing the completion of the Project (net off incidental recoveries / receipts) upto the date of receipt of Occupation Certificate of Project from the relevant authorities.
Realty Work in Progress includes cost of land, premium for development rights, construction costs, allocated interest and expenses incidental to the projects undertaken by the Company.
X Revenue Recognition
Revenue is recognized to the extent that it is probable that the economic benefits will flow to the Company and the revenue can be reliably measured. Revenue is measured at the fair value of the consideration received or receivable, taking into account contractually defined terms of payment and excluding taxes or duties collected on behalf of the government.
a. The Company uses the percentage of completion method for recognition of revenues and costs for its real estate projects. As per this method, revenue from sale of properties is recognised in the Statement of Profit & Loss in proportion to the actual cost incurred as against the total estimated cost of projects under execution with the Company on transfer of significant risk and rewards to the buyer.
b. In accordance with the “Guidance Note on Accounting for Real Estate Transactions, construction revenue

97Annual Report 2017-18
Built for challenges. Preparing for growth.
Notes forming part of the Standalone Financial Statements
on such projects, measured at the fair value (i.e. adjusted for discounts, incentives, time value of money adjustments etc.), have been recognised on percentage of completion method provided the following thresholds have been met:
(i) All critical approvals necessary for the commencement have been obtained.
(ii) The expenditure incurred on construction and development costs is not less than 25 percent of the total estimated construction and development costs.
(iii) Atleast 25 percent of the saleable project area is secured by contracts or agreements with buyers and
(iv) Atleast 10 percent of the contracted consideration is realised at the reporting date in respect of such contracts and it is reasonable to expect that the parties to such contracts will comply with the payment terms as defined in the contracts.
c. Determination of revenues and costs under the percentage of completion method necessarily involves making estimates, some of which are of a technical nature, concerning, where relevant, the percentages of completion, estimates of costs to completion, the expected revenues from the project or activity and the foreseeable losses to completion. Estimates of project timelines, revenues and costs are reviewed at reporting dates. The effect of changes if any, to such estimates are recognized in the financial statements for the period in which such changes are determined.
d. The Company has also been entering into Development & Project Management agreements with landlords. Accounting for income from such projects, measured at fair value, is done on accrual basis on percentage of completion or as per the terms of the agreement.
e. Revenue from sale of completed properties (Finished Realty Stock) is recognised upon transfer of significant risks and rewards to the buyer.
f. Revenue on Development Rights is recognised on the basis of the Company’s revenue share receivable from the related projects as per agreed terms and conditions.
g. Interest income is accounted on an accrual basis at effective interest rate (EIR method).
h. Dividend income is recognised when the right to receive the payment is established.
i. Rent income, Service fees, Signages, Car park and PMC / Marketing fees are accounted on accrual basis over tenure of the lease / service agreement.
XI Income Tax
Income Tax expense comprises current and deferred tax. It is recognised in Statement of Profit and Loss except to the extent that it relates to items recognised directly in Equity or in Other Comprehensive Income.
a. Current Tax
Current Tax comprises the expected tax payable or receivable on the taxable income or loss for the year and any adjustment to the tax payable or receivable in respect of previous years. It is measured using tax rates enacted or substantively enacted at the reporting date. Current tax also includes any tax arising from dividends.
Current tax assets and liabilities can be offset only if the Company
(i) has a legally enforceable right to set off the recognised amounts and
(ii) intends either to settle on a net basis or to realise the asset and settle the liability simultaneously.
b. Deferred Tax
Deferred tax is recognised in respect of temporary differences between the carrying amounts of assets and liabilities for financial reporting purposes and the amounts used for taxation purposes.
Deferred tax assets are recognised for unused tax credits and deductible temporary differences to the extent that it is probable that future taxable profits will be available against which they can be used. Deferred tax assets are reviewed at each reporting date and are reduced to the extent that it is no longer probable that the related tax benefit will be realised such reductions are reversed when the probability of future taxable profits improves.
Unrecognised deferred tax assets are reassessed at each reporting date and recognised to the extent that it has become probable that future taxable profits will be available against which they can be used.
Deferred tax is measured at the tax rates that are expected to be applied to temporary differences when they reverse using tax rates enacted or substantively enacted at the reporting date.
The measurement of deferred tax reflects the tax consequences that would follow from the manner in which the Company expects at the reporting date to recover or settle the carrying amount of its assets and liabilities.

98 Peninsula Land Limited
Financial Statements
Notes forming part of the Standalone Financial Statements
Deferred tax assets and liabilities are offset only if:
(i) The Company has a legally enforceable right to set off current tax assets against current tax liabilities and
(ii) The deferred tax assets and the deferred tax liabilities relate to income taxes levied by the same taxation authority on the same taxable entity.
The tax rates and tax laws used to compute the amount are those that are enacted or substantively enacted at the reporting date.
c. Minimum Alternate Tax (MAT)
Minimum Alternative Tax (MAT) may become payable when the taxable profit is lower than the book profit. Taxes paid under MAT are available as a set off against regular corporate tax payable in subsequent years, as per the relevant provisions of Income Tax Act. MAT paid in a year is charged to the statement of profit and loss as current tax. The Company recognizes MAT credit available as an asset only to the extent that there is convincing evidence that the Company will pay normal income tax during the specified period, i.e., the period for which MAT credit is allowed to be carried forward. In the year in which the Company recognizes MAT credit as an asset in accordance with the Guidance Note on Accounting for Credit Available in respect of Minimum Alternate Tax under the Income Tax Act, 1961, the said asset is created by way of credit to the statement of profit and loss and shown as “MAT Credit Entitlement.” The Company reviews the “MAT credit entitlement” asset at each reporting date and writes down the asset to the extent the Company does not have convincing evidence that it will pay normal tax during the specified period.
d. Unadjusted tax effect of amounts directly debited to Reserves
The unadjusted tax effect of expenses directly charged to reserves is carried forward under Deferred Tax Assets and charged to the Statement of Profit and Loss as tax expense in subsequent years as and when and to the extent to which the proportionate tax benefits of such expenses are accounted.
XII Employee Benefits
a. Short term employee benefits
Short term employee benefits are expensed as the related service is provided. A liability is recognised for the amount expected to be paid if the Company has
a present legal or constructive obligation to pay this amount as a result of past service provided by the employee and the obligation can be estimated reliably.
b. Post Employment Benefits
(i) Defined contribution plans
Obligations for contributions to defined contribution plans are expensed as the related service is provided. Prepaid contributions are recognised as an asset to the extent that a cash refund or a reduction in future payments is available.
(ii) Defined benefit plans
Payment of Gratuity to employees is in the nature of a defined benefit plan. Provision for Gratuity is recorded on the basis of actuarial valuation certificate provided by the actuary using Projected Unit Credit Method.
The Company’s net obligation in respect of defined benefit plans is calculated separately for each plan by estimating the amount of future benefit that employees have earned in the current and prior periods, discounting that amount and deducting the fair value of any plan assets.
The calculation of defined benefit obligations is performed annually by a qualified actuary using the projected unit credit method. When the calculation results in a potential asset for the Company, the recognised asset is limited to the present value of economic benefits available in the form of any future refunds from the plan or reductions in future contributions to the plan. To calculate the present value of economic benefits, consideration is given to any applicable minimum funding requirements.
Remeasurement of the net defined benefit liability, which comprise actuarial gains and losses and the return on plan assets (excluding interest) and the effect of the asset ceiling (if any, excluding interest) are recognised immediately in Other Comprehensive Income (OCI). Net interest expense / (income) on the net defined liability / (assets) is computed by applying the discount rate, used to measure the net defined liability / (asset). Net interest expense and other expenses related to defined benefit plans are recognised in the Statement of Profit and Loss.
When the benefits of a plan are changed or when a plan is curtailed, the resulting change in benefit that relates to past service or the gain or

99Annual Report 2017-18
Built for challenges. Preparing for growth.
Notes forming part of the Standalone Financial Statements
loss on curtailment is recognised immediately in the Statement of Profit and Loss. The Company recognises gains and losses on the settlement of a defined benefit plan when the settlement occurs.
c. Other Long Term Employee Benefits
Company's liability towards compensated absences is determined by an independent actuary using Projected Unit Credit Method. Past services are recognised on a straight line basis over the average period until the benefits become vested. Actuarial gains and losses are recognised immediately in the Statement of Profit and Loss as income or expense or recognized under Other Comprehensive Income to the extent such actuarial gains or losses arise due experience adjustments. Obligation is measured at the present value of the estimated future cash flows using a discounted rate that is determined by reference to the market yields at the Balance Sheet date on Government Bonds where the currency and terms of the Government Bonds are consistent with the currency and estimated terms of the defined benefit obligation.
XIII Leases
a. Where Company is the Lessee
Lease arrangements where the risks and rewards incidental to ownership of an asset substantially vest with the lessor are recognised as operating lease. Operating lease payments are recognised as an expense in the Statement of Profit and Loss on straight line basis over the lease term, unless there is another systematic basis which is more representative of the time pattern of the lease.
b. Where Company is the Lessor
Assets representing lease arrangements given under operating leases are included in Property, Plant, Equipment. Lease income is recognised in the Statement of Profit and Loss on straight line basis over the lease term, unless there is another systematic basis which is more representative of the time pattern of the lease. Initial direct costs are recognised immediately in the Statement of Profit and Loss.
c. Agreements which are not classified as finance leases are considered as operating lease.
d. Payments made under operating leases are recognised in the Statement of Profit and Loss. Lease incentives received are recognised as an integral part of the total lease expense over the term of the lease.
XIV Borrowing Cost
Borrowing costs are interest and other costs that the Company incurs in connection with the borrowing of funds and is measured with reference to the effective interest rate applicable to the respective borrowing.
Borrowing costs, allocated to qualifying assets, pertaining to the period from commencement of activities relating to construction / development of the qualifying asset upto the time all the activities necessary to prepare the qualifying asset for its intended use or sale are complete.
All other borrowing costs are recognised as an expense in the period in which they are incurred.
XV Cash and Cash Equivalents
Cash and cash equivalent as reported in the Balance Sheet comprise cash at banks and on hand and short term deposits with an original maturity of three months or less which are subject to an insignificant risk of changes in value. However, for the purposes of the Cash Flow Statement, cash and cash equivalents comprise of cash and short term deposits as defined in Ind AS 7.
XVI Earnings Per Share
Basic earnings per share is computed by dividing the profit / (loss) after tax by the weighted average number of equity shares outstanding during the year. The weighted average number of equity shares outstanding during the year is adjusted for the events for bonus issue, bonus element in a rights issue to existing shareholders, share split and reverse share split (consolidation of shares).
Diluted earnings per share is computed by dividing the profit / (loss) after tax as adjusted for dividend, interest and other charges to expense or income (net off any attributable taxes) relating to the dilutive potential equity shares, by the weighted average number of equity shares considered for deriving basic earnings per share and the weighted average number of equity shares which could have been issued on conversion of all dilutive potential equity shares.
XVII Cash Flow Statement
Cash Flow Statement is prepared under the “Indirect Method” as prescribed under the Indian Accounting Standard (Ind AS) 7 –Statement of Cash Flows.
Cash and Cash equivalents for the purpose of cash flow statement comprise of cash at bank and in hand and short term investments with original maturity of three months or less.

100 Peninsula Land Limited
Financial Statements
Notes forming part of the Standalone Financial Statements
XVIII Provisions and Contingent Liabilities
A provision is recognised when the Company has a present obligation as a result of past events and it is probable that an outflow of resources will be required to settle the obligation in respect of which a reliable estimate can be made. Provisions (excluding retirement benefits) are not discounted to their present value and are determined based on the best estimate required to settle the obligation at the Balance Sheet date. These are reviewed at each Balance Sheet date and adjusted to reflect the current best estimates.
Contingent liabilities are disclosed for:
(i) possible obligations which will be confirmed only by future events not wholly within the control of the Company or
(ii) present obligations arising from past events where it is not probable that an outflow of resources will be required to settle the obligation or a reliable estimate of the amount of the obligation cannot be made.
Commitments include the amount of purchase order (net off advances) issued to parties for completion of assets.
Contingent Assets are not recognised in Financial Statements. If an inflow of economic benefits has become probable, contingent assets are disclosed.
Contingent Assets are assessed continually to ensure that developments are appropriately reflected in the Financial Statements. If it has become virtually
certain that an inflow of economic benefits will arise, the asset and the related income are recognised in the Financial Statements of the period in which the changes occurs.
Provisions, contingent liabilities, contingent assets and commitments are reviewed at each Balance Sheet date.
XIX Segment Reporting
The Chief Operational Decision Maker monitors the operating results of its business segments separately for the purpose of making decisions about resource allocation and performance assessment. Segment performance is evaluated based on profit or loss and is measured consistently with profit or loss in the financial statements. The operating segments have been identified on the basis of nature of product / services.
The Board of Directors of the Company has appointed the Managing Director as the Chief Operating Decision Maker (CODM) who is assessing the financial performance and position of the Company and makes strategic decisions.
XX Barter transaction and Joint operation
Based on terms and conditions of joint development agreement which may indicate whether the contract involves exchange of goods according to Ind AS 18 “Revenue” or it is in the nature of a joint venture or joint operation according to Ind AS 111 Joint Arrangements. Accordingly, the Company accounts for barter transaction or joint operation, as the case may be.
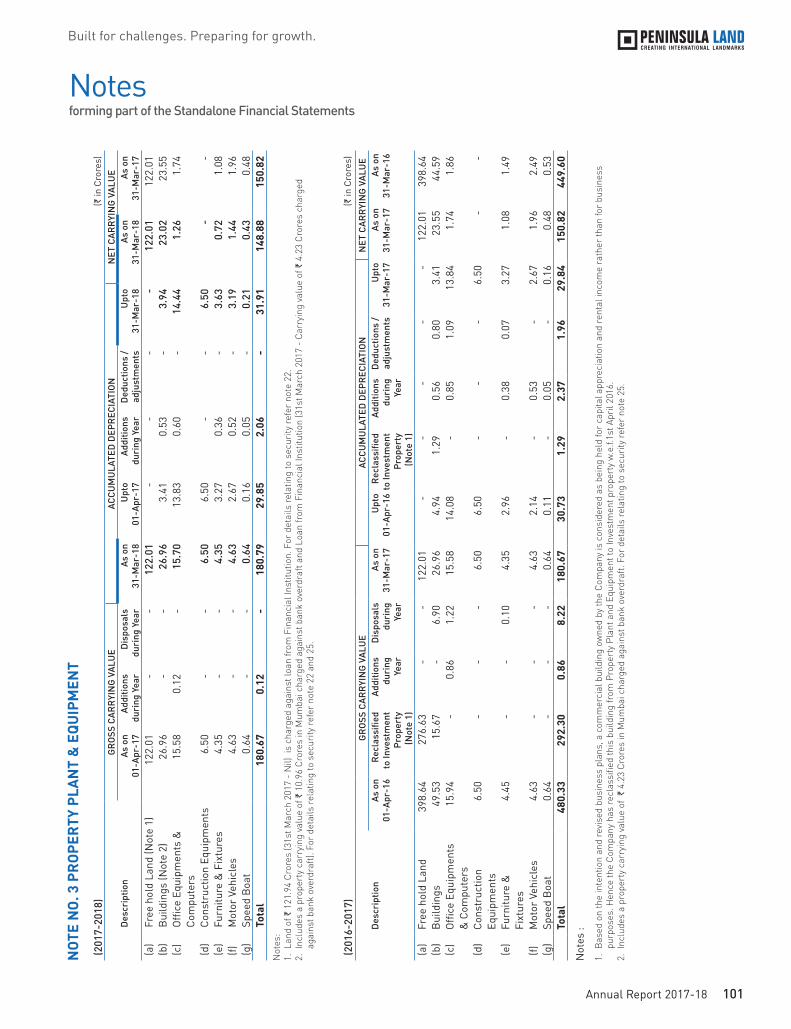
101Annual Report 2017-18
Built for challenges. Preparing for growth.
Notes forming part of the Standalone Financial Statements
NOT
E N
O. 3
PR
OPE
RTY
PLA
NT
& E
QU
IPM
ENT
(201
7-20
18)
(` in
Cro
res)
GR
OSS
CAR
RYI
NG
VAL
UE
ACCU
MU
LATE
D D
EPR
ECIA
TIO
NN
ET C
ARR
YIN
G V
ALU
ED
escr
iptio
nAs
on
01-A
pr-1
7Ad
ditio
ns
duri
ng Y
ear
Dis
posa
ls
dur
ing
Year
As o
n 31
-Mar
-18
Upt
o 01
-Apr
-17
Addi
tions
du
ring
Yea
rD
educ
tions
/ ad
just
men
tsU
pto
31-M
ar-1
8As
on
31-M
ar-1
8As
on
31-M
ar-1
7(a
)Fr
ee h
old
Land
(Not
e 1)
122
.01
-
-
122
.01
-
-
-
-
122
.01
122
.01
(b)
Bui
ldin
gs (N
ote
2) 2
6.96
-
-
2
6.96
3
.41
0.5
3 -
3
.94
23.
02
23.
55
(c)
Offi
ce E
quip
men
ts &
Co
mpu
ters
15.
58
0.1
2 -
1
5.70
1
3.83
0
.60
-
14.
44
1.2
6 1
.74
(d)
Cons
truc
tion
Equi
pmen
ts 6
.50
-
-
6.5
0 6
.50
-
-
6.5
0 -
-
(e
)Fu
rnitu
re &
Fix
ture
s 4
.35
-
-
4.3
5 3
.27
0.3
6 -
3
.63
0.7
2 1
.08
(f)M
otor
Veh
icle
s 4
.63
-
-
4.6
3 2
.67
0.5
2 -
3
.19
1.4
4 1
.96
(g)
Spee
d B
oat
0.6
4 -
-
0
.64
0.1
6 0
.05
-
0.2
1 0
.43
0.4
8 To
tal
180
.67
0.1
2 -
1
80.7
9 2
9.85
2
.06
-
31.
91
148
.88
150
.82
Not
es:
1.
Lan
d of
` 1
21.9
4 C
rore
s (3
1st M
arch
201
7 -
Nil)
is
char
ged
agai
nst l
oan
from
Fin
anci
al In
stitu
tion.
For
det
ails
rel
atin
g to
sec
urity
ref
er n
ote
22.
2. I
nclu
des
a pr
oper
ty c
arry
ing
valu
e of
` 1
0.96
Cro
res
in M
umba
i cha
rged
aga
inst
ban
k ov
erdr
aft a
nd L
oan
from
Fin
anci
al In
stitu
tion
(31s
t Mar
ch 2
017
- C
arry
ing
valu
e of
` 4
.23
Cro
res
char
ged
ag
ains
t ban
k ov
erdr
aft)
. For
det
ails
rel
atin
g to
sec
urity
ref
er n
ote
22 a
nd 2
5.
(201
6-20
17)
(` in
Cro
res)
GR
OSS
CAR
RYI
NG
VAL
UE
ACCU
MU
LATE
D D
EPR
ECIA
TIO
NN
ET C
ARR
YIN
G V
ALU
ED
escr
iptio
nAs
on
01-A
pr-1
6R
ecla
ssifi
ed
to In
vest
men
t Pr
oper
ty
(Not
e 1)
Addi
tions
du
ring
Ye
ar
Dis
posa
ls
dur
ing
Year
As o
n 31
-Mar
-17
Upt
o 01
-Apr
-16
Rec
lass
ified
to
Inve
stm
ent
Prop
erty
(N
ote
1)
Addi
tions
du
ring
Ye
ar
Ded
uctio
ns /
adju
stm
ents
Upt
o 31
-Mar
-17
As o
n 31
-Mar
-17
As o
n 31
-Mar
-16
(a)
Free
hol
d La
nd
398
.64
276
.63
-
-
122
.01
-
-
-
-
-
122
.01
398
.64
(b)
Bui
ldin
gs 4
9.53
1
5.67
-
6
.90
26.
96
4.9
4 1
.29
0.5
6 0
.80
3.4
1 2
3.55
4
4.59
(c
) O
ffice
Equ
ipm
ents
&
Com
pute
rs 1
5.94
-
0
.86
1.2
2 1
5.58
1
4.08
-
0
.85
1.0
9 1
3.84
1
.74
1.8
6
(d)
Cons
truc
tion
Equi
pmen
ts 6
.50
-
-
-
6.5
0 6
.50
-
-
-
6.5
0 -
-
(e)
Furn
iture
&
Fixt
ures
4.4
5 -
-
0
.10
4.3
5 2
.96
-
0.3
8 0
.07
3.2
7 1
.08
1.4
9
(f)M
otor
Veh
icle
s 4
.63
-
-
-
4.6
3 2
.14
-
0.5
3 -
2
.67
1.9
6 2
.49
(g)
Spee
d B
oat
0.6
4 -
-
-
0
.64
0.1
1 -
0
.05
-
0.1
6 0
.48
0.5
3 To
tal
480
.33
292
.30
0.8
6 8
.22
180
.67
30.
73
1.2
9 2
.37
1.9
6 2
9.84
1
50.8
2 4
49.6
0
Not
es :
1. B
ased
on
the
inte
ntio
n an
d re
vise
d bu
sine
ss p
lans
, a c
omm
erci
al b
uild
ing
owne
d by
the
Com
pany
is c
onsi
dere
d as
bei
ng h
eld
for
capi
tal a
ppre
ciat
ion
and
rent
al in
com
e ra
ther
than
for
busi
ness
purp
oses
. Hen
ce th
e C
ompa
ny h
as r
ecla
ssifi
ed th
is b
uild
ing
from
Pro
pert
y P
lant
and
Equ
ipm
ent t
o In
vest
men
t pro
pert
y w
.e.f.
1st A
pril
2016
.2.
Inc
lude
s a
prop
erty
car
ryin
g va
lue
of `
4.2
3 C
rore
s in
Mum
bai c
harg
ed a
gain
st b
ank
over
draf
t. Fo
r de
tails
rel
atin
g to
sec
urity
ref
er n
ote
25.

102 Peninsula Land Limited
Financial Statements
Notes forming part of the Standalone Financial Statements
NOT
E N
O. 4
INVE
STM
ENT
PRO
PER
TY
(201
7-20
18) (
Ref
er N
ote
51)
(` in
Cro
res)
GR
OSS
CAR
RYI
NG
VAL
UE
ACCU
MU
LATE
D A
MO
RTI
SATI
ON
NET
CAR
RYI
NG
VAL
UE
Des
crip
tion
As o
n 01
-Apr
-17
Addi
tions
du
ring
Yea
rD
ispo
sals
d
urin
g Ye
arAs
on
31-M
ar-1
8U
pto
01-A
pr-1
7Ad
ditio
ns
duri
ng Y
ear
Ded
uctio
ns /
adju
stm
ents
Upt
o 31
-Mar
-18
As o
n 31
-Mar
-18
As o
n 31
-Mar
-17
(a)
Land
(Not
e 1)
276
.63
-
-
276
.63
-
-
-
-
276
.63
276
.63
(b)
Bui
ldin
g (N
ote
1) 1
8.10
-
-
1
8.10
2
.97
1.3
8 -
4
.35
13.
75
15.
13
Tota
l 2
94.7
3 -
-
2
94.7
3 2
.97
1.3
8 -
4
.35
290
.38
291
.76
Not
e 1.
Lan
d of
` 2
76.6
3 C
rore
s (3
1st
Mar
ch 2
017
- `
276.
63 C
rore
s) a
nd b
uild
ing
of `
12.
10 C
rore
s (3
1st
Mar
ch 2
017
- `1
6.08
Cro
res)
in M
umba
i is
char
ged
agai
nst
loan
from
ban
k. F
or d
etai
ls r
elat
ing
to
se
curi
ty r
efer
not
e 22
.
(201
6-20
17)
(` in
Cro
res)
GR
OSS
CAR
RYI
NG
VAL
UE
ACCU
MU
LATE
D A
MO
RTI
SATI
ON
NET
CAR
RYIN
G VA
LUE
Des
crip
tion
As o
n 01
-Apr
-16
Addi
tions
du
ring
Ye
ar
Rec
lass
ified
from
Prop
erty
Pla
ntan
d Eq
uipm
ent
Dis
posa
ls
dur
ing
Year
As o
n 31
-Mar
-17
Upt
o 01
-Apr
-16
Rec
lass
ified
from
Prop
erty
Pla
ntan
d Eq
uipm
ent
Addi
tions
du
ring
Ye
ar
Ded
uctio
ns /
adju
stm
ents
Upt
o 31
-Mar
-17
As o
n 31
-Mar
-17
As o
n 31
-Mar
-16
(a)
Land
(Not
e 1)
-
-
276
.63
-
276
.63
-
-
-
-
-
276
.63
-
(b)
Bui
ldin
g (N
ote
1)2.
02 0
.41
15.
67
-
18.
10
0.3
1 1
.29
1.3
7 -
2
.97
15.
13
1.7
1 To
tal
2.0
2 0
.41
292
.30
-
294
.73
0.3
1 1
.29
1.3
7 -
2
.97
291
.76
1.7
1 N
ote
1.
Lan
d of
` 2
76.6
3 C
rore
s an
d bu
ildin
g of
`16
.08
Cro
res
in M
umba
i is
char
ged
agai
nst l
oan
from
ban
k. F
or d
etai
ls r
elat
ing
to s
ecur
ity r
efer
not
e 22
.
NOT
E N
O. 5
INTA
NGI
BLE
ASS
ETS
(201
7-20
18)
(` in
Cro
res)
GR
OSS
CAR
RYI
NG
VAL
UE
ACCU
MU
LATE
D D
EPR
ECIA
TIO
NN
ET C
ARR
YIN
G V
ALU
ED
escr
iptio
nAs
on
01-A
pr-1
7Ad
ditio
ns
duri
ng Y
ear
Dis
posa
ls
dur
ing
Year
As o
n 31
-Mar
-18
Upt
o 01
-Apr
-17
Addi
tions
du
ring
Yea
rD
educ
tions
/ ad
just
men
tsU
pto
31-M
ar-1
8As
on
31-M
ar-1
8As
on
31-M
ar-1
7(a
)Co
mpu
ter
Soft
war
e4.
31 0
.05
-
4.3
6 0
.77
0.6
2 -
1
.39
2.9
7 3
.54
Tota
l 4
.31
0.0
5 -
4.3
6 0
.77
0.6
2 -
1
.39
2.9
7 3
.54
(201
6-20
17)
(` in
Cro
res)
GR
OSS
CAR
RYI
NG
VAL
UE
ACCU
MU
LATE
D D
EPR
ECIA
TIO
NN
ET C
ARR
YIN
G V
ALU
ED
escr
iptio
nAs
on
01-A
pr-1
6Ad
ditio
ns
duri
ng Y
ear
Dis
posa
ls
dur
ing
Year
As o
n 31
-Mar
-17
Upt
o 01
-Apr
-16
Addi
tions
du
ring
Yea
rD
educ
tions
/ ad
just
men
tsU
pto
31-M
ar-1
7As
on
31-M
ar-1
7As
on
31-M
ar-1
6(a
)Co
mpu
ter
Soft
war
e4.
31 -
-
4
.31
0.1
6 0
.61
-
0.7
7 3
.54
4.1
5 To
tal
4.3
1 -
-
4
.31
0.1
6 0
.61
-
0.7
7 3
.54
4.1
5

103Annual Report 2017-18
Built for challenges. Preparing for growth.
Notes forming part of the Standalone Financial Statements
NOTE NO. 6 INVESTMENTS IN SUBSIDIARIES, JOINT VENTURE & ASSOCIATES (` in Crores)
Particulars Nos. (Note 2)
Face Value (Rupees) (Note 2)
31-Mar-18 31-Mar-17
TRADE INVESTMENTA) INVESTMENTS IN EQUITY INSTRUMENTS - UNQUOTED (FULLY PAID
UNLESS STATED OTHERWISE)I) Subsidiary Companies (At Cost)(a) Goodtime Real Estate Development Private Limited 2010000 10 100.01 100.01
(2010000) (10)(b) Midland Township Private Limited 10000 10 0.01 0.01
(10000) (10)(c) Pavurotti Real Estate Private Limited 56000 10 13.96 13.96
(56000) (10)Less : Provision for Impairment of Investments (11.64) -
(d) Peninsula Crossroads Private Limited 18000000 10 16.34 16.34 (18000000) (10)
(e) Peninsula Holdings and Investments Private Limited 10000 10 0.01 0.01 (10000) (10)
(f) Peninsula Mega Properties Private Limited 10000 10 0.01 0.01 (10000) (10)
(g) Peninsula Mega Township Developers Limited 50000 10 0.05 0.05 (50000) (10)
Investments in Funds(h) Investments in units of a fund scheme - Pref indigo 7,638 100000 22.99 -
Deemed Investments in Subsidiaries (Note 1)(i) Peninsula Holdings and Investments Private Limited 211.14 211.14 (j) Peninsula Mega Township Developers Limited 0.18 0.18 (k) Peninsula Mega Properties Private Limited 0.01 0.01 II) Associate Companies (At Cost)(l) Sew Engineering (India) Private Limited - 6.54
(Classified as Investments held for sale - Refer Note 19) (989300) (10)III) Associate Companies (At FVTPL)(m) JM Realty Management Private Limited 2500 10 - -
(25% holding by Peninsula Land Limited & 25% by Peninsula Holdings & Investments Private Limited)
(2500) (10)
Deemed Investments in Associate (Note 1) 2.78 2.78 Less: Deemed Investments in Associate written off (2.78) - (Classified as Investments held for sale - Refer Note 19)
(n) Rockfirst Real Estate Limited 14000 10 - - (14000) (10)
IV) Joint Venture - Contribution (At Cost)(o) Bridgeview Real Estate Development LLP 0.05 0.05 V) Associate Entities - Contribution (At Cost)(p) RA Realty Ventures LLP - Contribution 0.39 0.39
Deemed Investments in Associate (Note 1) 3.60 3.60 Less: Deemed Investments in Associate written off (3.99) - Total 353.12 355.08
Particulars 31-Mar-18 31-Mar-17
Aggregate amount of quoted Investments - - Aggregate amount of unquoted Investments 353.12 355.08 Aggregate amount of impairment in value of investments 11.64 -
Notes : 1. The Company has given interest free loans and deposits to subsidiaries and associates. Under Ind AS, long term loans are discounted at their present value using the market interest rate and estimated repayment term. The discounting element will unwind as interest income over the next 3 years, i.e. the period considered for discounting. The same has been accounted as deemed cost of investment and included in the value of investments. 2. Figures in bracket represent previous year figures.

104 Peninsula Land Limited
Financial Statements
Notes forming part of the Standalone Financial Statements
NOTE NO. 7 NON CURRENT INVESTMENTS (` in Crores)
Particulars Nos. (Note 2)
Face Value (Rupees) (Note 2)
31-Mar-18 31-Mar-17
A) INVESTMENTS IN DEBENTURE (FULLY PAID UNLESS STATED OTHERWISE)
I) As contribution towards Project in Subsidiary Companies {w.e.f. 31.03.2018 (31st March, 2017 - Associate Companies)} UNQUOTED (At FVTPL)
(a) Good Home Realty Limited 0% Unsecured Redeemable Optionally Fully Convertible Debentures
12680330 74.45 83.50 93.15 (12680330) (74.45)
(b) Rockfirst Real Estate Limited 0% Unsecured Redeemable Optionally Fully Convertible Debentures
3488450 100 - - (3488450) (100)
(c) RR Mega City Builders Limited 0% Unsecured Redeemable Optionally Fully Convertible Debentures
5486981 100 48.59 51.19 (5486981) (100)
II) As contribution towards Project in Subsidiary Companies - UNQUOTED (Quoted till 30th March 2018) (At Amortised Cost)
(d) Goodtime Real Estate Development Private Limited 3000 1000000 300.00 300.00 16.75% Secured Non-Convertible Debentures (3000) (1000000)
III) As contribution towards Project - UNQUOTED (At FVTPL)(e) JM Township & Real Estate Private Limited
0% Unsecured Redeemable Optionally Fully Convertible Debentures - - - 9.66
(9656855) (10)IV) OTHERS UNQUOTED - Debentures (At Amortised Cost)(f) Ansal Hi-tech Townships Limited
20.25% Secured -Non-Convertible Debentures fully paid up960 100000 9.60 9.60
(960) (100000)(g) Elvera Realtors Private Limited
14% Non-Convertible Debentures fully paid up21 785495.62 1.65 2.10
(21) (1000000)(h) Incor Appa Projects Private Limited
17.50% Non Convertible Debentures fully paid up - - - 1.33
(20) (912647)(i) Reddy Structures Private Limited
16% Secured redeemable Non Convertible Debentures fully paid up3 181848 0.05 0.24
(3) (920232)(j) Reddy Housing Private Limited
16% Secured redeemable Non Convertible Debenture fully paid up17 181,848 0.34 1.37
(17) (920233)B) INVESTMENTS IN PREFERENCE SHARES UNQUOTED (FULLY PAID
UNLESS STATED OTHERWISE) (FVTPL unless otherwise stated)I) Investment in Subsidiary Company (At Amortised cost)(k) Peninsula Investments Management Company Limited
9% Redeemable Non-Cumulative Preference Shares 1108500 100 11.09 11.09
(1108500) (100)II) Investment in preference shares of Subsidiary company {(w.e.f.
31.03.2018 (as at 31st March, 2017 - Associate Companies)}(l) Rockfirst Real Estate Limited - Associate Company
2% Redeemable Non-Cumulative Participating Non Convertible Preference Shares
10150 100 - - (10150) (100)
C) Others Unquoted (Equity Instruments) (At FVTPL)(m) Aero Ports & Infrastructure projects Private Limited - - - 0.04
Add /(Less): Provision for Impairment (43750) (10) (0.04)(Classified as Investments held for sale - Refer Note 19)
(n) JM Township & Real Estate Private Limited - - - 0.17 (Classified as Investments held for sale - Refer Note 19) (175000) (10) -
(o) The Shamrao Vithal Co operative Bank Limited 25 25 0.00 0.00 (25) (25)
Total 454.82 479.90
Particulars 31-Mar-18 31-Mar-17
Aggregate amount of unquoted Investments 454.82 179.90 Aggregate amount of quoted Investments (Note 1) - 300.00 Total 454.82 479.90
Note : 1. Market value of quoted investments is not available since the said investments are not actively traded. 2. Figures in bracket represent previous year figures.

105Annual Report 2017-18
Built for challenges. Preparing for growth.
Notes forming part of the Standalone Financial Statements
NOTE NO. 8 NON CURRENT FINANCIAL ASSETS - LOANS(Unsecured, Considered Good, unless otherwise stated)
(` in Crores)Particulars 31-Mar-18 31-Mar-17Loans to related parties for Project (Refer Note 40)
(a) Loan to Joint Venture (For Project) 79.76 74.37 (b) Loan to Associate (For Project) 206.75 178.72
less: Provision for Impairment (91.50)Total 195.01 253.09
NOTE NO. 9 OTHER NON CURRENT FINANCIAL ASSETS (Unsecured, Considered Good, unless otherwise stated)
(` in Crores)Particulars 31-Mar-18 31-Mar-17
(a) Fixed deposit having maturity for more than twelve months (Note 1) 17.11 1.69 (b) Margin Money with Bank (Note 2) 0.12 0.05 (c) Interest Accrued on Preference Shares 3.31 2.32 (d) Interest Accrued on Debentures from subsidiary 175.24 120.47
Total 195.78 124.53 Notes :1. Includes ` 0.88 Crores for pledged against loan of ` 45.30 Crores (31st March 2017 - `79.74 Crores)2. Margin money kept with bank as fixed deposit for issue of bank guarantee.
NOTE NO. 10 OTHER NON CURRENT ASSETS(Unsecured, Considered Good, unless otherwise stated)
(` in Crores)Particulars 31-Mar-18 31-Mar-17
(a) Prepaid Expenses 0.33 0.51 (b) Security Deposits 1.94 1.87
Total 2.27 2.38
NOTE NO. 11 INVENTORIES (Valued at cost or Net Realisable value whichever is lower)
(` in Crores)Particulars 31-Mar-18 31-Mar-17
(a) Finished goods (Realty Stock) (Note 1) 30.32 50.78 (b) Work in progress (Realty Stock) (Note 2) 1,019.62 1,252.99 (c) Raw material stock 10.11 5.44
Total 1,060.05 1,309.21 Notes : 1. Includes pledge of ` 34.33 Crores as at 31st March 2018, along with other assets (31st March 2017 - ` 53.10 Crores). For details relating to security refer note 22. 2. Includes pledge of `1,196.07 Crores as at 31st March 2018, (31st March 2017 - ` 1,454.24 Crores). For details refer note 22. Interest of ` 41.13 Crores (31st March 2017 - ` 118.60 Crores) has been treated as project cost and added to Work in Progress.
NOTE NO. 12 CURRENT INVESTMENTS (` in Crores)
Particulars 31-Mar-18 31-Mar-17(a) Investments in Mutual fund (At FVTPL)
L&T Financial services (Units 5,96,486) 0.99 -Total 0.99 -
Particulars 31-Mar-18 31-Mar-17Aggregate amount of quoted Investments 0.99 - Market value of quoted investments 0.99 - Aggregate amount of unquoted Investments - - Aggregate amount of impairment in value of investments - -

106 Peninsula Land Limited
Financial Statements
Notes forming part of the Standalone Financial Statements
NOTE NO.13 TRADE RECEIVABLES(Unsecured considered good, unless stated otherwise)
(` in Crores)Particulars 31-Mar-18 31-Mar-17
(a) Trade Receivables - Considered good 45.08 36.52 (b) Trade Receivables - Considered doubtful 0.14 0.14
Less : Allowance for bad and doubtful debts (0.14) (0.14)Total 45.08 36.52
Movements in the provision for impairment of trade receivables are as follows:
Particulars 31-Mar-18 31-Mar-17Opening Balance 0.14 0.14
(a) Provision for receivables impairment - - (b) Receivables written off during the year as uncollectible - - (c) Provision released during the year - -
Closing balance 0.14 0.14
No trade or other receivable are due from director or other officer of the Company either severally or jointly with any other person nor any trade or other receivable are due from firm or private company respectively, in which director is a partner, director or member.
NOTE NO. 14 CASH AND CASH EQUIVALENTS (` in Crores)
Particulars 31-Mar-18 31-Mar-17(a) Balances with Banks 25.95 70.50(b) Fixed deposits with banks, having original maturity of three months or less - 6.96 (c) Cash on Hand 0.16 0.05
Total 26.11 77.51
NOTE NO. 15 BANK BALANCES OTHER THAN CASH AND CASH EQUIVALENTS (` in Crores)
Particulars 31-Mar-18 31-Mar-17Balances with Banks in Deposit Account
(a) Fixed deposits with banks, having original maturity of twelve months or less (Note 1) 33.34 44.34 (b) Balances in Deposit Account as Margin money (Note 2) 0.09 0.18 (c) Balances with banks in unpaid dividend accounts 1.32 1.78
Total 34.75 46.30 Notes1 Deposits kept as security for bank overdraft2 Margin money kept with bank as fixed deposit for issue of bank guarantee
NOTE NO. 16 LOANS(Unsecured, Considered Good, unless otherwise indicated)
(` in Crores)Particulars 31-Mar-18 31-Mar-17Loans to related parties (Refer Note 40)
(a) Loans to Subsidiary 612.73 629.93 Less : Provision for impairment (7.01) -
605.72 629.93(b) Loans to Subsidiary {w.e.f. 31.03.2018 (as at 31st March, 2017 - Associates)} 33.85 37.28 (c) Loans to Subsidiary {w.e.f. 31.03.2018 (as at 31st March, 2017 - Associates), considered doubtful} 53.92 37.26
Less : Provision for impairment (53.92) (37.26) 33.85 37.28
Loans to other than related parties(d) Loans to others 10.26 61.46 (e) Loans to employees 0.58 0.79
Total 650.41 729.46

107Annual Report 2017-18
Built for challenges. Preparing for growth.
Notes forming part of the Standalone Financial Statements
NOTE NO. 17 OTHER FINANCIAL ASSETS(Unsecured, Considered Good, unless otherwise indicated)
(` in Crores)
Particulars 31-Mar-18 31-Mar-17
(a) Interest Receivable on bank Fixed deposit & debenture 22.48 20.67 {(` 18.57 Crores receivable from Subsidiary w.e.f. 31.03.2018, (31st March 2017 - ` 18.57 Crores from Associates))}
(b) Unbilled revenue 37.43 43.30 (c) Fixed deposits with banks, having remaining maturity in twelve months from reporting date 1.20 8.00 (d) Other Receivables 18.95 18.94
Total 80.06 90.91
NOTE NO. 18 OTHER CURRENT ASSETS (Unsecured, Considered Good, unless otherwise indicated)
(` in Crores)Particulars 31-Mar-18 31-Mar-17
(a) Prepaid Expenses 0.33 0.60 (b) Advance for Project / Land to related parties (Refer Note 40)
(i) Where Director is member or Director and LLP where director is partner or Member 0.06 0.15 (ii) Advance for property to Joint Venture 15.00 15.00
(c) Employee Benefits - Gratuity (Refer Note 39) - 0.04 (d) Advance for Project/ Land 17.23 60.48
Less: Impairment of receivable (1.67) - (e) Balance with Government authorities
(i) Service Tax Credit (Unsecured, Considered Doubtful) 0.54 3.12 Less: Provision for doubtful recoverables (0.54) - (ii) GST Credit (Unsecured, Considered good) 8.18 - Total 39.13 79.39
NOTE NO. 19 INVESTMENTS HELD FOR SALE(At cost or fair value less cost to sell, whichever is lower)
(` in Crores)Particulars Nos. Face Value
(Rupees) 31-Mar-18 31-Mar-17
Investments in Associate Company(a) Sew Engineering (India) Private Limited 989300 10 6.54 - (b) JM Realty Management Private Limited 2500 10 - -
Other Investments(c) JM Township & Real Estate Private Limited 175000 10 0.16 (d) Aero Ports & Infrastructure Projects Private Limited 43750 10 -
Total 6.70 -
The Company has classified above Non-Current Assets (Investments) in Equity share of Associates Companies/ Other Company as held for sale since negotiation with the other Equity share holders of Associates Companies/ Other Company is in progress and once the negotiation will complete, the Company will sell the stake in the Associates Companies/ Other Company within one year.

108 Peninsula Land Limited
Financial Statements
Notes forming part of the Standalone Financial Statements
NOTE NO. 20 EQUITY SHARE CAPITAL(` in Crores)
Particulars 31-Mar-18 31-Mar-17
I EQUITY SHARE CAPITAL(A) Authorised:
39,05,00,000 (31st March 2017 - 39,05,00,000) Equity Shares of ` 2/- each 78.10 78.10 20,000 (31st March 2017 - 20,000) 0.01% Non -Cumulative Redeemable Preference Shares of ` 10/- each 0.02 0.02 1,000 (31st March 2017 - 1,000) 5% Cumulative Redeemable Preference Shares of ` 10/- each 0.00 0.00
78.12 78.12 (B) Issued , Subscribed and fully paid-up(a) Equity Shares :
Balance at the beginning of the year * 55.84 55.84 27,92,01,220 Equity Shares (31st March 2017 - 27,92,01,220) of `2/- each Fully paid up {(Includes 13,33,20,055 Shares of ` 2/- Each (31st March 2017 - 13,33,20,055, shares of ` 2 /- each) issued pursuant to Schemes of Arrangement for consideration other than cash issued prior to five year from this balance sheet date)}Add: Forfeited shares 0.06 0.06 Balance at the end of the year 55.90 55.90
* There is no movemement in the number of shares during the year
Terms /rights attached to Equity shares
The Company has only one class of equity shares having a par value of ` 2/- per share. Each holder of equity share is entitled to one vote per share. All shares rank pari passu with regard to dividend and repayment of capital.
In the event of liquidation of the Company, the holders of equity shares will be entitled to receive any of the remaining assets of the Company in proportion to the number of equity shares held by the shareholders, after distribution of all preferential amounts.
II Details of Equity Shares held by each shareholder holding more than 5% shares in the Company :
Name of Share holder 31-Mar-18 31-Mar-17No. of shares
held% of Holding No. of shares
held% of Holding
(a) Ashok Piramal Group Real Estate Trust (through its Trustee Ms. Urvi A. Piramal)
148,929,248 53.34 148,929,248 53.34
(b) Franklin Templeton Investment Funds - - 19,885,667 7.12
III Details of Shares held by the Controlling entity :
Name of Share holder 31-Mar-18 31-Mar-17
No. of shares held
% of Holding No. of shares held
% of Holding
(a) Ashok Piramal Group Real Estate Trust (through its Trustee Ms. Urvi A. Piramal)
148,929,248 53.34 148,929,248 53.34
NOTE NO. 21 OTHER EQUITY(` in Crores)
Particulars 31-Mar-18 31-Mar-18 31-Mar-17 31-Mar-17(a) Capital Redemption Reserve* 0.17 0.17 (b) Securities Premium Reserve* 635.57 635.57 (c) General Reserve* 73.45 73.45 (d) Debenture Redemption Reserve
Balance at the beginning of the year 190.11 146.18 Less : Recoupment of Debenture Redemption Reserve 97.19 26.31 Add : Transfer from Statement of Profit and Loss 45.87 70.24 Balance at the end of the year 138.79 190.11
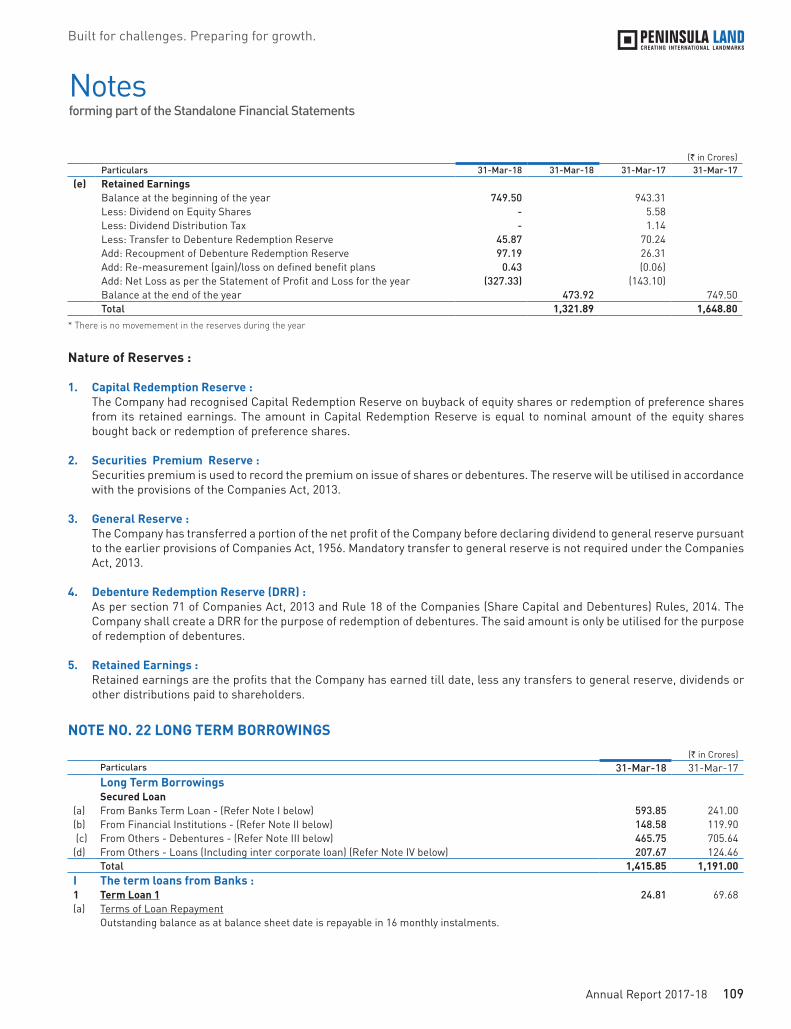
109Annual Report 2017-18
Built for challenges. Preparing for growth.
Notes forming part of the Standalone Financial Statements
(` in Crores)Particulars 31-Mar-18 31-Mar-18 31-Mar-17 31-Mar-17
(e) Retained EarningsBalance at the beginning of the year 749.50 943.31 Less: Dividend on Equity Shares - 5.58 Less: Dividend Distribution Tax - 1.14 Less: Transfer to Debenture Redemption Reserve 45.87 70.24 Add: Recoupment of Debenture Redemption Reserve 97.19 26.31 Add: Re-measurement (gain)/loss on defined benefit plans 0.43 (0.06)Add: Net Loss as per the Statement of Profit and Loss for the year (327.33) (143.10)Balance at the end of the year 473.92 749.50 Total 1,321.89 1,648.80
* There is no movemement in the reserves during the year
Nature of Reserves :
1. Capital Redemption Reserve : The Company had recognised Capital Redemption Reserve on buyback of equity shares or redemption of preference shares
from its retained earnings. The amount in Capital Redemption Reserve is equal to nominal amount of the equity shares bought back or redemption of preference shares.
2. Securities Premium Reserve : Securities premium is used to record the premium on issue of shares or debentures. The reserve will be utilised in accordance
with the provisions of the Companies Act, 2013.
3. General Reserve : The Company has transferred a portion of the net profit of the Company before declaring dividend to general reserve pursuant
to the earlier provisions of Companies Act, 1956. Mandatory transfer to general reserve is not required under the Companies Act, 2013.
4. Debenture Redemption Reserve (DRR) : As per section 71 of Companies Act, 2013 and Rule 18 of the Companies (Share Capital and Debentures) Rules, 2014. The
Company shall create a DRR for the purpose of redemption of debentures. The said amount is only be utilised for the purpose of redemption of debentures.
5. Retained Earnings : Retained earnings are the profits that the Company has earned till date, less any transfers to general reserve, dividends or
other distributions paid to shareholders.
NOTE NO. 22 LONG TERM BORROWINGS(` in Crores)
Particulars 31-Mar-18 31-Mar-17Long Term Borrowings Secured Loan
(a) From Banks Term Loan - (Refer Note I below) 593.85 241.00 (b) From Financial Institutions - (Refer Note II below) 148.58 119.90 (c) From Others - Debentures - (Refer Note III below) 465.75 705.64 (d) From Others - Loans (Including inter corporate loan) (Refer Note IV below) 207.67 124.46
Total 1,415.85 1,191.00 I The term loans from Banks :1 Term Loan 1 24.81 69.68 (a) Terms of Loan Repayment
Outstanding balance as at balance sheet date is repayable in 16 monthly instalments.

110 Peninsula Land Limited
Financial Statements
Notes forming part of the Standalone Financial Statements
(` in Crores)Particulars 31-Mar-18 31-Mar-17
(b) SecuritySecured against charge on Land (held for real estate development) situated at Gahunje, Pune and receivables from the project developed on the said land.
2 Term Loan 2(a) Terms of Loan Repayment 192.53 200.50
Outstanding balance as at balance sheet date is repayable in 120 varying monthly instalments.(b) Security
Secured against mortgage of a commercial property situated at Parel, Mumbai along with hypothecation of lease rentals there from.
3 Term Loan 3 123.29 - (a) Terms of Loan Repayment
Outstanding Balance as at Balance Sheet date is repayable in 18 monthly instalments commencing from 15th August, 2021
(b) SecurityFirst Pari Passu Mortgage on identified piece of Land (Held For Real Estate Development) Located at Gahunje, Pune and receivable from the project developed on the said land.
4 Term Loan 4(a) Terms of Loan Repayment
Outstanding Balance as at Balance Sheet date is repayable in 9 Quarterly instalments. 34.33 -(b) Security
Exclusive charge on the unsold inventory at Ashok Astoria project at Nashik and land of phase 2 at Nashik. Exclusive Charge on receivables of sold flats of Nashik Project.
5 Term Loan 5(a) Terms of Loan Repayment
Outstanding Balance as at Balance Sheet date is repayable In 24 monthly instalments commencing From 15th December, 2019
232.22 -
(b) SecuritySecured Against Charge on Development rights of the project of the company (Held For Real Estate Development) situated at Sewree, Mumbai along with schedule receivables from the project.
6 Term Loan 6 24.79 - (a) Terms of Loan Repayment
Outstanding Balance as at Balance Sheet date is repayable in 109 equated monthly instalments commencing from April, 2018 upto April, 2027.
(b) SecuritySecured against mortgaged of a commercial property situated at Piramal Chambers, Parel, Mumbai along with hypothecation of lease rentals.Less : Current Maturities of Long Term Debt {Refer note no. 27(a)} (38.12) (29.18) Total 593.85 241.00
II The term loans from Financial Institution :1. Loan 1 from Financial Institution - 137.75 (a) Terms of Loan Repayment
Loan has been repaid by the company prior to its schedule repayment date(b) Security
Mortgage of the Company's immovable property comprising land and present and future construction thereon at its project Celestia Spaces Sewree , Mumbai and a charge on the receivable from the said project.
2. Loan 2 from Financial Institution - 54.00 (a) Terms of Loan Repayment
Loan has been repaid by the company prior to its schedule repayment date(b) Security
Mortgage of the Company's immovable property comprising land and present and future construction thereon at its project Celestia Spaces Sewree, Mumbai and a charge on the receivable from the said project and Mortgage of Investments property situated at Peninsula Corporate Park, Mumbai.
3. Loan 3 from Financial Institution - 53.10 (a) Terms of Loan Repayment
Loan has been repaid by the company prior to its schedule repayment date

111Annual Report 2017-18
Built for challenges. Preparing for growth.
Notes forming part of the Standalone Financial Statements
(` in Crores)Particulars 31-Mar-18 31-Mar-17
(b) SecurityMortgage of the Company's immovable property comprising land and present and future construction thereon at its project Ashok Astoria, Nashik and a charge on the receivable from the said project.
4. Loan from Financial Institution 148.58 -(a) Terms of Loan Repayment
Outstanding Balance as at Balance Sheet date is repayable In 4 half yearly equal instalments Commencing from July 2020
(b) SecurityMortgage Of The Company's Immovable Property and pledge of 86,00,000 Equity Shares of Peninsula Land Limited Held by Ashok Piramal Group Real Estate TrustLess : Current Maturities of Long Term Debt {Refer note no. 27(a)} - (124.95)Total 148.58 119.90
III Debentures (Refer Note No. 1, 2 and 3 below) 611.07 977.29 (a) Terms of Loan Repayment
Outstanding balance as at balance sheet date is repayable between May, 2018 upto October, 2023 (Refer Note A below)
(b) Security(i) Secured against charge on Movable property relating to the project of the Company,(ii) Secured against Immovable property (held for real estate development) belonging to Company,
Subsidiary Company and other Companies for whom the Company has undertaken the project development and execution,
(iii) Hypothecation on project trade receivables, Escrow Accounts and Securities of the identified subsidiary companies.
(iv) Secured against charge of Immovable property (held as fixed assets namely Piramal Chamber & one unit at Peninsula Centre, Mumbai ) belonging to Company,
(v) Secured by personal guarantee of Vice Chairman & Managing Director for Rs. 450 Cr debenture issued by the Company.
(c) For effective interest rate Refer Note 2 belowLess : Current Maturities of Long Term Debt {Refer note no. 27(a)} (145.32) (271.65)Total 465.75 705.64
IV Other Loans (Including Intercorporate Loan)1 Loan 1 - 54.92 (a) Terms of Loan Repayment
Loan has been repaid by the company prior to its scheduled repayment date(b) Security
(i) Pari passu registered Mortgage on Land (Held for real estate development) belonging to the subsidiary Company for whom the Company has undertaken the project located at Tathawde, Pune Hypothecation of receivables generated from the sales of said project.
(ii) Along with Corporate Guarantee of a Subsidiary Company.2 Loan 2(a) Terms of Loan Repayment
Loan has been repaid by the company prior to its schedule repayment date - 54.47 (b) Security
Pari-passu charge by way of a registered mortgage on land admeasuring 1,112.51 Square meters located at Nepean Sea Road, Mumbai (Project Ram Mansion) along with receivables generated from the said project.
3 Loan 3 45.30 79.74 (a) Terms of Loan Repayment
Outstanding Balance as at Balance Sheet date is payable in 21 varying monthly instalments (b) Security
Secured against charge on Land (held for real estate development) situated at Gahunje, Pune and land situated at Sewree, Mumbai to be shared on pari passu basis with the other lender.
4 Loan 4 99.07 -(a) Terms of Loan Repayment
Outstanding Balance as at Balance Sheet date is payable in 12 Equal monthly instalments commencing from February 2020
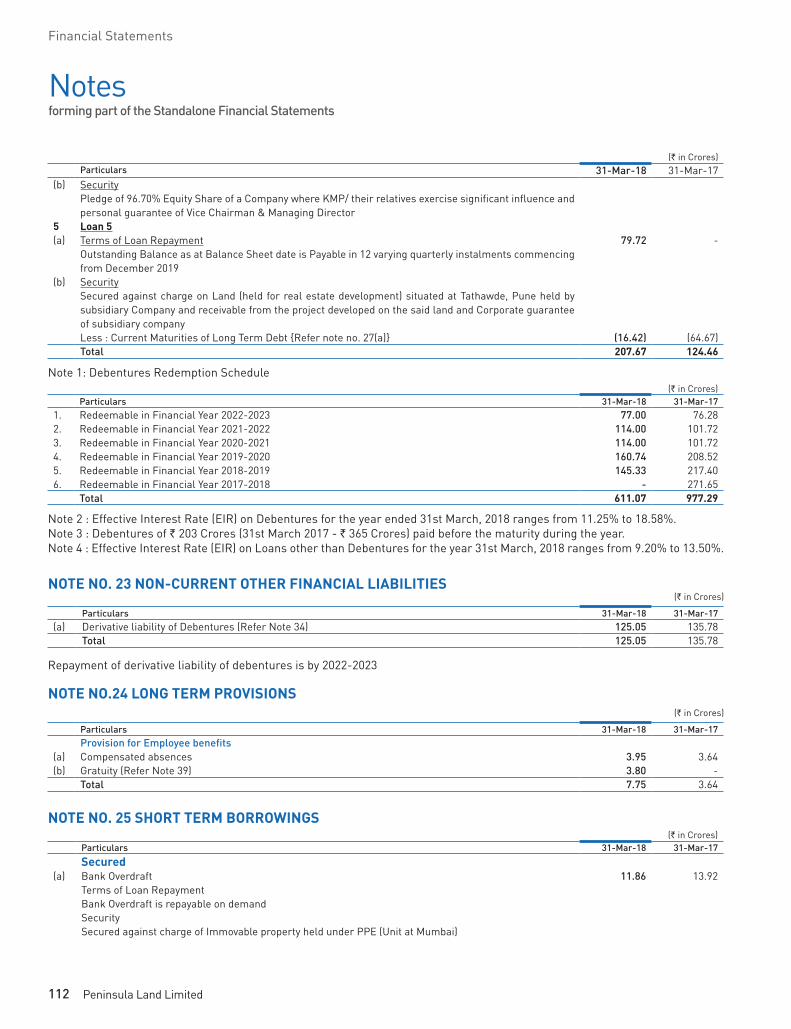
112 Peninsula Land Limited
Financial Statements
Notes forming part of the Standalone Financial Statements
(` in Crores)Particulars 31-Mar-18 31-Mar-17
(b) SecurityPledge of 96.70% Equity Share of a Company where KMP/ their relatives exercise significant influence and personal guarantee of Vice Chairman & Managing Director
5 Loan 5(a) Terms of Loan Repayment 79.72 -
Outstanding Balance as at Balance Sheet date is Payable in 12 varying quarterly instalments commencing from December 2019
(b) SecuritySecured against charge on Land (held for real estate development) situated at Tathawde, Pune held by subsidiary Company and receivable from the project developed on the said land and Corporate guarantee of subsidiary companyLess : Current Maturities of Long Term Debt {Refer note no. 27(a)} (16.42) (64.67)Total 207.67 124.46
Note 1: Debentures Redemption Schedule (` in Crores)
Particulars 31-Mar-18 31-Mar-171. Redeemable in Financial Year 2022-2023 77.00 76.28 2. Redeemable in Financial Year 2021-2022 114.00 101.72 3. Redeemable in Financial Year 2020-2021 114.00 101.72 4. Redeemable in Financial Year 2019-2020 160.74 208.52 5. Redeemable in Financial Year 2018-2019 145.33 217.406. Redeemable in Financial Year 2017-2018 - 271.65
Total 611.07 977.29
Note 2 : Effective Interest Rate (EIR) on Debentures for the year ended 31st March, 2018 ranges from 11.25% to 18.58%.Note 3 : Debentures of ` 203 Crores (31st March 2017 - ` 365 Crores) paid before the maturity during the year.Note 4 : Effective Interest Rate (EIR) on Loans other than Debentures for the year 31st March, 2018 ranges from 9.20% to 13.50%.
NOTE NO. 23 NON-CURRENT OTHER FINANCIAL LIABILITIES (` in Crores)
Particulars 31-Mar-18 31-Mar-17(a) Derivative liability of Debentures (Refer Note 34) 125.05 135.78
Total 125.05 135.78
Repayment of derivative liability of debentures is by 2022-2023
NOTE NO.24 LONG TERM PROVISIONS(` in Crores)
Particulars 31-Mar-18 31-Mar-17Provision for Employee benefits
(a) Compensated absences 3.95 3.64 (b) Gratuity (Refer Note 39) 3.80 -
Total 7.75 3.64
NOTE NO. 25 SHORT TERM BORROWINGS (` in Crores)
Particulars 31-Mar-18 31-Mar-17
Secured(a) Bank Overdraft 11.86 13.92
Terms of Loan RepaymentBank Overdraft is repayable on demandSecuritySecured against charge of Immovable property held under PPE (Unit at Mumbai)

113Annual Report 2017-18
Built for challenges. Preparing for growth.
Notes forming part of the Standalone Financial Statements
(` in Crores)Particulars 31-Mar-18 31-Mar-17
(b) Bank Overdraft 0.98 - Terms of Loan RepaymentBank Overdraft is repayable on demandSecuritySecured against charge on Fixed Deposit with BankUnsecured
(c) Bank Overdraft 72.54 14.81 Terms of Loan Repayment Bank Overdraft is repayable on demand
(d) Commercial paperTerms of Loan Repayment - 149.91 Repayable within one year from balance sheet date
(e) Loan From Financial Institution 68.66 68.65 Terms of Loan Repayment :Repayable in March 2019(Secured by Personal Guarantee of Executive Vice Chairman & Managing Director)
(f) Intercorporate Loan 71.60 40.00 Repayable on demandInterest rate on short-term borrowings ranges from 7.75% to 13.75%Total 225.64 287.29
NOTE NO. 26 TRADE PAYABLES (` in Crores)
Particulars 31-Mar-18 31-Mar-17(a) Total outstanding dues of Micro, Small and Medium Enterprises (Refer Note 43) 0.14 0.61 (b) Total outstanding dues of Creditors Other than Micro, Small and Medium Enterprises 84.07 133.66
Total 84.21 134.27
NOTE NO. 27 OTHER FINANCIAL LIABILITIES(` in Crores)
Particulars 31-Mar-18 31-Mar-17(a) Current Maturities of Long term debt (Refer Note 22) 199.86 490.45 (b) Interest accrued but not due on borrowings 128.04 77.66 (c) Unclaimed Dividend * 1.32 1.78 (d) Other Financial Liabilities (Including Condominium payable) 45.59 43.71 (e) Trade & Security Deposit 12.81 12.83
Total 387.62 626.43 * Investor education and protection fund shall be credited for unclaimed dividend when due as per section 124 & 125 of The Companies Act, 2013
NOTE NO. 28 OTHER CURRENT LIABILITIES(` in Crores)
Particulars 31-Mar-18 31-Mar-17(a) Advances from customer's/ Income Received in Advance 56.90 45.18 (b) Statutory Dues payable 2.48 4.98 (c) Deferred Guarantee Revenue 0.45 1.66
Total 59.83 51.82
NOTE NO. 29 PROVISIONS(` in Crores)
Particulars 31-Mar-18 31-Mar-17Provision for Employee benefits
(a) Gratuity (Refer Note 39) 1.05 - (b) Compensated absences 3.30 2.58
Total 4.35 2.58

114 Peninsula Land Limited
Financial Statements
Notes forming part of the Standalone Financial Statements
NOTE NO. 30 OTHER INCOME (` in Crores)
Particulars 2017-2018 2016-2017(a) Dividend on Mutual Fund 1.02 2.38 (b) Profit on sale of Property Plant and Equipment (Net) - 5.74 (c) Interest Income 195.89 181.14 (d) Miscellaneous Income 1.05 0.06
Total 197.96 189.32
NOTE NO.31 EMPLOYEE BENEFITS EXPENSE (INCLUDING MANAGERIAL REMUNERATION)(` in Crores)
Particulars 2017-2018 2016-2017(a) Salaries, Wages and Bonus 39.13 37.83 (b) Contributions to Provident Fund and other funds 2.22 2.42 (c) Gratuity (Refer Note 39) 6.53 2.14 (d) Staff Welfare Expenses 1.52 1.38
Total 49.40 43.77
NOTE NO. 32 FINANCE COSTS(` in Crores)
Particulars 2017-2018 2016-2017(a) Interest Expenses 319.96 287.14 (b) Other Borrowing Cost 1.44 1.15
321.40 288.29 Less: Transfer to Work-in-Progress (Refer Note 44) (41.13) (118.60)
Total 280.27 169.69
NOTE NO. 33 OTHER EXPENSES
(` in Crores)
Particulars 2017-2018 2016-2017(a) Power and Fuel 1.19 1.63
(b) Repairs & Maintenance - Buildings 0.43 0.69
(c) Repairs & Maintenance - Others 3.38 2.93
(d) Insurance 0.24 0.25
(e) Rent (Refer Note 41) 0.32 0.56
(f) Rates & Taxes 1.10 0.52
(g) Legal & Professional Fees 15.15 18.05
(h) Advertisement and Sales Promotions 4.10 4.50
(i) Brokerage & Commission 2.42 5.55
(j) Donations - 1.81
(k) Payment to Auditors (Refer Note 37) 0.34 0.40
(l) Directors' Sitting Fees 0.14 0.14
(m) Provision for Impairment of Loans & Investments 19.28 38.51
(n) Fair value loss on financial Instruments at FVTPL (Net) 12.25 13.99
(o) Miscellaneous Expenses 8.89 7.12
Total 69.23 96.65

115Annual Report 2017-18
Built for challenges. Preparing for growth.
Notes forming part of the Standalone Financial Statements
34 Financial Instruments - Fair Values and Risk Management
A Carrying Value/Fair Value as on reporting date (` in Crores)
Particulars 31-Mar-18FVTPL FVTOCI Amortised Cost Total
Financial Assets Cash and Cash equivalents - - 26.11 26.11 Other Bank Balances - - 34.75 34.75 Non Current Investments (Refer Note C(i) & D below) 132.10 - 322.72 454.82 Current Investments 0.99 - - 0.99 Non Current - Loans (Refer Note C(i) & D below) - - 195.01 195.01 Current - Loans - - 650.41 650.41 Trade Receivables - - 45.08 45.08 Other Non Current Financial Assets - - 195.78 195.78 Other Current Financial Assets - - 80.06 80.06 Total 133.09 - 1,549.92 1,683.01 Financial Liabilities Non Current Borrowings (Refer Note C(ii) below) - - 1,415.85 1,415.85 Current - Borrowings - - 225.64 225.64 Trade Payables - - 84.21 84.21 Other Non Current Financial Liabilities (Refer Note B below) 125.05 - - 125.05 Other Current Financial Liabilities - - 387.62 387.62 Total 125.05 - 2,113.32 2,238.37
(` in Crores)
Particulars 31-Mar-17FVTPL FVTOCI Amortised Cost Total
Financial Assets Cash and Cash equivalents - - 77.51 77.51 Other Bank Balances - - 46.30 46.30 Non Current Investments (refer note C(i) below) 154.17 - 325.73 479.90 Non Current - Loans (refer note C(i) below) - - 253.09 253.09 Current - Loans - - 729.46 729.46 Trade Receivables - - 36.52 36.52 Other Non Current Financial Assets - - 124.53 124.53 Other Current Financial Assets - - 90.91 90.91 Total 154.17 - 1,684.05 1,838.22 Financial Liabilities Non Current Borrowings (refer note C (ii) below) - - 1,191.00 1,191.00 Current Borrowings - - 287.29 287.29 Trade Payables - - 134.27 134.27 Other Non Current Financial Liabilities (refer note B below) 135.78 - - 135.78 Other Current Financial Liabilities - - 626.43 626.43 Total 135.78 - 2,238.99 2,374.77
B Fair Value of Derivative Financial Liability (` in Crores)
Particulars 31-Mar-18 31-Mar-17
Derivative Financial Liability towards issued debentures 125.05 135.78
C Fair Value of financial assets and liabilities which are measured at Amortised Cost
i Non-Current Investments and Non Current Loans measured at Amortised Cost includes investment in Unquoted Non-Convertible Debentures (NCDs) and Loan to Group Companies, the fair value of which is as stated below:

116 Peninsula Land Limited
Financial Statements
Notes forming part of the Standalone Financial Statements
(` in Crores)Particulars 31-Mar-18 31-Mar-17Investment in Unquoted Debentures (Refer Note 1 below) 300.00 300.00 Investment in Unquoted Debentures (Refer Note 2 below) 11.64 14.64 Non-Current Loans (Refer Note 3 below) 195.01 253.09 Investment in Unquoted Preference Shares (Refer Note 4 below) 11.09 11.09 Total 517.74 578.82
Note 1 : Quoted NCDs represent investments in a subsidiary `300 Crores where these are intended for holding till maturity and hence, the fair value is considered to be the same as the carrying value.
Note 2: Unquoted debentures in other entities considered to be at carrying amount. Note 3 : Fair value of Loans to Group Companies are considered to be at carrying amount. Note 4: Unquoted preference shares in Group Company considered to be at carrying amount.
ii Non-Current Borrowings and Other Non Current & Current Financial Liabilities designated at Amortised Cost includes debentures issued, the fair value of which is considered to be the same as carrying amount as these debentures are not actively traded and the interest yield are similar to market interest rates.
(` in Crores)Particulars 31-Mar-18 31-Mar-17Debentures Issued 611.07 977.29
iii The Management assessed that the carrying amount of Cash and Cash Equivalents, Other Bank Balances, Trade Receivables and Other Receivables, Other Current and Non Current Financial Assets, Current Borrowings and Other Current Financial Liabilities approximate their fair values due to their short term nature. Further, carrying value of Non-Current & Current Borrowings and Investments (current and non current) which are measured at Amortised Cost and having variable rate of interest, are reasonable approximation of the fair values.
D Fair Value Hierarchy:(` in Crores)
Financial Assets and Liabilities measured at FVTPL Quoted price in active markets
(Level 1)
Significant observable inputs
(Level 2)
Significant unobservable inputs
(Level 3)
Total
31 March 2018Financial Assets Unquoted Debenture Instruments - - 132.10 132.10 Total Financial Assets - - 132.10 132.10 Financial LiabilitiesDerivative Financial Liability - - 125.05 125.05 Total Financial Liabilities - - 125.05 125.05
(` in Crores)Financial Assets and Liabilities measured at Amortised Cost Quoted price in
active markets (Level 1)
Significant observable inputs
(Level 2)
Significant unobservable inputs
(Level 3)
Total
31 March 2018Financial AssetsInvestments Unquoted Preference Shares - - 11.09 11.09 Investment in Unquoted Debentures - - 300.00 300.00 Investment in unquoted Debentures - - 11.64 11.64 Loans & AdvancesNon-Current Loans - - 195.01 195.01 Total Financial Assets - - 517.74 517.74 Financial LiabilitiesDebentures 611.07 - - 611.07 Total Financial Liabilities 611.07 - - 611.07

117Annual Report 2017-18
Built for challenges. Preparing for growth.
Notes forming part of the Standalone Financial Statements
(` in Crores)Financial Assets and Liabilities measured at FVTPL Quoted price in
active markets (Level 1)
Significant observable inputs
(Level 2)
Significant unobservable inputs
(Level 3)
Total
31 March 2017Financial Assets Unquoted Debenture Instruments - - 154.00 154.00 Unquoted Equity Instruments - - 0.17 0.17 Total Financial Assets - - 154.17 154.17 Financial LiabilitiesDerivative Financial Liability - - 135.78 135.78 Total Financial Liabilities - - 135.78 135.78
(` in Crores)Financial Assets and Liabilities measured at Amortised Cost Quoted price in
active markets (Level 1)
Significant observable inputs
(Level 2)
Significant unobservable inputs
(Level 3)
Total
31 March 2017Financial AssetsInvestments Unquoted Preference Shares - - 11.09 11.09 Investment in Quoted Debentures 300.00 - - 300.00 Investment in Unquoted Debentures - - 14.64 14.64 Loans & AdvancesNon-Current Loans - - 253.09 253.09 Total Financial Assets 300.00 - 278.82 578.82 Financial LiabilitiesDebentures 977.29 - - 977.29 Total Financial Liabilities 977.29 - - 977.29
E Measurement of Fair Values
Particulars Valuation Technique Significant unobservable inputs
Sensitivity of the input to fair value
Non-Current Loans
Discounted cash flow technique - The valuation model considers the present value of expected payment, discounted using a risk adjusted discount rate. The expected payment is determined by considering the possible scenarios of forecast revenue and EBITDA, the amount to be paid under each scenario and the probability of each scenario. The Company has taken 3 years as expected recovery period for all loans which are outstanding at opening balance sheet date for the purpose of discounting. The Company has taken weighted average cost of debt for the purpose of discounting of loans.
Risk adjusted discount rate - 15% (31-Mar-18 & 31-Mar-17)
The estimated fair value would increase / (decrease) if the risk adjusted discount rate were lower / (higher)
Investment in Unquoted Debentures and Preference Shares
Non convertible debentures are held for interest till maturity largely in a subsidiary company undertaking a specific project and not intended for trading or disposal. Hence, in view of the unique nature of these investments, the carrying amount is considered to be the fair value.
For investment in preference shares discounted cash flow technique is used. The valuation model considers the present value of expected payment, discounted using a risk adjusted discount rate. The expected payment is determined by considering the possible scenarios of forecast revenue and EBITDA, the amount to be paid under each scenario and the probability of each scenario.
Risk adjusted discount rate - 25% (31-Mar-18 & 31-Mar-17) Expected sales growth -5% (31-Mar-18 & 31-Mar-17)
The estimated fair value would increase / (decrease) if risk adjusted discount rate were lower / (higher) and expected sales growth were higher / (lower)

118 Peninsula Land Limited
Financial Statements
Notes forming part of the Standalone Financial Statements
Particulars Valuation Technique Significant unobservable inputs
Sensitivity of the input to fair value
Derivative Financial Liability towards issued debentures
Present value of embedded derivative, being the expected redemption premium payable on NCDs issued, discounted using a risk adjusted discount rate, based on FIMMDA rates of similar instruments as determined by Valuation experts. As per terms of issue, the redemption premium is calculated using an agreed formula on the basis of expected weighted average selling price (WASP) to be achieved in certain identified projects. WASP is estimated by considering the possible scenarios of Sales and pricing trends over the project period.
(1) Risk adjusted discount rate - 9.96 % (31 March 18) and 10.50 % (31 March 17)
(2) Expected WASP `25,524 per sq feet (31 March 18 and 31 March 17)
(1) The estimated fair value would increase / (decrease) if risk adjusted discount rate were lower / (higher) and expected sales growth were higher / (lower)
(2) The estimated fair value would increase / (decrease) if expected WASP were higher/ (lower)
There have been no transfers between Level 1 and 2 during the year.
F Reconciliation of Level 3 fair values
The following table shows a reconciliation from the opening balances to the closing balances for Level 3 fair values for assets :(` in Crores)
Particulars Investments Non Current LoansOpening Balance (01 April 2016) 195.01 815.59 Net change in fair value due to unwinding of discount - - Reclassification of loans to short term - (499.56)Net amount lent during the year - (62.94)Add: Net proceeds from sale of investment (1.07) - Change in fair value of investments (14.04) - Closing Balance (31 March 2017) 179.90 253.09 Opening Balance (01 April 2017) 179.90 253.09 Provision for impairment - (91.50)Net amount lent during the year - 33.42 Add: Net proceeds from sale of investment (3.00) - Change in fair value of investments (22.08) - Closing Balance (31 March 2018) 154.83 195.01
The following table shows a reconciliation from the opening balances to the closing balances for Level 3 fair values for liabilities - Derivative Financial Liability.
(` in Crores)Particulars 31-Mar-18 31-Mar-17Balance as at beginning of the year 135.78 - Change in fair value (10.73) 135.78 Balance as at end of the year 125.05 135.78
G Sensitivity Analysis
For the fair values of non-current investments and Non-Current loans and advances, reasonably possible changes at the reporting date to one of the significant unobservable inputs, holding other inputs constant, would have the following effects.
(` in Crores)Particulars 31-Mar-18
Profit or Loss 31-Mar-17
Profit or Loss Increase Decrease Increase Decrease
Non-Current Loans Risk adjusted discount rate (100 bps movement) - - - - InvestmentsRisk adjusted discount rate (100 bps movement) (1.16) 1.25 (1.62) 1.71

119Annual Report 2017-18
Built for challenges. Preparing for growth.
Notes forming part of the Standalone Financial Statements
H Risk Management Framework
The Company’s Board of Directors has overall responsibility for the establishment and oversight of the Company’s risk management framework. The Board of Directors has established the Risk Management Committee, which is responsible for developing and monitoring the Company’s risk management policies. The Committee reports regularly to the Board of Directors on its activities.
The Company’s risk management policies are established to identify and analyse the risks faced by the Company, to set appropriate risk limits and controls and to monitor risks and adherence to limits. Risk management policies and systems are reviewed regularly to reflect changes in market conditions and the Company’s activities. The Company, through its training and management standards and procedures, aims to maintain a disciplined and constructive control environment in which all employees understand their roles and obligations.
a Credit Risk
Credit risk is the risk of financial loss to the Company if a customer or counterparty to a financial instrument fails to meet its contractual obligations, and arises principally from the Company’s receivables from customers, loans and investment in debt securities. Credit risk is managed through credit approvals, establishing credit limits and continuously monitoring the creditworthiness of customers to which the Company grants credit terms in the normal course of business. The Company establishes an allowance for doubtful debts and impairment that represents its estimate of incurred losses in respect of trade and other receivables and investments and loans.
The Company’s maximum exposure to credit risk is the carrying value of each class of financial assets.
i Trade and other receivables
Customer credit risk for realty sales is managed by entering into sale agreements in the case of sale of under-construction flats / premises which stipulate construction milestone based payments and interest clauses in case of delays and also by requiring customers to pay the total agreed sale value before handover of possession of the premises / flats, thereby substantially eliminating the Company's credit risk in this respect. In the case of sale of finished units, sale agreements are executed only upon / against full payment.
Credit risk on trade receivables in respect of realty rentals is limited as the customers of the Company mainly consists of Government authorities / Group Companies. Based on the past history of payments received, there have been no defaults.
Credit risk on trade receivables in respect of other operating income is Nil since the terms of payment are 100% through advance billing and collections.
ii Impairment
Ageing of trade and other receivables that were not impaired was as follows.
(` in Crores)Particulars 31-Mar-18 31-Mar-17 Neither past due nor impaired - 15.37 Past due but not impairedPast due 1–180 days 23.74 7.46 Past due more than 180 days 20.81 13.69 Total 44.55 36.52
Expected credit loss assessment for customers as at 31st March 2018 and 31st March 2017: Exposures to customers outstanding at the end of each reporting period are reviewed by the Company to determine incurred
and expected credit losses. Historical trends of impairment of trade receivables do not reflect any significant credit losses. Given that the macro economic indicators affecting customers of the Company have not undergone any substantial change, the Company expects the historical trend of minimal credit losses to continue. Further, Management believes that the unimpaired amounts that are past due by more than 30 days are still collectible in full, based on historical payment behaviour and extensive analysis of customer credit risk. In view of the above, the Company believes that no provision is required as per expected credit loss method.

120 Peninsula Land Limited
Financial Statements
Notes forming part of the Standalone Financial Statements
The movement in the allowance for impairment in respect of trade and other receivables during the year was as follows.
(` in Crores)Particulars 31-Mar-18 31-Mar-17 Balance as at beginning of the year 0.14 0.14 Impairment loss recognised - - Amounts written off - - Balance as at end of the year 0.14 0.14
ii Loans and Financial Guarantees
The loans and advances are in the nature of advances for project in SPVs where the Company is a stakeholder and hence the risk is minimal. Based on the above factors and historical data, loss on collection of receivables is not material and hence no additional provision was made apart from provisions for impairment in respect of certain specific loans based on the fair valuation by independent valuers.
(` in Crores)Particulars 31-Mar-18 31-Mar-17 Loans (Current and Non Current) 845.42 982.55 Total 845.42 982.55
The movement in the allowance for impairment in respect of loans and financial guarantees during the year was as follows.
(` in Crores)Particulars 31-Mar-18 31-Mar-17 Balance as at April 1, 2017 37.26 - Impairment loss recognised 115.17 37.26 Amounts written off - - Balance as at March 31, 2018 152.43 37.26
Outstanding Financial Guarantees(` in Crores)
Particulars 31-Mar-18 31-Mar-17 Truewin Realty Limited 80.00 80.00 Total 80.00 80.00
Expected credit loss assessment of loans as at 31st March 2018 and 31st March 2017: Considering the nature of the business, the Company has a policy to provide loans and financial guarantees to its group
entities for undertaking projects, based on its primary business model of undertaking project developments through SPV's. The loans given to these entities are repayable on demand and there is no past history for any default / delay / irregularity / invocation of guarantees in repayments based on demands made. Moreover, all the group entities to whom loans have been advanced, have substantial potential in the projects to repay the loan based on the valuation of such entities and their activities are controlled and managed by the company. Accordingly ,in view of such control over operations and underlying security of the project / assets, these loans are considered adequately secured for repayments, except in cases where the independent valuation of underlying projects warrant provision for impairment.
iii Investments measured at amortised cost
The Company has investments in secured redeemable non convertible debentures and the settlement of such instruments is linked to the completion of the respective underlying projects. Further these instruments are secured by way of first charge on the underlying project assets. Moreover, there are no deviations / irregularity in terms of servicing of debt and interest in respect of these instruments. Hence no impairment has been recognised on such investments till date.
iv Cash & Cash Equivalents and other bank balances
The Company held cash and bank balances with credit worthy banks of `60.86 Crores at 31st March 2018 (31st March 2017: `123.81 Crores). The credit risk on cash & cash equivalents and other bank balances is limited as the Company generally invests in deposits with banks where credit risk is largely perceived to be extremely insignificant.

121Annual Report 2017-18
Built for challenges. Preparing for growth.
Notes forming part of the Standalone Financial Statements
b Liquidity Risk
Liquidity risk is the risk that the Company will encounter difficulty in meeting the obligations associated with its financial liabilities that are settled by delivering cash or another financial asset. The Company’s approach to managing liquidity is to ensure, as far as possible, that it will have sufficient liquidity to meet its liabilities when they are due, under both normal and stressed conditions, without incurring unacceptable losses or risking damage to the Company’s reputation.
Management monitors rolling forecasts of the Company’s liquidity position on the basis of expected cash flows. The Company manages its liquidity risk by preparing monthly cash flow projections to monitor liquidity requirements. In addition, the Company projects cash flows and considering the level of liquid assets necessary to meet these, monitoring the Balance Sheet liquidity ratios against internal and external regulatory requirements and maintaining debt financing plans.
i Financing Arrangements
The Company has access to the following undrawn borrowing facilities at the end of the reporting period
(` in Crores)Particulars 31-Mar-18 31-Mar-17 Floating Rate InstrumentsExpiring within one year (bank overdraft and other facilities) - - Expiring beyond one year (loans from bank and FI) 79.00 16.90
The bank overdraft facility may be drawn at any time and may be terminated by the Bank without notice, subject to the continuance of satisfactory credit ratings, the bank loan facilities may be drawn at any time and have maturity period from 3 to 5 years.
ii Exposure to Liquidity Risk
The following are the remaining contractual maturities of financial liabilities at the reporting date. The amounts are gross and undiscounted, and include estimated interest payments and exclude the impact of netting agreements.
31st March, 2018 (` in Crores) Carrying Value Within 12 months
1-2 Years 2-5 Years > 5 Years Total
A. Financial Assets Non-Current Investments 454.82 - 134.14 300.00 20.68 454.82 Non-Current Loans 195.01 - 195.01 - - 195.01 Other Non-Current Financial Assets 195.78 - 192.47 - 3.31 195.78 Current Investments 0.99 0.99 - - - 0.99 Trade Receivables 45.08 45.08 - - - 45.08 Cash and Cash Equivalents 26.11 26.11 - - - 26.11 Bank Balances 34.75 34.75 - - - 34.75 Current Loans 650.41 650.41 - - - 650.41 Other Financial Assets 80.06 80.06 - - - 80.06 Total Assets 1683.01 837.40 521.62 300.00 23.99 1683.01B. Non Derivative Financial Liabilities Non-Current Borrowings 1,415.85 - 257.89 1,004.46 153.50 1,415.85 Current Borrowings 225.64 225.64 - - - 225.64 Current Maturities of Long Term Debt 199.86 199.86 - - - 199.86 Interest Accrued but not due 128.04 128.04 - - - 128.04 Trade and other payables 84.21 84.21 - - - 84.21 Other Non Current Financial Liabilities 59.72 - 59.72 - - 59.72 Other Current Financial Liabilities - - - - - - C. Financial Guarantee * 80.00 80.00 - - - 80.00 D. Derivative Financial Liability 125.05 - - - 125.05 125.05
Total Liabilities 2318.37 717.75 317.61 1004.46 278.55 2318.37

122 Peninsula Land Limited
Financial Statements
Notes forming part of the Standalone Financial Statements
31st March, 2017 (` in Crores) Carrying Value Within 12 months
1-2 Years 2-5 Years > 5 Years Total
A. Financial Assets Non Current Investments 479.90 - 9.65 449.40 20.85 479.90 Non Current Loans 253.09 - - 253.09 - 253.09 Other Non Current Financial Assets 124.53 - - 122.21 2.32 124.53 Trade Receivables 36.52 36.52 - - - 36.52 Cash and Cash Equivalents 77.51 77.51 - - - 77.51 Bank Balances 46.30 46.30 - - - 46.30 Current Loans 729.46 729.46 - - - 729.46 Other Financial Assets 90.91 90.91 - - - 90.91 Total Asset 1838.22 980.70 9.65 824.70 23.17 1838.22B. Non Derivative Financial Liabilities Non-current Borrowings 1,191.00 - 387.31 572.09 231.60 1,191.00 Current Borrowings 287.29 287.29 - - - 287.29 Current Maturities of Long Term Debt 490.45 490.45 - - - 490.45 Interest Accrued but not due 77.66 77.66 - - - 77.66 Trade and other payables 134.27 134.27 - - - 134.27 Other Non Current Financial Liabilities - - - - - - Other Current Financial Liabilities 58.32 58.32 - - - 58.32 C. Financial Guarantee * 80.00 - 80.00 - - 80.00 D. Derivative Financial Liability 135.78 - - - 135.78 135.78 Total Liabilities 2454.77 1047.99 467.31 572.09 367.38 2454.77
* Financial guarantees issued by the Company on behalf of associate entities are with respect to borrowings raised by the respective entities. These amounts will be payable on default by the concerned entities. As of the reporting date, none of the entities have defaulted and hence, the Company does not have any present obligation to third parties in relation to such guarantees. The same has been disclosed as contingent liabilities. (Refer Note 35(c)(i)).
c Market Risk
Market risk is the risk that changes in market prices such as foreign exchange rates, interest rates and equity prices will affect the Company’s income or the value of its holdings of financial instruments. Market risk is attributable to all market risk sensitive financial instruments including foreign currency receivables and payables and long term debt. The Company is exposed to market risk primarily related to interest rate risk and the market value of the investments.
d Currency Risk
The functional currency of the Company is Indian Rupee. Currency risk is not material, as the Company does not have significant exposure in foreign currency.
i Exposure to Currency Risk
The currency profile of Financial Assets and Financial Liabilities as at 31st March 2018 and 31st March 2017 is Nil.
ii Interest Rate Risk
Interest rate risk can be either fair value interest rate risk or cash flow interest rate risk. Fair value interest rate risk is the risk of changes in fair values of fixed interest bearing investments because of fluctuations in the interest rates. Cash flow interest rate risk is the risk that the future cash flows of floating interest bearing investments will fluctuate because of fluctuations in the interest rates.
Exposure to interest rate risk
In order to optimize the Company’s position with regards to interest income and interest expenses and to manage the interest rate risk, treasury performs a comprehensive corporate interest rate risk management by balancing the proportion of fixed rate and floating rate financial instruments in its total portfolio. According to the Company interest rate risk exposure is only for floating rate borrowings. The interest rate profile of the Company’s interest-bearing financial instruments as reported to the management of the Company is as follows.

123Annual Report 2017-18
Built for challenges. Preparing for growth.
Notes forming part of the Standalone Financial Statements
(` in Crores)Particulars 31-Mar-18 31-Mar-17Fixed Rate InstrumentsFinancial AssetsLoans and Advances 844.84 981.76 Fixed Deposit 51.86 61.22 Investment in Debentures 322.73 325.73 A 1,219.43 1,368.71 Financial LiabilitiesBonds / Debentures 611.07 977.29 Intercorporate Loans 71.60 40.00 Commercial Paper - 149.91 B 682.67 1,167.20 Variable Rate InstrumentsFinancial LiabilitiesTerm loans from Bank 593.85 241.00 Term loans from Financial Institutions 217.24 188.55 Other loans 207.67 124.46 Bank Overdrafts 85.38 28.73 Current Maturities of Long Term Debt 54.54 218.80 C 1,158.68 801.54
iii Price Risk
Price risk is the risk that the fair value of a financial instrument will fluctuate due to changes in market traded price. It arises from financial assets such as investments in quoted instruments and units of mutual funds.
The Company is exposed to price risk arising mainly from investments in quoted debentures measured at amortised cost, having carrying value ` 300.00 Crores as at 31st March 2018, (31st March 2017 - ` 300.00 Crores).
a Fair value sensitivity analysis for fixed rate Instruments
The Company does not account for any fixed rate financial assets or financial liabilities at fair value through Profit or Loss. Therefore, a change in interest rates at the reporting date would not affect Profit or Loss.
b Cash flow sensitivity analysis for variable rate Instruments
A reasonably possible change of 100 basis points in interest rates at the reporting date would have increased (decreased) equity and profit or loss by the amounts shown below. This analysis assumes that all other variables remain constant.
(` in Crores)Particulars 31-Mar-18
Profit or Loss 31-Mar-17
Profit or Loss Increase Decrease Increase Decrease
Variable Rate InstrumentsTerm loans from bank 6.32 (6.32) 1.77 (1.77)Term loans from financial institutions 1.49 (1.49) 3.38 (3.38)Bank overdraft 1.54 (1.54) 0.81 (0.81)Others 2.24 (2.24) 1.09 (1.09)
35 Commitments and Contingent Liabilities(` in Crores)
Particulars As At 31-Mar-18
As At 31-Mar-17
a. Capital Commitments - - b. Claims against the Company not acknowledged as debts in respect of(i) Income Tax demand under appeal 48.61 - (ii) VAT demand under appeal 49.77 49.77 (iii) Disputed claims relating to certain projects (excluding interest and penalties) 13.60 12.28 c. Guarantees given to Financial Institutions for(i) Associates 80.00 80.00

124 Peninsula Land Limited
Financial Statements
Notes forming part of the Standalone Financial Statements
36 Revenue From Operations(` in Crores)
Particulars Year Ended 31-Mar-18
Year Ended 31-Mar-17
a Sale of ProductsRealty Sales 423.89 228.94
b Sale of ServicesRental Income from Investment Property 31.84 30.80 Other Rental Income 3.53 3.64
c Other Operating RevenueMiscellaneous Income 16.14 1.19 Total 475.40 264.57
37 Payment to auditors (excluding taxes)(` in Crores)
Particulars Year Ended 31-Mar-18
Year Ended 31-Mar-17
As auditor:a Audit fees 0.17 0.23 b Tax audit fees 0.03 0.07 c Limited review 0.10 0.05
In other capacity:d Other services (certification fees) 0.03 0.04 e Reimbursement of expenses 0.01 0.01
Total 0.34 0.40
38 Borrowing Cost (` in Crores)
Particulars Year Ended 31-Mar-18
Year Ended 31-Mar-17
Borrowing Cost treated as project cost during the year 41.13 118.60
39 Employee Benefits The Company has various benefit plans as under:
A Defined Contribution Plan
The Company makes contributions towards provident fund, superannuation fund and other retirement benefit plans for qualifying employees. Under the plans, the Company is required to contribute a specified percentage of payroll cost to the retirement benefit plan to fund the benefits. The contributions payable to these plans by the Company are at rates specified in the rules of the schemes.
The Company has recognised the following amounts in Statement of profit and loss included in Contributions to Provident Fund and Other funds under Employee Benefit Expenses (refer note 31)
(` in Crores)Particulars Year Ended
31-Mar-18 Year Ended
31-Mar-17Employer's contribution to provident fund 2.00 2.18 Employer's contribution to superannuation fund 0.21 0.23 Employer's contribution to employees state insurance corporation and other funds 0.01 0.01
B Defined Benefit Plan
i The Company makes annual contributions to the Group Gratuity cum Life Assurance Schemes administered by the LIC of India, a funded defined benefit plan for qualifying employees. The scheme provides for payment as under:

125Annual Report 2017-18
Built for challenges. Preparing for growth.
Notes forming part of the Standalone Financial Statements
a On normal retirement / early retirement / withdrawal / resignation - As per the provisions of the Payment of Gratuity Act, 1972 with vesting period of 5 years of continuous service.
b On death in service - As per the provisions of the Payment of Gratuity Act, 1972 without any vesting period.
The most recent actuarial valuation of plan assets and the present value of the defined benefit obligation for gratuity was carried out as at 31st March, 2018. The present value of the defined benefit obligations and the related current service cost and past service cost, were measured using Projected Unit Credit Method
Based on the actuarial valuation obtained in this respect, the following table sets out the status of the gratuity plan and the amounts recognised in the Company’s financial statements as at Balance Sheet date:
(` in Crores)31-Mar-18 31-Mar-17
ii Amounts recognised in the balance sheetPresent value of defined benefit obligation at the end of the year 7.85 3.96 Fair value of plan assets at the end of the year 3.00 4.00Net defined benefit liabilities/(asset) recognised in the balance sheet 4.85 (0.04)
iii Changes in present value of defined benefit obligationsAt the beginning of the year 3.96 3.67 Transfer in / (out) obligation 0.10 - Interest cost 0.26 0.27 Service cost 0.64 0.65 Re-measurement (gain) / loss (0.20) (0.14)Benefits paid (1.64) (2.81)Past service cost 4.73 2.32 At the end of the year 7.85 3.96
iv Changes in fair value of plan assetsAt the beginning of the year 3.99 3.19 Expenses deducted from fund - (0.02)Interest income 0.28 0.25 Employer’s contribution (0.06) 3.42 Return on plan assets, excluding amount included in interest income 0.06 (0.05)Benefits paid (1.27) (2.79)At the end of the year 3.00 4.00
v Expenses recognised in the statement of profit and lossCurrent service cost 0.64 0.65 Past service cost and loss/(gain) on curtailments and settlement 5.24 2.32 Net interest cost (0.03) 0.01 Expenses deducted from the fund - 0.03 Total expenses recognised in the statement of profit and loss 5.85 3.01
vi Expenses recognised in other comprehensive incomeRemeasurement gains/(losses) in OCIDue to Change in financial assumptions (0.23) 0.22 Due to change in demographic assumption - - Due to experience adjustments (0.48) (0.37)Return on plan assets excluding amounts included in interest income 0.06 0.05 Total expenses recognised in other comprehensive income (0.65) (0.10)
vii Classification of defined benefit obligationsCurrent liability* 1.05 (0.04)Non current liability 3.80 -
viii The major categories of plan assets as a percentage of the fair value of the total plan assets are as followsInvestment in insurance policy 100% 100%

126 Peninsula Land Limited
Financial Statements
Notes forming part of the Standalone Financial Statements
31-Mar-18 31-Mar-17
ix Principal actuarial assumptionsDiscount rate 7.60% 7.20%Salary escalation rate 7.00% 7.00%Mortality rate Indian Assured
Lives Mortality (2006-08)
Indian Assured Lives Mortality
(2006-08)Withdrawal rates 12% at younger
ages reducing to 1% at older ages
12% at younger ages reducing to 1% at older ages
Retirement age 60 years 60 years
x Sensitivity analysis
Reasonably possible changes at the reporting date to one of the relevant actuarial assumptions, holding other assumptions constant, would have affected the defined benefit obligation by the amounts shown below:
(` in Crores)31-Mar-18 31-Mar-17
Discount rate SensitivityIncrease by 0.5% 7.58 3.81 Decrease by 0.5% 8.14 4.12
Salary growth rate SensitivityIncrease by 0.5% 8.14 4.05 Decrease by 0.5% 7.58 3.86
Withdrawal rate SensitivityIncrease by 0.5% 7.85 3.98 Decrease by 0.5% 7.85 3.91
The sensitivity analysis above have been determined based on a method that extrapolates the impact on defined benefit obligation as a result of reasonable changes in key assumptions occurring at the end of the reporting period.
xi Expected Future Cash Flows
The expected future cash flows in respect of defined benefit gratuity plan as at March 31, 2018 were as follows:
(` in Crores)31-Mar-18 31-Mar-17
Year 1 2.61 0.62Year 2 0.33 0.33Year 3 0.48 0.30Year 4 0.30 0.38Year 5 0.44 0.28Year 6 to Year 10 2.31 1.55
The expected contribution for define benefit plan for the next financial year is ` 4.84 Crores.
C Other Long Term Employee Benefits
Compensated absences are payable to employees at the rate of daily salary for each day of accumulated leave on death or on resignation or upon retirement. The charge towards compensated absences for the year ended March 31, 2018 based on actuarial valuation using the Projected Unit Credit Method is ` 7.25 Crores (31st March 2017 - ` 6.22 Crores)

127Annual Report 2017-18
Built for challenges. Preparing for growth.
Notes forming part of the Standalone Financial Statements
40 Related Party Disclosure
A. Controlling Entity
(i) Ashok Piramal Group Real Estate Trust
B. Key Management Personnel
(i) Ms. Urvi A. Piramal - Non Executive Chairperson (ii) Mr. Rajeev A. Piramal - Vice Chairman & Managing Director(iii) Mr. Mahesh S. Gupta - Group Managing Director(iv) Mr. Nandan A. Piramal - Wholetime Director (v) Ms. Bhavna G. Doshi - Independent Director(vi) Mr. Sudhindar K Khanna - Independent Director(vii) Lt Gen (Retd) Deepak Summanwar - Independent Director(viii) Mr. Bharat Sanghvi- Chief Financial Officer(ix) Mr. Rajashekar Reddy- Company Secretary
C. Relatives of Key Management Personnel
(i) Mr. Harshvardhan A. Piramal - Son of Non Executive Chairperson (ii) Ms. Sunita Gupta - Spouse of Group Managing Director (iii) Ms. Kalpana Singhania - Sister of Non Executive Chairperson (iv) Mr.Gautam Doshi- Spouse of Independent Director (v) Mr.Nishith Sanghvi- Son of Chief Finance Officer
D. Subsidiaries
(i) Peninsula Holdings and Investments Private Limited (ii) Peninsula Mega Properties Private Limited (iii) Peninsula Crossroads Private Limited (iv) Pavurotti Real Estate Development Private Limited (v) Goodtime Real Estate Development Private Limited (vi) Peninsula Mega Township Developers Limited (vii) Midland Township Private Limited (converted from step down subsidiary to subsidiary w.e.f. 19/10/2016)(viii) Rock First Real Estate Limited (converted from associate to subsidiary w.e.f 31/3/2018) (ix) Goodhome Realty Limited (converted from step-down associate to subsidiary w.e.f 31/3/2018)(x) RR Mega City Builders Limited (converted from step-down associate to subsidiary w.e.f 31/3/2018)(xi) Truewin Realty Limited (converted from step-down associate to subsidiary w.e.f 31/3/2018)(xii) Peninsula Realty Fund (became subsidiary from 31/3/2018) (xiii) Peninsula GSG MHP Project - AOP (50% share) (ceased to be subsidiary from 13/10/2016)
E. Step Down Subsidiaries
(i) Inox Mercantile Company Private Limited (ii) Peninsula Facility Management Services Limited (iii) Peninsula Investment Management Company Limited (iv) Peninsula Pharma Research Centre Private Limited (v) Peninsula Trustee Limited (vi) Planetview Mercantile Company Private Limited (vii) RR Real Estate Development Private Limited (viii) Takenow Property Developers Private Limited (ix) Peninsula Integrated Land Developers Private Limited (x) Peninsula Mega City Development Private Limited (xi) Sketch Real Estate Private Limited (xii) Argento Real Estate LLP (ceased to be step down subsidiary w.e.f. 15/11/2017) (xiii) Gorena Real Estate LLP (ceased to be step down subsidiary w.e.f. 15/11/2017) (xiv) Maxis Real Estate LLP (ceased to be step down subsidiary w.e.f. 15/11/2017) (xv) Nebustar Real Estate LLP (ceased to be step down subsidiary w.e.f. 15/11/2017)

128 Peninsula Land Limited
Financial Statements
Notes forming part of the Standalone Financial Statements
(xvi) Regena Real Estate LLP (ceased to be step down subsidiary w.e.f. 15/11/2017) (xvii) Eastgate Real Estate Developers LLP (xviii) Westgate Real Estate Developers LLP (xix) Topvalue Real Estate Development Private Limited (converted from joint venture to step down subsidiary w.e.f.
31/03/2017)
F. Associates
(i) SEW Engineering (India) Private Limited (held for sale as at 31/03/2018) (ii) RA Realty Ventures LLP (iii) JM Realty Management Private Limited (held for sale as at 31/03/2018)
G. Joint Venture
(i) Bridgeview Real Estate Development LLP
H. Step Down Joint Ventures
(i) Hem Infrastructure and Property Developers Private Limited (ii) HEM Bhattad AOP (iii) Peninsula Brookfield Trustee Private Limited (iv) PenBrook Capital Advisors Private Limited (formerly known as Peninsula Brookfield Investment Managers Private
Limited)
I. Companies where Key Management Personnel / their relatives exercise significant influence
(i) Ashok Piramal Management Corporation Limited (ii) Freedom Registry Limited (iii) Morarjee Textiles Limited (iv) Thundercloud Technologies (India) Private Limited (v) Peninsula SA Realty Private Limited (vi) Peninsula Townships Development Private Limited (vii) Ashok Piramal Mega City Development Private Limited (viii) Ashok Piramal Mega Properties Private Limited (ix) Ashok Piramal Township Development Private Limited (x) Goldlife Mercantile Company Private Limited (xi) Highway Concessions One Private Limited (xii) Miranda Bi-Metal Tools Private Limited (xiii) PMP Auto Components Private Limited (xiv) Powerjet Carriers and Transporters Private Limited (xv) Delta Corp Limited (xvi) Topvalue Brokers Private Limited (xvii) Piramal Land Private Limited
J. Enterprises where Key Management Personnel / their relatives exercise significant influence
(i) Urvi Ashok Piramal Foundation (ii) Morarjee Goculdas Spinning & Weaving Company Limited Senior ESOP Trust (iii) Peninsula Land Limited ESOP Trust

129Annual Report 2017-18
Built for challenges. Preparing for growth.
Notes forming part of the Standalone Financial Statements
40a Related Party Disclosure as per Regulation 34 (3) of the SEBI (Listing Obligations and Disclosure Requirements) Regulations, 2015
Loans and Advances to Subsidiaries, Associates and Companies / Enterprises under the same Management
(Repayment schedule not given as these are repayable on demand and interest free except as stated otherwise)
(` in Crores)Particulars As At
31-Mar-18 As At
31-Mar-17Maximum Outstanding during the year
31-Mar-18 31-Mar-17A Subsidiaries(i) Peninsula Holdings and Investments Private Limited * 316.36 415.45 445.32 415.44 (ii) Pavurotti Real Estate Private Limited * 69.36 46.82 69.36 46.82 (iii) Peninsula Mega Township Developers Limited 0.00 0.43 0.46 0.43 (iv) Peninsula Mega Properties Private Limited 0.02 0.01 0.02 0.01 (v) Peninsula GSG MHP Project - AOP (50% share) - 1.33 - 2.33 (vi) Rockfirst Real Estate Limited 19.62 21.38 36.86 56.35 (vii) Goodhome Realty Limited 10.18 4.76 10.18 4.76 (viii) RR Mega City Builders Limited - 0.51 5.86 2.99 (ix) Truewin Realty Limited 0.03 0.03 5.25 1.96
Total (a) 415.57 490.72 B Step Down Subsidiaries(i) Inox Mercantile Company Private Limited 88.05 76.02 88.05 76.02 (ii) RR Real Estate Development Private Limited 37.74 32.58 37.74 32.58 (iii) Peninsula Pharma Research Centre Private Limited 35.97 30.98 35.97 30.98 (iv) Planetview Mercantile Company Private Limited 28.47 24.55 28.47 24.55 (v) Takenow Property Developers Private Limited 3.09 2.78 3.09 2.78 (vi) Peninsula Mega City Development Private Limited 0.42 0.36 0.42 0.36 (vii) Sketch Real Estate Private Limited 0.04 0.04 0.04 0.04 (viii) Peninsula Investment Management Company Limited - 0.02 0.02 0.02 (ix) Peninsula Integrated Land Developers Private Limited 0.00 0.00 0.00 0.00 (x) Argento Real Estate LLP - - - 0.01 (xi) Gorena Real Estate LLP - - - 0.01 (xii) Maxis Real Estate LLP - - - 0.01 (xiii) Nebustar Real Estate LLP - - - 0.01 (xiv) Regena Real Estate LLP - - - 0.01 (xv) Westgate Real Estate Developers LLP - - - 0.00 (xvi) Topvalue Real Estate Development Private Limited 26.00 0.04 32.70 1.26
Total (b) 219.78 167.37 C Associates(i) RA Realty Ventures LLP 114.13 178.72 183.72 253.95 (ii) JM Realty Management Private Limited - 6.60 - 6.60
Total (c) 114.13 185.32 D Entities where Key Management Personnel / their relatives
exercise significant influence (i) Peninsula Townships Development Private Limited 0.01 0.01 0.01 0.01 (ii) Ashok Piramal Mega City Development Private Limited 0.01 0.01 0.01 0.01 (iii) Peninsula SA Realty Private Limited 0.01 0.01 0.01 0.01 (iv) Ashok Piramal Mega Properties Private Limited 0.01 0.01 0.01 0.01
Total (d ) 0.04 0.04 E Joint Venture(i) Bridgeview Real Estate Development LLP * 78.82 74.37 78.82 75.26
Total (e) 78.82 74.37 F Step Down Joint Venture(i) HEM Bhattad AOP 15.00 15.00 15.00 15.00
Total (f) 15.00 15.00 Grand Total (a+b+c+d+e+f) 843.34 932.82
* indicates "Interest bearing"

130 Peninsula Land Limited
Financial Statements
Notes forming part of the Standalone Financial Statements
DET
AILS
OF
REL
ATED
PAR
TY T
RAN
SACT
ION
S :
(` in
Cro
res)
Nam
es o
f Rel
ated
Pa
rtie
s / N
atur
e of
Tr
ansa
ctio
ns
Perio
dRe
nt
Inco
me
PMC
Fee
Inco
me
Purc
h of
Go
ods /
Se
rvice
s
Dona
tions
gi
ven
Loan
s gi
ven
toLo
an
repa
id by
Loan
s ta
ken
from
Loan
s re
paid
to
Inte
rest
in
com
eIn
tere
st
expe
nse
Reim
-bu
rse-
men
t fro
m
Reim
-bu
rse-
men
t to
Inve
st-
men
t in
Equi
ty
Rem
uner
-at
ion
Divid
end
Paid
Impa
ir -m
ent o
f du
es
Fair
Valu
atio
n Ga
in/
(Los
s)
Secu
rity /
Gu
ar-
ante
es
give
n to
Secu
rity /
Gu
ar-
ante
es
rele
ased
by
Secu
rity /
Gu
aran
-te
es
take
n fro
m Se
curit
y /
Guar
-an
tees
re
leas
ed
to
ACo
ntro
llin
g En
tity
1As
hok
Pira
mal
G
roup
Rea
l Est
ate
Trus
t
2017
-18
-
-
-
-
-
-
-
-
-
-
-
-
-
-
-
-
-
-
- 1
00.0
0 -
20
16-1
7 -
-
-
-
-
-
-
-
-
-
-
-
-
-
2
.98
-
-
-
-
-
-
BSu
bsid
iary
Co
mpa
nies
1
Peni
nsul
a H
oldi
ngs
and
Inve
stm
ents
Pr
ivat
e Li
mite
d
2017
-18
-
-
-
-
26.
45 1
81.5
6 -
-
5
6.01
-
-
-
-
-
-
-
-
-
-
-
-
20
16-1
7 -
-
-
-
5
7.96
0
.01
-
-
48.
43
-
-
-
-
-
-
-
-
-
-
-
-
2Pe
nins
ula
Meg
a Pr
oper
ties
Priv
ate
Lim
ited
2017
-18
-
-
-
-
-
-
-
-
0.0
0 -
-
-
-
-
-
-
-
-
-
-
-
20
16-1
7 -
-
-
-
-
-
-
-
0
.00
-
-
-
-
-
-
-
-
-
-
-
-
3Pe
nins
ula
Cros
sroa
ds P
riva
te
Lim
ited
2017
-18
-
-
-
-
-
-
-
-
-
-
-
-
-
-
-
-
-
-
-
-
-
2016
-17
-
-
-
-
-
-
-
-
-
-
0.0
0 -
-
-
-
-
-
-
-
-
-
4Pa
vuro
tti
Rea
l Est
ate
Dev
elop
men
t Pr
ivat
e Li
mite
d
2017
-18
-
-
-
-
15.
49
-
-
-
7.0
6 -
-
-
-
-
-
-
-
-
-
8
0.43
7
8.00
20
16-1
7 -
-
-
-
0
.21
-
-
-
6.0
8 -
0
.00
-
-
-
-
-
-
-
-
78.
00
55.
00
5G
oodt
ime
Rea
l Est
ate
Dev
elop
men
t Pr
ivat
e Li
mite
d
2017
-18
-
-
-
-
-
-
-
-
62.0
8 -
0
.67
-
-
-
-
-
-
-
-
-
-
2016
-17
-
-
-
-
-
-
-
-
50.
25
-
1.6
0 -
-
-
-
-
-
-
-
-
-
6Pe
nins
ula
Meg
a To
wns
hip
Dev
elop
ers
Lim
ited
2017
-18
-
-
-
-
0.0
0 0
.50
-
-
0.0
7 -
-
-
-
-
-
-
-
-
-
-
-
20
16-1
7 -
-
-
-
0
.01
0.0
1 -
-
0
.06
-
-
-
-
-
-
-
-
-
-
-
-
7M
idla
nd T
owns
hip
Priv
ate
Lim
ited
2017
-18
-
-
-
-
-
-
-
-
-
-
-
-
-
-
-
-
-
-
-
-
-
2016
-17
-
-
-
-
-
-
-
-
-
-
-
-
0.0
1 -
-
-
-
-
-
-
-
8
Peni
nsul
a G
SG
MH
P Pr
ojec
t - A
OP
2017
-18
-
-
-
-
-
-
-
-
-
-
-
-
-
-
-
-
-
-
-
-
-
2016
-17
-
-
-
-
0.1
0 0
.00
-
0.0
0 -
-
-
-
-
-
-
-
-
-
-
-
-
C
Step
Dow
n Su
bsid
iary
Co
mpa
nies
1In
ox M
erca
ntile
Co
mpa
ny P
riva
te
Lim
ited
2017
-18
-
-
-
-
0.0
5 -
-
-
1
2.03
-
-
-
-
-
-
-
-
-
-
-
-
20
16-1
7 -
-
-
-
0
.12
-
-
-
10.
38
-
0.0
0 -
-
-
-
-
-
-
-
-
-
2Pe
nins
ula
Faci
lity
Man
agem
ent
Serv
ices
Lim
ited
2017
-18
-
-
-
-
-
-
-
-
-
-
0.1
7 -
-
-
-
-
-
-
-
-
-
20
16-1
7 -
-
-
-
-
-
-
-
-
-
0
.01
-
-
-
-
-
-
-
-
-
-
3Pe
nins
ula
Inve
stm
ent
Man
agem
ent
Com
pany
Lim
ited
2017
-18
-
-
-
-
-
0.0
2 -
-
0
.00
-
-
-
-
-
-
-
-
-
-
-
-
2016
-17
-
-
-
-
-
-
-
-
0.0
1 -
-
-
-
-
-
-
-
-
-
-
-
4Pe
nins
ula
Phar
ma
Res
earc
h Ce
ntre
Pr
ivat
e Li
mite
d
2017
-18
-
-
-
-
0.1
0 0
.00
-
-
4.8
9 -
-
-
-
-
-
-
-
-
-
-
-
20
16-1
7 -
-
-
-
0
.08
-
-
-
4.2
2 -
0
.00
-
-
-
-
-
-
-
-
-
-
5Pl
anet
view
M
erca
ntile
Co
mpa
ny P
riva
te
Lim
ited
2017
-18
-
-
-
-
0.0
4 -
-
-
3
.88
-
-
-
-
-
-
-
-
-
-
-
-
2016
-17
-
-
-
-
0.0
5 -
-
-
3
.35
-
0.0
0 -
-
-
-
-
-
-
-
-
-
6R
R R
eal E
stat
e D
evel
opm
ent
Priv
ate
Lim
ited
2017
-18
-
-
-
-
0.2
3 -
-
-
4
.94
-
-
-
-
-
-
-
-
-
-
90.
00
49.
53
2016
-17
-
-
-
-
0.5
1 0
.01
-
-
4.2
6 -
0
.00
-
-
-
-
-
-
-
-
40.
00
28.
67

131Annual Report 2017-18
Built for challenges. Preparing for growth.
Notes forming part of the Standalone Financial Statements
(` in
Cro
res)
Nam
es o
f Rel
ated
Pa
rtie
s / N
atur
e of
Tr
ansa
ctio
ns
Perio
dRe
nt
Inco
me
PMC
Fee
Inco
me
Purc
h of
Go
ods /
Se
rvice
s
Dona
tions
gi
ven
Loan
s gi
ven
toLo
an
repa
id by
Loan
s ta
ken
from
Loan
s re
paid
to
Inte
rest
in
com
eIn
tere
st
expe
nse
Reim
-bu
rse-
men
t fro
m
Reim
-bu
rse-
men
t to
Inve
st-
men
t in
Equi
ty
Rem
uner
-at
ion
Divid
end
Paid
Impa
ir -m
ent o
f du
es
Fair
Valu
atio
n Ga
in/
(Los
s)
Secu
rity /
Gu
ar-
ante
es
give
n to
Secu
rity /
Gu
ar-
ante
es
rele
ased
by
Secu
rity /
Gu
aran
-te
es
take
n fro
m Se
curit
y /
Guar
-an
tees
re
leas
ed
to
7Ta
keno
w P
rope
rty
Dev
elop
ers
Priv
ate
Lim
ited
2017
-18
-
-
-
-
0.0
7 0
.21
-
-
0.4
4 -
-
-
-
-
-
-
-
-
-
-
-
20
16-1
7 -
-
-
-
0
.03
0.0
0 -
-
0
.38
-
0.0
0 -
-
-
-
-
-
-
-
-
-
8Pe
nins
ula
Inte
grat
ed L
and
Dev
elop
ers
Priv
ate
Lim
ited
2017
-18
-
-
-
-
-
-
-
-
0.0
0 -
-
-
-
-
-
-
-
-
-
-
-
20
16-1
7 -
-
-
-
0
.01
0.0
1 -
-
0
.00
-
-
-
-
-
-
-
-
-
-
-
-
9Pe
nins
ula
Meg
a Ci
ty D
evel
opm
ent
Priv
ate
Lim
ited
2017
-18
-
-
-
-
-
-
-
-
0.0
6 -
-
-
-
-
-
-
-
-
-
-
-
20
16-1
7 -
-
-
-
0
.01
0.0
1 -
-
0
.05
-
-
-
-
-
-
-
-
-
-
-
-
10Sk
etch
Rea
l Est
ate
Priv
ate
Lim
ited
2017
-18
-
-
-
-
-
-
-
-
-
-
-
-
-
-
-
-
-
-
-
-
-
2016
-17
-
-
-
-
0.0
4 -
-
-
-
-
-
-
-
-
-
-
-
-
-
-
-
11
Arge
nto
Rea
l Es
tate
LLP
2017
-18
-
-
-
-
-
-
-
-
-
-
-
-
-
-
-
-
-
-
-
-
-
2016
-17
-
-
-
-
0.0
1 0
.01
-
-
-
-
-
-
-
-
-
-
-
-
-
-
-
12G
oren
a R
eal E
stat
e LL
P20
17-1
8 -
-
-
-
-
-
-
-
-
-
-
-
-
-
-
-
-
-
-
-
-
20
16-1
7 -
-
-
-
0
.01
0.0
1 -
-
-
-
-
-
-
-
-
-
-
-
-
-
-
13
Max
is R
eal E
stat
e LL
P20
17-1
8 -
-
-
-
-
-
-
-
-
-
-
-
-
-
-
-
-
-
-
-
-
20
16-1
7 -
-
-
-
0
.01
0.0
1 -
-
-
-
-
-
-
-
-
-
-
-
-
-
-
14
Neb
usta
r R
eal
Esta
te L
LP20
17-1
8 -
-
-
-
-
-
-
-
-
-
-
-
-
-
-
-
-
-
-
-
-
20
16-1
7 -
-
-
-
0
.01
0.0
1 -
-
-
-
-
-
-
-
-
-
-
-
-
-
-
15
Reg
ena
Rea
l Est
ate
LLP
2017
-18
-
-
-
-
-
-
-
-
-
-
-
-
-
-
-
-
-
-
-
-
-
2016
-17
-
-
-
-
0.0
1 0
.01
-
-
-
-
-
-
-
-
-
-
-
-
-
-
-
16W
estg
ate
Rea
l Es
tate
Dev
elop
ers
LLP
2017
-18
-
-
-
-
-
-
-
-
-
-
0.0
0 -
-
-
-
-
-
-
-
-
-
20
16-1
7 -
-
-
-
0
.00
0.0
0 -
-
-
-
0
.00
-
-
-
-
-
-
-
-
-
-
17To
pval
ue
Rea
l Est
ate
Dev
elop
men
t Pr
ivat
e Li
mite
d
2017
-18
-
-
-
-
35.
73
3.0
7 -
-
0
.31
-
-
-
-
-
-
7.0
1 -
-
-
-
158
.30
2016
-17
-
-
-
-
1.2
6 1
.25
-
-
0.0
2 -
-
-
-
-
-
-
-
-
-
157
.00
53.7
0
DAs
soci
ates
1
SEW
Eng
inee
ring
(In
dia)
Pri
vate
Li
mite
d
2017
-18
-
-
-
-
-
-
-
-
-
-
-
-
-
-
-
-
-
-
-
-
-
2016
-17
-
-
4.9
4 -
-
-
-
-
-
-
-
-
-
-
-
-
-
-
-
-
-
2R
A R
ealty
Ven
ture
s LL
P20
17-1
8 -
-
-
-
5
.00
-
-
-
21.
90
-
1.1
2 -
-
-
-
9
1.50
-
-
-
-
-
20
16-1
7 -
-
-
-
6
.00
103
.40
-
-
27.
56
-
1.1
4 -
-
-
-
-
-
-
-
-
-
3
Roc
kfirs
t Rea
l Es
tate
lim
ited
2017
-18
-
-
-
-
25.
84
22.
04
-
-
-
-
0.2
7 -
-
-
-
5
.57
-
-
-
-
-
2016
-17
-
-
-
-
17.
58
-
-
-
-
-
0.6
3 -
-
-
-
3
5.00
-
-
-
-
-
4
JM R
ealty
M
anag
emen
t Pr
ivat
e Li
mite
d
2017
-18
-
-
-
-
-
-
-
-
-
-
-
-
-
-
-
-
-
-
-
-
-
2016
-17
-
-
-
-
-
-
-
-
0.9
2 -
-
-
-
-
-
-
-
-
-
-
-
E
Step
Dow
n As
soci
ates
1G
oodh
ome
Rea
lty
Lim
ited
2017
-18
-
-
-
-
2.1
2 0
.77
-
-
1.3
2 -
2
.88
-
-
-
-
-
-9.
65
-
-
-
-
2016
-17
-
-
-
-
3.7
1 -
-
-
0
.47
-
2.0
4 -
-
-
-
-
2
.98
-
-
-
-
2R
R M
ega
City
B
uild
ers
Lim
ited
2017
-18
-
-
-
-
6.6
1 7
.38
24.
01
24.
52
-
0.5
0 -
-
-
-
-
-
-
2.60
-
-
-
-
20
16-1
7 -
-
-
-
3
.34
3.6
0 -
-
0
.51
-
2.3
3 -
-
-
-
-
-1
6.97
-
-
-
-
3
True
win
Rea
lty
Lim
ited
2017
-18
-
-
-
-
9.9
6 -
-
-
-
-
1
.13
-
-
-
-
11.
12
-
-
-
-
-
2016
-17
-
-
-
-
0.6
6 -
-
-
-
-
1
.58
-
-
-
-
2.2
6 -
-
8
0.00
-
-

132 Peninsula Land Limited
Financial Statements
Notes forming part of the Standalone Financial Statements
(` in
Cro
res)
Nam
es o
f Rel
ated
Pa
rtie
s / N
atur
e of
Tr
ansa
ctio
ns
Perio
dRe
nt
Inco
me
PMC
Fee
Inco
me
Purc
h of
Go
ods /
Se
rvice
s
Dona
tions
gi
ven
Loan
s gi
ven
toLo
an
repa
id by
Loan
s ta
ken
from
Loan
s re
paid
to
Inte
rest
in
com
eIn
tere
st
expe
nse
Reim
-bu
rse-
men
t fro
m
Reim
-bu
rse-
men
t to
Inve
st-
men
t in
Equi
ty
Rem
uner
-at
ion
Divid
end
Paid
Impa
ir -m
ent o
f du
es
Fair
Valu
atio
n Ga
in/
(Los
s)
Secu
rity /
Gu
ar-
ante
es
give
n to
Secu
rity /
Gu
ar-
ante
es
rele
ased
by
Secu
rity /
Gu
aran
-te
es
take
n fro
m Se
curit
y /
Guar
-an
tees
re
leas
ed
to
FCo
mpa
nies
w
here
KM
P /
rela
tives
exe
rcis
e si
gnifi
cant
in
flue
nce
1As
hok
Pira
mal
M
anag
emen
t Co
rpor
atio
n Li
mite
d
2017
-18
-
-
4.0
0 -
-
-
-
-
-
-
-
0
.01
-
-
-
-
-
-
-
-
-
2016
-17
-
-
8.2
8 -
-
-
-
-
-
-
-
0
.01
-
-
-
-
-
-
-
-
-
2Fr
eedo
m R
egis
try
Lim
ited
2017
-18
-
-
0.0
7 -
-
-
-
-
-
-
-
-
-
-
-
-
-
-
-
-
-
20
16-1
7 -
-
0
.09
-
-
-
-
-
-
-
-
-
-
-
-
-
-
-
-
-
-
3M
orar
jee
Text
iles
Lim
ited
2017
-18
1.5
9 -
-
-
-
-
-
-
-
-
0
.41
-
-
-
-
-
-
-
-
-
-
2016
-17
1.4
8 -
-
-
-
-
-
-
-
-
0
.62
-
-
-
-
-
-
-
-
-
-
4Th
unde
rclo
ud
Tech
nolo
gies
(In
dia)
Pri
vate
Li
mite
d
2017
-18
-
-
-
-
0.0
1 0
.01
-
-
-
-
-
-
-
-
-
-
-
-
-
-
-
2016
-17
-
-
-
-
0.0
1 0
.01
-
-
-
-
-
-
-
-
-
-
-
-
-
-
-
5Pe
nins
ula
SA
Rea
lty P
riva
te
Lim
ited
2017
-18
-
-
-
-
0.0
0 -
-
-
-
-
-
-
-
-
-
-
-
-
-
-
-
20
16-1
7 -
-
-
-
0
.01
-
-
-
-
-
-
-
-
-
-
-
-
-
-
-
-
6Pe
nins
ula
Tow
nshi
ps
Dev
elop
men
t Pr
ivat
e Li
mite
d
2017
-18
-
-
-
-
0.0
0 -
-
-
-
-
-
-
-
-
-
-
-
-
-
-
-
20
16-1
7 -
-
-
-
0
.01
-
-
-
-
-
-
-
-
-
-
-
-
-
-
-
-
7As
hok
Pira
mal
M
ega
City
D
evel
opm
ent
Priv
ate
Lim
ited
2017
-18
-
-
-
-
-
-
-
-
-
-
-
-
-
-
-
-
-
-
-
-
-
2016
-17
-
-
-
-
0.0
1 -
-
-
-
-
-
-
-
-
-
-
-
-
-
-
-
8As
hok
Pira
mal
M
ega
Prop
ertie
s Pr
ivat
e Li
mite
d
2017
-18
-
-
-
-
-
-
-
-
-
-
-
-
-
-
-
-
-
-
-
-
-
2016
-17
-
-
-
-
0.0
1 -
-
-
-
-
-
-
-
-
-
-
-
-
-
-
-
9PM
P Au
to
Com
pone
nts
Priv
ate
Lim
ited
2017
-18
0.1
9 -
-
-
-
-
-
-
-
-
-
-
-
-
-
-
-
-
-
-
-
20
16-1
7 0
.14
-
-
-
-
-
-
-
-
-
0.0
6 -
-
-
-
-
-
-
-
-
-
10Po
wer
jet C
arri
ers
and
Tran
spor
ters
Pr
ivat
e Li
mite
d
2017
-18
-
-
-
-
-
-
-
-
-
-
-
-
-
-
-
-
-
-
-
-
-
2016
-17
-
-
-
-
-
-
-
-
-
-
-
-
-
-
0.0
0 -
-
-
-
-
-
11To
pval
ue B
roke
rs
Priv
ate
Lim
ited
2017
-18
-
-
-
-
0.0
0 0
.00
-
-
-
-
-
-
-
-
-
-
-
-
-
-
-
2016
-17
-
-
-
-
-
-
-
-
-
-
-
-
-
-
-
-
-
-
-
-
-
GJo
int V
entu
res
1
Bri
dgev
iew
R
eal E
stat
e D
evel
opm
ent L
LP
2017
-18
-
-
-
-
4.6
4 8
.82
-
-
8.6
5 -
0
.94
-
-
-
-
-
-
-
-
-
-
2016
-17
-
-
-
-
15.
56
19.
10
-
-
8.5
1 -
1
.12
-
-
-
-
-
-
-
-
-
-
HSt
ep D
own
Join
t Ve
ntur
es1
Hem
Infr
astr
uctu
re
and
Prop
erty
D
evel
oper
s Pr
ivat
e Li
mite
d
2017
-18
-
-
-
-
-
-
-
-
0.0
0 -
-
-
-
-
-
-
-
-
-
-
-
20
16-1
7 -
-
-
-
-
-
-
-
0
.00
-
-
-
-
-
-
-
-
-
-
-
-
2H
EM B
hatt
ad A
OP
2017
-18
-
16.
07
-
-
-
-
-
-
-
-
-
-
-
-
-
-
-
-
-
-
-
2016
-17
-
-
-
-
-
-
-
-
-
-
-
-
-
-
-
-
-
-
-
-
-

133Annual Report 2017-18
Built for challenges. Preparing for growth.
Notes forming part of the Standalone Financial Statements
(` in
Cro
res)
Nam
es o
f Rel
ated
Pa
rtie
s / N
atur
e of
Tr
ansa
ctio
ns
Perio
dRe
nt
Inco
me
PMC
Fee
Inco
me
Purc
h of
Go
ods /
Se
rvice
s
Dona
tions
gi
ven
Loan
s gi
ven
toLo
an
repa
id by
Loan
s ta
ken
from
Loan
s re
paid
to
Inte
rest
in
com
eIn
tere
st
expe
nse
Reim
-bu
rse-
men
t fro
m
Reim
-bu
rse-
men
t to
Inve
st-
men
t in
Equi
ty
Rem
uner
-at
ion
Divid
end
Paid
Impa
ir -m
ent o
f du
es
Fair
Valu
atio
n Ga
in/
(Los
s)
Secu
rity /
Gu
ar-
ante
es
give
n to
Secu
rity /
Gu
ar-
ante
es
rele
ased
by
Secu
rity /
Gu
aran
-te
es
take
n fro
m Se
curit
y /
Guar
-an
tees
re
leas
ed
to
IEn
titie
s w
here
K
MP
/ rel
ativ
es
exer
cise
si
gnifi
cant
in
flue
nce
1U
rvi A
shok
Pir
amal
Fo
unda
tion
2017
-18
-
-
-
-
-
-
-
-
-
-
-
0.0
0 -
-
-
-
-
-
-
-
-
20
16-1
7 -
-
-
1
.65
-
-
-
-
-
-
-
-
-
-
-
-
-
-
-
-
-
2M
orar
jee
Goc
ulda
s Sp
inni
ng &
W
eavi
ng C
o Lt
d Se
nior
ESO
P Tr
ust
2017
-18
-
-
-
-
-
-
-
-
-
-
-
-
-
-
-
-
-
-
-
-
-
2016
-17
-
-
-
-
-
-
-
-
-
-
-
-
-
-
0.0
2 -
-
-
-
-
-
J K
ey M
anag
emen
t Pe
rson
nel (
KM
P)
1 M
r. R
ajee
v A.
Pi
ram
al20
17-1
8 -
-
-
-
-
-
-
-
-
-
0
.02
0.0
1 -
1
.21
-
-
-
-
-
- 1
00.0
0 20
16-1
7 -
-
-
-
-
-
-
-
-
-
-
-
-
1
.21
0.0
2 -
-
-
-
700
.00
90.
00
2M
r. N
anda
n A.
Pi
ram
al20
17-1
8 -
-
-
-
-
-
-
-
-
-
-
0
.00
-
1.0
0 -
-
-
-
-
-
-
20
16-1
7 -
-
-
-
-
-
-
-
-
-
-
-
-
0
.99
0.0
2 -
-
-
-
-
-
3
Mr.
Dee
pak
H
Sum
man
war
2017
-18
-
-
-
-
-
-
-
-
-
-
-
0.0
1 -
0
.04
-
-
-
-
-
-
-
2016
-17
-
-
-
-
-
-
-
-
-
-
-
-
-
0.0
3 -
-
-
-
-
-
-
4
Mr.
Mah
esh
S.
Gup
ta20
17-1
8 -
-
-
-
-
-
-
-
-
-
-
0
.00
-
1.4
9 -
-
-
-
-
-
-
20
16-1
7 -
-
-
-
-
-
-
-
-
-
-
-
-
1
.43
0.0
0 -
-
-
-
-
-
5
Mr.
Sudh
inda
r K
K
hann
a20
17-1
8 -
-
-
-
-
-
-
-
-
-
-
-
-
0
.01
-
-
-
-
-
-
-
2016
-17
-
-
-
-
-
-
-
-
-
-
-
-
-
0.0
1 -
-
-
-
-
-
-
6
Ms.
Urv
i A. P
iram
al20
17-1
8 -
-
-
-
-
-
-
-
-
-
-
-
-
0
.03
-
-
-
-
-
-
-
2016
-17
-
-
-
-
-
-
-
-
-
-
-
-
-
1.5
7 0
.06
-
-
-
-
-
-
7M
s. B
havn
a G
. D
oshi
2017
-18
-
-
-
-
-
-
-
-
-
-
-
-
-
0.0
4 -
-
-
-
-
-
-
20
16-1
7 -
-
-
-
-
-
-
-
-
-
-
-
-
0
.03
0.0
0 -
-
-
-
-
-
8
Mrs
.. .S
ajit
Rag
hava
Suv
arna
2017
-18
-
-
-
-
-
-
-
-
-
-
-
-
-
0.0
1 -
-
-
-
-
-
-
20
16-1
7 -
-
-
-
-
-
-
-
-
-
-
-
-
-
-
-
-
-
-
-
-
9
Mr.B
hara
t San
ghvi
2017
-18
-
-
-
-
-
-
-
-
-
-
-
-
-
1.1
3 -
-
-
-
-
-
-
20
16-1
7 -
-
-
-
-
-
-
-
-
-
-
-
-
0
.95
0.0
0 -
-
-
-
-
-
10
Mr.R
ajas
heka
r R
eddy
2017
-18
-
-
-
-
-
-
-
-
-
-
-
-
-
0.5
6 -
-
-
-
-
-
-
20
16-1
7 -
-
-
-
-
-
-
-
-
-
-
-
-
0
.52
-
-
-
-
-
-
-
11M
r. Pr
adip
ta K
. M
ohap
atra
2017
-18
-
-
-
-
-
-
-
-
-
-
-
-
-
-
-
-
-
-
-
-
-
2016
-17
-
-
-
-
-
-
-
-
-
-
-
-
-
0.0
3 -
-
-
-
-
-
-
K
Rel
ativ
es o
f KM
P1
Mr
Har
shva
rdha
n A
Pira
mal
2017
-18
-
-
-
-
-
-
-
-
-
-
-
-
-
-
- -
-
-
-
-
-
20
16-1
7 -
-
-
-
-
-
-
-
-
-
-
-
-
-
0
.02
-
-
-
-
-
-
2M
s K
alpa
na
Sing
hani
a20
17-1
8 -
-
-
-
-
-
-
-
-
-
-
-
-
-
-
-
-
-
-
-
-
2016
-17
-
-
-
-
-
-
-
-
-
-
-
-
-
-
0.0
0 -
-
-
-
-
-
3
Mrs
Sun
ita G
upta
2017
-18
-
-
-
-
-
-
-
-
-
-
-
-
-
-
- -
-
-
-
-
-
20
16-1
7 -
-
-
-
-
-
-
-
-
-
-
-
-
-
0
.02
-
-
-
-
-
-
4M
r. N
ishi
th
Sang
havi
2017
-18
-
-
-
-
-
-
-
-
-
-
-
-
-
-
- -
-
-
-
-
-
20
16-1
7 -
-
-
-
-
-
-
-
-
-
-
-
-
-
0
.00
-
-
-
-
-
-

134 Peninsula Land Limited
Financial Statements
Notes forming part of the Standalone Financial Statements
DET
AILS
OF
REL
ATED
PAR
TY T
RAN
SACT
ION
S -
OU
TSTA
ND
ING
BAL
ANCE
S :
(` in
Cro
res)
Nam
es o
f Rel
ated
Par
ties
/ O
utst
andi
ng b
alan
ces
Peri
odAM
OU
NTS
PAY
ABLE
TOW
ARD
SAM
OU
NTS
REC
EIVA
BLE
TOW
ARD
S
Purc
h of
G
oods
/ Se
rvic
es
from
Expe
nse
to b
e re
imbu
rsed
to
Loan
s ta
ken
(incl
. in
tere
st)
Secu
ritie
s /
Gur
ante
es
take
n fr
om
Expe
nse
to b
e re
imbu
rsed
fr
om
Sale
s of
G
oods
/ Se
rvic
es to
Expe
nse
to b
e re
imbu
rsed
fr
om
Loan
s gi
ven
(incl
. in
tere
st)
Deb
entu
res
& in
tere
st
ther
eon
Secu
ritie
s /
Gur
ante
es
give
n to
A
Cont
roll
ing
Entit
y(i)
Asho
k Pi
ram
al G
roup
Rea
l Es
tate
Tru
st31
-Mar
-18
-
-
-
100
.00
-
-
-
-
-
-
31-M
ar-1
7 -
-
-
-
-
-
-
-
-
-
B
Su
bsid
iary
Com
pani
es(i)
Peni
nsul
a H
oldi
ngs
and
Inve
stm
ents
Pri
vate
Lim
ited
31-M
ar-1
8 -
-
-
-
-
-
-
3
16.3
6 -
-
31
-Mar
-17
-
-
-
-
-
-
-
415
.45
-
-
(ii)
Peni
nsul
a M
ega
Prop
ertie
s Pr
ivat
e Li
mite
d31
-Mar
-18
-
-
-
-
-
-
-
0.0
2 -
-
31
-Mar
-17
-
-
-
-
-
-
-
0.0
1 -
-
(ii
i)Pa
vuro
tti R
eal E
stat
e Pr
ivat
e Li
mite
d31
-Mar
-18
-
-
-
80.
43
-
-
-
69.
36
-
-
31-M
ar-1
7 -
-
-
7
8.00
-
-
-
4
6.82
-
(iv
)G
oodt
ime
Rea
l Est
ate
Dev
elop
men
t Pri
vate
Lim
ited
31-M
ar-1
8 -
-
-
-
-
-
-
-
4
75.2
4 -
31
-Mar
-17
-
-
-
-
-
-
-
-
420
.47
-
(v)
Peni
nsul
a M
ega
Tow
nshi
p D
evel
oper
s Li
mite
d31
-Mar
-18
-
-
-
-
-
-
-
0.0
0 -
-
31
-Mar
-17
-
-
-
-
-
-
-
0.4
3 -
-
(v
i)R
R M
ega
City
Bui
lder
s Li
mite
d31
-Mar
-18
-
-
-
-
-
-
-
-
48.
59
-
31-M
ar-1
7 -
-
-
-
0
.26
-
-
0.5
1 5
1.19
-
(v
ii)R
ockfi
rst R
eal E
stat
e Li
mite
d31
-Mar
-18
-
-
-
-
2.0
6 -
-
1
9.62
-
-
31
-Mar
-17
-
-
-
-
1.7
9 -
-
2
1.38
-
-
(v
iii)
Goo
dhom
e R
ealty
Lim
ited
31-M
ar-1
8 -
-
-
-
4
.87
-
-
7.3
0 8
3.51
-
31
-Mar
-17
-
-
-
-
1.9
9 -
-
4
.76
93.
16
-
(ix)
True
win
Rea
lty L
imite
d31
-Mar
-18
-
-
-
-
-
-
-
-
-
80.
00
31-M
ar-1
7 -
-
-
-
-
-
-
-
8
0.00
C
St
ep D
own
Subs
idia
ry
Com
pani
es(i)
Inox
Mer
cant
ile C
ompa
ny
Priv
ate
Lim
ited
31-M
ar-1
8 -
-
-
-
-
-
-
8
8.10
-
-
31
-Mar
-17
-
-
-
-
-
-
-
76.
02
-
-
(ii)
Peni
nsul
a Fa
cilit
y M
anag
emen
t Se
rvic
es L
imite
d31
-Mar
-18
-
-
-
-
0.1
4 -
-
-
-
-
31
-Mar
-17
-
0.0
1 -
-
-
-
-
-
-
-
(ii
i)Pe
nins
ula
Inve
stm
ent
Man
agem
ent C
ompa
ny L
imite
d31
-Mar
-18
-
-
0.0
0 -
-
-
0
.00
-
-
-
31-M
ar-1
7 -
-
-
-
-
-
-
0
.02
-
-
(iv)
Peni
nsul
a Ph
arm
a R
esea
rch
Cent
re P
riva
te L
imite
d31
-Mar
-18
-
-
-
-
-
-
-
35.
97
-
-
31-M
ar-1
7 -
-
-
-
-
-
-
3
0.98
-
-
(v
)Pl
anet
view
Mer
cant
ile C
ompa
ny
Priv
ate
Lim
ited
31-M
ar-1
8 -
-
-
-
-
-
-
2
8.47
-
-
31
-Mar
-17
-
-
-
-
-
-
-
24.
55
-
-
(vi)
RR
Rea
l Est
ate
Dev
elop
men
t Pr
ivat
e Li
mite
d31
-Mar
-18
-
-
-
105
.10
-
-
-
37.
74
-
-
31-M
ar-1
7 -
-
-
64
.63
-
-
-
32.
58
-
-
(vii)
Take
now
Pro
pert
y D
evel
oper
s Pr
ivat
e Li
mite
d31
-Mar
-18
-
-
-
-
-
-
-
3.0
9 -
-
31
-Mar
-17
-
-
-
-
-
-
-
2.7
8 -
-

135Annual Report 2017-18
Built for challenges. Preparing for growth.
Notes forming part of the Standalone Financial Statements
(` in
Cro
res)
Nam
es o
f Rel
ated
Par
ties
/ O
utst
andi
ng b
alan
ces
Peri
odAM
OU
NTS
PAY
ABLE
TOW
ARD
SAM
OU
NTS
REC
EIVA
BLE
TOW
ARD
S
Purc
h of
G
oods
/ Se
rvic
es
from
Expe
nse
to b
e re
imbu
rsed
to
Loan
s ta
ken
(incl
. in
tere
st)
Secu
ritie
s /
Gur
ante
es
take
n fr
om
Expe
nse
to b
e re
imbu
rsed
fr
om
Sale
s of
G
oods
/ Se
rvic
es to
Expe
nse
to b
e re
imbu
rsed
fr
om
Loan
s gi
ven
(incl
. in
tere
st)
Deb
entu
res
& in
tere
st
ther
eon
Secu
ritie
s /
Gur
ante
es
give
n to
(viii
)Pe
nins
ula
Inte
grat
ed L
and
Dev
elop
ers
Priv
ate
Lim
ited
31-M
ar-1
8 -
-
-
-
-
-
-
0
.00
-
-
31-M
ar-1
7 -
-
-
-
-
-
-
0
.00
-
-
(ix)
Peni
nsul
a M
ega
City
D
evel
opm
ent P
riva
te L
imite
d31
-Mar
-18
-
-
-
-
-
-
-
0.4
2 -
-
31
-Mar
-17
-
-
-
-
-
-
-
0.3
6 -
-
(x
)Sk
etch
Rea
l Est
ate
Priv
ate
Lim
ited
31-M
ar-1
8 -
-
-
-
-
-
-
0
.04
-
-
31-M
ar-1
7 -
-
-
-
-
-
-
0
.04
-
-
(xi)
East
gate
Rea
l Est
ate
Dev
elop
ers
LLP
31-M
ar-1
8 -
-
-
-
0
.00
-
-
-
-
-
31-M
ar-1
7 -
-
-
-
0
.00
-
-
-
-
-
(xii)
Topv
alue
Rea
l Est
ate
Dev
elop
men
t Pri
vate
Lim
ited
31-M
ar-1
8 -
-
-
-
-
-
-
2
6.00
-
-
31
-Mar
-17
-
-
-
158.
30 -
-
-
0
.04
-
-
D
Asso
ciat
es(i)
SEW
Eng
inee
ring
(Ind
ia) P
riva
te
Lim
ited
31-M
ar-1
8 -
-
-
-
-
-
-
-
-
-
31
-Mar
-17
1.4
1 -
-
-
-
-
-
-
-
-
(ii
)R
A R
ealty
Ven
ture
s LL
P31
-Mar
-18
-
-
-
-
1.1
2 -
-
1
14.1
3 -
-
31
-Mar
-17
-
-
-
-
-
-
-
178
.72
-
-
(iii)
JM R
ealty
Man
agem
ent P
riva
te
Lim
ited
31-M
ar-1
8 -
-
-
-
-
-
-
-
-
-
31
-Mar
-17
-
-
-
-
-
-
-
6.6
0 -
-
E
Co
mpa
nies
whe
re K
ey
Man
agem
ent P
erso
nnel
/ th
eir
rela
tives
exe
rcis
e si
gnifi
cant
in
flue
nce
(i)As
hok
Pira
mal
Man
agem
ent
Corp
orat
ion
Lim
ited
31-M
ar-1
8 -
-
-
-
-
-
-
-
-
-
31
-Mar
-17
2.8
4 -
-
-
-
-
-
-
-
-
(ii
)Fr
eedo
m R
egis
try
Lim
ited
31-M
ar-1
8 0
.01
-
-
-
-
-
-
-
-
-
31-M
ar-1
7 0
.02
-
-
-
-
-
-
-
-
-
(iii)
Mor
arje
e Te
xtile
s Li
mite
d31
-Mar
-18
-
-
-
-
0.1
1 -
-
-
-
-
31
-Mar
-17
-
-
-
-
0.1
1 0
.13
-
-
-
-
(iv)
Peni
nsul
a SA
Rea
lty P
riva
te
Lim
ited
31-M
ar-1
8 -
-
-
-
-
-
-
0
.01
-
-
31-M
ar-1
7 -
-
-
-
-
-
-
0
.01
-
-
(v)
Peni
nsul
a To
wns
hips
D
evel
opm
ent P
riva
te L
imite
d31
-Mar
-18
-
-
-
-
-
-
-
0.0
1 -
-
31
-Mar
-17
-
-
-
-
-
-
-
0.0
1 -
-
(v
i)As
hok
Pira
mal
Meg
a Ci
ty
Dev
elop
men
t Pri
vate
Lim
ited
31-M
ar-1
8 -
-
-
-
-
-
-
0
.01
-
-
31-M
ar-1
7 -
-
-
-
-
-
-
0
.01
-
-
(vii)
Asho
k Pi
ram
al M
ega
Prop
ertie
s Pr
ivat
e Li
mite
d31
-Mar
-18
-
-
-
-
-
-
-
0.0
1 -
-
31
-Mar
-17
-
-
-
-
-
-
-
0.0
1 -
-
(v
iii)
Gol
dlife
Mer
cant
ile C
ompa
ny
Priv
ate
Lim
ited
31-M
ar-1
8 -
0
.01
-
-
-
-
-
-
-
-
31-M
ar-1
7 -
0
.01
-
-
-
-
-
-
-
-
(ix)
Hig
hway
Con
cess
ions
One
Pr
ivat
e Li
mite
d 31
-Mar
-18
-
-
-
-
0.0
0 0
.02
-
-
-
-
31-M
ar-1
7 -
-
-
0
.00
0.0
2 -
-
-
(x
)M
iran
da B
i-M
etal
Too
ls P
riva
te
Lim
ited
31-M
ar-1
8 -
0
.01
-
-
-
-
-
-
-
-
31-M
ar-1
7 -
0
.01
-
-
-
-
-
-
-
-

136 Peninsula Land Limited
Financial Statements
Notes forming part of the Standalone Financial Statements
(` in
Cro
res)
Nam
es o
f Rel
ated
Par
ties
/ O
utst
andi
ng b
alan
ces
Peri
odAM
OU
NTS
PAY
ABLE
TOW
ARD
SAM
OU
NTS
REC
EIVA
BLE
TOW
ARD
S
Purc
h of
G
oods
/ Se
rvic
es
from
Expe
nse
to b
e re
imbu
rsed
to
Loan
s ta
ken
(incl
. in
tere
st)
Secu
ritie
s /
Gur
ante
es
take
n fr
om
Expe
nse
to b
e re
imbu
rsed
fr
om
Sale
s of
G
oods
/ Se
rvic
es to
Expe
nse
to b
e re
imbu
rsed
fr
om
Loan
s gi
ven
(incl
. in
tere
st)
Deb
entu
res
& in
tere
st
ther
eon
Secu
ritie
s /
Gur
ante
es
give
n to
(xi)
PMP
Auto
Com
pone
nts
Priv
ate
Lim
ited
31-M
ar-1
8 -
-
-
-
0
.08
0.1
7 -
-
-
-
31
-Mar
-17
-
-
-
-
0.0
8 -
-
-
-
-
(x
ii)D
elta
Cor
p Li
mite
d31
-Mar
-18
2.3
9 -
-
-
-
0
.47
-
-
-
-
31-M
ar-1
7 2
.39
-
-
-
-
0.4
7 -
-
-
-
F
Jo
int V
entu
res
(i)B
ridg
evie
w R
eal E
stat
e D
evel
opm
ent L
LP31
-Mar
-18
-
-
-
-
0.9
4 -
-
7
8.82
-
-
31
-Mar
-17
-
-
-
-
-
-
-
74.
37
-
-
G
Step
Dow
n Jo
int V
entu
res
(i) H
em In
fras
truc
ture
and
Pr
oper
ty D
evel
oper
s Pv
t Li
mite
d
31-M
ar-1
8 -
-
-
-
-
-
-
-
-
-
31
-Mar
-17
-
-
-
-
-
-
-
0.0
0 -
-
(ii)
HEM
Bha
ttad
AO
P31
-Mar
-18
-
-
-
-
-
0.5
8 -
1
5.00
-
-
31
-Mar
-17
-
-
-
-
-
-
-
15.
00
-
-
H
Ente
rpri
ses
whe
re K
MP
/ re
lativ
es e
xerc
ise
sign
ifica
nt
infl
uenc
e(i)
Urv
i Ash
ok P
iram
al F
ound
atio
n31
-Mar
-18
-
0.0
0 -
-
-
-
-
-
-
-
31
-Mar
-17
-
-
-
-
-
-
-
-
-
-
I K
ey M
anag
emen
t Per
sonn
el
(KM
P)(i)
Mah
esh
S G
upta
31-M
ar-1
8 -
0
.01
-
-
-
-
-
-
-
-
31-M
ar-1
7 -
-
-
-
-
-
-
-
-
(i)
Raj
eev
Pira
mal
31-M
ar-1
8 -
-
6
00.0
0 -
-
-
-
-
-
31
-Mar
-17
-
-
700
.00
-
-
-
-
-
-

137Annual Report 2017-18
Built for challenges. Preparing for growth.
Notes forming part of the Standalone Financial Statements
41 Leases
a Assets taken on Operating Lease
The Company has entered into non cancellable operating leases for motor vehicles and computer equipment's with lease term between three to four years. Future minimum lease payments under non - cancellable operating lease are as under:
(` in Crores)Particulars As at
31-Mar-18As at
31-Mar-17
Not later than one year 0.11 0.40 Later than one year and not later than five years 0.05 0.14 Later than five years - - Total 0.16 0.54
Total lease rental cost recognised in the financial statement is ` 0.32 Crores (31st March 2017 - ` 0.56 Crores). Lease rentals paid amounting to ` 0.07 Crores (31st March 2017 - ` 0.05 Crores) has been included in Other Expenses.
b Assets given on Operating Lease
The Company has entered into operating leases on its investment property consisting of office buildings. These leases have terms of between one to ten years. All leases include a clause to enable upward revision of the rental charge on an annual basis according to prevailing market conditions. Future minimum lease income under operating lease are as under:
(` in Crores)
Particulars As at 31-Mar-18
As at 31-Mar-17
Not later than one year 34.71 14.86 Later than one year and not later than five years 50.47 6.04 Later than five years - - Total 85.18 20.90
Total lease rental income recognised in the financial statement is ` 35.37 Crores (31st March 2017 - ` 34.44 Crores)
42 Earnings Per Share (EPS) Basic earnings per share is calculated by dividing the net profit/(loss) for the year attributable to equity shareholders (after
deducting preference dividend and attributable taxes) by the weighted average number of equity shares outstanding during the year.
Diluted earnings per share is calculated by dividing the net profit / loss attributable for the year to equity shareholders (after adjusting for dividend on the preference shares) by the weighted average number of equity shares outstanding during the year plus the weighted average number of equity shares that would be issued on conversion of all the dilutive potential equity shares into equity shares.
(` in Crores)
Year Ended 2017-18
Year Ended 2016-17
i Profit attributable to equity shareholders Net profit / (loss) attributable to the equity shareholders (` in crores) (327.33) (143.10)
ii Outstanding number of equity sharesTotal number of equity shares outstanding at the beginning of the year 279,201,220 279,201,220
Total number of equity shares outstanding at the end of the year 279,201,220 279,201,220
Weighted average number of equity shares 279,201,220 279,201,220
iii Earnings per share (EPS)Basic EPS (`) (11.72) (5.13)
Diluted EPS (`) (11.72) (5.13)

138 Peninsula Land Limited
Financial Statements
Notes forming part of the Standalone Financial Statements
43 Disclosure as per The Micro, Small and Medium Enterprises Development Act, 2006 Based on the information available with the company, the following is the amount due to the suppliers who are registered as
micro, small and medium enterprises under "The Micro, Small and Medium Enterprises Development Act, 2006".
(` in Crores) As at
31-Mar-18As at
31-Mar-17The principal amount remaining unpaid at the end of the year 0.14 0.61 The interest amount remaining unpaid at the end of the year 0.00 0.00 The interest amount paid in terms of Section 16 of MSMED Act 2006 - - The balance of MSMED parties as at the end of the year 0.14 0.61
44 The details of cost of Realty Sales and Work in Progress (Realty Stock) are as under:(` in Crores)
Year Ended 2017-18
Year Ended 2016-17
Realty Costs incurred during the year Land Costs - - Development Costs 178.47 125.87 Interest and Other Borrowing Costs 41.13 118.60 Total Realty Costs for the year (A) 219.60 244.47 Changes in Inventory Opening Inventory Finished Realty Stock 50.78 3.86 Work in Progress 1,252.99 1,295.52 Raw Materials 5.44 6.81 Sub-total (i) 1,309.21 1,306.19 Closing Inventory Finished Realty Stock 30.32 50.78 Work in Progress 1,019.62 1,252.99 Raw Materials 10.11 5.44 Sub-total (ii) 1,060.05 1,309.21 Changes in Inventory (B) = (i-ii) 249.16 (3.01)Inventory write down to net realisable value transferred to exceptional items (C) 63.02 - Cost of Realty Sales Recognised (A+B-C) 405.74 241.46
(` in Crores)Particulars Year Ended
2017-18 Year Ended
2016-17Revenues Recognised on Projects as at year end 407.45 221.91 Corresponding Costs Recognised till date thereon 405.75 241.13 Net Profit / (Loss) recognised thereon 1.70 (19.22)
Disclosure in respect of projects (except developed plots) under the Guidance Note on "Accounting for Real Estate Transactions".
(` in Crores)Particulars Year Ended
2017-18 Year Ended
2016-17Amount of project revenue recognised as revenue during the year 160.27 176.24 Aggregate amount of costs incurred and profits / (losses) recognised till date 336.51 221.91 Amount of advances received 56.90 45.18 Amount of work-in-progress and value of inventories 0.70 0.70 Excess of revenue recognised over actual bills raised (unbilled revenue) 37.43 43.30

139Annual Report 2017-18
Built for challenges. Preparing for growth.
Notes forming part of the Standalone Financial Statements
45 Corporate Social Responsibility Expenditure (CSR) Disclosure as required under Section 135 of Companies Act, 2013, read with Companies (Corporate Social Responsibility
Policy) Rules, 2014 are as under:
a Gross amount required to be spent by the Company during the year ` Nil (31st March 2017 - Nil)
b CSR expenditure incurred during the year(` in Crores)
Particulars In cash Yet to be paid in cash TotalOn Construction/acquisition of any asset - - -
(-) (-) (-)On purposes other than (i) above (refer note) - - -
(1.65) (-) (1.65)Figures in bracket pertain to previous year
The Company undertakes its Corporate Social Responsibility (CSR) activities through Urvi Ashok Piramal Foundation. The foundation operates in areas of health, vocational skill training, environment and education. The Company has contributed ` Nil (31st March 2017 - ` 1.65 Crores) to the foundation for undertaking CSR activities as defined under CSR rules.
46 Capital Management The Company’s policy is to maintain a strong capital base so as to maintain investor, creditor and market confidence and to
sustain future development of the business. Management monitors the return on capital as well as the level of dividends to ordinary shareholders.
The Company manages its capital structure and makes adjustments in light of changes in economic conditions and the requirements of the financial covenants. The Board of Directors seeks to maintain a balance between the higher returns that might be possible with higher levels of borrowings and the advantages and security afforded by a sound capital position.
The Company monitors capital using a ratio of ‘adjusted net debt’ to ‘adjusted equity’ (gearing ratio). For this purpose, adjusted net debt is defined as total liabilities, comprising interest-bearing loans and borrowings less cash and cash equivalents.
The Company’s adjusted net debt to equity ratio as at year end is as follows.
(` in Crores)Particulars As at
31-Mar-18As at
31-Mar-17Total Debt 2,094.44 2,182.18 Less : Cash and cash equivalent 26.11 77.51 Adjusted net Debt 2,068.33 2,104.67 Total equity (excluding non controlling interest) 1,377.79 1,704.70 Less : Hedging reserve - - Adjusted Equity 1,377.79 1,704.70 Gearing Ratio 1.50 1.23
47 Tax Expense
a Amounts recognised in statement of Profit and Loss (` in Crores)
Particulars Year Ended 2017-18
Year Ended 2016-17
Current Income Tax - 0.04 Deferred Tax Expense 12.06 41.03 Tax expense/ (benefit) for the year 12.06 41.07
b Amounts recognised in Other Comprehensive Income (` in Crores)
2017-18Particulars Before tax Tax (expense) /
benefitNet off tax
Items that will not be reclassified to Statement of profit and lossRemeasurements of defined benefit plans 0.65 (0.22) 0.43 Total 0.65 (0.22) 0.43

140 Peninsula Land Limited
Financial Statements
Notes forming part of the Standalone Financial Statements
(` in Crores)Particulars 2016-17
Before tax Tax (expense) / benefit
Net off tax
Items that will not be reclassified to profit or lossRemeasurements of defined benefit plans (0.10) 0.04 (0.06)Total (0.10) 0.04 (0.06)
c Reconciliation of Effective Tax Rate (` in Crores)
Particulars Year Ended 2017-18
Year Ended 2016-17
Profit/(loss) Before Tax (315.27) (102.03)Tax using the Company’s domestic tax rate (Current year 34.94% and Previous Year 34.61%) (110.17) (35.31)Tax effect of:Deferred Tax Asset not created on carried forward business losses 72.02 117.81 Permanent Disallowances - (12.90)Impact of change in tax rate / differential tax rate applicable - - Reversal of MAT - - Others 50.21 (28.53)
12.06 41.07
Since the Company has incurred loss during the year ended 31st March 2018 and on virtual certainty basis as per requirements of IND AS 12 on Income Tax Para 36, the Company has not created deferred tax assets on carried forward business losses and hence, effective tax rate calculation will not appropriate rate of tax.
48 Deferred TaxMajor components of deferred tax assets and liabilities are:
March 31, 2018 (Rs.in Crores) Opening Net Balance
Recognised in profit or loss
Recognised in OCI
Net Closing Balance
DTA DTL
Unabsorbed depreciation 7.65 - - 7.65 7.65 - Property, plant and equipment (85.31) - - (85.31) - (85.31)Inventories (5.53) - - (5.53) - (5.53)Loans and borrowings (5.08) - - (5.08) - (5.08)Employee benefits 2.19 - - 2.19 2.19 - Investments 22.59 - - 22.59 22.59 - Defined benefit plans - - (0.22) (0.22) - (0.22)Provisions 0.03 - - 0.03 0.03 - Other current assets 8.39 - - 8.39 8.39 - Other items (0.01) - - (0.01) - (0.01)MAT Credit 53.13 - - 53.13 53.13 - Unadjusted tax credit 56.24 (12.06) - 44.18 44.18 - Tax Assets/(Liabilities) 54.29 (12.06) (0.22) 42.01 138.16 (96.15)Set off tax - - - - - - Net Tax Assets/(Liabilities) 54.29 (12.06) (0.22) 42.01 138.16 (96.15)
March 31, 2017 (Rs.in Crores) Opening Net Balance
Recognised in profit or loss
Recognised in OCI
Net Closing Balance
DTA DTL
Unabsorbed depreciation/losses 65.90 (58.25) - 7.65 7.65 - Property, plant and equipment (85.26) (0.04) - (85.30) - (85.30)Inventories (5.53) - - (5.53) - (5.53)Loans and borrowings (8.80) 3.72 - (5.08) - (5.08)Employee benefits 2.15 - - 2.15 2.15 - Investments 8.97 17.74 - 26.71 26.71 - Defined benefit plans - - 0.04 0.04 0.04 - Provisions 0.33 (0.29) - 0.04 0.04 - Other current assets 9.16 (0.77) - 8.39 8.39 - Other items 0.01 (0.03) - (0.02) - (0.02)MAT Credit 53.13 - - 53.13 53.13 - Unadjusted tax credit 55.23 (3.11) - 52.12 52.12 - Tax Assets/(Liabilities) 95.29 (41.03) 0.04 54.30 150.23 (95.93)Set off tax - - - - - - Net Tax Assets/(Liabilities) 95.29 (41.03) 0.04 54.30 150.23 (95.93)

141Annual Report 2017-18
Built for challenges. Preparing for growth.
Notes forming part of the Standalone Financial Statements
The Company offsets tax assets and liabilities if and only if it has a legally enforceable right to set off current tax assets and current tax liabilities and the deferred tax assets and deferred tax liabilities relate to income taxes levied by the same Tax Authority.
Significant Management judgement is required in determining provision for Income Tax, Deferred Income Tax assets and liabilities and recoverability of deferred income tax assets. The recoverability of deferred income tax assets is based on estimates of taxable income by each jurisdiction in which the relevant entity operates and the period over which deferred income tax assets will be recovered.
49 Segment Reporting Based on the "Management Approach" as defined in Ind AS 108 - Operating Segments, the Chief Operating Decision Maker
(CODM) evaluates the Company's performance and allocates resources based on an analysis of various performance indicators of business, the segments in which the Company operates. The Company is primarily engaged in the business of real estate development which the Management and CODM recognise as the sole business segment. Hence disclosure of segment- wise information is not required and accordingly not provided.
50 Joint Operation The Company's share of interest in joint operations as at 31st March 2018 is set out below. The principal place of business of
all these joint operations is in India.
Name of the Project % of area sharing within the Project to project partner *
Name of the joint operation partner
Principal activities
As at
31-Mar-18 31-Mar-17
Celestia Spaces 36.00% 36.00% HEM Bhattad AOP Real Estate Development
* The area sharing to the project partner is in addition to upfront payment made.
Classification of Joint Operation
The Company has entered into an joint operation arrangement through a joint development agreement wherein the Company is the developer and the other partner is land owner with other rights and obligations related to any other operation related matter as defined in the agreement. Rights and obligations related to project are defined in the agreement.
51 Investment Property (` in Crores)
Particulars Year Ended 2017-18
Year Ended 2016-17
(i) Amount recognised in Statement of profit or loss for investment properties
A Rental income derived from investment properties 31.84 30.80 B Direct operating expenses (including repairs and maintenance) generating rental income 0.57 2.04 C Direct operating expenses (including repairs and maintenance) that did not generate rental
income - -
D Profit arising from investment properties before depreciation and indirect expenses (A - B - C) 31.27 28.76 E Depreciation 1.38 1.36 F Profit arising from investment properties before indirect expenses (D - E) 29.89 26.40
(ii) Contractual Obligations
Ensuring repairs and preventive maintenance of the property and payment of related municipal taxes.

142 Peninsula Land Limited
Financial Statements
Notes forming part of the Standalone Financial Statements
(iii) Leasing Arrangements (` in Crores)
Particulars As at 31-Mar-18
As at 31-Mar-17
Within 1 year 32.59 12.83 Later than 1 year but not later than 5 years 46.17 - Later than 5 years - - Total 78.76 12.83
(iv) Fair Value
The Company's investment properties consist of commercial properties in India. The management has determined that the investment properties consist of two classes of assets - land and building - based on the nature, characteristics and risks of each property.
(` in Crores)Particulars As at
31-Mar-18 As at
31-Mar-17 Carrying value of investment property - 1 288.74 290.09Carrying value of investment property - 2 1.64 1.67
As at 21st December 2017, the fair values of investment property 1 was ` 339.36 Crores. The fair value of investment property has been determined by external, independent property valuers, having appropriate recognized professional qualification and recent experience in the location and category of the property being valued.
The management is of the opinion that there would not be any significant change in the fair value of investment property between the valuation date and the reporting date.
Further the valuer has used rent capitalisation approach to arrive at the fair value. Under this approach, the rent received by the lessor less outings is capitalised with a safe rate of return. The determination of the fair value of investment properties requires the use of estimates such as gross average rental, property taxes, capitalisation rate etc.
In respect of Investment property 2, the stamp duty ready reckoner value as at 31st March 2018 as determined by the management is ` 9.36 Crores.
Investment properties Valuation Technique Significant unobservable inputs AverageLand and building Rent Capitalisation Technique Estimated gross avg. rental value per
sq. ft. per month214.06
Capitalisation rate 8.80%
52 Standards issued but not effective
a Ind AS 115 Revenue from Contracts with Customers
On March 28, 2018, the Ministry of Corporate Affairs (MCA) has notified Indian Accounting Standard (Ind AS) 115, Revenue from Contracts with Customers. Ind AS 115 introduces a five-step model to revenue recognition:
Step 1: Identify the contract(s) with a customer Step 2: Identify the performance obligations in the contract Step 3: Determine the transaction price Step 4: Allocate the transaction price to the performance obligations in the contract Step 5: Recognise revenue when (or as) the entity satisfies a performance obligation
Under Ind AS 115, revenue is recognised when (or as) the entity satisfies a performance obligation by transferring a promised good or service (i.e., an asset) to a customer (i.e., when (or as) the customer obtains control of that asset) at an amount that reflects the consideration to which the entity expects to be entitled in exchange for transferring goods or services to a customer. The new revenue standard will supersede all current revenue recognition requirements under Ind AS. Either a full retrospective application or a modified retrospective application is required for accounting periods commencing on or after April 1, 2018.

143Annual Report 2017-18
Built for challenges. Preparing for growth.
Notes forming part of the Standalone Financial Statements
The Company will adopt Ind AS 115 effective from April 1, 2018. As at the date of issuance of the company’s financial statements, the company is in the process of evaluating the requirements of the said standard and the impact on its financial statements in the period of initial application.
52 (A) Amendments to Standards applicable to the Company
a Amendments to Ind AS 12 Recognition of Deferred Tax Assets for Unrealised Losses
The amendments clarify that an entity needs to consider whether tax law restricts the sources of taxable profits against which it may make deductions on the reversal of that deductible temporary difference. Furthermore, the amendments provide guidance on how an entity should determine future taxable profits and explain the circumstances in which taxable profit may include the recovery of some assets for more than their carrying amount.
Entities are required to apply the amendments retrospectively. However, on initial application of the amendments, the change in the opening equity of the earliest comparative period may be recognised in opening retained earnings (or in another component of equity, as appropriate), without allocating the change between opening retained earnings and other components of equity. Entities applying this relief must disclose that fact.
These amendments are effective for annual periods beginning on or after 1 April 2018. These amendments are not expected to have any impact on the Company as there are no deductible temporary differences or assets that are in the scope of the amendments.
b. Appendix B to Ind AS 21 Foreign Currency Transactions and Advance Consideration
The Appendix clarifies that, in determining the spot exchange rate to use on initial recognition of the related asset, expense or income (or part of it) on the derecognition of a non-monetary asset or non-monetary liability relating to advance consideration, the date of the transaction is the date on which an entity initially recognises the non-monetary asset or non-monetary liability arising from the advance consideration. If there are multiple payments or receipts in advance, then the entity must determine the transaction date for each payment or receipt of advance consideration.
Entities may apply the Appendix requirements on a fully retrospective basis. Alternatively, an entity may apply these requirements prospectively to all assets, expenses and income in its scope that are initially recognised on or after:
(i) The beginning of the reporting period in which the entity first applies the Appendix, or
(ii) The beginning of a prior reporting period presented as comparative information in the financial statements of the reporting period in which the entity first applies the Appendix.
The Appendix is effective for annual periods beginning on or after 1 April 2018. However, since the Company’s current practice is in line with the interpretation, the Company does not expect any effect on its standalone financial statements.
c. Transfers of Investment Property — Amendments to Ind AS 40
The amendments clarify when an entity should transfer property, including property under construction or development into, or out of investment property. The amendments state that a change in use occurs when the property meets, or ceases to meet, the definition of investment property and there is evidence of the change in use. A mere change in management’s intentions for the use of a property does not provide evidence of a change in use.
Entities should apply the amendments prospectively to changes in use that occur on or after the beginning of the annual reporting period in which the entity first applies the amendments. An entity should reassess the classification of property held at that date and, if applicable, reclassify property to reflect the conditions that exist at that date. Retrospective application in accordance with Ind AS 8 is only permitted if it is possible without the use of hindsight.
The amendments are effective for annual periods beginning on or after 1 April 2018. The Company will apply amendments when they become effective. However, since Company current practice is in line with the clarifications issued, the Company does not expect any effect on its financial statements.

144 Peninsula Land Limited
Financial Statements
Notes forming part of the Standalone Financial Statements
53 Exceptional Items The Company has recorded Exceptional Items during the year ended 31st March 2018 amounting to ` 179.93 Crores and it
comprises of :
(` in Crores)Particulars 31-Mar-18Inventory write down to net realisable value 63.02Impairment of Investments in Subsidiary Company 11.64Impairment of Deemed Investments in Associates Entity/Company 6.77Impairment of loans to Associates Entity (ICDs) 91.49Impairment of loans to wholly owned step down subsidiary Company (ICDs) 7.01
Total 179.93
54 Previous year figures have been regrouped / reclassified wherever necessary to conform to current year's classification.
As per our report of even date For and on behalf of the Board of Directors of Peninsula Land LimitedFor S R B C & CO LLP Chartered Accountants Urvi A. Piramal Rajeev A. Piramal Mahesh S. GuptaICAI Firm registration number: 324982E/E300003 Non Executive Chairperson Executive Vice Chairman & Group Managing Director DIN 00044954 Managing Director DIN 00046810 per Sudhir Soni DIN 00044983Partner Membership No.: 41870 Nandan A. Piramal Bhavna Doshi Bharat Sanghavi Rajashekhar Reddy Whole Time Director Director Chief Financial Officer Company SecretaryPlace : Mumbai DIN 00045003 DIN 00400508 Date: May 23, 2018

145Annual Report 2017-18
Built for challenges. Preparing for growth.
Consolidated Independent Auditor’s ReportTo the Members of Peninsula Land Limited
Report on the Consolidated Ind AS Financial StatementsWe have audited the accompanying consolidated Ind AS financial statements of Peninsula Land Limited (hereinafter referred to as “the Holding Company”), its subsidiaries (the Holding Company and its subsidiaries together referred to as “the Group”) its associates, and joint ventures, comprising of the consolidated Balance Sheet as at March 31, 2018, the consolidated Statement of Profit and Loss including other comprehensive income, the consolidated Cash Flow Statement, the consolidated Statement of Changes in Equity for the year then ended, and a summary of significant accounting policies and other explanatory information (hereinafter referred to as “the consolidated Ind AS financial statements”).
Management’s Responsibility for the Consolidated Ind
AS Financial Statements
The Holding Company’s Board of Directors is responsible for the preparation of these consolidated Ind AS financial statements in terms of the requirement of the Companies Act, 2013 (“the Act”) that give a true and fair view of the consolidated financial position, consolidated financial performance including other comprehensive income, consolidated cash flows and consolidated statement of changes in equity of the Group including its Associates and Joint Ventures in accordance with accounting principles generally accepted in India, including the Accounting Standards specified under Section 133 of the Act, read with the Companies (Indian Accounting Standard) Rules, 2015, as amended. The respective Board of Directors of the companies included in the Group and of its associates and joint ventures are responsible for maintenance of adequate accounting records in accordance with the provisions of the Act for safeguarding of the assets of the Group and of its associates and joint ventures and for preventing and detecting frauds and other irregularities; the selection and application of appropriate accounting policies; making judgments and estimates that are reasonable and prudent; and the design, implementation and maintenance of adequate internal financial controls, that were operating effectively for ensuring the accuracy and completeness of the accounting records, relevant to the preparation and presentation of the financial statements that give a true and fair view and are free from material misstatement, whether due to fraud or error, which have been used for the purpose of preparation of the consolidated Ind AS financial statements by the Directors of the Holding Company, as aforesaid.
Auditor’s Responsibility
Our responsibility is to express an opinion on these consolidated Ind AS financial statements based on our audit. While conducting the audit, we have taken into account the provisions of the Act, the accounting and auditing standards and matters which are required to be included in the audit report under the provisions of the Act and the Rules made thereunder. We conducted our
audit in accordance with the Standards on Auditing, issued by the Institute of Chartered Accountants of India, as specified under Section 143(10) of the Act. Those Standards require that we comply with ethical requirements and plan and perform the audit to obtain reasonable assurance about whether the financial statements are free from material misstatement.
An audit involves performing procedures to obtain audit evidence about the amounts and disclosures in the consolidated financial statements. The procedures selected depend on the auditor’s judgment, including the assessment of the risks of material misstatement of the consolidated financial statements, whether due to fraud or error. In making those risk assessments, the auditor considers internal financial control relevant to the Holding Company’s preparation of the consolidated Ind AS financial statements that give a true and fair view in order to design audit procedures that are appropriate in the circumstances. An audit also includes evaluating the appropriateness of accounting policies used and the reasonableness of the accounting estimates made by the Holding Company’s Board of Directors, as well as evaluating the overall presentation of the consolidated financial statements. We believe that the audit evidence obtained by us and the audit evidence obtained by the other auditors in terms of their reports referred to in sub-paragraph (a) of the Other Matters paragraph below, is sufficient and appropriate to provide a basis for our audit opinion on the consolidated Ind AS financial statements.
Opinion
In our opinion and to the best of our information and according to the explanations given to us and based on the consideration of reports of other auditors on separate financial statements and on the other financial information of the subsidiaries, associates, and joint ventures, the aforesaid consolidated Ind AS financial statements give the information required by the Act in the manner so required and give a true and fair view in conformity with the accounting principles generally accepted in India of the consolidated state of affairs of the Group, its associates and joint ventures as at March 31, 2018, their consolidated loss including other comprehensive income, their consolidated cash flows and consolidated statement of changes in equity for the year ended on that date.
Other Matter
(a) We did not audit the consolidated financial statements and other financial information, in respect of 1 subsidiary (which includes 14 step down subsidiaries and 3 step down joint ventures), and the financial statements and other financial information in respect of 8 subsidiaries, whose Ind AS financial statements include total assets of Rs. 956.05 crores and net assets of Rs. (200.35) crores as at March 31, 2018, and total revenues of Rs. 242.79 crores for the

146 Peninsula Land Limited
Financial Statements
Consolidated Independent Auditor’s Report Continued
year ended on that date. These Ind AS financial statement and other financial information have been audited by other auditors, which financial statements, other financial information and auditor’s reports have been furnished to us by the management. The consolidated Ind AS financial statements also include the Group’s share of net loss of Rs. Nil for the year ended March 31, 2018, as considered in the consolidated Ind AS financial statements, in respect of 1 joint venture, whose financial statements, other financial information have been audited by other auditors and whose reports have been furnished to us by the Management. Our opinion on the consolidated Ind AS financial statements, in so far as it relates to the amounts and disclosures included in respect of these subsidiaries and joint ventures, and our report in terms of sub-sections (3) of Section 143 of the Act, in so far as it relates to the aforesaid subsidiaries and joint ventures, is based solely on the reports of such other auditors.
(b) The consolidated Ind AS financial statements of the Company for the year ended March 31, 2017, included in these consolidated Ind AS financial statements, have been audited by the predecessor auditor who expressed an modified opinion on those statements on May 9, 2017.
(c) The accompanying consolidated Ind AS financial statements include unaudited financial statements and other unaudited financial information in respect of 1 subsidiary, whose unaudited financial statements and other unaudited financial information reflect total assets of Rs. 48.45 crores and net assets of Rs. 48.45 crores as at March 31, 2018, and total revenues of Rs. 0.25 crores for the year ended on that date. These unaudited financial statements and other unaudited financial information have been furnished to us by the management. The consolidated Ind AS financial statements also include the Group’s share of net loss of Rs. 5.15 crores for the year ended March 31, 2018, as considered in the consolidated Ind AS financial statements, in respect of 1 associate and 1 joint venture, whose financial statements and other financial information have not been audited and whose unaudited financial statements and other unaudited financial information have been furnished to us by the Management. Our opinion, in so far as it relates amounts and disclosures included in respect of these subsidiaries, associates and joint ventures, and our report in terms of sub-sections (3) of Section 143 of the Act in so far as it relates to the aforesaid subsidiaries, associates and joint ventures, is based solely on such unaudited financial statement and other unaudited financial information. In our opinion and according to the information and explanations given to us by the Management, these unaudited financial statements and other unaudited financial information are not material to the Group.
Our opinion above on the consolidated Ind AS financial statements, and our report on Other Legal and Regulatory Requirements below, is not modified in respect of the above matters with respect to our reliance on the work done and the reports of the other auditors and the financial statements and other financial information certified by the Management.
Report on Other Legal and Regulatory Requirements
As required by section 143 (3) of the Act, based on our audit and on the consideration of report of the other auditors on separate financial statements and the other financial information of subsidiaries, associates and joint ventures, as noted in the ‘other matter’ paragraph we report, to the extent applicable, that:
(a) We / the other auditors whose reports we have relied upon have sought and obtained all the information and explanations which to the best of our knowledge and belief were necessary for the purpose of our audit of the aforesaid consolidated Ind AS financial statements;
(b) In our opinion proper books of account as required by law relating to preparation of the aforesaid consolidation of the financial statements have been kept so far as it appears from our examination of those books and reports of the other auditors;
(c) The consolidated Balance Sheet, consolidated Statement of Profit and Loss including the Statement of Other Comprehensive Income, the consolidated Cash Flow Statement and consolidated Statement of Changes in Equity dealt with by this Report are in agreement with the books of account maintained for the purpose of preparation of the consolidated Ind AS financial statements;
(d) In our opinion, the aforesaid consolidated Ind AS financial statements comply with the Accounting Standards specified under section 133 of the Act, read with Companies (Indian Accounting Standard) Rules, 2015, as amended;
(e) On the basis of the written representations received from the directors of the Holding Company as on March 31, 2018 taken on record by the Board of Directors of the Holding Company and the reports of the statutory auditors who are appointed under Section 139 of the Act, of its subsidiary companies, associate companies and joint ventures incorporated in India, none of the directors of the Group’s subsidiary companies, its associates and joint ventures incorporated in India is disqualified as on March 31, 2018 from being appointed as a director in terms of Section 164 (2) of the Act.
(f) With respect to the adequacy and the operating effectiveness of the internal financial controls over financial reporting under Clause (i) of Sub-section 3 of Section 143 of the

147Annual Report 2017-18
Built for challenges. Preparing for growth.
Companies Act, 2013 (“the Act”) with reference to these consolidated Ind AS financial statements of the Holding Company and its subsidiary companies, associate companies and joint ventures incorporated in India, refer to our separate report in Annexure 1 to this report;
(g) With respect to the other matters to be included in the Auditor’s Report in accordance with Rule 11 of the Companies (Audit and Auditors) Rules, 2014, in our opinion and to the best of our information and according to the explanations given to us and based on the consideration of the report of the other auditors on separate financial statements as also the other financial information of the subsidiaries, associates and joint ventures, as noted in the ‘Other matter’ paragraph:
i. The consolidated Ind AS financial statements disclose the impact of pending litigations on its consolidated financial position of the Group, its associates and joint ventures – Refer Note 35 to the consolidated Ind AS financial statements;
ii. The Group, its associates and joint ventures did not have any material foreseeable losses in long-term
contracts including derivative contracts during the year ended March 31, 2018;
iii. There has been no delay in transferring amounts, required to be transferred, to the Investor Education and Protection Fund by the Holding Company, its subsidiaries, associates and joint ventures incorporated in India during the year ended March 31, 2018.
For S R B C & CO LLPChartered AccountantsICAI Firm Registration Number: 324982E/E300003
per Sudhir SoniPartnerMembership Number: 41870
Place of Signature: Mumbai
Date: May 23, 2018
148 Peninsula Land Limited
Financial Statements
Consolidated Independent Auditor’s Report Continued
ANNEXURE 1 TO THE INDEPENDENT AUDITOR’S REPORT OF EVEN DATE ON THE CONSOLIDATED FINANCIAL STATEMENTS OF PENINSULA LAND LIMITED In conjunction with our audit of the consolidated Ind AS financial statements of Peninsula Land Limited as of and for the year ended March 31, 2018, we have audited the internal financial controls over financial reporting of Peninsula Land Limited (hereinafter referred to as the “Holding Company”) and its subsidiary companies (the Holding Company and its subsidiaries together referred to as “the Group”), its associate companies and joint ventures, which are companies incorporated in India, as of that date.
Management’s Responsibility for Internal Financial
Controls
The respective Board of Directors of the Holding Company, its subsidiary companies, its associate companies and joint ventures, which are companies incorporated in India, are responsible for establishing and maintaining internal financial controls based on the internal control over financial reporting criteria established by the Holding Company considering the essential components of internal control stated in the Guidance Note on Audit of Internal Financial Controls Over Financial Reporting issued by the Institute of Chartered Accountants of India. These responsibilities include the design, implementation and maintenance of adequate internal financial controls that were operating effectively for ensuring the orderly and efficient conduct of its business, including adherence to the respective company’s policies, the safeguarding of its assets, the prevention and detection of frauds and errors, the accuracy and completeness of the accounting records, and the timely preparation of reliable financial information, as required under the Act.
Auditor’s Responsibility
Our responsibility is to express an opinion on the company's internal financial controls over financial reporting with reference to these consolidated Ind AS financial statements based on our audit. We conducted our audit in accordance with the Guidance Note on Audit of Internal Financial Controls Over Financial Reporting (the “Guidance Note”) and the Standards on Auditing, both, issued by Institute of Chartered Accountants of India, and deemed to be prescribed under section 143(10) of the Act, to the extent applicable to an audit of internal financial controls. Those Standards and the Guidance Note require that we comply with ethical requirements and plan and perform the audit to obtain reasonable assurance about whether adequate internal financial controls over financial reporting with reference to these consolidated Ind AS financial statements was established and maintained and if such controls operated effectively in all material respects.
Our audit involves performing procedures to obtain audit evidence about the adequacy of the internal financial controls
over financial reporting with reference to these consolidated Ind AS financial statements and their operating effectiveness. Our audit of internal financial controls over financial reporting included obtaining an understanding of internal financial controls over financial reporting with reference to these consolidated Ind AS financial statements, assessing the risk that a material weakness exists, and testing and evaluating the design and operating effectiveness of internal control based on the assessed risk. The procedures selected depend on the auditor’s judgement, including the assessment of the risks of material misstatement of the financial statements, whether due to fraud or error.
We believe that the audit evidence we have obtained and the audit evidence obtained by the other auditors in terms of their reports referred to in the Other Matters paragraph below, is sufficient and appropriate to provide a basis for our audit opinion on the internal financial controls over financial reporting with reference to these consolidated Ind AS financial statements.
Meaning of Internal Financial Controls Over Financial
Reporting with reference to these Consolidated
Financial Statements
A company's internal financial control over financial reporting with reference to these consolidated Ind AS financial statements is a process designed to provide reasonable assurance regarding the reliability of financial reporting and the preparation of financial statements for external purposes in accordance with generally accepted accounting principles. A company's internal financial control over financial reporting with reference to these consolidated Ind AS financial statements includes those policies and procedures that (1) pertain to the maintenance of records that, in reasonable detail, accurately and fairly reflect the transactions and dispositions of the assets of the company; (2) provide reasonable assurance that transactions are recorded as necessary to permit preparation of financial statements in accordance with generally accepted accounting principles, and that receipts and expenditures of the company are being made only in accordance with authorisations of management and directors of the company; and (3) provide reasonable assurance regarding prevention or timely detection of unauthorised acquisition, use, or disposition of the company's assets that could have a material effect on the financial statements.
Inherent Limitations of Internal Financial Controls Over Financial Reporting with reference to these Consolidated Financial Statements
Because of the inherent limitations of internal financial controls over financial reporting with reference to these consolidated Ind AS financial statements, including the possibility of collusion or improper management override of controls, material

149Annual Report 2017-18
Built for challenges. Preparing for growth.
misstatements due to error or fraud may occur and not be detected. Also, projections of any evaluation of the internal financial controls over financial reporting with reference to these consolidated Ind AS financial statements to future periods are subject to the risk that the internal financial control over financial reporting with reference to these consolidated Ind AS financial statements may become inadequate because of changes in conditions, or that the degree of compliance with the policies or procedures may deteriorate.
Opinion
In our opinion, the Holding Company, its subsidiary companies, its associate companies and joint ventures, which are companies incorporated in India, have maintained in all material respects, adequate internal financial controls over financial reporting with reference to these consolidated Ind AS financial statements and such internal financial controls over financial reporting with reference to these consolidated Ind AS financial statements were operating effectively as at March 31, 2018, based on the internal control over financial reporting criteria established by the Holding Company considering the essential components of internal control stated in the Guidance Note on Audit of Internal Financial Controls Over Financial Reporting issued by the Institute of Chartered Accountants of India.
Other Matters
Our report under Section 143(3)(i) of the Act on the adequacy and operating effectiveness of the internal financial controls over financial reporting with reference to these consolidated Ind AS financial statements of the Holding Company, in so far as it relates to 1 subsidiary (which includes 14 step down subsidiaries and 3 step down joint ventures), and 1 joint venture, which are companies incorporated in India, is based on the corresponding reports of the auditors of such subsidiary and joint venture incorporated in India.
We did not audit adequacy and operating effectiveness of the internal financial controls over financial reporting with reference to these consolidated Ind AS financial statements in so far as it relates to 1 subsidiary, 1 associate and 1 joint venture, which are companies incorporated in India. These financial statements are unaudited and have been furnished to us by the management and our report on the adequacy and operating effectiveness of the internal financial controls over financial reporting with reference to these consolidated Ind AS financial statements of the Holding Company, its subsidiary companies, its associate companies and joint venture companies, which are companies incorporated in India, under Section 143(3)(i) of the Act in so far as it relates to the aforesaid subsidiary, associate and joint venture company, which are companies incorporated in India, is based solely on representations provided by the management. In our opinion and according to the information and explanations given to us by the management, these financial statements are not material to the Group.
Our opinion above on the adequacy and operating effectiveness of the internal financial controls over financial reporting with reference to these consolidated Ind AS financial statements is not modified in respect of above matters. .
For S R B C & CO LLPChartered AccountantsICAI Firm Registration Number: 324982E/E300003
per Sudhir SoniPartnerMembership Number: 41870
Place of Signature: Mumbai
Date: May 23, 2018

150 Peninsula Land Limited
Financial Statements
Consolidated Balance Sheetas at 31st March 2018
(` in Crores)Particulars Note No As at
31st March 2018As at
31st March 2017ASSETS
A Non-Current Assets(a) Property, Plant and Equipments 3 180.94 182.54 (b) Capital work in progress - 1.27 (c) Investment property 4 292.07 293.49 (d) Intangible assets 5 2.97 3.54 (e) Goodwill on consolidation 57 6.99 20.91 (f) Investments in associates and joint ventures 6 103.92 98.68 (g) Financial Assets
(i) Investments 7 80.26 243.56 (ii) Loans 8 214.33 276.25 (iii) Other financial assets 9 19.84 4.68
(h) Deferred tax assets (Net) 53 35.71 56.61 (i) Non-Current Tax assets (Net) 68.91 56.98 (j) Other non current assets 10 8.81 3.08
Total (A) 1,014.75 1,241.59 B Current Assets (a) Inventories 11 2,915.92 2,752.55 (b) Financial Assets
(i) Current investments 12 12.73 7.57 (ii) Trade receivables 13 114.64 48.97 (iii) Cash and cash equivalents 14 53.23 82.45 (iv) Bank balances other than (iii) above 15 41.77 46.76 (v) Loans 16 81.39 120.65 (vi) Other financial assets 17 97.87 97.06
(c) Other current assets 18 146.64 116.87 (d) Investments held for sale 19 6.70 -
Total (B) 3,470.89 3,272.88 Total Assets (A)+(B) 4,485.64 4,514.47 EQUITY AND LIABILITIES
A Equity(a) Equity share capital 20 55.90 55.90 (b) Other equity 21 1,010.05 1,453.85
Equity Attributable to Owners of the Company 1,065.95 1,509.75 Non - controlling interests 88.78 75.23 Total (A) 1,154.73 1,584.98 Liabilities
B Non-Current Liabilities(a) Financial Liabilities
(i) Long Term Borrowings 22 1,783.83 1,429.64 (ii) Other Financial Liabilities 23 125.05 135.78
(b) Provisions 24 8.00 3.89 Total (B) 1,916.88 1,569.31
C Current Liabilities(a) Financial liabilities
(i) Short Term Borrowings 25 276.42 344.11 (ii) Trade Payables 26 (a) Micro and small enterprises 5.92 0.65 (b) Other than Micro and small enterprises 118.29 137.53 (iii) Other Financial Liabilities 27 682.69 714.21
(b) Other Current Liabilities 28 326.32 161.10 (c) Provisions 29 4.39 2.58
Total (C) 1,414.03 1,360.18 Total Equity and Liabilites (A)+(B)+(C) 4,485.64 4,514.47 Significant Accounting Policies 2
The accompanying notes are an integral part of the financial statements As per our report of even date For and on behalf of the Board of Directors of Peninsula Land LimitedFor S R B C & CO LLP Sd/- Sd/- Sd/- Chartered Accountants Urvi A. Piramal Rajeev A. Piramal Mahesh S. GuptaICAI Firm registration number: 324982E/E300003 Non Executive Chairperson Executive Vice Chairman & Group Managing DirectorSd/- DIN 00044954 Managing Director DIN 00046810 per Sudhir Soni DIN 00044983Partner Sd/- Sd/- Sd/- Sd/- Membership No.: 41870 Nandan A. Piramal Bhavna Doshi Bharat Sanghavi Rajashekhar Reddy Whole Time Director Director Chief Financial Officer Company SecretaryPlace : Mumbai DIN 00045003 DIN 00400508 Date: May 23, 2018

151Annual Report 2017-18
Built for challenges. Preparing for growth.
Consolidated Statement of Profit and Lossfor the year ended 31st March 2018
(` in Crores)
Particulars Note No For the year ended 2017-2018
For the year ended 2016-2017
INCOME(a) Revenue from operations 36 657.91 269.74 (b) Other income 30 56.89 120.64
Total Income (A) 714.80 390.38COST OF REALTY SALES
(c) Realty cost incurred 45 847.54 627.29 (d) Changes in realty inventories/ trading goods 45 (226.39) (385.79)
Cost of Realty Sales (B) 621.15 241.50 EXPENSES
(e) Employee benefits expense 31 49.68 44.42(f) Finance costs 32 218.37 170.38(g) Depreciation and amortisation expenses 3,4,5 4.69 4.99 (h) Other expenses 33 105.75 106.22
Expenses (C) 378.49 326.01 Total Expenses {D = (B+C)} 999.64 567.51Profit / (Loss) before Exceptional items and tax {E = (A-D)} (284.84) (177.13)Exceptional Items (F) 47 169.52 - Profit/ (Loss) before tax {G=(E-F)} (454.36) (177.13)Tax Expense
(i) Current Tax 1.01 1.30 (j) Deferred Tax 53 2.81 41.22
Total Tax Expense (H) 3.82 42.52 Profit/ (Loss) after tax for the year {I = (G-H)} (458.18) (219.65)Share in Profit/ (Loss) of Joint Ventures/ Associates (J) 5.65 (2.79)Profit/ (Loss) for the year {K = (I+J)} (452.53) (222.44)Other Comprehensive Income (OCI) 53
(k) (i) Items that will not be reclassified to Statement of profit and loss
Remeasurement gains/ (losses) on defined benefit obligation
0.52 (0.11)
Income tax effect (0.25) 0.04 Other comprehensive income/(expense) for the year, net of tax (L)
0.27 (0.07)
Total Comprehensive Income for the year, net of tax {M = (K+L)} (452.26) (222.51)Profit / (Loss) attributable to:Owners of the Company (444.13) (216.91)Non-Controlling Interests (8.40) (5.53)Other Comprehensive Income attributable toOwners of the Company 0.33 (0.07)Non-Controlling Interests (0.06) - Total Comprehensive Income attributable to:Owners of the Company (443.80) (216.98)Non-Controlling Interests (8.46) (5.53)Earning per equity share - Face value of `2 (31st March, 2017: `2)
43
Basic (In `) (15.91) (7.77)Diluted (In `) (15.91) (7.77)
Significant accounting policies 2
The accompanying notes are an integral part of the financial statementsAs per our report of even date For and on behalf of the Board of Directors of Peninsula Land LimitedFor S R B C & CO LLP Sd/- Sd/- Sd/- Chartered Accountants Urvi A. Piramal Rajeev A. Piramal Mahesh S. GuptaICAI Firm registration number: 324982E/E300003 Non Executive Chairperson Executive Vice Chairman & Group Managing DirectorSd/- DIN 00044954 Managing Director DIN 00046810 per Sudhir Soni DIN 00044983Partner Sd/- Sd/- Sd/- Sd/- Membership No.: 41870 Nandan A. Piramal Bhavna Doshi Bharat Sanghavi Rajashekhar Reddy Whole Time Director Director Chief Financial Officer Company SecretaryPlace : Mumbai DIN 00045003 DIN 00400508 Date: May 23, 2018

152 Peninsula Land Limited
Financial Statements
(A) Equity share capital (Refer Note No. 20)
(` in Crores)
Particulars 31-Mar-18 31-Mar-17
Balance at the beginning of the year 55.90 55.90
Changes in equity share capital during the year - -
Balance at the end of the year 55.90 55.90
(B) Other Equity (Refer Note No. 21)
(` in Crores)Particulars Attributable to the Owners of the Company Non-
Controlling Interests
Total EquityReserves & Surplus
Securities Premium
Account
Capital Redemption
Reserve
Debenture Redemption
Reserve
General Reserve
Retained Earnings
Capital Reserve
Total
Balance as at April 1, 2016 635.57 0.17 146.18 73.44 817.92 3.58 1,676.85 80.76 1,757.61 Profit / (Loss) for the year - - - - (216.91) - (216.91) (5.53) (222.44)Capital profit on acquisition of subsidiary
- - - - - 0.68 0.68 - 0.68
Other comprehensive income for the year
- - - - (0.07) - (0.07) - (0.07)
Associates profit adjustments on acquisition
- - - - (0.13) 0.13 - - -
Recoupment of Debenture Redemption Reserve
- - (26.31) - 26.31 - - - -
Transfer from Statement of Profit and Loss
- - 70.24 - (70.24) - - - -
Final dividend paid - - - - (5.57) - (5.57) - (5.57)Dividend Distribution Tax thereon
- - - - (1.13) - (1.13) - (1.13)
Balance as at March 31, 2017 635.57 0.17 190.11 73.44 550.18 4.39 1,453.85 75.23 1,529.08 Profit / (Loss) for the year - - - - (444.13) - (444.13) (8.40) (452.53)On Account of business combination during the year (Refer Note No. 46)
- - - - - - - 22.01 22.01
Recoupment of Debenture Redemption Reserve
- - (97.19) - 97.19 - - - -
Transfer from Statement of Profit and Loss
- - 45.87 - (45.87) - - - -
Other comprehensive income for the year
- - - - 0.33 - 0.33 (0.06) 0.27
Balance as at March 31, 2018 635.57 0.17 138.79 73.44 157.70 4.39 1,010.05 88.78 1,098.83
As per our report of even date For and on behalf of the Board of Directors of Peninsula Land LimitedFor S R B C & CO LLP Sd/- Sd/- Sd/- Chartered Accountants Urvi A. Piramal Rajeev A. Piramal Mahesh S. GuptaICAI Firm registration number: 324982E/E300003 Non Executive Chairperson Executive Vice Chairman & Group Managing DirectorSd/- DIN 00044954 Managing Director DIN 00046810 per Sudhir Soni DIN 00044983Partner Sd/- Sd/- Sd/- Sd/- Membership No.: 41870 Nandan A. Piramal Bhavna Doshi Bharat Sanghavi Rajashekhar Reddy Whole Time Director Director Chief Financial Officer Company SecretaryPlace : Mumbai DIN 00045003 DIN 00400508 Date: May 23, 2018
Consolidated Statement of Changes in Equity (SOCIE) for the year ended 31st March 2018

153Annual Report 2017-18
Built for challenges. Preparing for growth.
(` in Crores)Particulars 31-Mar-18 31-Mar-17
A Cash flow from operating activitiesProfit/ (Loss) before tax (454.36) (177.13)Adjustments to reconcile profit/ (loss) before tax to net cash flow from/ (used) in operating activities -
-
(a) Depreciation/ Amortisation Expenses 4.69 4.99 (b) (Gain)/ loss on sale of property, plant and equipment (net) - (5.74)(c) Dividend on Mutual fund (1.48) (2.95)(d) Provision for capital advance - 0.45 (e) Impairment of Financial Assets 20.61 39.71 (f) Loss on Fair value of Financial assets (net) 12.34 9.39 (g) Interest income (including fair value change in financial instrument) (54.18) (111.62)(h) Finance costs 218.37 170.38 (i) Gratuity And Compensated absences - 0.10 (j) Provision for Impairment of Investments, intercorporate deposit and
inventory at (Net Realisable value). 169.51 2.40
(k) Reversal of profit on Investments held for sale 4.26 - (l) Capital work in progress reversal 0.62 - (m) Service tax impairment 0.78 - (n) Goodwill Written off 2.28 -
377.80 107.11 Cash flow from/(used in) operating activity before working capital changes (76.56) (70.02)Working capital adjustments
(a) (Increase)/ Decrease in Inventories 343.95 (44.39)(b) (Increase)/ Decrease in Trade and Other Receivables (31.85) (18.73)(c) Increase/ (Decrease) in Trade and Other Payables (36.88) 1.78 (d) Increase/ (Decrease) in Other Current Financial Liabilities 3.25 (1.80)(e) Increase/ (Decrease) in Other Current Liabilities 114.08 (20.97)(f) (Increase)/ Decrease in Non Current Financial Assets Loans 0.97 66.19 (g) (Increase)/ Decrease in Current Financial Assets Loans 36.79 (91.64)(h) (Increase)/ Decrease in Other Non Current Assets 0.27 0.35 (i) (Increase)/ Decrease in Other Current Financial Assets 4.73 (43.03)(j) Increase/ (Decrease) in Current Provisions 2.43 - (k) Increase/ (Decrease) in Non Current Provisions 4.12 - (l) (Increase)/ Decrease in Other Current Assets (11.76) 49.89
429.47 (102.35)Net Cash generated from/ (used in) Operation 352.91 (172.37)Income Tax paid (Net of income tax refund) (9.97) (5.28)Net cash flows from/ (used in) Operating activities (A) 342.94 (177.65)
B Cash flows from investing activities(a) Purchase of property, plant and equipment and intangible assets (0.18) (1.26)(b) Sale of Property Plant & Equipment's - 12.03 (c) Redemption of Debenture of associates - 3.16 (d) (Investments) in/ Redemption of Debenture 12.98 (2.10)(e) Investments in Joint Venture (13.80) (0.10)(f) Purchase of Current Investments (4.69) - (g) Redemption of Current Investments 3.34 0.58 (h) Investments in Fixed Deposits (More than three months) 3.63 23.67 (i) Redemption of Preference shares of Joint Venture 5.36 - (j) Investments in Pref indigo fund (23.94) - (k) Capital Advance received back - 6.75 (l) Dividend Received 1.48 2.95 (m) Interest received 19.32 138.54
Net cash flows from/ (used in) investing activities (B) 3.50 184.22
Consolidated Statement of Cash Flows for the year ended 31st March 2018
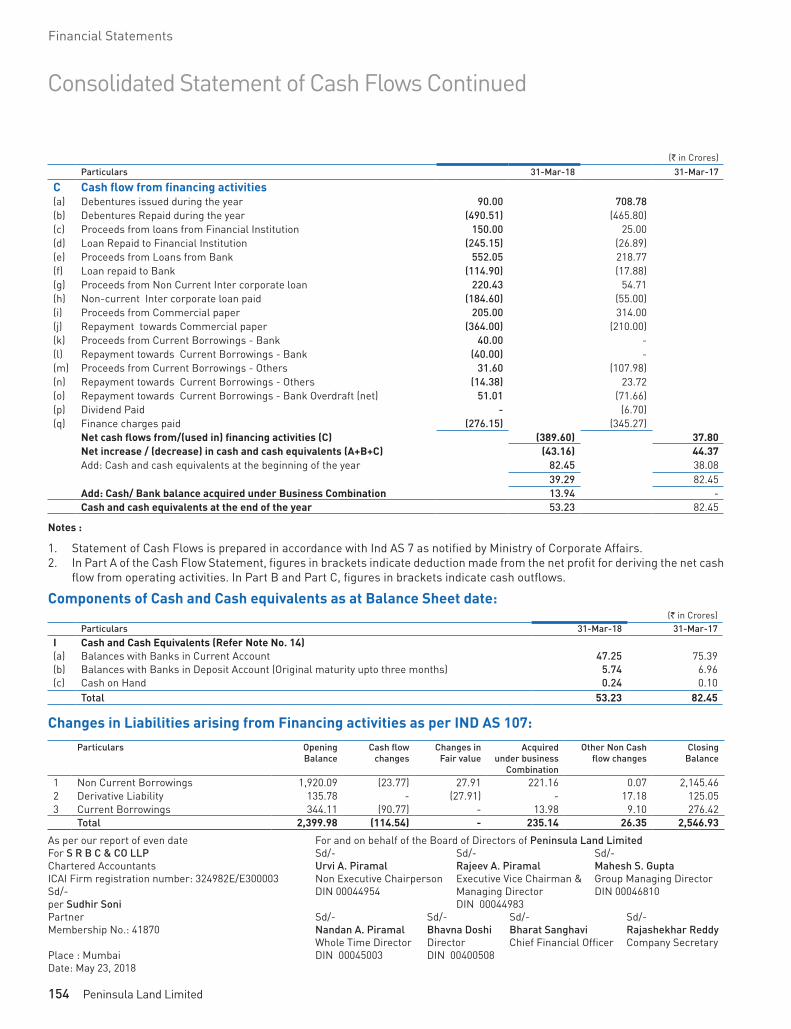
154 Peninsula Land Limited
Financial Statements
(` in Crores)Particulars 31-Mar-18 31-Mar-17
C Cash flow from financing activities(a) Debentures issued during the year 90.00 708.78 (b) Debentures Repaid during the year (490.51) (465.80)(c) Proceeds from loans from Financial Institution 150.00 25.00 (d) Loan Repaid to Financial Institution (245.15) (26.89)(e) Proceeds from Loans from Bank 552.05 218.77 (f) Loan repaid to Bank (114.90) (17.88)(g) Proceeds from Non Current Inter corporate loan 220.43 54.71 (h) Non-current Inter corporate loan paid (184.60) (55.00)(i) Proceeds from Commercial paper 205.00 314.00 (j) Repayment towards Commercial paper (364.00) (210.00)(k) Proceeds from Current Borrowings - Bank 40.00 - (l) Repayment towards Current Borrowings - Bank (40.00) - (m) Proceeds from Current Borrowings - Others 31.60 (107.98)(n) Repayment towards Current Borrowings - Others (14.38) 23.72 (o) Repayment towards Current Borrowings - Bank Overdraft (net) 51.01 (71.66)(p) Dividend Paid - (6.70)(q) Finance charges paid (276.15) (345.27)
Net cash flows from/(used in) financing activities (C) (389.60) 37.80 Net increase / (decrease) in cash and cash equivalents (A+B+C) (43.16) 44.37 Add: Cash and cash equivalents at the beginning of the year 82.45 38.08
39.29 82.45 Add: Cash/ Bank balance acquired under Business Combination 13.94 - Cash and cash equivalents at the end of the year 53.23 82.45
Notes :
1. Statement of Cash Flows is prepared in accordance with Ind AS 7 as notified by Ministry of Corporate Affairs.2. In Part A of the Cash Flow Statement, figures in brackets indicate deduction made from the net profit for deriving the net cash
flow from operating activities. In Part B and Part C, figures in brackets indicate cash outflows.
Components of Cash and Cash equivalents as at Balance Sheet date:(` in Crores)
Particulars 31-Mar-18 31-Mar-17I Cash and Cash Equivalents (Refer Note No. 14)(a) Balances with Banks in Current Account 47.25 75.39 (b) Balances with Banks in Deposit Account (Original maturity upto three months) 5.74 6.96 (c) Cash on Hand 0.24 0.10
Total 53.23 82.45
Changes in Liabilities arising from Financing activities as per IND AS 107:Particulars Opening
BalanceCash flow
changesChanges in
Fair valueAcquired
under business Combination
Other Non Cash flow changes
Closing Balance
1 Non Current Borrowings 1,920.09 (23.77) 27.91 221.16 0.07 2,145.46 2 Derivative Liability 135.78 - (27.91) - 17.18 125.05 3 Current Borrowings 344.11 (90.77) - 13.98 9.10 276.42
Total 2,399.98 (114.54) - 235.14 26.35 2,546.93
As per our report of even date For and on behalf of the Board of Directors of Peninsula Land LimitedFor S R B C & CO LLP Sd/- Sd/- Sd/- Chartered Accountants Urvi A. Piramal Rajeev A. Piramal Mahesh S. GuptaICAI Firm registration number: 324982E/E300003 Non Executive Chairperson Executive Vice Chairman & Group Managing DirectorSd/- DIN 00044954 Managing Director DIN 00046810 per Sudhir Soni DIN 00044983Partner Sd/- Sd/- Sd/- Sd/- Membership No.: 41870 Nandan A. Piramal Bhavna Doshi Bharat Sanghavi Rajashekhar Reddy Whole Time Director Director Chief Financial Officer Company SecretaryPlace : Mumbai DIN 00045003 DIN 00400508 Date: May 23, 2018
Consolidated Statement of Cash Flows Continued

155Annual Report 2017-18
Built for challenges. Preparing for growth.
Notes forming part of the Consolidated Financial Statements
1 Group Information and Overview Peninsula Land Limited (“the Holding Company”) and its
subsidiaries (the Holding Company and its subsidiaries together referred to as “the Group”), its associates and joint ventures is engaged primarily in the business of real estate development. The core business activities are carried out under various business models like own development, through subsidiaries, associates, joint ventures and joint development and other arrangements with third parties. The Group also earns income from renting of properties held by it. The Holding Company is domiciled in India and is listed on Bombay Stock Exchange Limited (BSE) and the National Stock Exchange of India Limited (NSE.). The registered office of the Holding Company is located at 1, Peninsula Spenta, Mathuradas Mills Compound, Lower Parel, Mumbai 400013. The Holding Company is registered with Ministry of Corporate Affairs under the Companies Act, 2013 with CIN L17120MH1871PLC000005.
The consolidated financial statements of the Group for the year ended 31st March, 2018 were authorized and approved for issue by the Board of Directors on 23rd May 2018.
2 SIGNIFICANT ACCOUNTING POLICIES
I. Basis of Preparation of Consolidated Financial
Statements
a. The consolidated financial statements of the Group have been prepared in accordance with the Indian Accounting Standards (Ind AS) as notified under section 133 of the Companies Act read with the Companies (Indian Accounting Standards) Rules 2015 (as amended from time to time).
b. The consolidated financial statements are prepared on a historical cost basis, except for:
(i) Certain financial assets and liabilities that are measured at fair value (refer accounting policy regarding financial instruments).
(ii) Defined benefit plans – plan assets measured at fair value
(iii) Land and Buildings classified as property, plant and equipment
(iv) Derivative financial instruments
(v) Contingent Consideration
(vi) Non-cash distribution liability
c. Principles of Consolidation
(i) The Consolidated Financial Statements have been prepared on the following basis:
(ii) The financial statements of the subsidiary companies used in the consolidation are drawn up to the same reporting date as of the Company i.e. year ended 31st March 2018.
(iii) The financial statements of the Company and its subsidiary companies have been combined on a line-by-line basis by adding together like items of assets, liabilities, income and expenses. The intra-group balances and intra-group transactions and unrealized profits have been fully eliminated.
(iv) The excess of cost to the Company of its investments in the subsidiary companies over its share of equity of the subsidiary companies, at the dates on which the investments in the subsidiary are made, is recognized as “Goodwill” being an asset in the consolidated financial statements. Goodwill arising out of consolidation is not amortized. However, the same is tested for impairment at each Balance Sheet date. Alternatively, where the share of equity in the subsidiary companies as on the date of the investment is in excess of cost of investment of the Company, it is recognized as “Capital Reserve” and shown under the head “Reserves and Surplus”, in the consolidated financial statements.
(v) Non-controlling interests in the net assets of subsidiaries consists of:
(1) The amount of equity attributable to the minorities at the date on which investment in subsidiary is made and
(2) The minorities’ share of movements in equity since the date the parent - subsidiary relationship came into existence.
(vi) The Group’s interests in equity accounted investees comprise interests in associates and joint ventures. An associate is an entity in which the Group has significant influence, but not control or joint control, over the financial and operating policies. A joint venture is an arrangement, rather than right of its assets and obligation for its liabilities. Interests in associates and joint ventures are accounted for using the equity method. They are initially recognized at cost which includes transaction cost. Subsequent to initial recognition, the consolidated financial statements include the Group’s share of profit or loss and OCI of equity accounted investees until the date on which significant influence or joint control ceases.

156 Peninsula Land Limited
Financial Statements
Notes forming part of the Consolidated Financial Statements
d. Current / non-current classification
The Group presents assets and liabilities in the balance sheet based on
Current/non-current classification. An asset is treated as current when it is:
• Expected to be realized or intended to be sold or consumed in normal operating cycle
• Held primarily for the purpose of trading
• Expected to be realised within twelve months after the reporting period, or
• Cash or cash equivalent unless restricted from being exchanged or used to settle a liability for at least twelve months after the reporting period
All other assets are classified as non-current.
A liability is treated as current when:
• it is expected to be settled in normal operating cycle
• it is held primarily for the purpose of trading
• it is due to be settled within twelve months after the reporting period, or
• there is no unconditional right to defer its settlement for at least twelve months after the reporting period.
All other liabilities are classified as non-current.
Deferred tax assets and liabilities are classified as non-current.
The operating cycle is the time between the acquisition of assets for processing and their realisation in cash and cash equivalents. The normal operating cycle in respect of a real estate project under development depends on various factors like signing of sale agreements, size of the project, phasing of the project, type of development, project-specific complexities, technical and engineering factors, statutory approvals needed and the realization of the project receivables into cash & cash equivalents. Based on these factors, the normal operating cycle is generally in the range of 3 to 7 years. Accordingly project related assets & liabilities are classified as current and non-current based on operating cycle of the respective projects. All other assets and liabilities are classified as current or non- current based on an operating cycle of twelve months.
e. Functional and Presentation Currency
The financial statements are presented in Indian Rupee (“INR”) which is also the functional currency of the Group. All values are rounded off to the nearest
crore or fraction thereof up to two decimals, except where otherwise indicated. A crore is equivalent to 10 million.
II Use of accounting judgements, assumptions and
estimates
The preparation of consolidated financial statements in conformity with recognition and measurement principles of Ind AS requires the management to make judgements, assumptions and estimates that affect the reported amounts of revenues, expenses, assets and liabilities and accompanying disclosures and the disclosure of contingent liabilities. They are based on historical experience and other factors, including expectations of future events that may have financial impact on the Group and are believed to be prudent and reasonable. Further, the Group bases its assumptions and estimates on parameters available when the financial statements are prepared. Existing circumstances and assumptions about future developments, however, may change due to market changes or circumstances arising beyond the control of the Group. Such changes are reflected in the assumptions and estimates as and when they occur. Uncertainty about the assumptions and estimates could result in outcomes that require material adjustments in future periods to the carrying amount of assets and liabilities and the results of future periods could be affected due to changes in these assumptions and estimates. The differences between the actual results and the estimates are recognized in the periods in which the results are known or materialize. Following are the key areas of judgements, assumptions and estimates which have significant effect on the amounts recognized in the financial statements:
a. Evaluation of Percentage Completion
The Group uses the percentage of completion method for recognition of revenues and costs for its real estate projects. Determination of revenues and costs under the percentage of completion method necessarily involves making estimates, some of which are of a technical nature, concerning, where relevant, the percentages of completion, estimates of costs to completion, the expected revenues from the project or activity and the foreseeable losses to completion. Estimates of project timelines, revenues and costs are reviewed at reporting dates. The effect of changes if any, to such estimates are recognized in the financial statements for the period in which such changes are determined.
b. Estimation of Net Realisable Value (NRV) for inventory property
Inventory property is stated at the lower of cost and net realizable value (NRV).

157Annual Report 2017-18
Built for challenges. Preparing for growth.
Notes forming part of the Consolidated Financial Statements
NRV of completed or developed inventory property is assessed by reference to market conditions, prices and trends existing at the reporting date and is determined by the Group based on comparable transactions observed /identified for similar properties in the same geographical market serving the same real estate segment.
NRV in respect of inventory property under development is assessed with reference to market prices and trends existing at the reporting date for similar completed property, less the estimated cost to complete construction and an estimate of the time value of money to the date of completion.
c. Impairment of other Non-Financial Assets
The Group assesses at each reporting date whether there is an indication that an asset may be impaired. If any indication exists, or when annual impairment testing for an asset is required, the Group estimates the asset’s recoverable amount. An asset’s recoverable amount is the higher of an asset’s fair value less costs of disposal and its value in use. When the carrying amount of an asset exceeds its recoverable amount, the asset is considered impaired and is written down to its recoverable amount. In assessing value in use, the estimated future cash flows are discounted to their present value using a pre-tax discount rate that reflects current market assessment of the time value of money and the risk specific to the asset. In determining fair value less cost of disposal, recent market transactions are taken into account. If no such transactions can be identified, an appropriate valuation model is used. These calculations are corroborated by valuation multiples or other available fair value indicators. Goodwill is tested for impairment at the end of each reporting period and is not subject to amortisation.
d. Impairment of Financial Assets
The impairment provisions for financial assets are based on assumptions about the risk of default and expected loss rates. The Group uses judgement in making these assumptions and selecting the inputs for impairment calculation, based on Group’s past history, existing market conditions as well as forward looking estimates at the end of each reporting period.
e. Evaluation of Control
The assessment as to whether the Group exercises control, joint control or significant influence over the entities in which it holds less than 100 percent voting rights.
The Group makes assumptions, when assessing whether it exercises control, joint control or significant
influence over entities in which it holds less than 100 percent of the voting rights. These assumptions are made based on the contractual rights with the other shareholders, relevant facts and circumstances which indicate that the Group has power over the potential subsidiary or that joint control exists. Changes to contractual arrangements or facts and circumstances are monitored and are evaluated to determine whether they have a potential impact on the assessment as to whether the Group is exercising control over its investment.
f. Useful life and residual value of Property, Plant and Equipment and Intangible Assets
Useful lives of tangible assets are based on the life prescribed in Schedule II of the Companies Act, 2013. In cases, where the useful lives are different from that prescribed in Schedule II, they are based on technical advice. Assumptions also need to be made when the Group assesses whether an asset may be capitalised and which components of the cost of the asset may be capitalised.
g. Recognition and Measurement of Defined Benefit Obligations
The obligation arising from defined benefit plan is determined on the basis of actuarial assumptions. Key actuarial assumptions include discount rate, expected return on plan assets, trends in salary escalation and attrition rate. The discount rate is determined by reference to market yields at the end of the reporting period on government bonds. The period to maturity of the underlying bonds correspond to the probable maturity of the post employment benefit obligations.
h. Fair Value Measurement of Financial Instruments
When the fair values of the financial assets and liabilities recorded in the Balance Sheet cannot be measured based on the quoted market prices in active markets, their fair value is measured using valuation technique. The inputs to these models are taken from the observable market wherever possible, but where this is not feasible, a review of judgement is required in establishing fair values. Any changes in assumptions could affect the fair value relating to financial instruments.
III Measurement of Fair Values
The Group measures financial instruments, such as investments at fair value at each balance sheet date. Fair value is the price that would be received to sell an asset or paid to transfer a liability in an orderly transaction between market participants at the measurement date. The fair value measurement is based on the presumption that the transaction to sell the asset or transfer the

158 Peninsula Land Limited
Financial Statements
Notes forming part of the Consolidated Financial Statements
liability takes place either in the principal market for the asset or liability, or in the absence of a principal market, in the most advantageous market for the asset or liability. The principal or the most advantageous market must be accessible by the Group.
The fair value of an asset or a liability is measured using the assumptions that market participants would use when pricing the asset or liability, assuming that market participants act in their economic best interest.
A fair value measurement of a non-financial asset takes into account a market participant’s ability to generate economic benefits by using the asset in its highest and best use or by selling it to another market participant that would use the asset in its highest and best use.
The Group uses valuation techniques that are appropriate in the circumstances and for which sufficient data are available to measure fair value, maximizing the use of relevant observable inputs and minimizing the use of unobservable inputs.
The Group has an established control framework with respect to the measurement of fair values. The Management regularly reviews significant unobservable inputs and valuation adjustments. If third party information is used to measure fair values, then the Management assesses the evidence obtained from third parties to support the conclusion that such valuations meet the requirements of Ind AS, including the level in the fair value hierarchy in which such valuations should be classified.
When measuring the fair value of a financial asset or a financial liability, the Group uses observable market data as far as possible. Fair values are categorised into different levels in a fair value hierarchy based on the inputs used in the valuation techniques as follows.
Level 1: Quoted prices in active markets for identical assets or liabilities.
Level 2: Inputs other than quoted prices included in Level 1 that are observable for the asset or liability, either directly (i.e. as prices) or indirectly (i.e. derived from prices).
Level 3: Inputs, for the asset or liability that are not based on observable market data.
If the inputs used to measure the fair value of an asset or a liability fall into different levels of the fair value hierarchy, then the fair value measurement is categorised in its entirety in the same level of the fair value hierarchy as the lowest level input that is significant to the entire measurement.
The Group recognises transfers between levels of the fair value hierarchy at the end of the reporting period during which the change has occurred.
IV Property, Plant and Equipment & Depreciation
a. Recognition and Measurement
Items of property, plant and equipment are measured at cost less accumulated depreciation and impairment losses, if any. The cost of an item of property, plant and equipment comprises:
i. its purchase price, including import duties and non refundable purchase taxes after deducting trade discounts and rebates.
ii. any costs directly attributable to bringing the asset to the location and condition necessary for it to be capable of operating in the manner intended by Management.
iii. the initial estimate of the costs of dismantling and removing the item and restoring the site on which it is located, the obligation for which the Group incurs either when the item is acquired or as a consequence of having used the item during a particular period for purposes other than to produce inventories during that period.
iv. Borrowing costs relating to acquisition / construction / development of tangible assets, which takes substantial period of time to get ready for its intended use are also included to the extent they relate to the period till such assets are ready to be put to use
v. Income and expenses related to the incidental operations, not necessary to bring the item to the location and condition necessary for it to be capable of operating in the manner intended by Management are recognised in Statement of Profit and Loss. If significant parts of an item of property, plant and equipment have different useful lives, then they are accounted for as separate items (major components) of property, plant and equipment.
b. Subsequent Expenditure
Subsequent expenditure related to an item of Property, Plant and Equipment is added to its book value only if it increases the future benefits from the existing asset beyond its previously assessed standard of performance. All other expenses on existing Property, Plant and Equipment, including repair and maintenance expenditure and cost of replacing parts are charged to the Statement of Profit and Loss for the period during which such expenses are incurred.
Expenses incurred for acquisition of capital assets excluding advances paid towards the acquisition of Property, Plant and Equipment outstanding at each Balance Sheet date are disclosed under Capital Work in Progress.
Capital Work in Progress in respect of assets which are not ready for their intended use are carried at cost, comprising

159Annual Report 2017-18
Built for challenges. Preparing for growth.
Notes forming part of the Consolidated Financial Statements
of direct costs, related incidental expenses and attributable interest.
Any gain or loss on disposal of an item of property, plant and equipment is recognized in the Statement of Profit and Loss of the Group in the year of disposal.
c. Depreciation
Depreciation is provided from the date the assets are ready to be put to use on straight line method as per the useful life of the tangible assets including property held as Investment as prescribed under Part C of Schedule II of the Companies Act, 2013 except for the following assets where the Management has estimated useful life which differs from the useful life of 60 years as prescribed under the Act.
Assets Balance useful life (years) from the date of acquisition
Building 1 (Spenta) 57 Building 2 (Seaface Park)
39
For these assets, based on assessment of technical expert, the Management believes that the useful lives as given above best represent the period over which Management expects to use these assets. Hence the useful lives for these assets are different from the useful lives as prescribed under Schedule II of the Companies Act, 2013.
Depreciation is calculated on a prorata basis from the date of installation / acquisition till the date the assets are sold or disposed.
Depreciable amount for assets is the cost of an asset or amount substituted for cost, less its estimated residual value.
Leasehold improvements are amortised over the period of lease.
The depreciation methods, useful lives and residual values are reviewed periodically.
d. Reclassification to Investment Property
When the use of a property changes from owner occupied to investment property, the property is reclassified as investment property at its carrying value on the date of reclassification.
V Investment Property
Investment property is property held to earn rental income or for capital appreciation or for both, but not for sale in the ordinary course of business, use in the production or supply of goods or services or for administrative purposes.
Upon initial recognition, an investment property is measured at cost. Subsequent to initial recognition,
investment property is measured at cost less accumulated depreciation and accumulated impairment losses, if any.
Based on technical evaluation and consequent advice, the Management believes a period of 60 years as representing the best estimate of the period over which investment properties are expected to be used. Accordingly, the Group depreciates investment property over a period of 60 years.
Though the Group measures investment property using cost based measurement, the fair value of investment property is disclosed in the notes. Fair values, where necessary are determined based on an annual evaluation performed by an accredited external independent valuer.
Investment properties are de-recognized either when they have been disposed of or when they are permanently withdrawn from use and no future economic benefit is expected from their disposal. The difference between the net disposal proceeds and the carrying amount of the asset is recognized in profit or loss in the period of de-recognition.
VI Intangible Assets
a. Recognition and Measurement
Intangible assets are carried at cost less accumulated amortisation and impairment losses, if any. The cost of an intangible asset comprises of its purchase price including any import duties and other taxes (other than those subsequently recoverable from the taxing authorities), and any directly attributable expenditure on making the asset ready for its intended use.
Expenditure on research and development eligible for capitalisation are carried as intangible assets under development where such assets are not yet ready for their intended use.
b. Subsequent Expenditure
Subsequent expenditure is capitalized only if it is probable that the future economic benefits associated with the expenditure will flow to the Group.
c. Amortisation
Intangible assets are amortised over their estimated useful lives on a straight line basis, not exceeding 7 years commencing from the date the asset is available to the Group for its use. The amortization period and the amortization method for an intangible asset with a finite useful life are reviewed at least at the end of each reporting period.
VII Foreign Currency Transactions / Translations
a. Foreign exchange transactions are recorded at the closing rate prevailing on the dates of the respective transactions or at the contracted rates as applicable.
160 Peninsula Land Limited
Financial Statements
Notes forming part of the Consolidated Financial Statements
b. Monetary assets and liabilities denominated in foreign currencies at the reporting date are translated into the functional currency at the exchange rate at that date.
c. Exchange differences arising on the settlement of monetary items or on translating monetary items at rates different from those at which they were translated on initial recognition during the period or in previous financial statements are recognised in the statement of profit and loss in the period in which they arise.
VIII Financial Instruments
A financial instrument is any contract that gives rise to a financial asset of one entity and a financial liability or equity instrument of another entity.
a Financial Assets
i. Classification
The Group classifies financial assets as subsequently measured at amortised cost, fair value through other comprehensive income or fair value through profit or loss on the basis of its business model for managing the financial assets and the contractual cash flow characteristics of the financial asset.
ii. Initial Recognition and Measurement
All financial assets (not measured subsequently at fair value through profit or loss) are recognised initially at fair value plus transaction costs that are attributable to the acquisition of the financial asset. Purchases or sales of financial assets that require delivery of assets within a time frame established by regulation or convention in the market place (regular way trades) are recognised on the trade date, i.e., the date that the Group commits to purchase or sell the asset.
iii. Subsequent Measurement
For purposes of subsequent measurement financial assets are classified into two broad categories:
a. Financial asset at fair value
b. Financial asset at amortised cost
Where assets are measured at fair value, gains and losses are either recognised entirely in the statement of profit and loss (i.e. fair value through profit or loss), or recognised in other comprehensive income (i.e. fair value through other comprehensive income).
iv. Equity Investments
All equity investments other than investment in subsidiaries, joint ventures and associates are measured at fair value. Equity instruments which are held for trading are classified as at Fair Value Through Profit
& Loss (FVTPL). For all other equity instruments, the Group decides to classify the same either as at Fair Value through Other Comprehensive Income (FVTOCI) or FVTPL. The Group makes such selection on an instrument by instrument basis. The classification is made on initial recognition and is irrevocable.
If the Group decides to classify an equity instrument as at FVTOCI, then all fair value changes on the instrument excluding dividends are recognised in Other Comprehensive Income (OCI). There is no recycling of the amounts from OCI to the Statement of Profit and Loss, even on sale of such investments.
Equity instruments included within the FVTPL category are measured at fair value with all changes recognised in the Statement of Profit and Loss.
Investment in equity instruments of Subsidiaries, Joint Ventures and Associates are measured at cost.
v. A financial asset mainly debt that meets the following 2 conditions is measured at amortised cost (net of any write down for impairment) unless the asset is designated at fair value through profit or loss under the fair value option.
• Business Model Test : the objective of the Group’s model is to hold the financial asset to collect the contractual cash flows (rather than to sell the instrument prior to its contractual maturity to realise its fair value changes).
• Cash Flow Characteristics Test: The contractual terms of the financial asset give rise on specified dates to cash flows that are solely payment of principal and interest on the principal amount outstanding.
After initial measurement, such financial assets are subsequently measured at amortized cost using the effective interest rate (EIR) method. Amortized cost is calculated by taking into account any discount or premium on acquisition and fees or costs that are an integral part of the EIR. The EIR amortization is included in finance income in the profit or loss. The losses arising from impairment are recognized in the profit or loss. This category generally applies to trade and other receivables.
A financial asset that meets the following 2 conditions is measured at fair value through other comprehensive income unless the asset is designated at fair value through profit or loss under the fair value option.
• Business Model Test : the financial asset is held within a business model whose objective is achieved both by collecting contractual cash flows and selling the financial assets.
• Cash Flow Characteristics Test: The contractual terms of the financial asset give rise on specified

161Annual Report 2017-18
Built for challenges. Preparing for growth.
Notes forming part of the Consolidated Financial Statements
dates to cash flows that are solely payment of principal and interest on the principal amount outstanding.
All other financial assets are measured at fair value through profit or loss and gain or loss on such measurement is recognized in the statement of profit & loss
Even if an instrument meets the two requirements to be measured at amortised cost or fair value through other comprehensive income, a financial asset is measured at fair value through profit or loss if doing so eliminates or significantly reduces a measurement or recognition inconsistency (sometimes referred to as an ‘accounting mismatch’) that would otherwise arise from measuring assets or liabilities or recognising the gains or losses on them on different basis.
vi. De-recognition
A financial asset (or, where applicable, a part of a financial asset or part of a group of similar financial assets) is primarily derecognised when:
• The rights to receive cash flows from the asset have expired, or
• The Group has transferred its rights to receive cash flows from the asset or has assumed an obligation to pay the received cash flows in full without material delay to a third party under a ‘pass-through’ arrangement and either
a) the Group has transferred substantially all the risks and rewards of the asset or
b) the Group has neither transferred nor retained substantially all the risks and rewards of the asset, but has transferred control of the asset.
When the Group has transferred its rights to receive cash flows from an asset or has entered into a pass-through arrangement, it evaluates if and to what extent it has retained the risks and rewards of ownership. When it has neither transferred nor retained substantially all of the risks and rewards of the asset, nor transferred control of the asset, the Group continues to recognise the transferred asset to the extent of the Group’s continuing involvement. In that case, the Group also recognises an associated liability. The transferred asset and the associated liability are measured on a basis that reflects the rights and obligations that the Group has retained.
Continuing involvement that takes the form of a guarantee over the transferred asset is measured at the lower of the original carrying amount of the asset and the maximum amount of consideration that the Group could be required to repay.
vii. Impairment of Financial Asset
The Group assesses impairment based on expected credit losses (ECL) model to the following:
• Financial asset measured at amortised cost
• Financial asset measured at fair value through other comprehensive income
Expected credit losses are measured through a loss allowance at an amount equal to:
• 12 months expected credit losses (expected credit losses that result from those default events on the financial instrument that are possible within 12 months after the reporting date) or
• Full lifetime expected credit losses (expected credit losses that result from all possible default events over the life of the financial instrument)
For financial assets other than trade receivables, as per Ind AS 109, the Group recognises 12 month expected credit losses for all originated or acquired financial assets if at the reporting date the credit risk of the financial asset has not increased significantly since its initial recognition. The expected credit losses are measured as lifetime expected credit losses if the credit risk on financial asset increases significantly since its initial recognition.
The Group follows ‘simplified approach’ for recognition of impairment loss allowance on trade receivables, considering historical trend, industry practices and the business environment in which the Group operates or any other appropriate basis.
The Group’s trade receivables do not contain significant financing component and loss allowance on trade receivables is measured at an amount equal to life time expected losses i.e. expected cash shortfall.
The impairment losses and reversals are recognised in Statement of Profit and Loss.
b. Financial Liabilities
i. Classification
The Group classifies all financial liabilities as subsequently measured at amortised cost or at fair value through Profit and Loss.
ii. Initial Recognition and Measurement
All financial liabilities are recognised initially at fair value and in the case of loans and borrowings and payables, net off directly attributable transaction costs.
The Group’s financial liabilities include trade and other payables, loans and borrowings including bank overdrafts and financial guarantee contracts.

162 Peninsula Land Limited
Financial Statements
Notes forming part of the Consolidated Financial Statements
iii. Subsequent Measurement
After initial recognition, interest bearing loans and borrowings are subsequently measured at amortised cost using the Effective Interest Rate (EIR) method. Gains and losses are recognised in the Statement of Profit and Loss when the liabilities are derecognised.
Amortised cost is calculated by taking into account any discount or premium on acquisition and fees or costs that are an integral part of the EIR. The EIR amortisation is included as finance costs in the Statement of Profit and Loss. This category generally applies to interest bearing amortized loans and borrowings.
Trade and other payables
These amounts represent liabilities for goods and services provided to the Group prior to the end of financial year which are unpaid. Trade and other payables are presented as current liabilities unless payment is due within 12 months after reporting period. For trade and other payables maturing within one year from the balance sheet date, the carrying amounts approximate fair value due to the short maturity of these instruments.
Financial guarantee contracts
Financial guarantee contracts issued by the Group are those contracts that require a payment to be made to reimburse the holder for a loss it incurs because the specified debtor fails to make a payment when due in accordance with the terms of a debt instrument. Financial guarantee contracts are recognized initially as a liability at fair value, adjusted for transaction costs that are directly attributable to the issuance of the guarantee. Subsequently, the liability is measured at the higher of the amount of loss allowance determined as per impairment requirements of Ind AS 109 and the amount recognized less cumulative amortization.
iv. Derecognition
A financial liability is derecognised when the obligation under the liability is discharged or cancelled or expires. When an existing financial liability is replaced by another from the same lender on substantially different terms or the terms of an existing liability are substantially modified, such an exchange or modification is treated as the derecognition of the original liability and the recognition of a new liability. The difference in the respective carrying amounts is recognised in the Statement of Profit and Loss.
Offsetting of Financial Instruments
Financial assets and financial liabilities are offset and the net amount is reported in the Balance Sheet if there is a currently enforceable legal right to offset the recognised amounts and there is an intention to settle on a net basis to realise the assets and settle the liabilities simultaneously.
c Equity Instruments
An equity instrument is a contract that evidences residual interest in the assets of the Group after deducting all of its liabilities. Equity instruments are recognised at the proceeds received net off direct issue cost.
d. Derivative Financial Instruments / Embedded Derivatives
Derivative financial instruments such as forward contracts, option contracts and cross currency swaps are initially recognised at fair value on the date a derivative contract is entered into and are subsequently re-measured at their fair value with changes in fair value recognised in the Statement of Profit and Loss in the period in which they arise.
Embedded derivative is measured at fair value on initial recognition. In case of split accounting of embedded derivative element of financial liability of Hybrid Instrument, the carrying amount of the non-derivative host contract on initial recognition is the difference between the fair value plus transaction costs of the hybrid instrument and the fair value of the embedded derivative. All of the transaction costs are always allocated to and included in the carrying amount of the non-derivative host contract on initial recognition. Subsequent measurement of embedded derivative is done at fair value.
IX Inventories
Direct expenditure relating to Real Estate Development activity is inventorized. Other expenditure (including borrowing costs) during construction period is inventorized to the extent the expenditure is directly attributable cost of bringing the asset to its working condition for its intended use. Other expenditure (including borrowing costs) incurred during the construction period which is not directly attributable for bringing the asset to its working condition for its intended use is charged to the statement of profit and loss. Direct and other expenditure is determined based on specific identification to the construction and real estate activity. Cost incurred/ items purchased specifically for projects are taken as consumed as and when incurred/ received.
a. Inventories comprise of: (i) Finished Realty Stock representing unsold premises in completed projects (ii) Realty Work in Progress representing properties under construction / development including land held for development on which construction activities are yet to commence and (iii) Raw Material representing inventory of materials for use in construction which are yet to be consumed.
b. Inventories other than Raw Material above are valued at lower of cost and net realisable value. Raw Materials are valued on a weighted average cost basis.

163Annual Report 2017-18
Built for challenges. Preparing for growth.
Notes forming part of the Consolidated Financial Statements
c. Cost of Realty construction / development is charged to the Statement of Profit and Loss in proportion to the revenue recognised during the period and the balance cost is carried over under Inventory as part of either Realty Work in Progress or Finished Realty Stock. Cost of Realty construction / development includes all costs directly related to the Project (including finance cost attributable to the project) and other expenditure as identified by the Management which are incurred for the purpose of executing and securing the completion of the Project (net of incidental recoveries / receipts) up to the date of receipt of Occupation Certificate of Project from the relevant authorities.
Realty Work in Progress includes cost of land, premium for development rights, construction costs, allocated interest and expenses incidental to the projects undertaken by the Group.
X Business Combination
In accordance with Ind AS 103 “Business Combination”, the Group accounts for the business combinations using the acquisition method when control is transferred to the Company. The consideration transferred for the business combination is generally measured at fair value as at the date the control is acquired (acquisition date), as are the net identifiable assets acquired. Any goodwill that arises is tested annually for impairment. Any gain on bargain purchase is recognized directly in equity as capital reserve. Transaction costs are expensed as incurred, except to the extent related to the issue of debt or equity securities.
XI Revenue Recognition
Revenue is recognized to the extent that it is probable that the economic benefits will flow to the Group and the revenue can be reliably measured. Revenue is measured at the fair value of the consideration received or receivable, taking into account contractually defined terms of payment and excluding taxes or duties collected on behalf of the government.
a. The Group uses the percentage of completion method or recognition of revenues and costs for its real estate projects. As per this method, revenue from sale of properties is recognised in the Statement of Profit & Loss in proportion to the actual cost incurred as against the total estimated cost of projects under execution with the Group on transfer of significant risk and rewards to the buyer.
b. In accordance with the “Guidance Note on Accounting for Real Estate Transactions, construction revenue on such projects, measured at the fair value (i.e. adjusted for discounts, incentives, time value of money adjustments etc.), have been recognised on percentage of completion method provided the following thresholds have been met:
(i) All critical approvals necessary for the commencement have been obtained.
(ii) The expenditure incurred on construction and development costs is not less than 25 per cent of the total estimated construction and development costs.
(iii) At least 25 percent of the saleable project area is secured by contracts or agreements with buyers and
(iv) At least 10 percent of the contracted consideration is realised at the reporting date in respect of such contracts and it is reasonable to expect that the parties to such contracts will comply with the payment terms as defined in the contracts.
c. Determination of revenues and costs under the percentage of completion method necessarily involves making estimates, some of which are of a technical nature, concerning, where relevant, the percentages of completion, estimates of costs to completion, the expected revenues from the project or activity and the foreseeable losses to completion. Estimates of project timelines, revenues and costs are reviewed at reporting dates. The effect of changes if any, to such estimates are recognized in the financial statements for the period in which such changes are determined.
d. The Group has also been entering into Development & Project Management agreements with landlords. Accounting for income from such projects, measured at fair value, is done on accrual basis on percentage of completion or as per the terms of the agreement.
e. Revenue from sale of completed properties (Finished Realty Stock) is recognised upon transfer of significant risks and rewards to the buyer.
f. Revenue on Development Rights is recognised on the basis of the Group’s revenue share receivable from the related projects as per agreed terms and conditions.
g. Interest income is accounted on an accrual basis at effective interest rate (EIR method).
h. Dividend income is recognised when the right to receive the payment is established.
i. Rent income, Service fees, Signages, Car park and PMC / Marketing fees are recognized on accrual basis over tenure of the lease / service agreement.
XII Income Tax
Income Tax expense comprises current and deferred tax. It is recognised in Statement of Profit and Loss except to the extent that it relates to items recognised directly in Equity or in Other Comprehensive Income.

164 Peninsula Land Limited
Financial Statements
Notes forming part of the Consolidated Financial Statements
a. Current Tax
Current Tax comprises the expected tax payable or receivable on the taxable income or loss for the year and any adjustment to the tax payable or receivable in respect of previous years. It is measured using tax rates enacted or substantively enacted at the reporting date. Current tax also includes any tax arising from dividends.
Current tax assets and liabilities can be offset only if the Group
(i) has a legally enforceable right to set off the recognised amounts and
(ii) intends either to settle on a net basis or to realise the asset and settle the liability simultaneously.
b. Deferred Tax
Deferred tax is recognised in respect of temporary differences between the carrying amounts of assets and liabilities for financial reporting purposes and the amounts used for taxation purposes.
Deferred tax assets are recognised for unused tax credits and deductible temporary differences to the extent that it is probable that future taxable profits will be available against which they can be used. Deferred tax assets are reviewed at each reporting date and are reduced to the extent that it is no longer probable that the related tax benefit will be realised such reductions are reversed when the probability of future taxable profits improves.
Unrecognised deferred tax assets are reassessed at each reporting date and recognised to the extent that it has become probable that future taxable profits will be available against which they can be used.
Deferred tax is measured at the tax rates that are expected to be applied to temporary differences when they reverse using tax rates enacted or substantively enacted at the reporting date.
The measurement of deferred tax reflects the tax consequences that would follow from the manner in which the Group expects at the reporting date to recover or settle the carrying amount of its assets and liabilities.
Deferred tax assets and liabilities are offset only if:
(i) The Group has a legally enforceable right to set off current tax assets against current tax liabilities and
(ii) The deferred tax assets and the deferred tax liabilities relate to income taxes levied by the same taxation authority on the same taxable entity.
The tax rates and tax laws used to compute the amount are those that are enacted or substantively enacted at the reporting date.
c. Minimum Alternate Tax (MAT)
Minimum Alternative Tax (MAT) may become payable when the taxable profit is lower than the book profit. Taxes paid under MAT are available as a set off against regular corporate tax payable in subsequent years, as per the relevant provisions of Income Tax Act. MAT paid in a year is charged to the statement of profit and loss as current tax. The Group recognizes MAT credit available as an asset only to the extent that there is convincing evidence that the Group will pay normal income tax during the specified period, i.e., the period for which MAT credit is allowed to be carried forward. In the year in which the Group recognizes MAT credit as an asset in accordance with the Guidance Note on Accounting for Credit Available in respect of Minimum Alternative Tax under the Income-tax Act, 1961, the said asset is created by way of credit to the statement of profit and loss and shown as “MAT Credit Entitlement.” The Group reviews the “MAT credit entitlement” asset at each reporting date and writes down the asset to the extent the Group does not have convincing evidence that it will pay normal tax during the specified period.
d. Unadjusted tax effect of amounts directly debited to Reserves
The unadjusted tax effect of expenses directly charged to reserves is carried forward under Deferred Tax Assets and charged to the Statement of Profit and Loss as tax expense in subsequent years as and when and to the extent to which the proportionate tax benefits of such expenses are accounted.
XIII Employee Benefits
a. Short term employee benefits
Short term employee benefits are expensed as the related service is provided. A liability is recognised for the amount expected to be paid if the Group has a present legal or constructive obligation to pay this amount as a result of past service provided by the employee and the obligation can be estimated reliably.
b. Post Employment Benefits
(i) Defined contribution plans
Obligations for contributions to defined contribution plans are expensed as the related service is provided. Prepaid contributions are recognised as an asset to the extent that a cash refund or a reduction in future payments is available.
(ii) Defined benefit plans
Payment of Gratuity to employees is in the nature of a defined benefit plan. Provision for Gratuity is recorded on the basis of actuarial valuation

165Annual Report 2017-18
Built for challenges. Preparing for growth.
Notes forming part of the Consolidated Financial Statements
certificate provided by the actuary using Projected Unit Credit Method.
The Group’s net obligation in respect of defined benefit plans is calculated separately for each plan by estimating the amount of future benefit that employees have earned in the current and prior periods, discounting that amount and deducting the fair value of any plan assets.
The calculation of defined benefit obligations is performed annually by a qualified actuary using the projected unit credit method. When the calculation results in a potential asset for the Group, the recognized asset is limited to the present value of economic benefits available in the form of any future refunds from the plan or reductions in future contributions to the plan. To calculate the present value of economic benefits, consideration is given to any applicable minimum funding requirements.
Remeasurement of the net defined benefit liability, which comprise actuarial gains and losses and the return on plan assets (excluding interest) and the effect of the asset ceiling (if any, excluding interest) are recognised immediately in Other Comprehensive Income (OCI). Net interest expense / (income) on the net defined liability / (assets) is computed by applying the discount rate, used to measure the net defined liability / (asset). Net interest expense and other expenses related to defined benefit plans are recognised in the Statement of Profit and Loss.
When the benefits of a plan are changed or when a plan is curtailed, the resulting change in benefit that relates to past service or the gain or loss on curtailment is recognised immediately in the Statement of Profit and Loss. The Group recognizes gains and losses on the settlement of a defined benefit plan when the settlement occurs.
c. Other Long Term Employee Benefits
Group's liability towards compensated absences is determined by an independent actuary using Projected Unit Credit Method. Past services are recognised on a straight line basis over the average period until the benefits become vested. Actuarial gains and losses are recognised immediately in the Statement of Profit and Loss as income or expense or recognized under Other Comprehensive Income to the extent such actuarial gains or losses arise due to experience adjustments. Obligation is measured at the present value of the estimated future cash flows using a discounted rate that is determined by reference to the market yields at the Balance Sheet date on Government Bonds where the currency and terms of the Government Bonds are consistent with the currency and estimated terms of the defined benefit obligation.
XIV Leases
a. Where Group is the Lessee
Lease arrangements where the risks and rewards incidental to ownership of an asset substantially vest with the lessor are recognised as operating lease. Operating lease payments are recognised as an expense in the Statement of Profit and Loss on straight line basis over the lease term, unless there is another systematic basis which is more representative of the time pattern of the lease.
b. Where Group is the Lessor
Assets representing lease arrangements given under operating leases are included in Property, Plant, Equipment. Lease income is recognised in the Statement of Profit and Loss on straight line basis over the lease term, unless there is another systematic basis which is more representative of the time pattern of the lease. Initial direct costs are recognised immediately in the Statement of Profit and Loss.
c. Agreements which are not classified as finance leases are considered as operating lease.
d. Payments made under operating leases are recognised in the Statement of Profit and Loss. Lease incentives received are recognised as an integral part of the total lease expense over the term of the lease.
XV Borrowing Cost
Borrowing costs are interest and other costs that the Group incurs in connection with the borrowing of funds and is measured with reference to the effective interest rate applicable to the respective borrowing.
Borrowing costs, allocated to qualifying assets, pertaining to the period from commencement of activities relating to construction / development of the qualifying asset upto the time all the activities necessary to prepare the qualifying asset for its intended use or sale are complete.
All other borrowing costs are recognised as an expense in the period in which they are incurred.
XVI Cash and Cash Equivalents
Cash and cash equivalent as reported in the Balance Sheet comprise cash at banks and on hand and short term deposits with an original maturity of three months or less which are subject to an insignificant risk of changes in value. However, for the purposes of the Cash Flow Statement, cash and cash equivalents cash and short term deposits as defined in Ind AS 7.

166 Peninsula Land Limited
Financial Statements
Notes forming part of the Consolidated Financial Statements
XVII Earnings Per Share
Basic earnings per share is computed by dividing the profit / (loss) after tax by the weighted average number of equity shares outstanding during the year. The weighted average number of equity shares outstanding during the year is adjusted for the events for bonus issue, bonus element in a rights issue to existing shareholders, share split and reverse share split (consolidation of shares).
Diluted earnings per share is computed by dividing the profit / (loss) after tax as adjusted for dividend, interest and other charges to expense or income (net off any attributable taxes) relating to the dilutive potential equity shares, by the weighted average number of equity shares considered for deriving basic earnings per share and the weighted average number of equity shares which could have been issued on conversion of all dilutive potential equity shares.
XVIII Cash Flow Statement
Cash Flow Statement is prepared under the “Indirect Method” as prescribed under the Indian Accounting Standard (Ind AS) 7 –Statement of Cash Flows.
Cash and Cash equivalents for the purpose of cash flow statement comprise of cash at bank and in hand and short term investments with original maturity of three months or less.
XIX Provisions and Contingent Liabilities
A provision is recognised when the Group has a present obligation as a result of past events and it is probable that an outflow of resources will be required to settle the obligation in respect of which a reliable estimate can be made. Provisions (excluding retirement benefits) are not discounted to their present value and are determined based on the best estimate required to settle the obligation at the Balance Sheet date. These are reviewed at each Balance Sheet date and adjusted to reflect the current best estimates.
Contingent liabilities are disclosed for:
(i) possible obligations which will be confirmed only by future events not wholly within the control of the Group or
(ii) present obligations arising from past events where it is not probable that an outflow of resources will be required to settle the obligation or a reliable estimate of the amount of the obligation cannot be made.
Commitments include the amount of purchase order (net off advances) issued to parties for completion of assets.
Contingent Assets are not recognised in Financial Statements. If an inflow of economic benefits has become probable, contingent assets are disclosed.
Contingent Assets are assessed continually to ensure that developments are appropriately reflected in the Financial Statements. If it has become virtually certain that an inflow of economic benefits will arise, the asset and the related income are recognised in the Financial Statements of the period in which the changes occurs.
Provisions, contingent liabilities, contingent assets and commitments are reviewed at each Balance Sheet date.
XX Segment Reporting
The Chief Operational Decision Maker monitors the operating results of its business segments separately for the purpose of making decisions about resource allocation and performance assessment. Segment performance is evaluated based on profit or loss and is measured consistently with profit or loss in the financial statements. The operating segments have been identified on the basis of nature of product / services.
The Board of Directors of the Group has appointed the Managing Director as the Chief Operating Decision Maker (CODM) who is assessing the financial performance and position of the Group and makes strategic decisions.
XXI Barter transaction and Joint operation
Based on terms and conditions of joint development agreement which may indicate whether the contract involves exchange of goods according to Ind AS 18 “Revenue” or it is in the nature of a joint venture or joint operation according to Ind AS 111 Joint Arrangements. Accordingly, the Group accounts for barter transaction or joint operation, as the case may be.

167Annual Report 2017-18
Built for challenges. Preparing for growth.
Notes forming part of the Consolidated Financial Statements
NOT
E N
O. 3
PR
OPE
RTY
PLA
NT
& E
QU
IPM
ENT
(201
7-20
18)
(`
in C
rore
s)Pa
rtic
ular
sG
RO
SS C
ARR
YIN
G V
ALU
EAC
CUM
ULA
TED
DEP
REC
IATI
ON
NET
CAR
RYI
NG
VAL
UE
As o
n 01
-Apr
-17
Acqu
isiti
ons
thro
ugh
busi
ness
co
mbi
natio
ns
Addi
tions
du
ring
Ye
ar
Dis
posa
ls
duri
ng
Year
As o
n 31
-Mar
-18
Upt
o 01
-Apr
-17
Acqu
ired
on
acqu
isiti
onAd
ditio
ns
duri
ng
Year
Ded
uctio
ns/
Adju
stm
ents
Upt
o 31
-Mar
-18
As o
n 31
-Mar
-18
As o
n 31
-Mar
-17
(a)
Free
hold
Lan
d (N
ote
1) 1
22.0
1 -
-
-
1
22.0
1 -
-
-
-
-
1
22.0
1 1
22.0
1 (b
)B
uild
ings
(Not
e 2)
66.
19
-
0.2
7 -
6
6.46
1
0.95
-
1
.11
-
12.
06
54.
40
55.
24
(c)
Offi
ce E
quip
men
t &
Com
pute
rs 1
6.33
0
.35
0.1
6 -
1
6.84
1
5.97
0
.19
0.6
1 -
1
6.75
0
.08
0.3
6
(d)
Cons
truc
tion
Equi
pmen
t 6
.50
-
-
-
6.5
0 6
.50
-
-
-
6.5
0 -
-
(e
)Fu
rnitu
re &
Fix
ture
s 4
.40
-
0.3
3 -
4
.73
1.8
9 -
0
.36
-
2.2
5 2
.48
2.5
1 (f)
Mot
or V
ehic
les
4.6
3 0
.17
-
-
4.8
0 2
.68
0.0
5 0
.52
-
3.2
5 1
.55
1.9
5 (g
)Sp
eed
Boa
t 0
.64
-
-
-
0.6
4 0
.17
-
0.0
5 -
0
.22
0.4
2 0
.47
Tota
l 2
20.7
0 0
.52
0.7
6 -
2
21.9
8 3
8.15
0
.24
2.6
5 -
4
1.04
1
80.9
4 1
82.5
4 N
otes
:
1. L
and
of `
121
.94
Cro
res
(as
at 3
1st M
arch
, 201
7 -
Nil)
is
char
ged
agai
nst l
oan
from
Fin
anci
al In
stitu
tion.
For
det
ails
rel
atin
g to
sec
urity
ref
er n
ote
no. 2
2.2.
Inc
lude
s a
prop
erty
car
ryin
g va
lue
of `
35.
11 C
rore
s (a
s at
31s
t M
arch
, 20
17 -
Car
ryin
g va
lue
of `
4.2
3 C
rore
s) i
n M
umba
i ch
arge
d ag
ains
t ba
nk o
verd
raft
, ag
ains
t D
eben
ture
and
Loa
n fr
om
Fi
nanc
ial I
nstit
utio
n. F
or d
etai
ls r
elat
ing
to s
ecur
ity r
efer
not
e no
. 22
and
25.
(201
6-20
17)
(`
in C
rore
s)
Part
icul
ars
GR
OSS
CAR
RYI
NG
VAL
UE
ACCU
MU
LATE
D D
EPR
ECIA
TIO
NN
ET C
ARR
YIN
G V
ALU
E
As o
n 01
-Apr
-16
Rec
lass
ified
to
Inve
stm
ent
Prop
erty
Addi
tions
du
ring
Ye
ar
Dis
posa
ls
duri
ng
Year
As o
n 31
-Mar
-17
Upt
o 01
-Apr
-16
Rec
lass
ified
to
Inve
stm
ent
Prop
erty
Addi
tions
du
ring
Ye
ar
Ded
uctio
ns/
Adju
stm
ents
Upt
o 31
-Mar
-17
As o
n 31
-Mar
-17
As o
n 31
-Mar
-16
(a)
Free
hold
Lan
d 3
98.6
4 2
76.6
3 -
-
1
22.0
1 -
-
-
-
-
1
22.0
1 3
98.6
4
(b)
Bui
ldin
gs (N
ote
1 an
d 2)
88.
76
15.
67
-
6.9
0 6
6.19
1
1.89
1
.29
1.1
3 0
.78
10.
95
55.
24
76.
87
(c)
Offi
ce E
quip
men
ts &
Co
mpu
ters
16.
70
-
0.8
5 1
.22
16.
33
16.
18
-
0.8
6 1
.07
15.
97
0.3
6 0
.52
(d)
Cons
truc
tion
Equi
pmen
ts 6
.50
-
-
-
6.5
0 6
.50
-
-
-
6.5
0 -
-
(e)
Furn
iture
& F
ixtu
res
4.5
0 -
-
0
.10
4.4
0 1
.58
-
0.3
8 0
.07
1.8
9 2
.51
2.9
2
(f)M
otor
Veh
icle
s 4
.63
-
-
-
4.6
3 2
.14
-
0.5
4 -
2
.68
1.9
5 2
.49
(g)
Spee
d B
oat
0.6
4 -
-
-
0
.64
0.1
2 -
0
.05
-
0.1
7 0
.47
0.5
2
Tota
l 5
20.3
7 2
92.3
0 0
.85
8.2
2 2
20.7
0 3
8.41
1
.29
2.9
6 1
.92
38.
16
182
.54
481
.96
Not
es :
1.
Bas
ed o
n th
e in
tent
ion
and
revi
sed
busi
ness
pla
ns, a
com
mer
cial
bui
ldin
g ow
ned
by t
he C
ompa
ny is
con
side
red
as b
eing
hel
d fo
r ca
pita
l ap
prec
iatio
n an
d re
ntal
inco
me
rath
er t
han
for
busi
ness
purp
oses
. Hen
ce th
e C
ompa
ny h
as r
ecla
ssifi
ed th
is b
uild
ing
from
Pro
pert
y P
lant
and
Equ
ipm
ent t
o In
vest
men
t pro
pert
y w
.e.f.
1st A
pril
2016
.2.
Inc
lude
s a
prop
erty
(Car
ryin
g va
lue
of `
4.2
3 C
rore
s) in
Mum
bai c
harg
ed a
gain
st b
ank
over
draf
t. Fo
r de
tails
rel
atin
g to
sec
urity
ref
er n
ote
no. 2
5.

168 Peninsula Land Limited
Financial Statements
Notes forming part of the Consolidated Financial Statements
NOT
E N
O. 4
INVE
STM
ENT
PRO
PER
TY
(201
7-20
18) (
Ref
er N
ote
No.
56)
(`
in C
rore
s)
Part
icul
ars
GR
OSS
CAR
RYI
NG
VAL
UE
ACCU
MU
LATE
D D
EPR
ECIA
TIO
NN
ET C
ARR
YIN
G V
ALU
E
As o
n 1-
Apr-
17Ad
ditio
ns
duri
ng Y
ear
Dis
posa
ls
duri
ng Y
ear
As o
n 31
-Mar
-18
Upt
o 01
-Apr
-17
Addi
tions
du
ring
Yea
rD
educ
tions
/ Ad
just
men
tsU
pto
31-M
ar-1
8As
on
31-M
ar-1
8As
on
31-M
ar-1
7
(a)
Land
(Not
e 1)
276
.63
-
-
276.
63 -
-
-
-
2
76.6
3 2
76.6
3
(b)
Bui
ldin
g 2
0.23
-
-
20
.23
3.3
6 1
.41
-
4.7
8 1
5.44
1
6.86
Tota
l 2
96.8
6 -
-
2
96.8
6 3
.36
1.4
1 -
4
.78
292
.07
293
.49
Not
e 1
- La
nd o
f ` 2
76.6
3 C
rore
s (a
s at
31s
t M
arch
, 201
7 -
` 27
6.63
Cro
res)
and
bui
ldin
g of
` 1
2.10
Cro
res
(as
at 3
1st
Mar
ch, 2
017
- `
16.0
8 C
rore
s) in
Mum
bai i
s ch
arge
d ag
ains
t lo
an fr
om B
ank.
For
de
tails
rel
atin
g to
sec
urity
ref
er n
ote
no. 2
2.
(201
6-20
17)
(`
in C
rore
s)
Part
icul
ars
GR
OSS
CAR
RYI
NG
VAL
UE
ACCU
MU
LATE
D D
EPR
ECIA
TIO
NN
ET C
ARR
YIN
G V
ALU
E
As o
n 1-
Apr-
16R
ecla
ssifi
ed fr
om
Prop
erty
Pla
nt
and
Equi
pmen
t
Addi
tions
du
ring
Yea
rD
ispo
sals
du
ring
Yea
rAs
on
31-M
ar-1
7U
pto
01-A
pr-1
6R
ecla
ssifi
ed fr
omPr
oper
ty P
lant
and
Eq
uipm
ent
Addi
tions
du
ring
Ye
ar
Ded
uctio
ns/
Adju
stm
ents
Upt
o 31
-Mar
-17
As o
n 31
-Mar
-17
As o
n 31
-Mar
-16
(a)
Land
-
276
.63
-
-
276
.63
-
-
-
-
276
.63
-
(b)
Bui
ldin
g 4
.16
15.
67
0.4
0 -
2
0.23
0
.63
1.2
9 1
.43
-
3.3
6 1
6.86
3
.53
Tota
l 4
.16
292
.30
0.4
0 -
2
96.8
6 0
.63
1.2
9 1
.43
-
3.3
6 2
93.4
9 3
.53
NOT
E N
O. 5
INTA
NGI
BLE
ASS
ETS
(201
7-20
18)
(`
in C
rore
s)
Part
icul
ars
GR
OSS
CAR
RYI
NG
VAL
UE
ACCU
MU
LATE
D D
EPR
ECIA
TIO
NN
ET C
ARR
YIN
G V
ALU
E
As o
n 1-
Apr-
17Ad
ditio
nsD
ispo
sals
du
ring
Yea
rAs
on
31-M
ar-1
8U
pto
01-A
pr-1
7Ad
ditio
ns
duri
ng Y
ear
Ded
uctio
ns/
Adju
stm
ents
Upt
o 31
-Mar
-18
As o
n 31
-Mar
-18
As o
n 31
-Mar
-17
(a)
Com
pute
r So
ftw
are
4.7
9 0
.05
-
4.8
4 1
.25
0.6
2 -
1
.88
2.9
7 3
.54
Tota
l 4
.79
0.0
5 -
4
.84
1.2
5 0
.62
-
1.8
8 2
.97
3.5
4
(201
6-20
17)
(`
in C
rore
s)
Part
icul
ars
GR
OSS
CAR
RYI
NG
VAL
UE
ACCU
MU
LATE
D D
EPR
ECIA
TIO
NN
ET C
ARR
YIN
G V
ALU
E
As o
n 1-
Apr-
16Ad
ditio
ns
duri
ng Y
ear
Dis
posa
ls
duri
ng Y
ear
As o
n 31
-Mar
-17
Upt
o 01
-Apr
-16
Addi
tions
du
ring
Yea
rD
educ
tions
/ Ad
just
men
tsU
pto
31-M
ar-1
7As
on
31-M
ar-1
7As
on
31-M
ar-1
6
(a)
Com
pute
r So
ftw
are
4.7
9 -
-
4
.79
0.6
4 0
.61
-
1.2
5 3
.54
4.1
5
Tota
l 4
.79
-
-
4.7
9 0
.64
0.6
1 -
1
.25
3.5
4 4
.15

169Annual Report 2017-18
Built for challenges. Preparing for growth.
Notes forming part of the Consolidated Financial Statements
NOTE NO.6 INVESTMENTS IN ASSOCIATES AND JOINT VENTURES (` in Crores)
Particulars Nos. (Note 2)
Face Value (Rupees) (Note 2)
31-Mar-18 31-Mar-17
TRADE INVESTMENTI) Joint Ventures - Investment in Equity Instruments at Cost - (Fully paid)
-Unquoted(a) Hem Infrastructure and Property Developers Private Limited 628635 10 90.01 76.22
Add: (Loss)/ Profit (558171) (10) 6.04 0.88 Deemed Investment in Hem Infrastructure Property Developers Private Limited (Note 1)
- - 0.00 0.00
(b) Peninsula Brookfield Trustee Private Limited 10000 10 0.01 0.01 Add: (Loss)/ Profit (10000) (10) 0.04 0.03
(c) PenBrook Capital Advisors Private Limited (formerly known as Peninsula Brookfield Investments Managers Private Limited)
14900 10 0.01 0.01
Add: (Loss)/ Profit (14900) (10) (0.01) (0.01)II) Joint Ventures- Investment in Preference Shares - at Cost (Fully paid) -
Unquoted(d) PenBrook Capital Advisors Private Limited (formerly known as
Peninsula Brookfield Investments Managers Private Limited) Cumulative Compulsorily Convertible Preference Shares (Capital call)
1662878 100 16.63 16.63
Add: (Loss)/ Profit (1662878) (100) (8.81) (9.26)III) Joint Ventures - Contribution in LLP (e) Bridgeview Real Estate Development LLP - - 0.05 0.05
Add: (Loss)/Profit - - (0.05) (0.05)IV) Associates Companies (Equity Instruments at Cost - Fully paid) -
Unquoted(f) Goodhome Realty Limited - converted to subsidiary company w.e.f. 31st
March, 2018 (as at 31st March, 2017- associate company) - - - 0.01
Add: (Loss)/ Profit (14000) (10) - (0.01)(g) JM Realty Management Private Limited (Classified to Investments held
for sale- Refer Note No. 19) - - - 0.00
(2500) (10) - -Deemed Investments in JM Realty Management Private Limited (Note 1)-
(h) by Peninsula Holdings and Investments Private Limited - - - 2.32 (i) by Peninsula Land Limited - - - 2.78
Add : (Loss)/Profit - - - (1.74)Deemed Investments Written off
(j) RR Mega City Builders Limited- converted to subsidiary company w.e.f. 31st March, 2018 (as at 31st March, 2017- associate company)
- - - 0.01
Add: (Loss)/ Profit (14000) (10) - (0.01)(k) Sew Engineering (India) Private Limited - - - 6.54
Add: (Loss)/ Profit (989300) (10) - 4.26 (Classified as Investments held for sale - Refer Note No. 19)
(l) Rockfirst Real Estate Limited -converted to subsidiary company w.e.f. 31st March, 2018 (as at 31st March, 2017- associate company)
- - - 0.01
Add: (Loss)/ Profit (14000) (10) - (0.01)(m) Top Value Real Estate Limited - w.e.f 31st March, 2017 subsidiary
company - - - -
Add: (Loss)/ Profit (14000) (10) - 0.13 Less: Transfer to Capital Reserve on acquiring 100% stake in the company - (0.13)
(n) Truewin Realty Limited - converted to subsidiary company w.e.f. 31st March, 2018 (as at 31st March, 2017- associate company)
- - - 0.01
Add: (Loss)/ Profit (14000) (10) - (1.21)Add: Financial guarantee given for Truewin Realty Limited by Peninsula Land Limited
- 1.20
V) Associate Entity-Contribution(o) RA Realty Ventures LLP - - - 0.39
Add: (Loss)/ Profit - - - (3.99) Add: Financial guarantee given for RA Realty Ventures LLP by Peninsula Land Limited
- - - 3.60
Total 103.92 98.68

170 Peninsula Land Limited
Financial Statements
Notes forming part of the Consolidated Financial Statements
(` in Crores)Particulars 31-Mar-18 31-Mar-17
Aggregate amount of unquoted Investments 103.92 98.68 Aggregate amount of quoted Investments - - Aggregate amount of impairment in value of investments - - Total 103.92 98.68
Notes:
1. The Company has given interest free loans and deposits to joint ventures and associates. Under Ind AS, long term loans are discounted at their present value using the market interest rate and estimated repayment term. The discounting element will unwind as interest income over the next 3 years, i.e. the period considered for discounting. The same has been accounted as deemed cost of investment and included in the value of investments.
2. Figures in bracket represent pervious year figures.
NOTE NO. 7 NON CURRENT INVESTMENTS
(` in Crores)
Particulars Nos. (Note 1) Face Value (Rupees) (Note 1)
31-Mar-18 31-Mar-17
A) INVESTMENTS IN DEBENTURES OF ASSOCIATES COMPANIES (FULLY PAID UNLESS STATED OTHERWISE)As contribution towards Project in converted to subsidiary company w.e.f. 31st March, 2018 (as at 31st March, 2017- associate company) - Unquoted (At FVTPL)
(a) Good Home Realty Limited 0% Unsecured Redeemable Optionally Fully Convertible Debentures
- - - 93.16 (12680330) (74.45)
(b) Rockfirst Real Estate Limited 0% Unsecured Redeemable Optionally Fully Convertible Debentures
- - - - ( 3488450 ) (100)
(c) RR Mega City Builders Limited 0% Unsecured Redeemable Optionally Fully Convertible Debentures
- - - 51.19 (5486981) (100)
(d) Truewin Realty Limited 0% Unsecured Redeemable Optionally Convertible Debentures
- - - - (897135) (100)
B) INVESTMENTS IN DEBENTURES - (FULLY PAID UNLESS STATED OTHERWISE)- UNQUOTEDAs contribution towards Project - Unquoted (At FVTPL)
(e) JM Township & Real Estate Private Limited 0% Unsecured Redeemable Optionally Fully Convertible Debentures
- - - 9.66 (9656855) (10)
C) INVESTMENTS IN DEBENTURES - (FULLY PAID UNLESS STATED OTHERWISE) - UNQUOTED (AT AMORTISED COST)
(f) Ansal Hi-tech Townships Limited 20.25% Secured Non - Convertible Debentures fully paid up
960 100000 9.60 9.60 (960) (100000)
(g) Elvera Realtors Private Limited 14% Non - Convertible Debentures fully paid up
21 785496 1.65 2.10 (21) (1000000)
(h) Incor Appa Projects Private Limited 17.50% Non - Convertible Debentures fully paid up
20 - - 1.33 (20) (912647)
(i) Reddy Structures Private Limited 16% Secured Redeemable Non Convertible Debentures fully paid up
3 181848 0.05 0.24 (3) (920323)
(j) Reddy Housing Private Limited 16% Secured Redeemable Non - Convertible Debenture fully paid up
17 199304 0.34 1.37

171Annual Report 2017-18
Built for challenges. Preparing for growth.
Notes forming part of the Consolidated Financial Statements
(` in Crores)
Particulars Nos. (Note 1) Face Value (Rupees) (Note 1)
31-Mar-18 31-Mar-17
(17) (920233)D) INVESTMENTS IN PREFERENCE SHARES IN SUBSIDIARY
COMPANIES (FULLY PAID UNLESS STATED OTHERWISE) {W.E.F. 31ST MARCH, 2018 (31ST MARCH, 2017 - ASSOCIATE COMPANIES)} - UNQUOTED (AT FVTPL) (Refer Note 46)
(k) Goodhome Realty Limited 2% Non Cumulative Participating Redeemable Preference Shares
- - - 0.35 (35270) (100)
(l) Rockfirst Real Estate Limited 2% Redeemable Non Cumulative Participating Non Convertible Preference Shares
- - - - ( 10150 ) (100)
(m) RR Mega City Builders Limited 2% Non Cumulative Participating Redeemable Preference Shares
- - - 0.08 (11619) (100)
(n) Truewin Realty Limited 2% Non Cumulative Participating Redeemable Preference Shares
- - - - (1465) (100)
E) INVESTMENTS IN PREFERENCE SHARES IN JOINT VENTURE COMPANIES (FULLY PAID UNLESS STATED OTHERWISE) UNQUOTED (AT FVTPL)
(o) Hem Infrastructure and Property Developers Private Limited Redeemable Optionally Convertible Preference Shares
303832 10 55.02 60.37 (341235) (10)
F) INVESTMENTS IN PREFERENCE SHARES (FULLY PAID UNLESS STATED OTHERWISE) UNQUOTED (AT FVTPL)
(p) Piramal Infrastructure Private Limited 1% Non Cumulative Non-Participating Non- Convertible Redeemable Preference shares
5000000 10 5.00 5.00 (5000000) (10)
G) INVESTMENT IN EQUITY SHARES (FULLY PAID UNLESS STATED OTHERWISE) UNQUOTED (AT FVTPL)
(q) Aero Ports & Infrastructure Projects Private Limited (Classified as Investments held for sale - Refer Note No. 19)
- - - 0.04
Add/ (Less): Provision for Impairment (43750) (10) - (0.04)(r) JM Township & Real Estate Private Limited (Classified as
Investments held for sale - Refer Note No.19) - 0.18
(175000) (10)(s) Piramal Infrastructure Private Limited 5381900 10 8.07 8.07
(5381900) (10)(t) The Shamrao Vithal Co operative Bank Limited 25 25 0.00 0.00
(25) (25)H) INVESTMENT IN REALTY FUND - UNQUOTED (AT FVTPL)(u) Peninsula Brookfield Real Estate Fund - Class B Units 41513
(72813)100000
(100000) 0.53 0.86
Total 80.26 243.56
(` in Crores)Particulars 31-Mar-18 31-Mar-17Aggregate amount of unquoted Investments 80.26 243.56 Aggregate amount of quoted Investments - - Total 80.26 243.56
Notes :1. Figures in bracket represent previous year figures.

172 Peninsula Land Limited
Financial Statements
Notes forming part of the Consolidated Financial Statements
NOTE NO. 8 - NON CURRENT FINANCIAL ASSETS- LOANS (Unsecured, Considered Good, unless otherwise stated)
(` in Crores)Particulars 31-Mar-18 31-Mar-17Loans to Related Parties for Projects (Refer Note No. 40)
(a) Loan to Joint Ventures (for projects) 79.76 74.37 (b) Loan to Associates (for projects) 226.07 201.88
Less: Provision for Impairment (91.50) - Total 214.33 276.25
NOTE NO. 9 OTHER NON CURRENT FINANCIAL ASSETS (Unsecured, Considered Good, unless otherwise stated)
(` in Crores)
Particulars 31-Mar-18 31-Mar-17
(a) Fixed deposit having maturity for more than twelve months (Note 1) 19.72 4.63 (b) Margin money with Bank (Note 2) 0.12 0.05
Total 19.84 4.68 Notes:1. Includes ` 0.88 Crores for pledged against loan of ` 45.30 Crores (31st March 2017 - ` 79.74 Crores) 2. Margin money kept with bank as fixed deposit for issue of bank guarantee.
NOTE NO. 10 OTHER NON CURRENT ASSETS (Unsecured, Considered Good, unless otherwise stated)
(` in Crores)Particulars 31-Mar-18 31-Mar-17
(a) Prepaid Expenses 6.33 0.66 (b) Security Deposits 2.48 2.42
Total 8.81 3.08
NOTE NO. 11 INVENTORIES (Valued at cost or Net Realisable Value, whichever is lower)
(` in Crores)Particulars 31-Mar-18 31-Mar-17
(a) Finished goods (Realty Stock) (Note 1) 30.32 50.78 (b) Work in progress (Realty Stock) (Note 2) 2,856.52 2,695.70 (c) Raw material stock 28.63 5.62 (d) Trading Goods 0.45 0.45
Total 2,915.92 2,752.55 Notes :1. Includes pledge of ` 34.33 Crores as at 31st March 2018 (as at 31st March 2017 - ` 53.10 Crores). For details relating to security refer note 22 & 25. 2. includes pledge of ` 1,709.97 Crores as at 31st March 2018 (as at 31st March, 2017 - `1802.19 Crores). For details relating to security refer note 22 & 25. Interest of ` 170.94 Crores (as at 31st March, 2017 - ` 224.27 Crores) has been treated as project cost and added to Work in Progress.
NOTE NO. 12 CURRENT INVESTMENTS (` in Crores)
Particulars 31-Mar-18 31-Mar-17
Investments in units of Mutual fund (At FVTPL)(a) ICICI Prudential Flexi Income Plan Premium Daily Dividend
(Units in mutual fund : 31 March 2018 - 7,49,425 and 31st March 2017 - 7,15,619) 7.93 7.57
(b) HDFC Mutual fund - saving plan daily dividend (Units in mutual fund : 31 March 2018 - 35,788 and 31st March 2017 - Nil)
3.81 -
(c) L&T Financial services (Units in mutual fund : 31 March 2018 - 5,96,486 and 31 March 2017 - Nil)
0.99 -
Total 12.73 7.57
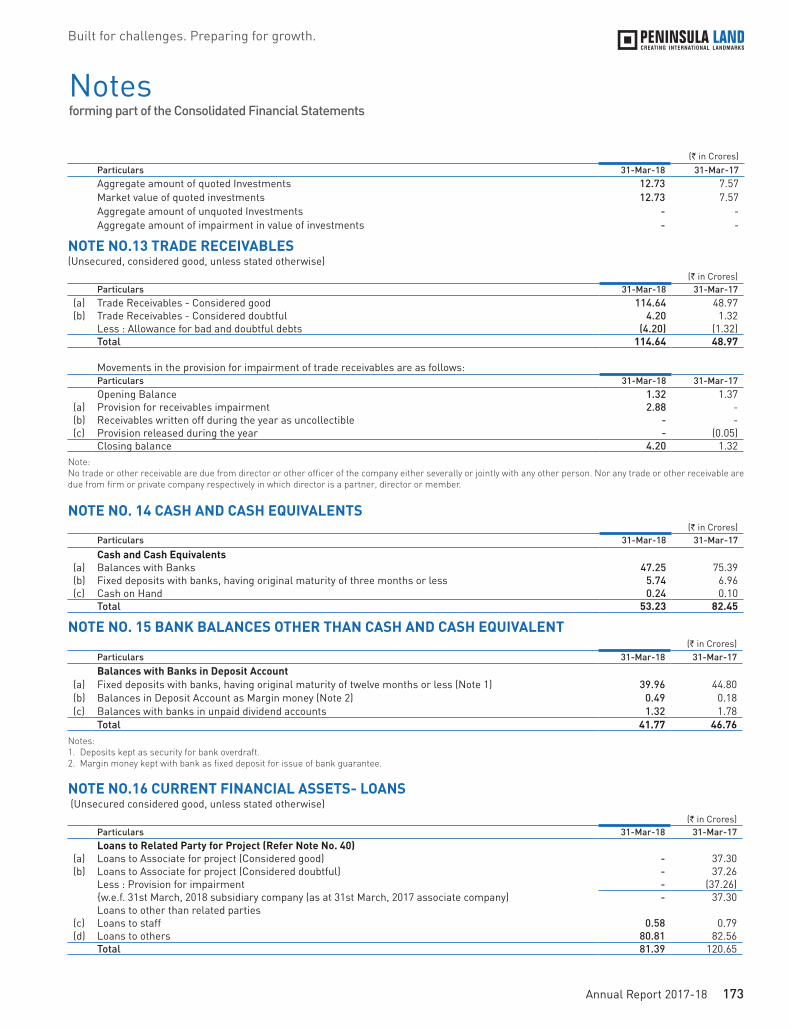
173Annual Report 2017-18
Built for challenges. Preparing for growth.
Notes forming part of the Consolidated Financial Statements
(` in Crores)Particulars 31-Mar-18 31-Mar-17Aggregate amount of quoted Investments 12.73 7.57 Market value of quoted investments 12.73 7.57 Aggregate amount of unquoted Investments - - Aggregate amount of impairment in value of investments - -
NOTE NO.13 TRADE RECEIVABLES (Unsecured, considered good, unless stated otherwise)
(` in Crores)Particulars 31-Mar-18 31-Mar-17
(a) Trade Receivables - Considered good 114.64 48.97 (b) Trade Receivables - Considered doubtful 4.20 1.32
Less : Allowance for bad and doubtful debts (4.20) (1.32)Total 114.64 48.97
Movements in the provision for impairment of trade receivables are as follows:Particulars 31-Mar-18 31-Mar-17Opening Balance 1.32 1.37
(a) Provision for receivables impairment 2.88 - (b) Receivables written off during the year as uncollectible - - (c) Provision released during the year - (0.05)
Closing balance 4.20 1.32 Note: No trade or other receivable are due from director or other officer of the company either severally or jointly with any other person. Nor any trade or other receivable are due from firm or private company respectively in which director is a partner, director or member.
NOTE NO. 14 CASH AND CASH EQUIVALENTS (` in Crores)
Particulars 31-Mar-18 31-Mar-17
Cash and Cash Equivalents(a) Balances with Banks 47.25 75.39 (b) Fixed deposits with banks, having original maturity of three months or less 5.74 6.96 (c) Cash on Hand 0.24 0.10
Total 53.23 82.45
NOTE NO. 15 BANK BALANCES OTHER THAN CASH AND CASH EQUIVALENT (` in Crores)
Particulars 31-Mar-18 31-Mar-17Balances with Banks in Deposit Account
(a) Fixed deposits with banks, having original maturity of twelve months or less (Note 1) 39.96 44.80 (b) Balances in Deposit Account as Margin money (Note 2) 0.49 0.18 (c) Balances with banks in unpaid dividend accounts 1.32 1.78
Total 41.77 46.76 Notes: 1. Deposits kept as security for bank overdraft. 2. Margin money kept with bank as fixed deposit for issue of bank guarantee.
NOTE NO.16 CURRENT FINANCIAL ASSETS- LOANS (Unsecured considered good, unless stated otherwise)
(` in Crores)Particulars 31-Mar-18 31-Mar-17Loans to Related Party for Project (Refer Note No. 40)
(a) Loans to Associate for project (Considered good) - 37.30 (b) Loans to Associate for project (Considered doubtful) - 37.26
Less : Provision for impairment - (37.26){w.e.f. 31st March, 2018 subsidiary company (as at 31st March, 2017 associate company) - 37.30 Loans to other than related parties
(c) Loans to staff 0.58 0.79 (d) Loans to others 80.81 82.56
Total 81.39 120.65

174 Peninsula Land Limited
Financial Statements
Notes forming part of the Consolidated Financial Statements
NOTE NO. 17 OTHER FINANCIAL ASSETS (Unsecured considered good, unless stated otherwise)
(` in Crores)Particulars 31-Mar-18 31-Mar-17
(a) Interest receivable (31st March, 2017 - ` 18.57 Crores from Associates) 37.98 21.19 (b) Unbilled revenue 37.43 43.30 (c) Fixed deposits with banks, having remaining maturity in twelve months from reporting date 1.20 12.31 (d) Other receivables 21.26 20.26
Other receivables - Considered doubtful. 0.71 -Less : Provision for doubtful recoverables (0.71) -Total 97.87 97.06
NOTE NO. 18 OTHER CURRENT ASSETS (Unsecured considered good, unless stated otherwise)
(` in Crores)Particulars 31-Mar-18 31-Mar-17
(a) Prepaid Expenses 0.39 0.60 (b) Advances for Projects/ Land to related party 0.10 0.15
(i) Where Director is member or Director and LLP where director is partner or Member(ii) Advance for property to Joint Venture 15.00 15.00
(c) Employee Benefits - Gratuity (Refer Note No. 39) - 0.04 (d) Advances to third parties for Projects/ Land 107.75 95.81
Less: Impairment of receivable (1.67) - (e) Balance with Government authorities
(i) GST Credit (Unsecured, considered good) 24.98 - (ii) Service Tax Credit (Unsecured, considered doubtful) 0.87 5.27 Less: Provision for doubtful recoverables (0.78) - Total 146.64 116.87
NOTE NO. 19 INVESTMENTS HELD FOR SALE (At cost or fair value less cost to sell, whichever is lower)
(` in Crores)Particulars Nos. Face Value
(Rupees) 31-Mar-18 31-Mar-17
Investments in Associate Company(a) Sew Engineering (India) Private Limited 989300 10 6.54 -
Add: Profit/ (Loss) 4.26 - Less: Associates Profit reversal on held for sale (4.26) -
(b) JM Realty Management Private Limited 2500 10 - - Other Investments
(c) JM Township & Real Estate Private Limited 175000 10 0.16 - (d) Aero Ports & Infrastructure Projects Private Limited 43750 10
Total 6.70 -
The Company has classified above Non-Current Assets (Investments) in Equity share of Associates Companies/ Other Company as held for sale since negotiation with the other Equity share holders of Associates Companies/ Other Company is in progress and once the negotiation will complete, the Company will sell the stake in the Associates Companies/ Other Company within one year.
NOTE NO. 20 EQUITY SHARE CAPITAL (` in Crores)
Particulars 31-Mar-18 31-Mar-17
I EQUITY SHARE CAPITAL(A) Authorised:
39,05,00,000 (as at 31st March 2017- 39,05,00,000) Equity Shares of ` 2/- each 78.10 78.10 20,000 (as at 31st March 2017 - 20,000) 0.01% Non -Cumulative Redeemable Preference Shares of ̀ 10/- each 0.02 0.02 1,000 (as at 31st March 2017 - 1,000) 5% Cumulative Redeemable Preference Shares of ` 10/- each 0.00 0.00
78.12 78.12

175Annual Report 2017-18
Built for challenges. Preparing for growth.
Notes forming part of the Consolidated Financial Statements
(` in Crores)Particulars 31-Mar-18 31-Mar-17
(B) Issued, Subscribed and fully paid-up(a) Equity Shares:
Balance at the beginning of the year * 55.84 55.84 27,92,01,220 Equity Shares (as at 31st March 2017 - 27,92,01,220 ) of ` 2/- each Fully paid up (Includes 13,33,20,055 Shares of ` 2/- Each (as at 31st March 2017 - 13,33,20,055 shares of ` 2/- each) issued pursuant to Schemes of Arrangement for consideration other than cash issued prior to five year from this balance sheet date)Add: Forfeited shares 0.06 0.06 Balance at the end of the year 55.90 55.90
* There is no movement in the number of shares during the year.
Terms /rights attached to Equity shares
The Company has only one class of equity shares having a par value of ` 2/- per share. Each holder of equity share is entitled to one vote per share. All shares rank pari passu with regard to dividend and repayment of capital.
In the event of liquidation of the Company, the holders of equity shares will be entitled to receive any of the remaining assets of the Company in proportion to the number of equity shares held by the shareholders, after distribution of all preferential amounts.
II. Details of Equity Shares held by each shareholder holding more than 5% shares in the Company :Name of Share holder 31-Mar-18 31-Mar-17
No. of shares held % of Holding No. of shares held % of Holding
(a) Ashok Piramal Group Real Estate Trust (through its Trustee Mrs. Urvi A. Piramal)
148,929,248 53.34 148,929,248 53.34
(b) Franklin Templeton Investment Funds - - 19,885,667 7.12
III. Details of Shares held by the Controlling entity :Name of Share holder 31-Mar-18 31-Mar-17
No. of shares held % of Holding No. of shares held % of Holding
(a) Ashok Piramal Group Real Estate Trust (through its Trustee Mrs. Urvi A. Piramal)
148,929,248 53.34 148,929,248 53.34
NOTE NO. 21 OTHER EQUITY (` in Crores)
Particulars 31-Mar-18 31-Mar-17
(a) Capital Redemption Reserve* 0.17 0.17 (b) Capital Reserve
Balance at the beginning of the year 4.39 3.58 Add: Capital Reserve on acquisition of subsidiary - 0.81 Balance at the end of the year 4.39 4.39
(c) Securities Premium Reserve* 635.57 635.57 (d) General Reserve* 73.44 73.44 (e) Debenture Redemption Reserve
Balance at the beginning of the year 190.11 146.18 Less: Recoupment of Debenture Redemption Reserve 97.19 26.31 Add: Transfer from Statement of Profit and Loss 45.87 70.24 Balance at the end of the year 138.79 190.11
(f) Retained EarningsBalance at the beginning of the year 550.18 817.92

176 Peninsula Land Limited
Financial Statements
Notes forming part of the Consolidated Financial Statements
(` in Crores)Particulars 31-Mar-18 31-Mar-17
Less: Dividend on Equity Shares - 5.57 Less: Dividend Distribution Tax thereon - 1.13 Less: Associates profit adjustments on acquisition - 0.13 Less: Transfer to Debenture Redemption Reserve 45.87 70.24 Add: Re-measurement (gain)/loss on defined benefit plans (net) 0.33 (0.07)Add: Recoupment of Debenture Redemption Reserve 97.19 26.31 Add: Net Profit/ (Loss) as per Statement of Profit and Loss for the year (444.13) (216.91)Balance at the end of the year 157.70 550.18 Total 1,010.05 1,453.85
* There is no movement in the reserves during the year
Nature of Reserves :
1. Capital Redemption Reserve :
The Company had recognised Capital Redemption Reserve on buyback of equity shares or redemption of preference shares from its retained earnings. The amount in Capital Redemption Reserve is equal to nominal amount of the equity shares bought back or redemption of preference shares.
2. Securities Premium Reserve :
Securities premium is used to record the premium on issue of shares or debentures. The reserve will be utilised in accordance with the provisions of the Companies Act, 2013.
3. General Reserve :
The Company has transferred a portion of the net profit of the Company before declaring dividend to general reserve pursuant to the earlier provisions of Companies Act, 1956. Mandatory transfer to general reserve is not required under the Companies Act, 2013.
4. Debenture Redemption Reserve (DRR) :
As per section 71 of Companies Act, 2013 and Rule 18 of the Companies (Share Capital and Debentures) Rules, 2014. The Company shall create a DRR for the purpose of redemption of debentures. The said amount is only be utilised for the purpose of redemption of debentures.
5. Retained Earnings :
Retained earnings are the profits that the Company has earned till date, less any transfers to general reserve, dividends or other distributions to shareholders.
NOTE NO. 22 LONG TERM BORROWINGS (` in Crores)
Particulars 31-Mar-18 31-Mar-17
Secured Loan(I) From Banks -Term Loans (Refer Note I below) 670.49 254.77 (II) From Financial Institutions (Refer Note II below) 148.58 119.90 (III) From Others -Debentures (Refer Note III below) 716.29 930.44 (IV) From Others -Loans (Including inter corporate loan) (Refer Note IV below) 248.38 124.46 (V) Preference Shares (Refer Note V below) 0.09 0.07
Total 1,783.83 1,429.64

177Annual Report 2017-18
Built for challenges. Preparing for growth.
Notes forming part of the Consolidated Financial Statements
(` in Crores)Particulars 31-Mar-18 31-Mar-17
I The Term Loans from Banks are:1. Term Loan 1 24.81 69.68 (a) Terms of Loan Repayment
Outstanding balance as at balance sheet date is repayable in 16 monthly instalments.(b) Security
Secured against charge on Land (held for real estate development) situated at Gahunje, Pune and receivable from the project developed on the said land.
2 Term Loan 2 192.53 200.51 (a) Terms of Loan Repayment
Outstanding balance as at balance sheet date is repayable in 120 varying monthly instalments.(b) Security
Secured against mortgage of commercial property situated at Parel, Mumbai along with hypothecation of lease rentals there from.
3. Term Loan 3 83.72 13.77 Terms of Loan Repayment
(a) Repayment Term: 36 equal monthly repayments commencing from January, 2019.(b) Security
First Charge over entire project assets including land, building with minimum security cover of 1.5. First charge on cash flow (receivables) generated from the Byculla project, these receivable shall be routed through designated account maintained with Standard Chartered Bank.
4. Term Loan 4 123.29 - (a) Terms of Loan Repayment
Outstanding Balance as at Balance Sheet date is repayable in 18 monthly instalments commencing from 15th August, 2021.
(b) SecurityFirst Pari Passu Mortgage on identified piece of Land (held For Real Estate Development) located at Gahunje, Pune and receivable from the project developed on the said land.
5 Term Loan 5 34.33 - (a) Terms of Loan Repayment
Outstanding Balance as at Balance Sheet date is repayable in 9 quarterly instalments.(b) Security
Exclusive charge on the unsold inventory at Ashok Astoria project at Nashik and land of Phase 2 at Nashik. Exclusive Charge on receivables of sold flats of Nashik Project.
6. Term Loan 6 232.22 - (a) Terms of Loan Repayment
Outstanding Balance as at Balance Sheet date is repayable In 24 monthly instalments commencing from 15th December, 2019.
(b) SecuritySecured Against Charge On Development rights of the project of the company (held for real estate development) situated at Sewree, Mumbai along with scheduled receivables from the project.
7. Term Loan 7 24.79 - (a) Terms of Loan Repayment
Outstanding Balance as at Balance Sheet date is repayable in 109 equated monthly instalments commencing from April, 2018 upto April, 2027.
(b) SecuritySecured against mortgaged of property situated at Piramal Chambers, Parel, Mumbai along with hypothecation of lease rentals.Less: Current Maturities of Long Term Debt {Refer note no. 27(a)} (45.20) (29.19)Total 670.49 254.77
II The term loans from Financial Institution :1. Loan 1 - 137.75 (a) Terms of Loan Repayment
Loan has been repaid by the company prior to its scheduled repayment date(b) Security
Mortgage of the Company's immovable property comprising land and present and future construction thereon at its project Celestia Spaces Sewree, Mumbai and a charge on the receivable from the said project.
2. Loan 2 - 54.00 (a) Terms of Loan Repayment
Loan has been repaid by the company prior to its scheduled repayment date

178 Peninsula Land Limited
Financial Statements
Notes forming part of the Consolidated Financial Statements
(` in Crores)Particulars 31-Mar-18 31-Mar-17
(b) SecurityMortgage of the Company's immovable property comprising land and present and future construction thereon at its project Celestia Spaces Sewree, Mumbai and a charge on the receivable from the said project and Mortgage of Investments property situated at Peninsula Corporate Park, Mumbai.
3. Loan 3 - 53.10 (a) Terms of Loan Repayment
Loan has been repaid by the company prior to its scheduled repayment date(b) Security
Mortgage of the Company's immovable property comprising land and present and future construction thereon at its project Ashok Astoria, Nashik and a charge on the receivable from the said project.
4. Loan 4 148.58 - (a) Terms of Loan Repayment
Outstanding Balance as at Balance Sheet date is repayable In 4 half yearly equal instalments Commencing from July, 2020
(b) SecurityMortgage Of The Company's Immovable Property and pledge of 86,00,000 Equity Shares of Peninsula Land Limited Held by Ashok Piramal Group Real Estate Trust
5. Loan 5 48.50 -Terms of Loan RepaymentOutstanding Balance as at Balance Sheet date is repayable in one year SecurityThe Loan from financial institution is secured by (a) mortgage of land and construciton there upon present and future (b) exclusive charge on schedule receivable and all insurance proceeds both present and future Less: Current Maturities of Long Term Debt {Refer note 27(a)} (48.50) (124.95)Total 148.58 119.90
III From Others - Debentures (Refer Note No. 1,2 & 3 ) 927.90 1,202.09 (a) Terms of Loan Repayment
Outstanding balance as at balance sheet date is repayable between May, 2018 upto October, 2023 (Refer Note A below)
(b) Security(i) Secured against charge on Movable property relating to the project of the Company,(ii) Secured against Immovable property (held for real estate development) belonging to Company,
Subsidiary Company and other Companies for whom the Company has undertaken the project development and execution,
(iii) Hypothecation on project trade receivables, Escrow Accounts and Securities of the identified subsidiary companies.
(iv) Secured against charge of Immovable property (held as fixed assets namely Piramal Chamber & one unit at Peninsula Centre, Mumbai) belonging to Company,
(v) Secured by personal guarantee of Vice Chairman & Managing Director for ` 450 Crores debenture issued by the Company.
Less: Current Maturities of Long Term Debt {Refer note 27(a)} (211.61) (271.65)Total 716.29 930.44
IV From Others - Loans (Including Intercorporate Loan)1 Loan 1 - 54.92 (a) Terms of Loan Repayment
Loan has been repaid by the company prior to its scheduled repayment date(b) Security
(i) Pari passu registered Mortgage on Land (held for real estate development) belonging to the subsidiary Company for whom the Company has undertaken the project located at Tathawde, Pune. Hypothecation of receivables generated from the sales of said project.
(ii) Along with Corporate Guarantee of Subsidiary Company.2 Loan 2(a) Terms of Loan Repayment - 54.47
Loan has been repaid by the company prior to its scheduled repayment date(b) Security
Pari-passu charge by way of a registered mortgage on land admeasuring 1,112.51 square meters located at Nepean Sea Road, Mumbai (Project Ram Mansion) along with receivables generated from the said project.

179Annual Report 2017-18
Built for challenges. Preparing for growth.
Notes forming part of the Consolidated Financial Statements
(` in Crores)Particulars 31-Mar-18 31-Mar-17
3 Loan 3 45.30 79.74 (a) Terms of Loan Repayment
Outstanding Balance as at Balance Sheet date is payable in 21 varying monthly instalments (b) Security
Secured against charge on Land (held for real estate development) situated at Gahunje, Pune and land situated at Sewree, Mumbai to be shared on pari passu basis with the other lender
4 Loan 4 99.07 - (a) Terms of Loan Repayment
Outstanding Balance as at Balance Sheet Date is payable in 12 equal monthly instalments commencing from February, 2020.
(b) SecurityPledge of 96.70% Equity Share of a Company where KMP/ their relatives exercise significant influence and personal guarantee of Vice Chairman & Managing Director
5 Loan 5(a) Terms of Loan Repayment 79.72 -
Outstanding Balance as at Balance Sheet date is Payable in 12 varying quarterly instalments commencing from December, 2019
(b) SecuritySecured against charge on Land (held for real estate development) situated at Tathawde, Pune held by subsidiary Company and receivable from the project developed on the said land and Corporate guarantee of subsidiary company
6 Loan 6 80.60 - (a) Terms of Loan Repayment
The term loan repayable in 24 Monthly instalments commencing from April 15, 2018. (b) Security
First charge on pari passu charge basis with other lender by way of equitable mortgage on the property; First charge on pari passu charge basis with other lender by way of hypothecation on schedule receivables and all insurance proceeds, both present and future;Less : Current Maturities of Long Term Debt {Refer note no. 27(a)} (56.31) (64.67)Total 248.38 124.46
V Preference Shares1. 65,000 (31st March 2017 - 65,000) 1% Non Cumulative Redeemable Preference Shares of ̀ 10/- each fully paid 2. 1,465 (as at 31st March 2017 - Nil) 2% Non Cumulative Participating Preference Shares of ` 100/- each
0.09 0.07
Total 0.09 0.07
Note 1: Debentures Redemption Schedule (` in Crores)Particulars 31-Mar-18 31-Mar-17
1. Redeemable in Financial Year 2022-23 77.00 76.28 2. Redeemable in Financial Year 2021-22 338.80 326.52 3. Redeemable in Financial Year 2020-21 114.00 101.72 4. Redeemable in Financial Year 2019-20 186.48 208.52 5. Redeemable in Financial Year 2018-19 211.62 217.40
Redeemable in Financial Year 2017-18 - 271.65 Total 927.90 1,202.09
Note 2: EIR (Effective rate of interest) on Debentures for the year 31st March, 2018 ranges from 11.25% to 18.58%.Note 3: Debenture of ` 203 Crores paid before the maturity during the year (as at 31st March, 2017 - ` 365 Crores) paid before the maturity.Note 4: EIR (Effective rate of interest) on Loans other than Debentures for the year 31st March, 2018 ranges from 9.20% to 13.50%.
NOTE NO. 23 OTHER NON - CURRENT FINANCIAL LIABILITIES (` in Crores)
Particulars 31-Mar-18 31-Mar-17
(a) Derivative liability of Debentures (Refer Note 34) 125.05 135.78
Total 125.05 135.78
Note: Repayment of derivative liability of debentures by 2022-2023.

180 Peninsula Land Limited
Financial Statements
Notes forming part of the Consolidated Financial Statements
NOTE NO.24 NON CURRENT PROVISIONS (` in Crores)
Particulars 31-Mar-18 31-Mar-17Provision for Employee benefits
(a) Gratuity (Refer Note No. 39) 3.98 0.15 (b) Compensated absences 4.02 3.74
Total 8.00 3.89
NOTE NO. 25 SHORT TERM BORROWINGS (At amortised cost) (` in Crores)
Particulars 31-Mar-18 31-Mar-171 Secured(a) Bank Overdraft 11.86 13.93 (i) Terms of Loan Repayment
Bank Overdraft is repayable on demand(ii) Security
Secured against charge on Immovable property held under PPE (Unit at Seaface Park, Mumbai)(b) Bank Overdraft 0.98 - (i) Terms of Loan Repayment
Bank Overdraft is repayable on demand(ii) Security
Secured against charge of Fixed Deposit with Bank(c) Bank Overdraft 27.46 33.09 (i) Terms of Loan Repayment
Bank Overdraft is repayable on demand(ii) Security
First Charge over entire byculla project assets including land, building with minimum security cover of 1.5x First charge on cash flow (receivables) generated from the project, these receivable shall be routed through a designated bank account.
(d) Bank Overdraft 13.98 - (i) Terms of Loan Repayment
Bank Overdraft is repayable on demand(ii) Security
Extension of exclusive charge by way of equitable mortgage on the schedule receivables of the project and all insurance proceeds, both present and future; of banglore project. Extension of exclusive charge by way of equitable mortgage on the property
2 Unsecured (a) Bank Overdraft 72.54 14.81
Terms of Loan RepaymentBank Overdraft is repayable on demand
(b) Commercial paperTerms of Loan Repayment - 149.91 Repayable within one year from balance sheet date
(c) Loan From Financial Institution 68.66 68.65 Terms of Loan RepaymentRepayable on March 2019(Secured by Personal Guarantee of Vice Chairman & Managing Director)
(d) Inter corporate Loan 71.60 40.00 Terms of Loan RepaymentRepayable within one year from balance sheet date
(e) Loans from Others 9.34 23.72 Terms of Loan RepaymentRepayable on demandInterest rate on short term borrowings range from 7.75% to 13.75%.Total 276.42 344.11

181Annual Report 2017-18
Built for challenges. Preparing for growth.
Notes forming part of the Consolidated Financial Statements
NOTE NO. 26 TRADE PAYABLES (` in Crores)
Particulars 31-Mar-18 31-Mar-17(a) Total outstanding dues of Micro, Small and Medium Enterprises (Refer Note No. 44) 5.92 0.65 (b) Total outstanding dues of Creditors Other than Micro, Small and Medium Enterprises 118.29 137.53
Total 124.21 138.18
NOTE NO. 27 OTHER CURRENT FINANCIAL LIABILITIES (` in Crores)
Particulars 31-Mar-18 31-Mar-17(a) Current Maturities of Long term debt (Refer Note No. 22) 361.63 490.45 (b) Interest accrued but not due on borrowings 255.94 161.61 (c) Unclaimed Dividends * 1.32 1.78 (d) Other Financial Liabilities (Including Condominium payable) 50.74 47.02 (e) Trade & Security Deposit 13.06 13.35
Total 682.69 714.21
* Investor education and protection fund shall be credited for unclaimed dividend when due as per section 124 & 125 of Companies Act, 2013
NOTE NO. 28 OTHER CURRENT LIABILITIES (` in Crores)
Particulars 31-Mar-18 31-Mar-17
(a) Advances from customer's/ Income received in advance 319.74 150.11 (b) Statutory dues payable 6.58 9.33 (c) Deferred Guarantee Revenue - 1.66
Total 326.32 161.10
NOTE NO. 29 CURRENT PROVISIONS (` in Crores)
Particulars 31-Mar-18 31-Mar-17Provision for Employee benefits
(a) Gratuity (Refer Note No. 39) 1.07 - (b) Compensated absences 3.32 2.58
Total 4.39 2.58
NOTE NO. 30 OTHER INCOME (` in Crores)
Particulars 2017-2018 2016-2017(a) Dividend On Mutual Fund 1.48 2.95 (b) Profit On Sale Of Property Plant And Equipment (Net) - 5.74 (c) Interest Income 54.18 111.62 (d) Miscellaneous Income 1.23 0.33
Total 56.89 120.64
NOTE NO. 31 EMPLOYEE BENEFITS EXPENSE (Including Managerial Remuneration) (` in Crores)
Particulars 2017-2018 2016-2017
(a) Salaries, Wages And Bonus 39.37 38.44 (b) Contributions To Provident And Other Funds 2.26 2.46 (c) Gratuity (Refer Note No. 39) 6.53 2.14 (d) Staff Welfare Expenses 1.52 1.38
Total 49.68 44.42

182 Peninsula Land Limited
Financial Statements
Notes forming part of the Consolidated Financial Statements
NOTE NO. 32 FINANCE COSTS(Refer Note No. 38)
(` in Crores)Particulars 2017-2018 2016-2017
(a) Interest Expenses 387.83 393.50 (b) Other Borrowing Cost 1.48 1.15
389.31 394.65 (c) Less : Transfer To Work -In-Progress (Refer Note No. 45) (170.94) (224.27)
Total 218.37 170.38
NOTE NO. 33 OTHER EXPENSES (` in Crores)
Particulars 2017-2018 2016-2017(a) Power and Fuel 1.25 1.68 (b) Repairs & Maintenance - Buildings 1.22 0.91 (c) Repairs & Maintenance - Others 3.40 2.93 (d) Insurance 0.23 0.26 (e) Rent (Refer Note No. 42) 0.32 0.56 (f) Rates & Taxes 1.29 0.73 (g) Legal & Professional Fees 16.38 18.56 (h) Advertisement and Sales Promotions 11.48 12.06 (i) Brokerage & Commission 18.18 8.30 (j) Donations 0.19 1.82 (k) Remuneration to Auditors (Refer Note No. 37) 0.66 0.60 (l) Loss On Investments held for sale 4.26 -
(m) Directors' Sitting Fees 0.16 0.15 (n) Provision For Impairment of Loans, Investments & Receivable 20.61 39.71 (o) Fair value loss on financial Instruments at FVTPL 12.34 9.35 (p) Miscellaneous Expenses 11.50 8.60 (q) Goodwill Written Off 2.28 -
Total 105.75 106.22
34 Financial Instruments - Fair Values and Risk Management
A Carrying Value / Fair Value as on reporting date
(` in Crores)Particulars 31-Mar-18
FVTPL FVTOCI Amortised Cost Total
Financial Assets Cash and Cash equivalents - - 53.23 53.23 Other Bank Balances - - 41.77 41.77 Non Current Investments (refer note C (i) & D below) 68.62 - 11.64 80.26 Current Investments 12.73 - - 12.73 Non Current - Loans (refer note C (i) & D below) - - 214.33 214.33 Current - Loans - - 81.39 81.39 Trade Receivables - - 114.64 114.64 Other Non Current Financial Assets - - 19.84 19.84 Other Current Financial Assets - - 97.87 97.87 Total 81.35 - 634.71 716.06 Financial Liabilities Non Current - Borrowings (refer note C (ii) below) - - 1,783.83 1,783.83 Current - Borrowings - - 276.42 276.42 Trade Payables - - 124.21 124.21 Other Non Current Financial Liabilities (refer note B below)
125.05 - - 125.05

183Annual Report 2017-18
Built for challenges. Preparing for growth.
Notes forming part of the Consolidated Financial Statements
(` in Crores)Particulars 31-Mar-18
FVTPL FVTOCI Amortised Cost Total
Other Current Financial Liabilities - - 682.69 682.69 Total 125.05 - 2,867.15 2,992.20
(` in Crores)Particulars 31-Mar-17
FVTPL FVTOCI Amortised Cost
Total
Financial Assets Cash and Cash equivalents - - 82.45 82.45 Other Bank Balances - - 46.76 46.76 Non Current Investments (refer note C (i) below) 228.92 - 14.64 243.56 Current Investments 7.57 - - 7.57 Non Current - Loans (refer note C (i) below) - - 276.25 276.25 Current - Loans - - 120.66 120.66 Trade Receivables - - 48.97 48.97 Other Non Current Financial Assets - - 4.68 4.68 Other Current Financial Assets - - 97.06 97.06 Total 236.49 - 691.47 927.96 Financial Liabilities Non Current - Borrowings (refer note C (ii) below) - - 1,429.64 1,429.64 Current - Borrowings - - 344.11 344.11 Trade Payables - - 138.18 138.18 Other Non Current Financial Liabilities (refer note B below)
135.78 - - 135.78
Other Current Financial Liabilities - - 714.21 714.21 Total 135.78 - 2,626.14 2,761.92
B Fair Value of Derivative Financial Liability (` in Crores)
Particulars 31-Mar-18 31-Mar-17
Derivative Financial Liability towards issued Debentures 125.05 135.78
C Fair Value of financial assets and liabilities which are measured at amortised cost
i Non Current Investments and non current loans measured at amortised cost includes investment in unquoted non convertible debentures and loan to group companies, the fair value of which is as stated below:
(` in Crores)Particulars 31-Mar-18 31-Mar-17Investment in unquoted Debentures (refer note 1 below) 11.64 14.64 Non-current loans (refer note 2 below) 214.23 276.26 Total 225.87 290.90
Note 1: Unquoted debentures in other entities considered to be at carrying amount. Note 2: Fair Value of Non-current loans are considered to be at carrying amount.
ii Non-current borrowings and other non current & current financial liabilities designated at amortised cost includes debentures issued, the fair value of which is considered to be the same as carrying amount as these debentures are not actively traded and the interest yield are similar to market interest rates.
(` in Crores)
Particulars 31-Mar-18 31-Mar-17
Debentures Issued 716.29 930.44
iii The Management assessed that the carrying amount of cash and cash equivalents, other bank balances, trade receivables and other receivables, other current and non current financial assets, current borrowings and other current financial liabilities approximate their fair values due to their short term nature. Further carrying value of non-current & current borrowings and investments (current and non current) which are measured at amortised cost and are having variable rate of interest, are reasonable approximation of the fair values.

184 Peninsula Land Limited
Financial Statements
Notes forming part of the Consolidated Financial Statements
D Fair Value Hierarchy: (` in Crores)
Financial Assets and Liabilities measured at FVTPL Quoted price in active markets
(Level 1)
Significant observable inputs
(Level 2)
Significant unobservable inputs
(Level 3)
Total
31 March 2018Financial Assets Investments at FVTPLUnquoted Equity Instruments - - 8.07 8.07 Unquoted Preference Shares - - 60.02 60.02 Unquoted Units of Realty Fund - - 0.53 0.53 Unquoted units of Mutual Fund 12.73 - - 12.73 Total Financial Assets 12.73 - 68.62 81.35 Financial LiabilitiesDerivative Financial Liability - - 125.05 125.05 Total Financial Liabilities - - 125.05 125.05
Financial Assets and Liabilities measured at Amortised Cost Quoted price in active markets
(Level 1)
Significant observable inputs
(Level 2)
Significant unobservable inputs
(Level 3)
Total
31 March 2018Financial AssetsInvestments Investment in Debentures - - 11.64 11.64 Loans & AdvancesNon-current loans - - 214.33 214.33 Total Financial Assets - - 225.97 225.97 Financial LiabilitiesDebentures 716.29 - - 716.29 Total Financial Liabilities 716.29 - - 716.29
Financial Assets and Liabilities measured at FVTPL Quoted price in active markets
(Level 1)
Significant observable inputs
(Level 2)
Significant unobservable inputs
(Level 3)
Total
31 March 2017Financial Assets InvestmentsUnquoted Debenture Instruments - - 154.01 154.01 Unquoted Equity Instruments - - 8.25 8.25 Unquoted Preference Shares - - 65.80 65.80 Unquoted Units of Realty Fund - - 0.86 0.86 Unquoted units of Mutual Fund 7.57 - - 7.57 Total Financial Assets 7.57 - 228.92 236.49 Financial LiabilitiesDerivative Financial Liability - - 135.78 135.78 Total Financial Liabilities - - 135.78 135.78
Financial Assets and Liabilities measured at Amortised Cost Quoted price in active markets
(Level 1)
Significant observable inputs
(Level 2)
Significant unobservable inputs
(Level 3)
Total
31 March 2017Financial AssetsInvestments Investment in Debentures - - 14.64 14.64 Loans & AdvancesNon Current Loans - - 276.25 276.25 Total Financial Assets - - 290.89 290.89 Financial LiabilitiesDebentures 930.44 - - 930.44 Total Financial Liabilities 930.44 - - 930.44

185Annual Report 2017-18
Built for challenges. Preparing for growth.
Notes forming part of the Consolidated Financial Statements
E Measurement of Fair Values
Valuation techniques and significant unobservable inputs
The valuation techniques used in measuring Level 3 fair values, as well as the significant unobservable inputs used are given below.
Particulars Valuation Technique Significant unobservable inputs
Sensitivity of the input to fair value
Non-current loans Discounted cash flow technique. The valuation model considers the present value of expected payment, discounted using a risk adjusted discount rate. The expected payment is determined by considering the possible scenarios of forecast revenue and EBITDA, the amount to be paid under each scenario and the probability of each scenario. The Group has taken 3 years as expected recovery period for all loans which are outstanding at opening balance sheet date for the purpose of discounting. The Group has taken weighted average cost of debt for the purpose of discounting of loans.
Risk adjusted discount rate - 15% (31-Mar-18 & 31-Mar-17)
The estimated fair value would increase / (decrease) if the risk adjusted discount rate were lower / (higher)
Investment in unquoted debentures and preference shares
Non convertible debentures are held for interest till maturity largely in a subsidiary company undertaking a specific project and not intended for trading or disposal. Hence in view of the unique nature of these investments, the carrying amount is considered to be the fair value.
Discounted cash flow technique- The valuation model considers the present value of expected payment, discounted using a risk adjusted discount rate. The expected payment is determined by considering the possible scenarios of forecast revenue and EBITDA, the amount to be paid under each scenario and the probability of each scenario
Risk adjusted discount rate - 25% (31-Mar-18 & 31-Mar-17) Expected sales growth -5% (31-Mar-18 & 31-Mar-17)
The estimated fair value would increase / (decrease) if risk adjusted discount rate were lower / (higher) and expected sales growth were higher / (lower)
Derivative Financial Liability towards issued debentures
Present value of embedded derivative, being the expected redemption premium payable on NCDs issued, discounted using a risk adjusted discount rate, based on FIMMDA rates of similar instruments as determined by Valuation experts. As per terms of issue, the redemption premium is calculated using an agreed formula on the basis of expected weighted average selling price (WASP) to be achieved in certain identified projects. WASP is estimated by considering the possible scenarios of Sales and pricing trends over the project period.
(1) Risk adjusted discount rate - 9.96 % (31 March 18) and 10.50 % (31 March 17)
2) Expected WASP Rs.25,524 per sq. feet (31 March 18 & 31 March 17)
(1) The estimated fair value would increase/ (decrease) if risk adjusted discount rate were lower / (higher) and expected sales growth were higher / (lower)
(2) The estimated fair value would increase / (decrease) if expected WASP were higher/ (lower)
There have been no transfers between Level 1 and 2 during the year.
F Reconciliation of Level 3 fair values
The following table shows a reconciliation from the opening balances to the closing balances for Level 3 fair values for assets. (` in Crores)
Particulars Investments Non Current LoansOpening Balance (1 April 2016) 371.46 342.44 Net change in fair value due to unwinding of discount - 1.69 Net change in fair value (unrealised) (13.96) - Net amount lent during the year - (67.88)Purchase of Investment 2.11 - Net proceeds from sale of investments (3.16) - Adjustment due to merger (112.89) - Closing Balance (31 March 2017) 243.56 276.25 Opening Balance (1 April 2017) 243.56 276.25 Net change in fair value due to unwinding of discount - 1.96 Net change in fair value (unrealised) (0.41) -

186 Peninsula Land Limited
Financial Statements
Notes forming part of the Consolidated Financial Statements
(` in Crores)Particulars Investments Non Current LoansNet amount lent during the year - (63.88)Purchase of Investment - - Net proceeds from sale of investments (18.36) - Adjustment due to associate becoming subsidiary (144.35) - Adjustment due to investment held for sale (0.18)Closing Balance (31 March 2018) 80.26 214.33
The following table shows a reconciliation from the opening balances to the closing balances for Level 3 fair values for liabilities - Derivative Financial Liability.
(` in Crores)Particulars 31-Mar-18 31-Mar-17Balance as at beginning of the year 135.78 - Change in fair value (10.73) 135.78 Balance as at end of the year 125.05 135.78
G Sensitivity Analysis
For the fair values of non-current investments and long term loans and advances, reasonably possible changes at the reporting date to one of the significant unobservable inputs, holding other inputs constant, would have the following effects.
(` in Crores)Particulars 31-Mar-18
Profit or Loss 31-Mar-17
Profit or Loss Increase Decrease Increase Decrease
Non-current Loans Risk adjusted discount rate (100 bps movement) 0.08 (0.08) 0.07 (0.07)InvestmentsRisk adjusted discount rate (100 bps movement) (1.25) 1.25 (0.56) 0.56
H Risk Management Framework
The Holding Company's Board of Directors has overall responsibility for the establishment and oversight of the Group’s risk management framework. The Board of Directors has established the Risk Management Committee, which is responsible for developing and monitoring the Group’s risk management policies. The Committee reports regularly to the Board of Directors on its activities.
The Group’s risk management policies are established to identify and analyse the risks faced by the Group, to set appropriate risk limits and controls and to monitor risks and adherence to limits. Risk management policies and systems are reviewed regularly to reflect changes in market conditions and the Group’s activities. The Group, through its training and management standards and procedures, aims to maintain a disciplined and constructive control environment in which all employees understand their roles and obligations.
a Credit Risk
Credit risk is the risk of financial loss to the Group if a customer or counterparty to a financial instrument fails to meet its contractual obligations, and arises principally from the Group’s receivables from customers, loans and investment in debt securities. Credit risk is managed through credit approvals, establishing credit limits and continuously monitoring the creditworthiness of customers to which the Group grants credit terms in the normal course of business. The Group establishes an allowance for doubtful debts and impairment that represents its estimate of incurred losses in respect of trade and other receivables and investments and loans.
The Group’s maximum exposure to credit risk is the carrying value of each class of financial assets.
i Trade and Other Receivables
Customer credit risk for realty sales is managed by entering into sale agreements in the case of sale of under-construction flats/premises which stipulate construction milestone based payments and interest clauses in case of delays and also

187Annual Report 2017-18
Built for challenges. Preparing for growth.
Notes forming part of the Consolidated Financial Statements
by requiring customers to pay the total agreed sale value before handover of possession of the premises/flats, thereby substantially eliminating the Group's credit risk in this respect. In the case of sale of finished units, sale agreements are executed only upon/against full payment.
Credit risk on trade receivables in respect of realty rentals is limited as the customers of the Group mainly consists of Government authorities / Group Companies. Based on the past history of payments received, there have been no defaults.
Credit risk on trade receivables in respect of other operating income is Nil since the terms of payment are 100% through advance billing and collections.
Impairment
Ageing of trade and other receivables that were not impaired was as follows.
(` in Crores)Particulars 31-Mar-18 31-Mar-17 Neither past due nor impaired - 15.37 Past due but not impaired - -Past due 1–180 days 92.48 15.33 Past due more than 180 days 22.17 18.27 Total 114.65 48.97
Expected credit loss assessment for customers as at 31 March 2018 and 31 March 2017:
Exposures to customers outstanding at the end of each reporting period are reviewed by the Group to determine incurred and expected credit losses. Historical trends of impairment of trade receivables do not reflect any significant credit losses. Given that the macro economic indicators affecting customers of the Group have not undergone any substantial change, the Group expects the historical trend of minimal credit losses to continue. Further, Management believes that the unimpaired amounts that are past due by more than 30 days are still collectible in full, based on historical payment behaviour and extensive analysis of customer credit risk. In view of the above, the Group believes that no provision is required as per expected credit loss method.
The movement in the allowance for impairment in respect of trade and other receivables during the year was as follows.
(` in Crores)Particulars 31-Mar-18 31-Mar-17Balance as at beginning of the year 1.32 1.37 Impairment loss recognised / (provision written back) - (0.05)Provision for receivables impairment 2.88 - Balance as at end of the year 4.20 1.32
ii Loans and Financial Guarantees
The loans and advances are in the nature of advances for project in SPVs where the Group is a stakeholder and hence the risk is minimal. Based on the above factors and historical data, loss on collection of receivables is not material and hence no additional provision was made apart from provisions for impairment in respect of certain specific loans based on the fair valuation by independent valuers.
(` in Crores)Particulars 31-Mar-18 31-Mar-17
Loans (Current and Non Current) 295.72 396.90
The movement in the allowance for impairment in respect of loans and financial guarantees during the year was as follows.
(` in Crores)Particulars 31-Mar-18 31-Mar-17Balance as at beginning of the year 37.26 - Impairment loss recognised 91.20 37.26 Amounts written off - - Balance as at end of the year 128.46 37.26

188 Peninsula Land Limited
Financial Statements
Notes forming part of the Consolidated Financial Statements
Outstanding Financial Guarantees
(` in Crores)Particulars 31-Mar-18 31-Mar-17
Truewin Realty Limited 80.00 80.00
Expected credit loss assessment of loans as at 31 March 2018 and 31 March 2017:
Considering the nature of the business, the Group has a policy to provide loans and financial guarantees to its group entities for undertaking projects, based on its primary business model of undertaking project developments through SPV's. The loans given to these entities are repayable on demand and there is no past history for any default / delay / irregularity / invocation of guarantees in repayments based on demands made. Moreover, all the group entities to whom loans have been advanced, have substantial potential in the projects to repay the loan based on the valuation of such entities and their activities are controlled and managed by the Group. Accordingly, in view of such control over operations and underlying security of the project / assets, these loans are considered adequately secured for repayments, except in cases where the independent valuation of underlying projects warrant provision for impairment. .
iii Investments measured at amortised cost
The Group has investments in secured redeemable non convertible debentures and the settlement of such instruments is linked to the completion of the respective underlying projects. Further these instruments are secured by way of first charge on the underlying project assets. Moreover, there are no deviations / irregularity in terms of servicing of debt and interest in respect of these instruments. Hence no impairment has been recognised on such investments till date.
iv Cash and Cash Equivalents
The Group held cash and bank balances with credit worthy banks of Rs 95.00 crores at March 31, 2018 (March 31, 2017: Rs 129.21 crores). The credit risk on cash & cash equivalents and other bank balances is limited as the group generally invests in deposits with banks where credit risk is largely perceived to be extremely insignificant.
b Liquidity Risk
Liquidity risk is the risk that the Group will encounter difficulty in meeting the obligations associated with its financial liabilities that are settled by delivering cash or another financial asset. The Group’s approach to managing liquidity is to ensure, as far as possible, that it will have sufficient liquidity to meet its liabilities when they are due, under both normal and stressed conditions, without incurring unacceptable losses or risking damage to the Group’s reputation.
Management monitors rolling forecasts of the Group’s liquidity position on the basis of expected cash flows. The Group manages its liquidity risk by preparing monthly cash flow projections to monitor liquidity requirements. In addition, the Group projects cash flows and considering the level of liquid assets necessary to meet these, monitoring the Balance Sheet liquidity ratios against internal and external regulatory requirements and maintaining debt financing plans.
i Financing Arrangements
The Group has access to the following undrawn borrowing facilities at the end of the reporting period
(` in Crores)
Particulars 31-Mar-18 31-Mar-17
Floating Rate Instruments
Expiring within one year (bank overdraft and other facilities) - -
Expiring beyond one year (loans from bank and FI) 79.00 16.90
The bank overdraft facility may be drawn at any time and may be terminated by the Bank without notice, subject to the continuance of satisfactory credit ratings, the bank loan facilities may be drawn at any time and have maturity period from 3 to 5 years.
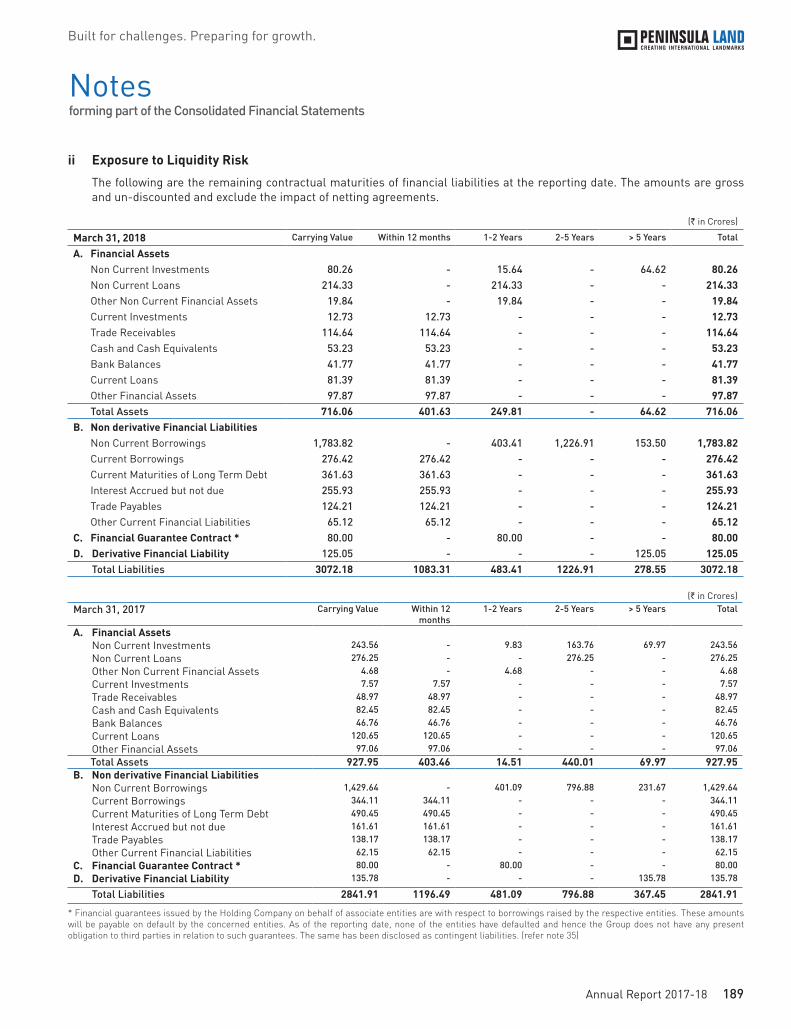
189Annual Report 2017-18
Built for challenges. Preparing for growth.
Notes forming part of the Consolidated Financial Statements
ii Exposure to Liquidity Risk
The following are the remaining contractual maturities of financial liabilities at the reporting date. The amounts are gross and un-discounted and exclude the impact of netting agreements.
(` in Crores)
March 31, 2018 Carrying Value Within 12 months 1-2 Years 2-5 Years > 5 Years Total
A. Financial Assets Non Current Investments 80.26 - 15.64 - 64.62 80.26 Non Current Loans 214.33 - 214.33 - - 214.33 Other Non Current Financial Assets 19.84 - 19.84 - - 19.84 Current Investments 12.73 12.73 - - - 12.73 Trade Receivables 114.64 114.64 - - - 114.64 Cash and Cash Equivalents 53.23 53.23 - - - 53.23 Bank Balances 41.77 41.77 - - - 41.77 Current Loans 81.39 81.39 - - - 81.39 Other Financial Assets 97.87 97.87 - - - 97.87 Total Assets 716.06 401.63 249.81 - 64.62 716.06B. Non derivative Financial Liabilities Non Current Borrowings 1,783.82 - 403.41 1,226.91 153.50 1,783.82 Current Borrowings 276.42 276.42 - - - 276.42 Current Maturities of Long Term Debt 361.63 361.63 - - - 361.63 Interest Accrued but not due 255.93 255.93 - - - 255.93 Trade Payables 124.21 124.21 - - - 124.21 Other Current Financial Liabilities 65.12 65.12 - - - 65.12 C. Financial Guarantee Contract * 80.00 - 80.00 - - 80.00 D. Derivative Financial Liability 125.05 - - - 125.05 125.05 Total Liabilities 3072.18 1083.31 483.41 1226.91 278.55 3072.18
(` in Crores)March 31, 2017 Carrying Value Within 12
months 1-2 Years 2-5 Years > 5 Years Total
A. Financial Assets Non Current Investments 243.56 - 9.83 163.76 69.97 243.56 Non Current Loans 276.25 - - 276.25 - 276.25 Other Non Current Financial Assets 4.68 - 4.68 - - 4.68 Current Investments 7.57 7.57 - - - 7.57 Trade Receivables 48.97 48.97 - - - 48.97 Cash and Cash Equivalents 82.45 82.45 - - - 82.45 Bank Balances 46.76 46.76 - - - 46.76 Current Loans 120.65 120.65 - - - 120.65 Other Financial Assets 97.06 97.06 - - - 97.06 Total Assets 927.95 403.46 14.51 440.01 69.97 927.95B. Non derivative Financial Liabilities Non Current Borrowings 1,429.64 - 401.09 796.88 231.67 1,429.64 Current Borrowings 344.11 344.11 - - - 344.11 Current Maturities of Long Term Debt 490.45 490.45 - - - 490.45 Interest Accrued but not due 161.61 161.61 - - - 161.61 Trade Payables 138.17 138.17 - - - 138.17 Other Current Financial Liabilities 62.15 62.15 - - - 62.15 C. Financial Guarantee Contract * 80.00 - 80.00 - - 80.00 D. Derivative Financial Liability 135.78 - - - 135.78 135.78
Total Liabilities 2841.91 1196.49 481.09 796.88 367.45 2841.91
* Financial guarantees issued by the Holding Company on behalf of associate entities are with respect to borrowings raised by the respective entities. These amounts will be payable on default by the concerned entities. As of the reporting date, none of the entities have defaulted and hence the Group does not have any present obligation to third parties in relation to such guarantees. The same has been disclosed as contingent liabilities. (refer note 35)
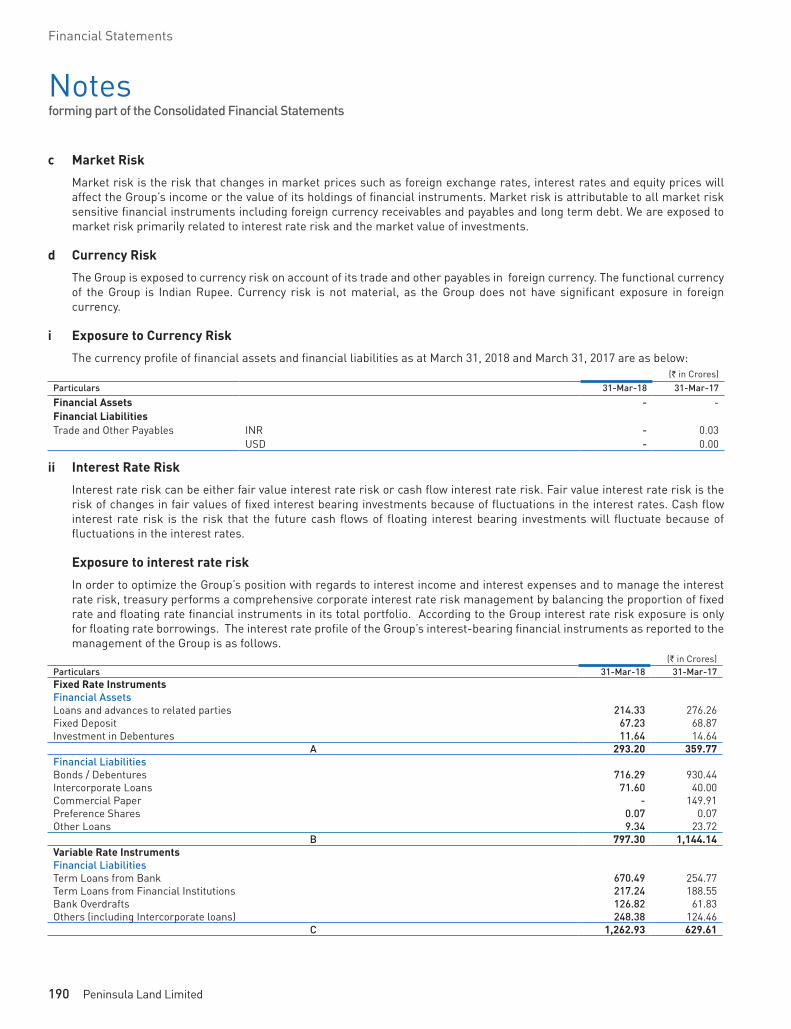
190 Peninsula Land Limited
Financial Statements
Notes forming part of the Consolidated Financial Statements
c Market Risk
Market risk is the risk that changes in market prices such as foreign exchange rates, interest rates and equity prices will affect the Group’s income or the value of its holdings of financial instruments. Market risk is attributable to all market risk sensitive financial instruments including foreign currency receivables and payables and long term debt. We are exposed to market risk primarily related to interest rate risk and the market value of investments.
d Currency Risk
The Group is exposed to currency risk on account of its trade and other payables in foreign currency. The functional currency of the Group is Indian Rupee. Currency risk is not material, as the Group does not have significant exposure in foreign currency.
i Exposure to Currency Risk
The currency profile of financial assets and financial liabilities as at March 31, 2018 and March 31, 2017 are as below: (` in Crores)
Particulars 31-Mar-18 31-Mar-17
Financial Assets - - Financial LiabilitiesTrade and Other Payables INR - 0.03
USD - 0.00
ii Interest Rate Risk
Interest rate risk can be either fair value interest rate risk or cash flow interest rate risk. Fair value interest rate risk is the risk of changes in fair values of fixed interest bearing investments because of fluctuations in the interest rates. Cash flow interest rate risk is the risk that the future cash flows of floating interest bearing investments will fluctuate because of fluctuations in the interest rates.
Exposure to interest rate risk
In order to optimize the Group’s position with regards to interest income and interest expenses and to manage the interest rate risk, treasury performs a comprehensive corporate interest rate risk management by balancing the proportion of fixed rate and floating rate financial instruments in its total portfolio. According to the Group interest rate risk exposure is only for floating rate borrowings. The interest rate profile of the Group’s interest-bearing financial instruments as reported to the management of the Group is as follows.
(` in Crores)Particulars 31-Mar-18 31-Mar-17Fixed Rate InstrumentsFinancial AssetsLoans and advances to related parties 214.33 276.26 Fixed Deposit 67.23 68.87 Investment in Debentures 11.64 14.64
A 293.20 359.77 Financial LiabilitiesBonds / Debentures 716.29 930.44 Intercorporate Loans 71.60 40.00 Commercial Paper - 149.91 Preference Shares 0.07 0.07 Other Loans 9.34 23.72
B 797.30 1,144.14 Variable Rate InstrumentsFinancial LiabilitiesTerm Loans from Bank 670.49 254.77 Term Loans from Financial Institutions 217.24 188.55 Bank Overdrafts 126.82 61.83 Others (including Intercorporate loans) 248.38 124.46
C 1,262.93 629.61

191Annual Report 2017-18
Built for challenges. Preparing for growth.
Notes forming part of the Consolidated Financial Statements
iii Price Risk
Price risk is the risk that the fair value of a financial instrument will fluctuate due to changes in market traded price. It arises from financial assets such as investments in quoted instruments and units of mutual funds.
a Fair value sensitivity analysis for fixed-rate instruments
The Group does not account for any fixed rate financial assets or financial liabilities at fair value through Profit or Loss. Therefore, a change in interest rates at the reporting date would not affect Statement of Profit and Loss.
b Cash flow sensitivity analysis for variable-rate instruments
A reasonably possible change of 100 basis points in interest rates at the reporting date would have increased (decreased) equity and profit or loss by the amounts shown below. This analysis assumes that all other variables remain constant.
(` in Crores)Particulars 31-Mar-18
Profit or Loss 31-Mar-17
Profit or Loss Increase Decrease Increase Decrease
Variable-rate instrumentsTerm loans from bank 6.32 (6.32) 1.77 (1.77)Term loans from financial institution 1.49 (1.49) 3.38 (3.38)Others 2.24 (2.24) 1.09 (1.09)Bank overdrafts 1.54 (1.54) 0.81 (0.81)
35 Commitments and Contingent Liabilities (` in Crores)
As at 31-Mar-18
As at 31-Mar-17
a Capital Commitments 0.07 0.07 b Claims against the Group not acknowledged as debts in respect of(i) Income tax demand under appeal (excluding contingent interest) 49.69 0.85 (ii) VAT demand under appeal 49.77 49.77 (iii) Disputed service tax demand 0.64 0.64 (iv) Disputed claims relating to certain projects (excluding interest and penalties) 14.59 13.06 c Guarantees given to Financial Institutions for(i) Associates 80.00 80.00
36 Revenue From Operations (` in Crores)
Year Ended 31-Mar-18
Year Ended 31-Mar-17
a Sale of ProductsRealty Sales 604.99 228.98
b Sale of ServicesRental Income from Investment Property 31.84 31.25 Other Rental Income 4.88 5.04
c Other Operating Income 16.20 4.47 Total 657.91 269.74
37 Payment to auditors (excluding taxes) (` in Crores)
Year Ended 31-Mar-18
Year Ended 31-Mar-17
As auditor:a Audit fees 0.40 0.40 b Tax audit fees 0.06 0.08 c Limited review 0.14 0.05
In other capacity:d Other services (certification fee) 0.05 0.05 e Reimbursement of expenses 0.01 0.01
Total 0.66 0.60

192 Peninsula Land Limited
Financial Statements
Notes forming part of the Consolidated Financial Statements
38 Borrowing Cost (` in Crores)
Year Ended 31-Mar-18
Year Ended 31-Mar-17
Borrowing Cost treated as project cost during the year 170.94 224.27
39 Employee Benefit Plans The Group has various benefit plans as under:
A Defined Contribution Plan
The Group makes contributions towards provident fund, superannuation fund and other retirement benefit plans for qualifying employees. Under the plans, the Group is required to contribute a specified percentage of payroll cost to the retirement benefit plan to fund the benefits. The contributions payable to these plans by the Group are at rates specified in the rules of the schemes.
The Group has recognised the following amounts in Statement of profit and loss included in Contributions to Provident Fund and Other funds under Employee Benefit Expenses (refer note 31)
(` in Crores)
Year Ended 31-Mar-18
Year Ended 31-Mar-17
Employer's contribution to Provident Fund* 2.03 2.21 Employer's contribution to Superannuation Fund 0.21 0.24 Employer's contribution to Employees State Insurance Corporation and Other Funds 0.02 0.01
* excludes ` 0.09 crores (31 March 2017 - ` 0.03 crores) which has been included in project cost
B Defined Benefit Plans and Other Long Term Employee Benefits
i The Group makes annual contributions to the Group Gratuity cum Life Assurance Schemes administered by the LIC of India, a funded defined benefit plan for qualifying employees. The scheme provides for payment as under:
a On normal retirement / early retirement / withdrawal / resignation - As per the provisions of the Payment of Gratuity Act, 1972 with vesting period of 5 years of service.
b On death in service - As per the provisions of the Payment of Gratuity Act, 1972 without any vesting period.
The most recent actuarial valuation of plan assets and the present value of the defined benefit obligation for gratuity were carried out as at March 31, 2018. The present value of the defined benefit obligations and the related current service cost and past service cost, were measured using the Projected Unit Credit Method.
Based on the actuarial valuation obtained in this respect, the following table sets out the status of the gratuity plan and the amounts recognised in the Group’s consolidated financial statements as at Balance Sheet date:
ii Amounts recognised in balance sheet (` in Crores)
31-Mar-18 31-Mar-17
Present value of defined benefit obligation at the end of the year 8.06 4.10 Fair value of plan assets at the end of the year 3.01 3.99 Net defined benefit liability / (asset) recognised in the balance sheet 5.05 0.11
iii Changes in present value of defined benefit obligationsAt the beginning of the year 4.10 3.78 Transfer in / (out) obligation (0.05) - Interest cost 0.26 0.27 Service cost 0.73 0.67 Re-measurement (gain) / loss (0.07) (0.12)Benefits paid (1.64) (2.81)Past service cost 4.73 2.31 At the end of the year 8.06 4.10

193Annual Report 2017-18
Built for challenges. Preparing for growth.
Notes forming part of the Consolidated Financial Statements
(` in Crores)31-Mar-18 31-Mar-17
iv Changes in fair value of plan assetsAt the beginning of the year 3.99 3.19 Expenses deducted from fund - (0.02)Interest income 0.28 0.25 Employer’s contribution (0.05) 3.43 Return on plan assets, excluding amount included in interest income 0.06 (0.05)Benefits paid (1.27) (2.81)At the end of the year 3.01 3.99
v Expenses recognised in the statement of profit and lossCurrent service cost 0.69 0.68 Past service cost and loss/(gain) on curtailments and settlement 5.24 2.32 Net interest cost (0.02) 0.02 Transfer to Work in Progress (0.03) (0.01)Expenses deducted from the fund - 0.02 Total expenses recognised in the statement of profit and loss 5.88 3.03
vi Expenses recognised in other comprehensive incomeRemeasurement gains/(losses) in OCIDue to change in financial assumptions (0.23) 0.23 Due to change in demographic assumptions - - Due to experience adjustments (0.35) (0.39)Return on plan assets excluding amounts included in interest income 0.06 0.05 Total expenses recognised in other comprehensive income (0.52) (0.11)
vii Classification of defined benefit obligationsCurrent liability 1.07 (0.04)Non current liability 3.98 0.15
viii The major categories of plan assets as a percentage of the fair value of the total
plan assets are as followsInvestment in insurance policy 100% 100%
ix Principal actuarial assumptionsDiscount rate 7.60% 7.20%
Salary escalation rate 7.00% 7.00%
Mortality rate Indian Assured
Lives Mortality (2006-08)
Indian Assured
Lives Mortality (2006-08)
Withdrawal rates 12% at younger
ages reducing to 1% at older
ages
12% at younger
ages reducing to 1% at older
agesRetirement age 60 years 60 years
x Sensitivity analysis
Reasonably possible changes at the reporting date to one of the relevant actuarial assumptions, holding other assumptions constant, would have affected the defined benefit obligation by the amounts shown below:
(` in Crores)31-Mar-18 31-Mar-17
Discount rate SensitivityIncrease by 0.5% 7.76 3.95 Decrease by 0.5% 8.33 4.27

194 Peninsula Land Limited
Financial Statements
Notes forming part of the Consolidated Financial Statements
(` in Crores)31-Mar-18 31-Mar-17
Salary growth rate SensitivityIncrease by 0.5% 8.33 4.21 Decrease by 0.5% 7.75 4.01 Withdrawal rate SensitivityIncrease by 0.5% 8.03 4.13 Decrease by 0.5% 8.03 4.06
The sensitivity analysis above have been determined based on a method that extrapolates the impact on defined benefit obligation as a result of reasonable changes in key assumptions occurring at the end of the reporting period.
xi Expected Future Cash Flows
The expected future cash flows in respect of defined benefit gratuity plan as at March 31, 2018 were as follows: (` in Crores)
31-Mar-18 31-Mar-17
Year 1 2.64 0.62 Year 2 0.34 0.33 Year 3 0.48 0.30 Year 4 0.31 0.38 Year 5 0.45 0.29 Year 6 to Year 10 2.35 1.72
C Other Long Term Employee Benefits
Compensated absences are payable to employees at the rate of daily salary for each day of accumulated leave on death or on resignation or upon retirement. The charge towards compensated absences for the year ended March 31, 2018 based on actuarial valuation using the Projected Unit Credit Method is ` 7.33 crores (March 31, 2017: ` 6.32 crores)
40 Related Party Disclosure
a Controlling Entity
(i) Ashok Piramal Group Real Estate Trust
b Key Management Personnel
(i) Ms. Urvi A. Piramal - Non Executive Chairperson (ii) Mr. Rajeev A. Piramal - Vice Chairman & Managing Director (iii) Mr. Mahesh S. Gupta - Group Managing Director (iv) Mr. Nandan A. Piramal - Whole-time Director (v) Ms. Bhavna G. Doshi - Independent Director (vi) Mr. Sudhindar K Khanna - Independent Director (vii) Lt Gen (Retd) Deepak Summanwar - Independent Director (viii) Mr. Bharat Sanghavi- Chief Financial Officer (ix) Mr. Rajashekar Reddy- Company Secretary
c Relatives of Key Management Personnel
(i) Mr. Harshvardhan A. Piramal - Son of Non Executive Chairperson (ii) Ms. Sunita Gupta - Spouse of Group Managing Director (iii) Ms. Kalpana Singhania - Sister of Non Executive Chairperson (iv) Mr Gautam Doshi - Spouse of Independent Director (v) Mr. Nishith Sanghavi - Son of Chief Finance Officer
d Associates (including step down associates)
(i) SEW Engineering (India) Private Limited (held for sale as at 31/03/2018) (ii) RA Realty Ventures LLP (iii) JM Realty Management Private Limited (held for sale as at 31/03/2018)

195Annual Report 2017-18
Built for challenges. Preparing for growth.
Notes forming part of the Consolidated Financial Statements
(iv) Goodhome Realty Limited (converted from step-down associate to subsidiary w.e.f 31/3/2018)(v) RR Mega City Builders Limited (converted from step-down associate to subsidiary w.e.f 31/3/2018)(vi) Truewin Realty Limited (converted from step-down associate to subsidiary w.e.f 31/3/2018)(vii) Rockfirst Real Estate Limited (converted from associate to subsidiary w.e.f 31/3/2018)
e Joint Ventures (including step down joint ventures)
(i) Bridgeview Real Estate Development LLP (ii) HEM Infrastructure and Property Developers Private Limited (iii) HEM Bhattad AOP (iv) Peninsula Brookfield Trustee Private Limited (v) PenBrook Capital Advisors Private Limited
(formerly known as Peninsula Brookfield Investment Managers Private Limited)(vi) Topvalue Real Estate Development Private Limited (converted from joint venture to step down subsidiary w.e.f.
31/03/2017)
f Entities where Key Management Personnel / their relatives exercise significant influence
(i) Ashok Piramal Management Corporation Limited (ii) Freedom Registry Limited (iii) Morarjee Textiles Limited (iv) Thundercloud Technologies (India) Private Limited (v) Peninsula SA Realty Private Limited (vi) Peninsula Townships Development Private Limited (vii) Ashok Piramal Mega City Development Private Limited (viii) Ashok Piramal Mega Properties Private Limited (ix) Ashok Piramal Township Development Private Limited (x) Goldlife Mercantile Company Private Limited (xi) Topvalue Brokers Private Limited (xii) Piramal Land Private Limited (xiii) Highway Concessions One Private Limited (xiv) Miranda Bi-Metal Tools Private Limited (xv) PMP Auto Components Private Limited (xvi) Powerjet Carriers and Transporters Private Limited (xvii) Delta Corp Limited (xviii) Peninsula Land Limited ESOP Trust (xix) Urvi Ashok Piramal Foundation (xx) Morarjee Goculdas Spinning & Weaving Company Limited Senior ESOP Trust
(through its trustees Mrs Urvi A Piramal and Mr Mahesh S Gupta) (xxi) Peninsula Realty Fund (became subsidiary from 31/3/2018) (xxii) Peninsula Brookfield India Real Estate Fund (xxiii) APG Infrastructure Private Limited (xxiv) Delta Adventure and Entertainment Private Limited (xxv) Bridgepoint Learning Private Limited (xxvi) Integra Garments and Textiles Limited (xxvii) Peninsula Sports Club Private Limited (xxviii) Antarctica Trading Company Private Limited (xxix) Shobla Hydro Power Private Limited (xxx) Anjoss Trading Private Limited
g Co-venturers and Investing parties in JVs / Subsidiaries and Associates and their Relatives.
(i) Jayem Properties Private Limited (ii) Javed Tapia (iii) Azim Tapia (iv) Primary Debt Investments (v) Gray Investments Private Limited (vi) Clover Holding and Investment Private Limited

196 Peninsula Land Limited
Financial Statements
Notes forming part of the Consolidated Financial Statements
41 Related Party Disclosure as per Regulation 34 (3) of the SEBI (Listing Obligations and Disclosure Requirements) Regulations, 2015 Loans and Advances to Associates, Joint Ventures and Entities where Key Management Personnel / their relatives exercise
significant influence
(Repayment schedule not given as these are repayable on demand and interest free except as stated otherwise) (` in Crores)
Particulars As at 31-Mar-18
As at 31-Mar-17
Maximum Outstanding during the year31-Mar-18 31-Mar-17
A Associates including step down Associates(i) RA Realty Ventures LLP 133.45 196.76 201.16 269.68 (ii) JM Realty Management Private Limited - 12.33 5.73 12.33 (iii) Goodhome Realty Limited
(converted from step-down associate to subsidiary w.e.f 31/3/2018) - 4.76 - 4.76
(iv) RR Megacity Builders Limited (converted from step-down associate to subsidiary w.e.f 31/3/2018)
- 0.51 - 2.99
(v) Rockfirst Real Estate Limited (converted from associate to subsidiary w.e.f 31/3/2018)
- 21.38 - 56.35
(vi) Truewin Realty Limited (converted from step-down associate to subsidiary w.e.f 31/3/2018)
- 0.03 - 1.96
Total (a) 133.45 235.77 B Joint Ventures(i) Bridgeview Real Estate Development LLP 78.82 74.37 78.82 75.26 (ii) Hem Infrastructure and Property Developers Private Limited 0.00 0.00 0.00 0.00 (iii) HEM Bhattad AOP 15.00 15.00 15.00 15.00
Total (b) 93.82 89.37 C Entities where Key Management Personnel / their relatives
exercise significant influence(i) Peninsula Townships Development Private Limited 0.01 0.01 0.01 0.01 (ii) Ashok Piramal Mega City Development Private Limited 0.01 0.01 0.01 0.01 (iii) Peninsula SA Realty Private Limited 0.01 0.01 0.01 0.01 (iv) Ashok Piramal Mega Properties Private Limited 0.01 0.01 0.01 0.01 (v) Thundercloud Technologies (India) Private Limited - - - 0.01
Total (c) 0.04 0.04 D Co-venturers / investing parties in JVs / Subsidiaries and
Associates and their relatives(i) Jayem Properties Private Limited 0.04 - 0.04 -
Total (d) 0.04 - Grand Total (a+b+c+d) 227.35 325.18

197Annual Report 2017-18
Built for challenges. Preparing for growth.
Notes forming part of the Consolidated Financial Statements
DET
AILS
OF
REL
ATED
PAR
TY T
RAN
SACT
ION
S :
(` in
Cro
res)
Nam
es of
Rel
ated
Pa
rties
/ Nat
ure o
f Tra
ns-
actio
ns
Perio
dRe
nt
Inco
me
PMC
Fee
Inco
me
Purc
h of
Go
ods /
Se
rvice
s
Dona
tions
gi
ven
Loan
s gi
ven
toLo
an
repa
id by
Loan
s ta
ken
from
Loan
s re
paid
toIn
tere
st
inco
me
Inte
rest
ex
pens
eEx
ps to
be
reim
-bu
rsed
fro
m
Exps
to
be re
im-
burs
ed to
Inve
st-
men
t in
Equi
ty
Rem
u-ne
ratio
nDi
viden
d Pa
idIm
pair -
men
t of
dues
Fair
Valu
atio
n Ga
in/
(Los
s)
Secu
rity /
Gu
ar-
ante
es
give
n to
Secu
rity /
Gu
ar-
ante
es
rele
ased
by
Secu
rity /
Gu
ar-
ante
es
take
n fro
m Se
curit
y /
Guar
-an
tees
re
leas
ed
to
Rede
mp-
tion
of
Inve
st-
men
ts
A
Cont
rolli
ng E
ntity
1 A
shok
Pira
mal
Gr
oup
Real
Est
ate
Trus
t
2017
-18
-
-
-
-
-
-
-
-
-
-
-
-
-
-
-
-
-
-
- 1
00.0
0 -
-
20
16-1
7 -
-
-
-
-
-
-
-
-
-
-
-
-
-
2
.98
-
-
-
-
-
-
-
B
Ass
ocia
tes
1SE
W E
ngin
eerin
g (In
dia)
Priv
ate
Lim
ited
2017
-18
-
-
-
-
-
-
-
-
-
-
-
-
-
-
-
-
-
-
-
-
-
-
2016
-17
-
-
4.9
4 -
-
-
-
-
-
-
-
-
-
-
-
-
-
-
-
-
-
-
2RA
Rea
lty V
entu
res
LLP
2017
-18
-
-
-
-
5.0
0 -
-
-
2
3.99
-
1
.12
-
-
-
-
91.
50
-
-
-
-
-
-
2016
-17
-
-
-
-
6.0
0 1
03.4
0 -
-
2
9.45
-
1
.14
-
-
-
-
-
-
- 1
20.0
0 -
-
-
3
Rock
first
Rea
l Es
tate
lim
ited
2017
-18
-
-
-
-
25.
84
22.
04
-
-
-
-
0.2
7 -
-
-
-
5
.57
-
-
-
-
-
-
2016
-17
-
-
-
-
17.
58
-
-
-
-
-
0.6
3 -
-
-
-
3
5.00
-
-
-
-
-
-
4
JM R
ealty
M
anag
emen
t Pr
ivate
Lim
ited
2017
-18
-
-
-
-
-
6.6
2 -
-
0
.89
-
-
-
-
-
-
-
-
-
-
-
-
-
2016
-17
-
-
-
-
-
-
-
-
1.6
9 -
-
-
-
-
-
-
-
-
-
-
-
-
C
Step
Dow
n As
soci
ates
1 G
oodh
ome
Real
ty
Lim
ited
2017
-18
-
-
-
-
2.1
2 0
.77
-
-
1.3
2 -
2
.88
-
-
-
-
-
(9.6
5) -
-
-
-
-
20
16-1
7 -
-
-
-
3
.71
-
-
-
0.4
7 -
2
.04
-
-
-
-
-
2.9
8 -
-
-
-
-
2
RR
Meg
a Ci
ty
Build
ers
Lim
ited
2017
-18
-
-
-
-
6.6
1 7
.38
24.
01
24.
52
-
0.5
6 -
-
-
-
-
-
(2
.60)
-
-
-
-
-
2016
-17
0.0
5 -
-
-
3
.34
3.6
0 -
-
0
.51
-
2.3
3 -
-
-
-
-
(17
.03)
-
-
-
-
-
3 T
ruew
in R
ealty
Li
mite
d 20
17-1
8 -
-
-
-
9
.96
-
-
-
-
-
1.1
3 -
-
-
-
1
1.09
-
-
-
-
-
-
20
16-1
7 -
-
-
-
0
.66
-
-
-
-
-
1.5
8 -
-
-
-
3
.46
(4.1
6) 8
0.00
-
-
-
-
D
Co
mpa
nies
w
here
KM
P /
rela
tives
exe
rcis
e si
gnifi
cant
in
fluen
ce
1As
hok
Pira
mal
M
anag
emen
t Co
rpor
atio
n Li
mite
d
2017
-18
-
-
4.0
0 -
-
-
-
-
-
-
-
0
.01
-
-
-
-
-
-
-
-
-
-
2016
-17
-
-
8.2
8 -
-
-
-
-
-
-
-
0
.01
-
-
-
-
-
-
-
-
-
-
2Fr
eedo
m R
egis
try
Lim
ited
2017
-18
-
-
0.0
7 -
-
-
-
-
-
-
-
-
-
-
-
-
-
-
-
-
-
-
20
16-1
7 -
-
0
.09
-
-
-
-
-
-
-
-
-
-
-
-
-
-
-
-
-
-
-
3M
orar
jee
Text
iles
Lim
ited
2017
-18
1.5
9 -
-
-
-
-
-
-
-
-
0
.41
-
-
-
-
-
-
-
-
-
-
-
2016
-17
1.4
8 -
-
-
-
-
-
-
-
-
0
.62
-
-
-
-
-
-
-
-
-
-
-
4Th
unde
rclo
ud
Tech
nolo
gies
(In
dia)
Priv
ate
Lim
ited
2017
-18
-
-
-
-
0.0
1 0
.01
-
-
-
-
-
-
-
-
-
-
-
-
-
-
-
-
2016
-17
-
-
-
-
0.0
1 0
.01
-
-
-
-
-
-
-
-
-
-
-
-
-
-
-
-
5Pe
nins
ula
SA
Real
ty P
rivat
e Li
mite
d
2017
-18
-
-
-
-
0.0
0 -
-
-
-
-
-
-
-
-
-
-
-
-
-
-
-
-
20
16-1
7 -
-
-
-
0
.01
-
-
-
-
-
-
-
-
-
-
-
-
-
-
-
-
-
6Pe
nins
ula
Tow
nshi
ps
Deve
lopm
ent
Priva
te L
imite
d
2017
-18
-
-
-
-
0.0
0 -
-
-
-
-
-
-
-
-
-
-
-
-
-
-
-
-
20
16-1
7 -
-
-
-
0
.01
-
-
-
-
-
-
-
-
-
-
-
-
-
-
-
-
-

198 Peninsula Land Limited
Financial Statements
Notes forming part of the Consolidated Financial Statements
(` in
Cro
res)
Nam
es of
Rel
ated
Pa
rties
/ Nat
ure o
f Tra
ns-
actio
ns
Perio
dRe
nt
Inco
me
PMC
Fee
Inco
me
Purc
h of
Go
ods /
Se
rvice
s
Dona
tions
gi
ven
Loan
s gi
ven
toLo
an
repa
id by
Loan
s ta
ken
from
Loan
s re
paid
toIn
tere
st
inco
me
Inte
rest
ex
pens
eEx
ps to
be
reim
-bu
rsed
fro
m
Exps
to
be re
im-
burs
ed to
Inve
st-
men
t in
Equi
ty
Rem
u-ne
ratio
nDi
viden
d Pa
idIm
pair -
men
t of
dues
Fair
Valu
atio
n Ga
in/
(Los
s)
Secu
rity /
Gu
ar-
ante
es
give
n to
Secu
rity /
Gu
ar-
ante
es
rele
ased
by
Secu
rity /
Gu
ar-
ante
es
take
n fro
m Se
curit
y /
Guar
-an
tees
re
leas
ed
to
Rede
mp-
tion
of
Inve
st-
men
ts
7As
hok
Pira
mal
M
ega
City
De
velo
pmen
t Pr
ivate
Lim
ited
2017
-18
-
-
-
-
-
-
-
-
-
-
-
-
-
-
-
-
-
-
-
-
-
-
2016
-17
-
-
-
-
0.0
1 -
-
-
-
-
-
-
-
-
-
-
-
-
-
-
-
-
8As
hok
Pira
mal
M
ega
Prop
ertie
s Pr
ivate
Lim
ited
2017
-18
-
-
-
-
-
-
-
-
-
-
-
-
-
-
-
-
-
-
-
-
-
-
2016
-17
-
-
-
-
0.0
1 -
-
-
-
-
-
-
-
-
-
-
-
-
-
-
-
-
9PM
P Au
to
Com
pone
nts
Priva
te L
imite
d
2017
-18
0.1
9 -
-
-
-
-
-
-
-
-
-
-
-
-
-
-
-
-
-
-
-
-
20
16-1
7 0
.14
-
-
-
-
-
-
-
-
-
0.0
6 -
-
-
-
-
-
-
-
-
-
-
10Po
wer
jet C
arrie
rs
and
Tran
spor
ters
Pr
ivate
Lim
ited
2017
-18
-
-
-
-
-
-
-
-
-
-
-
-
-
-
-
-
-
-
-
-
-
-
2016
-17
-
-
-
-
-
-
-
-
-
-
-
-
-
-
0.0
0 -
-
-
-
-
-
-
11To
pval
ue B
roke
rs
Priva
te L
imite
d20
17-1
8 -
-
-
-
0
.00
0.0
0 -
-
-
-
-
-
-
-
-
-
-
-
-
-
-
-
20
16-1
7 -
-
-
-
-
-
-
-
-
-
-
-
-
-
-
-
-
-
-
-
-
-
12
Peni
nsul
a B
rook
field
Indi
a R
eal E
stat
e Fu
nd
2017
-18
0.1
0 -
-
-
-
-
-
-
-
-
0
.03
-
-
-
-
-
-
-
-
-
-
0.2
7 20
16-1
7 0
.12
-
-
-
-
-
-
-
-
-
0.2
2 -
0
.26
-
-
-
-
-
-
-
-
0.2
5
13Lo
gica
l Pri
vate
Li
mite
d20
17-1
8 -
-
-
-
-
-
0
.83
-
-
-
-
-
-
-
-
-
-
-
-
-
-
-
2016
-17
-
-
-
-
-
-
-
-
-
-
-
-
-
-
-
-
-
-
-
-
-
-
E
Join
t Ven
ture
1B
ridg
evie
w
Rea
l Est
ate
Dev
elop
men
t LL
P
2017
-18
-
-
-
-
4.6
4 8
.82
-
-
8.6
5 -
0
.94
-
-
-
-
-
-
-
-
-
-
-
2016
-17
-
-
-
-
15.
56
19.
10
-
-
8.5
1 -
1
.12
-
-
-
-
-
-
-
-
-
-
-
2To
pval
ue
Rea
l Est
ate
Dev
elop
men
t Pr
ivat
e Li
mite
d
2017
-18
-
-
-
-
-
-
-
-
-
-
-
-
-
-
-
-
-
-
-
-
-
-
2016
-17
-
-
-
-
17.
20
-
-
-
-
-
-
-
-
-
-
-
8.2
7 -
-
157
.00
53.
70
-
F
Step
Dow
n Jo
int
Vent
ures
1H
em
Infr
astr
uctu
re
and
Prop
erty
D
evel
oper
s Pr
ivat
e Li
mite
d
2017
-18
-
-
-
-
-
-
-
-
0.0
0 -
-
-
1
3.80
-
-
-
-
-
-
-
-
-
20
16-1
7 -
-
-
-
-
0
.00
-
-
0.0
0 -
-
-
-
-
-
-
-
-
-
-
-
-
2H
EM B
hatt
ad
AOP
2017
-18
- 1
6.07
-
-
-
-
-
-
-
-
-
-
-
-
-
-
-
-
-
-
-
-
20
16-1
7 -
-
-
-
-
-
-
-
-
-
-
-
-
-
-
-
-
-
-
-
-
-
3
PenB
rook
Cap
ital
Advi
sors
Pri
vate
Li
mite
d
2017
-18
-
-
-
-
-
-
-
-
-
-
0.0
0 -
-
-
-
-
-
-
-
-
-
-
20
16-1
7 -
-
-
-
-
-
-
-
-
-
-
-
-
-
-
-
-
-
-
-
-
-

199Annual Report 2017-18
Built for challenges. Preparing for growth.
Notes forming part of the Consolidated Financial Statements
(` in
Cro
res)
Nam
es of
Rel
ated
Pa
rties
/ Nat
ure o
f Tra
ns-
actio
ns
Perio
dRe
nt
Inco
me
PMC
Fee
Inco
me
Purc
h of
Go
ods /
Se
rvice
s
Dona
tions
gi
ven
Loan
s gi
ven
toLo
an
repa
id by
Loan
s ta
ken
from
Loan
s re
paid
toIn
tere
st
inco
me
Inte
rest
ex
pens
eEx
ps to
be
reim
-bu
rsed
fro
m
Exps
to
be re
im-
burs
ed to
Inve
st-
men
t in
Equi
ty
Rem
u-ne
ratio
nDi
viden
d Pa
idIm
pair -
men
t of
dues
Fair
Valu
atio
n Ga
in/
(Los
s)
Secu
rity /
Gu
ar-
ante
es
give
n to
Secu
rity /
Gu
ar-
ante
es
rele
ased
by
Secu
rity /
Gu
ar-
ante
es
take
n fro
m Se
curit
y /
Guar
-an
tees
re
leas
ed
to
Rede
mp-
tion
of
Inve
st-
men
ts
G
Ente
rpri
ses
whe
re K
ey
Man
agem
ent
Pers
onne
l /
thei
r re
lativ
es
exer
cise
si
gnifi
cant
in
flue
nce
1U
rvi A
shok
Pi
ram
al
Foun
datio
n
2017
-18
-
-
-
-
-
-
-
-
-
-
-
0.0
0 -
-
-
-
-
-
-
-
-
-
20
16-1
7 -
-
-
1
.65
-
-
-
-
-
-
-
-
-
-
-
-
-
-
-
-
-
-
2M
orar
jee
Goc
ulda
s Sp
inni
ng
& W
eavi
ng
Com
pany
Lim
ited
Seni
or E
SOP
Trus
t
2017
-18
-
-
-
-
-
-
-
-
-
-
-
-
-
-
-
-
-
-
-
-
-
-
2016
-17
-
-
-
-
-
-
-
-
-
-
-
-
-
-
0.0
2 -
-
-
-
-
-
-
3Pe
nins
ula
Rea
lty
Fund
2017
-18
0.0
4 -
-
-
-
-
-
-
-
-
0
.03
-
-
-
-
-
-
-
-
-
-
-
2016
-17
0.0
4 -
-
-
-
-
-
-
-
-
0
.35
-
-
-
-
-
-
-
-
-
-
-
H
Key
M
anag
emen
t Pe
rson
nel
1 M
r. R
ajee
v A.
Pi
ram
al20
17-1
8 -
-
-
-
-
-
-
-
-
-
0
.02
0.0
1 -
1
.21
-
-
-
-
-
- 1
00.0
0 -
20
16-1
7 -
-
-
-
-
-
-
-
-
-
-
-
-
1
.21
0.0
2 -
-
-
-
700
.00
90.
00
-
2M
r. N
anda
n A.
Pi
ram
al20
17-1
8 -
-
-
-
-
-
-
-
-
-
-
0
.00
-
1.0
0 -
-
-
-
-
-
-
-
20
16-1
7 -
-
-
-
-
-
-
-
-
-
-
-
-
0
.99
0.0
2 -
-
-
-
-
-
-
3
Mr.
Dee
pak
H
Sum
man
war
2017
-18
-
-
-
-
-
-
-
-
-
-
-
0.0
1 -
0
.04
-
-
-
-
-
-
-
-
2016
-17
-
-
-
-
-
-
-
-
-
-
-
-
-
0.0
3 -
-
-
-
-
-
-
-
4
Mr.
Mah
esh
S.
Gup
ta20
17-1
8 -
-
-
-
-
-
-
-
-
-
-
0
.00
-
1.4
9 -
-
-
-
-
-
-
-
20
16-1
7 -
-
-
-
-
-
-
-
-
-
-
-
-
1
.43
0.0
0 -
-
-
-
-
-
-
5
Mr.
Sudh
inda
r K
K
hann
a20
17-1
8 -
-
-
-
-
-
-
-
-
-
-
-
-
0
.01
-
-
-
-
-
-
-
-
2016
-17
-
-
-
-
-
-
-
-
-
-
-
-
-
0.0
1 -
-
-
-
-
-
-
-
6
Ms.
Urv
i A.
Pira
mal
2017
-18
-
-
-
-
-
-
-
-
-
-
-
-
-
0.0
4 -
-
-
-
-
-
-
-
20
16-1
7 -
-
-
-
-
-
-
-
-
-
-
-
-
1
.57
0.0
6 -
-
-
-
-
-
-
7
Ms.
Bha
vna
G.
Dos
hi20
17-1
8 -
-
-
-
-
-
-
-
-
-
-
-
-
0
.04
-
-
-
-
-
-
-
-
2016
-17
-
-
-
-
-
-
-
-
-
-
-
-
-
0.0
3 0
.00
-
-
-
-
-
-
-
8M
rs. S
ajit
Rag
hava
Suv
arna
2017
-18
-
-
-
-
-
-
-
-
-
-
-
-
-
0.0
1 -
-
-
-
-
-
-
-
20
16-1
7 -
-
-
-
-
-
-
-
-
-
-
-
-
-
-
-
-
-
-
-
-
-
9
Mr.B
hara
t Sa
ngha
vi20
17-1
8 -
-
-
-
-
-
-
-
-
-
-
-
-
1
.13
-
-
-
-
-
-
-
-
2016
-17
-
-
-
-
-
-
-
-
-
-
-
-
-
0.9
5 0
.00
-
-
-
-
-
-
-
10M
r. R
ajas
heka
r R
eddy
2017
-18
-
-
-
-
-
-
-
-
-
-
-
-
-
0.5
6 -
-
-
-
-
-
-
-
20
16-1
7 -
-
-
-
-
-
-
-
-
-
-
-
-
0
.52
-
-
-
-
-
-
-
-
11M
r. Pr
adip
ta K
. M
ohap
atra
2017
-18
-
-
-
-
-
-
-
-
-
-
-
-
-
-
-
-
-
-
-
-
-
-
2016
-17
-
-
-
-
-
-
-
-
-
-
-
-
-
0.0
3 -
-
-
-
-
-
-
-
12
Mr.
Nar
endr
a An
eja
2017
-18
-
-
-
-
-
-
-
-
-
-
-
-
-
0.0
1 -
-
-
-
-
-
-
-
20
16-1
7 -
-
-
-
-
-
-
-
-
-
-
-
-
0
.00
-
-
-
-
-
-
-
-
13M
r. B
ahra
m V
akil
2017
-18
-
-
-
-
-
-
-
-
-
-
-
-
-
0.0
1 -
-
-
-
-
-
-
-
20
16-1
7 -
-
-
-
-
-
-
-
-
-
-
-
-
0
.00
-
-
-
-
-
-
-
-

200 Peninsula Land Limited
Financial Statements
Notes forming part of the Consolidated Financial Statements
(` in
Cro
res)
Nam
es of
Rel
ated
Pa
rties
/ Nat
ure o
f Tra
ns-
actio
ns
Perio
dRe
nt
Inco
me
PMC
Fee
Inco
me
Purc
h of
Go
ods /
Se
rvice
s
Dona
tions
gi
ven
Loan
s gi
ven
toLo
an
repa
id by
Loan
s ta
ken
from
Loan
s re
paid
toIn
tere
st
inco
me
Inte
rest
ex
pens
eEx
ps to
be
reim
-bu
rsed
fro
m
Exps
to
be re
im-
burs
ed to
Inve
st-
men
t in
Equi
ty
Rem
u-ne
ratio
nDi
viden
d Pa
idIm
pair -
men
t of
dues
Fair
Valu
atio
n Ga
in/
(Los
s)
Secu
rity /
Gu
ar-
ante
es
give
n to
Secu
rity /
Gu
ar-
ante
es
rele
ased
by
Secu
rity /
Gu
ar-
ante
es
take
n fro
m Se
curit
y /
Guar
-an
tees
re
leas
ed
to
Rede
mp-
tion
of
Inve
st-
men
ts
I R
elat
ives
of K
ey
Man
agem
ent
Pers
onne
l 1
Mr
Har
shva
rdha
n A
Pira
mal
2017
-18
-
-
-
-
-
-
-
-
-
-
-
-
-
-
-
-
-
-
-
-
-
-
2016
-17
-
-
-
-
-
-
-
-
-
-
-
-
-
-
0.0
2 -
-
-
-
-
-
-
2
Ms
Kal
pana
Si
ngha
nia
2017
-18
-
-
-
-
-
-
-
-
-
-
-
-
-
-
-
-
-
-
-
-
-
-
2016
-17
-
-
-
-
-
-
-
-
-
-
-
-
-
-
0.0
0 -
-
-
-
-
-
-
3
Mrs
Sun
ita G
upta
2017
-18
-
-
-
-
-
-
-
-
-
-
-
-
-
-
-
-
-
-
-
-
-
-
2016
-17
-
-
-
-
-
-
-
-
-
-
-
-
-
-
0.0
2 -
-
-
-
-
-
-
4
Mr.
Nis
hith
Sa
ngha
vi20
17-1
8 -
-
-
-
-
-
-
-
-
-
-
-
-
-
-
-
-
-
-
-
-
-
20
16-1
7 -
-
-
-
-
-
-
-
-
-
-
-
-
-
0
.00
-
-
-
-
-
-
-
J
Co-v
entu
rers
an
d in
vest
ing
part
ies
in J
Vs /
Susi
diar
ies
and
Asso
ciat
es a
nd
thei
r re
lativ
es
-
1Ja
yem
Pro
pert
ies
Priv
ate
Lim
ited
2017
-18
-
-
-
-
0.0
4 -
-
1
5.31
-
-
-
-
-
-
-
-
-
-
-
-
-
-
20
16-1
7 -
-
-
-
-
-
-
-
-
-
-
-
-
-
-
-
-
-
-
-
-
-
2
Prim
ary
Deb
t In
vest
men
ts20
17-1
8 -
-
-
-
-
-
-
-
-
4
3.95
-
-
-
-
-
-
-
-
-
-
-
-
20
16-1
7 -
-
-
-
-
-
-
-
-
4
1.96
-
-
-
-
-
-
-
-
-
-
-
-
3
Gra
y In
vest
men
ts
Priv
ate
Lim
ted
2017
-18
-
-
-
-
-
-
-
-
-
0.1
8 -
-
-
-
-
-
-
-
-
-
-
-
2016
-17
-
-
-
-
-
-
-
-
-
0.1
7 -
-
-
-
-
-
-
-
-
-
-
-

201Annual Report 2017-18
Built for challenges. Preparing for growth.
Notes forming part of the Consolidated Financial Statements
DET
AILS
OF
REL
ATED
PAR
TY T
RAN
SACT
ION
S -
OU
TSTA
ND
ING
BAL
ANCE
S :
(` in
Cro
res)
Nam
es o
f Rel
ated
Par
ties
/ O
utst
andi
ng b
alan
ces
As a
t A
MO
UN
T PA
YAB
LE T
OWAR
DS
AMO
UN
T R
ECEI
VAB
LE T
OWAR
DS
Pur
ch o
f G
oods
/ Se
rvic
es
from
Exp
s to
be
reim
burs
ed
to
Loa
ns
take
n (in
cl.
inte
rest
)
Sec
uriti
es
/ Gur
ante
es
take
n fr
om
Adv
ance
s fo
r pr
oper
ty
Sale
s of
G
oods
/ Se
rvic
es
Exps
to b
e re
imbu
rsed
fr
om
Loan
s gi
ven
(incl
. in
tere
st)
Deb
entu
res
& in
tere
st
ther
eon
Secu
ritie
s /
Gur
ante
es
give
n to
Adva
nce
agai
nst
serv
ices
/ su
pplie
s
A
Cont
roll
ing
Entit
y (i
) As
hok
Pira
mal
Gro
up R
eal
Esta
te T
rust
31-M
ar-1
8 -
-
-
1
00.0
0 -
-
-
-
-
-
-
31
-Mar
-17
-
-
-
-
-
-
-
-
-
-
-
B
Asso
ciat
es (i
) SE
W E
ngin
eeri
ng (I
ndia
) Pr
ivat
e Li
mite
d31
-Mar
-18
-
-
-
-
-
-
-
-
-
-
-
31-M
ar-1
7 1
.41
-
-
-
-
-
-
-
-
-
(ii)
RA
Rea
lty V
entu
res
LLP
31-M
ar-1
8 -
-
-
-
-
-
1
.12
133
.45
-
-
-
31-M
ar-1
7 -
-
-
-
-
-
-
1
96.1
6 -
-
-
(i
ii)
Roc
kfirs
t Rea
l Est
ate
Lim
ited
31-M
ar-1
8 -
-
-
-
-
-
-
-
-
-
-
31
-Mar
-17
-
-
-
-
-
-
1.7
9 2
1.38
-
-
-
C
St
ep D
own
Asso
ciat
es1
Goo
dhom
e R
ealty
Lim
ited
31-M
ar-1
8 -
-
-
-
-
-
-
-
-
-
-
31
-Mar
-17
-
-
-
-
-
-
1.9
9 4
.76
93.
51
-
-
2 R
R M
ega
City
Bui
lder
s Li
mite
d 31
-Mar
-18
-
-
-
-
-
-
-
-
-
-
-
31-M
ar-1
7 -
-
-
-
-
-
0
.26
0.5
1 5
1.27
-
-
3
Tru
ewin
Rea
lty L
imite
d 31
-Mar
-18
-
-
-
-
-
-
-
-
-
-
-
31-M
ar-1
7 -
-
-
-
-
-
-
-
-
8
0.00
-
D
Co
mpa
nies
whe
re K
ey
Man
agem
ent P
erso
nnel
/ t
heir
rel
ativ
es e
xerc
ise
sign
ifica
nt in
flue
nce
(i)
Asho
k Pi
ram
al M
anag
emen
t Co
rpor
atio
n Li
mite
d31
-Mar
-18
-
-
-
-
-
-
-
-
-
-
-
31-M
ar-1
7 2
.84
-
-
-
-
-
-
-
-
-
-
(ii)
Free
dom
Reg
istr
y Li
mite
d31
-Mar
-18
0.0
1 -
-
-
-
-
-
-
-
-
-
31
-Mar
-17
0.0
2 -
-
-
-
-
-
-
-
-
-
(i
ii)
Mor
arje
e Te
xtile
s Li
mite
d31
-Mar
-18
-
-
-
-
-
- 0
.11
-
-
-
-
31-M
ar-1
7 -
-
-
-
-
0
.13
0.1
1 -
-
-
-
(i
v)
Pen
insu
la S
A R
ealty
Pri
vate
Li
mite
d31
-Mar
-18
-
-
-
-
-
-
-
0.0
1 -
-
-
31
-Mar
-17
-
-
-
-
-
-
-
0.0
1 -
-
-
(v
) P
enin
sula
Tow
nshi
ps
Dev
elop
men
t Pri
vate
Lim
ited
31-M
ar-1
8 -
-
-
-
-
-
-
0
.01
-
-
-
31-M
ar-1
7 -
-
-
-
-
-
-
0
.01
-
-
-
(vi)
Asho
k Pi
ram
al M
ega
City
D
evel
opm
ent P
riva
te L
imite
d31
-Mar
-18
-
-
-
-
-
-
-
0.0
1 -
-
-
31
-Mar
-17
-
-
-
-
-
-
-
0.0
1 -
-
-
(v
ii)
Asho
k Pi
ram
al M
ega
Prop
ertie
s Pr
ivat
e Li
mite
d31
-Mar
-18
-
-
-
-
-
-
-
0.0
1 -
-
-
31
-Mar
-17
-
-
-
-
-
-
-
0.0
1 -
-
-
(v
iii)
Gol
dlife
Mer
cant
ile C
ompa
ny
Priv
ate
Lim
ited
31-M
ar-1
8 -
0
.01
-
-
-
-
-
-
-
-
-
31-M
ar-1
7 -
0
.01
-
-
-
-
-
-
-
-
-
(ix)
H
ighw
ay C
once
ssio
ns O
ne
Priv
ate
Lim
ited
31-M
ar-1
8 -
-
-
-
-
0
.02
0.0
0 -
-
-
-
31
-Mar
-17
-
-
-
-
-
0.0
2 0
.00
-
-
-
-
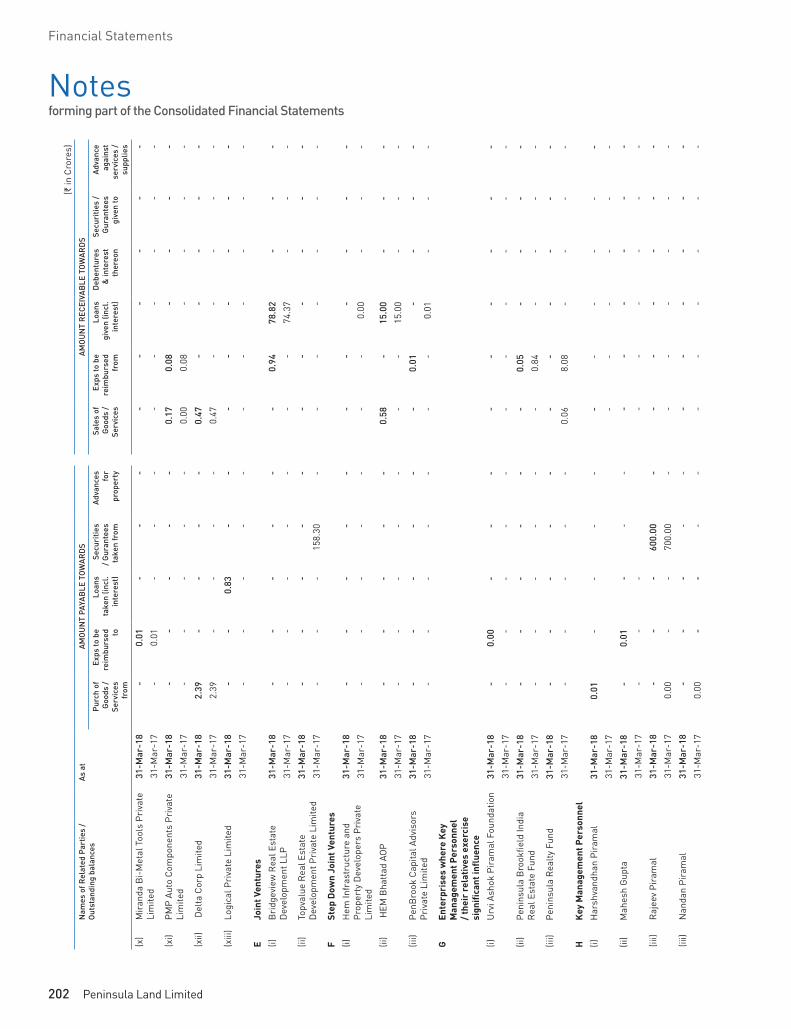
202 Peninsula Land Limited
Financial Statements
Notes forming part of the Consolidated Financial Statements
(` in
Cro
res)
Nam
es o
f Rel
ated
Par
ties
/ O
utst
andi
ng b
alan
ces
As a
t A
MO
UN
T PA
YAB
LE T
OWAR
DS
AMO
UN
T R
ECEI
VAB
LE T
OWAR
DS
Pur
ch o
f G
oods
/ Se
rvic
es
from
Exp
s to
be
reim
burs
ed
to
Loa
ns
take
n (in
cl.
inte
rest
)
Sec
uriti
es
/ Gur
ante
es
take
n fr
om
Adv
ance
s fo
r pr
oper
ty
Sale
s of
G
oods
/ Se
rvic
es
Exps
to b
e re
imbu
rsed
fr
om
Loan
s gi
ven
(incl
. in
tere
st)
Deb
entu
res
& in
tere
st
ther
eon
Secu
ritie
s /
Gur
ante
es
give
n to
Adva
nce
agai
nst
serv
ices
/ su
pplie
s
(x)
Mir
anda
Bi-
Met
al T
ools
Pri
vate
Li
mite
d31
-Mar
-18
-
0.0
1 -
-
-
-
-
-
-
-
-
31
-Mar
-17
-
0.0
1 -
-
-
-
-
-
-
-
-
(x
i) PM
P Au
to C
ompo
nent
s Pr
ivat
e Li
mite
d31
-Mar
-18
-
-
-
-
-
0.1
7 0
.08
-
-
-
-
31-M
ar-1
7 -
-
-
-
-
0.
00 0
.08
-
-
-
-
(xii)
D
elta
Cor
p Li
mite
d31
-Mar
-18
2.3
9 -
-
-
-
0
.47
-
-
-
-
-
31-M
ar-1
7 2
.39
-
-
-
-
0.4
7 -
-
-
-
-
(x
iii)
Logi
cal P
riva
te L
imite
d31
-Mar
-18
-
-
0.8
3 -
-
-
-
-
-
-
-
31
-Mar
-17
-
-
-
-
-
-
-
-
-
-
-
E
Join
t Ven
ture
s (i
) B
ridg
evie
w R
eal E
stat
e D
evel
opm
ent L
LP31
-Mar
-18
-
-
-
-
-
-
0.9
4 7
8.82
-
-
-
31
-Mar
-17
-
-
-
-
-
-
-
74.
37
-
-
-
(ii)
Topv
alue
Rea
l Est
ate
Dev
elop
men
t Pri
vate
Lim
ited
31-M
ar-1
8 -
-
-
-
-
-
-
-
-
-
-
31
-Mar
-17
-
-
-
158
.30
-
-
-
-
-
-
-
F
Step
Dow
n Jo
int V
entu
res
(i)
Hem
Infr
astr
uctu
re a
nd
Prop
erty
Dev
elop
ers
Priv
ate
Lim
ited
31-M
ar-1
8 -
-
-
-
-
-
-
-
-
-
-
31
-Mar
-17
-
-
-
-
-
-
-
0.0
0 -
-
-
(ii)
HEM
Bha
ttad
AO
P31
-Mar
-18
-
-
-
-
-
0.5
8 -
1
5.00
-
-
-
31
-Mar
-17
-
-
-
-
-
-
-
15.
00
-
-
-
(iii)
Pe
nBro
ok C
apita
l Adv
isor
s Pr
ivat
e Li
mite
d31
-Mar
-18
-
-
-
-
-
-
0.0
1 -
-
-
-
31
-Mar
-17
-
-
-
-
-
-
-
0.0
1 -
-
-
G
En
terp
rise
s w
here
Key
M
anag
emen
t Per
sonn
el
/ the
ir r
elat
ives
exe
rcis
e si
gnifi
cant
infl
uenc
e (i
) U
rvi A
shok
Pir
amal
Fou
ndat
ion
31-M
ar-1
8 -
0
.00
-
-
-
-
-
-
-
-
-
31-M
ar-1
7 -
-
-
-
-
-
-
-
-
-
-
(i
i) Pe
nins
ula
Bro
okfie
ld In
dia
Rea
l Est
ate
Fund
31-M
ar-1
8 -
-
-
-
-
-
0
.05
-
-
-
-
31-M
ar-1
7 -
-
-
-
-
-
0
.84
-
-
-
-
(iii)
Pe
nins
ula
Rea
lty F
und
31-M
ar-1
8 -
-
-
-
-
-
-
-
-
-
-
31
-Mar
-17
-
-
-
-
-
0.0
6 8
.08
-
-
-
-
H
Key
Man
agem
ent P
erso
nnel
(i)
Har
shva
ndha
n Pi
ram
al31
-Mar
-18
0.0
1 -
-
-
-
-
-
-
-
-
-
31
-Mar
-17
-
-
-
-
-
-
(ii)
Mah
esh
Gup
ta31
-Mar
-18
-
0.0
1 -
-
-
-
-
-
-
-
-
31
-Mar
-17
-
-
-
-
-
-
-
-
-
(iii)
R
ajee
v Pi
ram
al31
-Mar
-18
-
-
-
600
.00
-
-
-
-
-
-
-
31-M
ar-1
7 0
.00
-
-
700
.00
-
-
-
-
-
-
-
(iii)
N
anda
n Pi
ram
al31
-Mar
-18
--
-
-
-
-
-
-
-
-
-
31-M
ar-1
7 0
.00
- -
-
-
-
-
-
-
-
-

203Annual Report 2017-18
Built for challenges. Preparing for growth.
Notes forming part of the Consolidated Financial Statements
(` in
Cro
res)
Nam
es o
f Rel
ated
Par
ties
/ O
utst
andi
ng b
alan
ces
As a
t A
MO
UN
T PA
YAB
LE T
OWAR
DS
AMO
UN
T R
ECEI
VAB
LE T
OWAR
DS
Pur
ch o
f G
oods
/ Se
rvic
es
from
Exp
s to
be
reim
burs
ed
to
Loa
ns
take
n (in
cl.
inte
rest
)
Sec
uriti
es
/ Gur
ante
es
take
n fr
om
Adv
ance
s fo
r pr
oper
ty
Sale
s of
G
oods
/ Se
rvic
es
Exps
to b
e re
imbu
rsed
fr
om
Loan
s gi
ven
(incl
. in
tere
st)
Deb
entu
res
& in
tere
st
ther
eon
Secu
ritie
s /
Gur
ante
es
give
n to
Adva
nce
agai
nst
serv
ices
/ su
pplie
s
I R
elat
ives
of K
ey M
anag
emen
t Pe
rson
nel
(i)
Har
shva
ndha
n Pi
ram
al31
-Mar
-18
-
-
-
-
-
-
-
-
-
-
-
31-M
ar-1
7 0
.00
-
-
-
-
-
-
-
-
-
-
(ii)
Mah
esh
Gup
ta31
-Mar
-18
-
-
-
-
1.5
2 -
-
-
-
-
-
31
-Mar
-17
-
-
-
-
J
Co-
vent
urer
s / i
nves
ting
part
ies
in J
Vs /
Susi
diar
ies
and
Asso
ciat
es a
nd th
eir
rela
tives
(i)
Jaye
m P
rope
rtie
s Pr
ivat
e Li
mite
d31
-Mar
-18
-
-
-
-
-
-
-
0.0
4 -
-
-
31
-Mar
-17
-
-
15.
31
-
-
-
-
-
-
-
-
(ii)
Jave
d Ta
pia
31-M
ar-1
8 -
-
8
.41
-
-
-
-
-
-
-
-
31-M
ar-1
7 -
-
8
.41
-
-
-
-
-
-
-
-
(iii)
Az
im T
apia
31-M
ar-1
8 -
-
-
-
2
.50
-
-
-
-
-
-
31-M
ar-1
7 -
-
-
-
2
.50
-
-
-
-
-
-
(iv)
Cl
over
Hol
ding
& In
vest
men
t Pv
t. Lt
d.31
-Mar
-18
-
-
0.0
5 -
-
-
-
-
-
-
31
-Mar
-17
-
-
-
-
-
-
-
-
-
-
-
(v)
Prim
ary
Deb
t Inv
estm
ents
31-M
ar-1
8 -
-
-
-
-
-
-
-
3
48.0
3 -
-
31
-Mar
-17
-
-
-
-
-
-
-
-
306
.88
-
-
(vi)
Gra
y In
vest
men
ts P
riva
te
Lim
ted
31-M
ar-1
8 -
-
-
-
-
-
-
-
1
.40
-
-
31-M
ar-1
7 -
-
-
-
-
-
-
-
1
.26
-
-

204 Peninsula Land Limited
Financial Statements
Notes forming part of the Consolidated Financial Statements
42 Leases
a Assets taken on Operating Lease
The Group has entered into non cancellable operating leases for motor vehicles and computer equipments with lease term between three to four years. Future minimum lease payments under non - cancellable operating lease are as under:
(` in Crores) As At
31-Mar-18As at
31-Mar-17Not later than One Year 0.11 0.43 Later than One Year and not later than five years 0.05 0.30 Later than five years - - Total 0.16 0.73
Total lease rental cost recognised in the financial statement is ` 0.32 Crores (31 March 2017 - 0.56 Crores). Lease rentals paid amounting to ` 0.07 Crores (31 March 2017 - ` 0.05 Crores) has been included in Other Expenses.
b Assets given on Operating Lease
The Group has entered into operating leases on its investment property consisting of office buildings. These leases have terms of between one to ten years. All leases include a clause to enable upward revision of the rental charge on an annual basis according to prevailing market conditions. Future minimum lease income under operating lease are as under:
(` in Crores) As At
31-Mar-18As at
31-Mar-17
Not later than One Year 34.71 14.88
Later than One Year and not later than five years 50.47 6.04
Later than five years - -
85.18 20.92
Total lease rental income recognised in the consolidated financial statement is ` 36.72 Crores (31 March 2017 - ` 36.29 Crores)
43 Earnings Per Share (EPS) Basic earnings per share is calculated by dividing the net profit / loss for the year attributable to equity shareholders (after
deducting preference dividend and attributable taxes) by the weighted average number of equity shares outstanding during the year.
Diluted earnings per shares is calculated by dividing the net profit / loss attributable for the year to equity shareholders (after adjusting for dividend on the preference shares) by the weighted average number of equity shares outstanding during the year plus the weighted average number of equity shares that would be issued on conversion of all the dilutive potential equity shares into equity shares.
Year Ended 2017-18
Year Ended 2016-17
i Profit attributable to equity shareholders Net profit / (loss) attributable to the equity shareholders (` in crores) (444.13) (216.91)
ii Outstanding number of equity sharesTotal number of equity shares outstanding at the beginning of the year 279,201,220 279,201,220 Total number of equity shares outstanding at the end of the year 279,201,220 279,201,220 Weighted average number of equity shares 279,201,220 279,201,220
iii Basic and Diluted earnings per shareBasic EPS (`) (15.91) (7.77)Diluted EPS (`) (15.91) (7.77)

205Annual Report 2017-18
Built for challenges. Preparing for growth.
Notes forming part of the Consolidated Financial Statements
44 Disclosure as per The Micro, Small and Medium Enterprises Development Act, 2006 Based on the information available with the Group, the following is the amount due to the suppliers who are registered as
micro, small and medium enterprises under "The Micro, Small and Medium Enterprises Development Act, 2006".
(` in Crores) 31-Mar-18 31-Mar-17
The principal amount remaining unpaid at the end of the year 5.92 0.65The interest amount remaining unpaid at the end of the year 0.00 - The interest amount paid in terms of Section 16 of MSMED Act 2006 - - The balance of MSMED parties as at the end of the year 5.92 0.65
45 The details of cost of Realty Sales and Work in Progress (Realty Stock) are as under:(` in Crores)
Year Ended 2017-18
Year Ended 2016-17
Realty Costs incurred during the year
Land Costs - - Development Costs * 676.60 403.02 Interest and Other Borrowing Costs 170.94 224.27 Total Realty Costs for the year (A) 847.54 627.29 Changes in Inventory Opening Inventory Finished Realty Stock 50.78 3.86 Work in Progress 2,695.70 2,354.93 Raw Materials 5.62 7.34 Traded Goods 0.45 0.63 Sub-total (i) 2,752.55 2,366.76 Closing Inventory Finished Realty Stock 30.32 50.78 Work in Progress * 2,856.52 2,695.70 Raw Materials 28.63 5.62 Traded Goods 0.45 0.45 Sub-total (ii) 2,915.92 2,752.55 Changes in Inventory (B) = (i-ii) (163.37) (385.79)Costs capitalised / Transferred to P&L (C) 63.02 - Cost of Realty Sales Recognised (A+B-C) 621.15 241.50
* includes ` 398.79 crores (31 March 2017 - Nil) acquired under business combination
(` in Crores) Year Ended
2017-18 Year Ended
2016-17Revenues Recognised on Projects as at year end 407.45 221.91 Corresponding Costs Recognised till date thereon 405.75 241.13 Net Profit / (Loss) recognised thereon 1.70 (19.22)
Disclosure in respect of projects (except developed plots) under the Guidance Note on "Accounting for Real Estate Transactions".
(` in Crores) Year Ended
2017-18 Year Ended
2016-17Amount of project revenue recognised as revenue during the year 160.27 176.24 Aggregate amount of costs incurred and profits / (losses) recognised till date 336.51 221.91 Amount of advances received 56.90 45.18 Amount of work-in-progress and value of inventories 381.38 350.98 Excess of revenue recognised over actual bills raised (unbilled revenue) 37.43 43.30

206 Peninsula Land Limited
Financial Statements
Notes forming part of the Consolidated Financial Statements
46 Business Combination and Acquisitions of Non - Controlling Interest On 31st March 2018 the Holding Company increased its stake in the following four Special Purpose Vehicles (SPVs) engaged
in real estate project to 54.38%, by acquiring units in a Pref Indigo, a scheme of peninsula realty fund. The stake in these SPVs were increased as they were engaged in the same business line, thereby giving the Holding Company a controlling interest in the projects.
The Holding Company has elected to measure the Non-controlling interest in the acquired entities at Fair value.
Name of SPVs Project
1. RR Mega City Builders Limited Hinjewadi2. Goodhome Realty Limited Bengaluru3. Rockfirst Real estate Limited Goa4. Truewin Realty Limited Lonavala
The fair values of identifiable assets and liabilities of the SPVs as on the date of acquisition were :
(` in Crores)Particulars Fair value recognised
on acquisitionAssetsProperty Plant & Equipments 0.28 Other Bank Balances 1.59 Other Non Current Assets 6.00 Income Taxes net 2.97 Inventory (net of impairment of ` 87.82 crores) 398.77 Current Investments 3.81 Trade Receivable 33.82 Cash & Cash Equivalents 13.98 Bank Balances Others 1.56 Loans to Others 46.94 Interest Receivable 15.08 Receivable from Parent 0.45 Other Receivable 0.56 Other Current Assets 20.54 Total - Assets - (A) 546.35 LiabilitiesDebenture 25.74 Investments of Parent 132.49 Loan by Parent 33.85 Deferred Tax 17.79 Loans Others 40.73 Bank OD 13.98 Trade Payables 22.85 Current Maturities of Long term debt 154.69 Interest accrued but not due 5.80 Other Current Liabilities - Condominium 0.18 Advance from Customers 51.95 Statutory dues 1.31 Total - Liabilities - (B) 501.36 Net Assets Acquired (A-B) = C 44.99 Non-Controlling Interest measured at fair value (D) 22.00 Cost of Acquisition paid for acquiring stake (C-D) 22.99

207Annual Report 2017-18
Built for challenges. Preparing for growth.
Notes forming part of the Consolidated Financial Statements
47 Exceptional Items The Group has recorded exceptional items during the year ended 31st March 2018 amounting to ` 169.52 Crores and it
comprises of : (` in Crores)
Particulars 31-Mar-18Inventory write down to net realisable value 63.02Impairment of Goodwill on investment in Subsidiary 11.65Impairment of Deemed Investments in Associates 3.36Impairment of loans to Associates Entity (ICDs) 91.49Total 169.52
48 Details of Subsidiaries, Joint Ventures, Associates and Other Entities considered for Consolidated Financial Statements
Sr No
Name of Entity Relation as per Ind-AS Principal place of business/country of Incorporation
Percentage of ownership Interest as on
31-03-18 31-03-17
1 Rockfirst Real Estate Limited # Subsidiary India 54.38% 14%2 Truewin Realty Ltd @ Subsidiary India 54.38% 14%3 R R Mega City Builders Ltd @ Subsidiary India 54.38% 14%4 Goodhome Realty Ltd @ Subsidiary India 54.38% 14%5 Peninsula Mega Properties Pvt Ltd Subsidiary India 100% 100%6 Pavurotti Real Estate Pvt Ltd Subsidiary India 56% 56%7 Peninsula Holdings and Investments Pvt. Ltd Subsidiary India 100% 100%8 Goodtime Real Estate Development Pvt. Ltd. Subsidiary India 57.26% 57.26%9 Midland Township Pvt Ltd Subsidiary India 100% 100%10 Peninsula Crossroads Pvt Limited Subsidiary India 100% 100%11 Peninsula Mega Township Developers Ltd Subsidiary India 100% 100%12 Peninsula Realty Fund Subsidiary India 46.95% -13 Peninsula Investment Management Co Ltd Step Down Subsidiary India 75.01% 75.01%14 Takenow Property Developers Pvt Ltd Step Down Subsidiary India 100% 100%15 Peninsula Mega City Development Pvt Ltd Step Down Subsidiary India 100% 100%16 Peninsula Trustee Ltd Step Down Subsidiary India 70% 70%17 Inox Mercantile Co Pvt Ltd Step Down Subsidiary India 100% 100%18 Peninsula Pharma Research Centre Pvt Ltd Step Down Subsidiary India 100% 100%19 Planetview Mercantile Co Pvt Ltd Step Down Subsidiary India 100% 100%20 RR Real Estate Development Pvt Ltd Step Down Subsidiary India 100% 100%21 Peninsula Integrated Land Developers Pvt Ltd Step Down Subsidiary India 100% 100%22 Sketch Real Estate Pvt Ltd Step Down Subsidiary India 100% 100%23 Westgate Real Estate Development LLP Step Down Subsidiary India 84.99% 84.99%24 Eastgate Real Estate Development LLP Step Down Subsidiary India 99% 99%25 Topvalue Real Estate Development Ltd Step Down Subsidiary India 100% 100%26 Peninsula Facility Management Services Ltd Step Down Subsidiary India 100% 100%27 RA Realty Ventures LLP Associate India 40% 40%28 Bridge View Real Estate Development LLP Joint Venture India 50% 50%29 PenBrook Capital Advisors Pvt Ltd (formerly known as
Peninsula Brookfield Investment Managers Pvt Ltd)Step Down Joint Venture India 37% 37%
30 Peninsula Brookfield Trustee Pvt Ltd Step Down Joint Venture India 50% 50%31 Hem Infrastructure and Property Developers Pvt Ltd Step Down Joint Venture India 57.44% 51%32 Hem-Bhattad (AOP) Step Down Joint Venture India 20.39% 18%33 J M Realty Management Pvt Ltd # Held for Sale India 50% 50%34 SEW Engineering (India) Pvt Ltd # Held for Sale India 26% 26%35 Regena Real Estate LLP * - India - 99%36 Nebustar Real Estate LLP * - India - 99%37 Argento Real Estate LLP * - India - 99%38 Gorena Real Estate LLP * - India - 99%39 Maxis Real Estate LLP * - India - 99%40 Peninsula GSG MHP Project - AOP $ - India - 50%
# Associate in the Previous year@ Step down Associate in the Previous year* Step down Associate in the Previous year - Application for strike off filed during the year$ Subsidiary in Previous year (Dissolved on 13/10/2016)

208 Peninsula Land Limited
Financial Statements
Notes forming part of the Consolidated Financial Statements
49 Interest in Other Entities The group’s interest in the joint ventures and associates are accounted for using equity method in the consolidated financial
statements.
Refer note 34 for commitments and contingent liabilities in respect of the group
Summarised financial information of the joint ventures and associates, based on its Ind AS financial statements, and reconciliation with the carrying amount of the investment in consolidated financial statements is as follows:
A Summarised Balance sheet
I. Joint Ventures(` in Crores)
Particulars Bridgeview Real Estate Development LLP
Peninsula Brookfield Trustee Private Limited
PenBrook Capital Advisors Private Limited
Hem Infrastructure and Property Developers
Private Limited31-Mar-18 31-Mar-17 31-Mar-18 31-Mar-17 31-Mar-18 31-Mar-17 31-Mar-18 31-Mar-17
Proportion of ownership interest held by the group at the year end
50.00% 50.00% 50.00% 50.00% 37.00% 37.00% 57.44% 51.00%
A. Non Current Assets 3.99 3.21 - - 11.27 11.59 102.29 103.89 B. Current Assets (i) Cash and cash equivalents 9.49 0.91 0.11 0.09 3.28 1.86 0.09 0.02 (ii) Others 163.20 158.29 0.00 - 3.48 3.61 0.34 0.34 Total Current Asset 172.69 159.20 0.11 0.09 6.76 5.47 0.43 0.36 I. Total Assets (A+B) 176.68 162.41 0.11 0.09 18.03 17.06 102.72 104.26 C. Non Current Liabilities (i) Financial Liabilities 132.47 127.01 - - - - 0.45 0.52 (ii) Non Financial Liabilities - - - - 0.17 0.35 - - Total Non Current Liabilities 132.47 127.01 - - 0.17 0.35 0.45 0.52 D. Current Liabilities (i) Financial Liabilities 64.83 43.01 0.01 0.01 1.00 1.56 0.00 0.00 (ii) Non Financial Liabilities 0.34 0.56 0.00 0.00 0.60 0.11 0.01 0.01 Total Current Liabilities 65.17 43.57 0.01 0.01 1.60 1.67 0.01 0.01 II. Total Liabilities (C+D) 197.64 170.58 0.01 0.01 1.77 2.02 0.46 0.53 Net Assets (I-II) (20.96) (8.17) 0.10 0.08 16.26 15.05 102.26 103.73 Group's interest in Net Assets - - 0.05 0.04 6.02 5.57 58.74 52.90
II. Associates(` in Crores)
Particulars RA Realty Ventures LLP JM Realty Management Private Limited (Note 1)
SEW Engineering (India) Private Limited (Note 1)
Goodhome Realty Limited (Note 2)
31-Mar-18 31-Mar-17 31-Mar-18 31-Mar-17 31-Mar-18 31-Mar-17 31-Mar-18 31-Mar-17Proportion of ownership interest held by the group at the year end
40.00% 40.00% - 50.00% - 26.00% 54.38% 14.00%
A. Non Current Assets 32.72 29.40 - - - 10.47 - 0.62 B. Current Assets (i) Cash and cash equivalent 0.59 0.79 - 0.00 - 9.50 - 1.38 (ii) Others 792.32 719.55 - 26.85 - 147.00 - 260.21 Total Current Asset 792.91 720.34 - 26.85 - 156.50 - 261.59 I. Total Assets (A+B) 825.63 749.74 - 26.85 - 166.97 - 262.21 C. Non Current Liabilities (i) Financial Liabilities 856.97 769.68 - - - 34.74 - 87.63 (ii) Non Financial Liabilities 24.73 28.74 - 0.60 - - - 11.71 Total Non Current Liabilities 881.70 798.42 - 0.60 - 34.74 - 99.34

209Annual Report 2017-18
Built for challenges. Preparing for growth.
Notes forming part of the Consolidated Financial Statements
(` in Crores)Particulars RA Realty Ventures LLP JM Realty Management
Private Limited (Note 1)SEW Engineering (India) Private Limited (Note 1)
Goodhome Realty Limited (Note 2)
31-Mar-18 31-Mar-17 31-Mar-18 31-Mar-17 31-Mar-18 31-Mar-17 31-Mar-18 31-Mar-17
D. Current Liabilities (i) Financial Liabilities 5.11 1.36 - 19.44 - 105.12 - 131.59 (ii) Non Financial Liabilities 0.03 4.91 - 6.74 - 2.54 - 0.26 Total Current Liabilities 5.14 6.27 - 26.18 - 107.66 - 131.85 II. Total Liabilities (C+D) 886.84 804.69 - 26.78 - 142.40 - 231.19 Net Assets (I-II) (61.21) (54.95) - 0.07 - 24.58 - 31.02 Group's interest in Net Assets - - - 0.03 - 6.39 - 4.34
(` in Crores)Particulars RR Mega City Builders Limited
(Note 2)Rockfirst Real Estate Limited
(Note 4)Truewin Realty Limited
(Note 2)31-Mar-18 31-Mar-17 31-Mar-18 31-Mar-17 31-Mar-18 31-Mar-17
Proportion of ownership interest held by the group at the year end
54.38% 14.00% 54.38% 14.00% 54.38% 14.00%
A. Non Current Assets - 0.70 - 0.25 - 1.28 B. Current Assets (i) Cash and cash equivalent - 18.41 - 0.51 - 0.24 (ii) Others - 132.49 - 214.27 - 131.32 Total Current Asset - 150.90 - 214.78 - 131.56 I. Total Assets (A+B) - 151.60 - 215.03 - 132.84 C. Non Current Liabilities (i) Financial Liabilities - - - 0.10 - 77.08 (ii) Non Financial Liabilities - 0.47 - 4.01 - 4.10 Total Non Current Liabilities - 0.47 - 4.11 - 81.18 D. Current Liabilities (i) Financial Liabilities - 137.39 - 223.92 - 51.43 (ii) Non Financial Liabilities - 0.32 - 0.29 - - Total Current Liabilities - 137.71 - 224.21 - 51.43 II. Total Liabilities (C+D) - 138.18 - 228.32 - 132.61 Net Assets (I-II) - 13.42 - (13.29) - 0.23 Group's interest in Net Assets - 1.88 - - - 0.03
B Summarised Statement of profit and loss
I. Joint Ventures(` in Crores)
Particulars Bridgeview Real Estate Development LLP
Peninsula Brookfield Trustee Private Limited
PenBrook Capital Advisors Private Limited
Hem Infrastructure and Property Developers
Private Limited31-Mar-18 31-Mar-17 31-Mar-18 31-Mar-17 31-Mar-18 31-Mar-17 31-Mar-18 31-Mar-17
Proportion of ownership interest held by the group at the year end
50.00% 50.00% 50.00% 50.00% 37.00% 37.00% 57.44% 51.00%
Revenue 56.40 6.48 0.04 0.04 8.02 6.81 9.32 0.18 Profit / (Loss) before tax (12.79) (7.99) 0.03 0.03 2.08 2.31 9.27 0.16 Tax Expense - - 0.01 0.01 0.76 0.72 0.29 0.00 Profit / (Loss) after tax (12.79) (7.99) 0.02 0.02 1.31 1.59 8.98 0.16 Other Comprehensive Income - - - - (0.08) 0.02 - - Total Comprehensive Income (12.79) (7.99) 0.02 0.02 1.23 1.61 8.98 0.16 Depreciation - - - - 0.01 0.02 - - Interest Income 0.00 0.01 0.00 0.00 0.13 0.12 - - Interest Expense 0.00 0.05 - - 0.07 0.09 - - Group's share in profit and loss - - 0.01 0.01 0.49 0.59 4.58 0.08 Group's share in profit and loss not considered for consolidation
(6.40) (4.00) - - - - - -
Group's share in OCI - - - - (0.03) 0.01 - -

210 Peninsula Land Limited
Financial Statements
Notes forming part of the Consolidated Financial Statements
II. Associates(` in Crores)
Particulars RA Realty Ventures LLP JM Realty Management Private Limited (Note 1)
SEW Engineering (India) Private Limited
(Note 1)
Goodhome Realty Limited (Note 2)
31-Mar-18 31-Mar-17 31-Mar-18 31-Mar-17 31-Mar-18 31-Mar-17 31-Mar-18 31-Mar-17Proportion of ownership interest held by the group at the year end
40.00% 40.00% - 50.00% - 26.00% 54.38% 14.00%
Revenue 38.49 345.00 - - - 99.80 - 130.74 Profit / (Loss) before tax (9.59) (82.77) - (1.70) - 0.51 - (8.24)Tax Expense 3.32 28.64 - (0.52) - 0.28 - (5.32)Profit / (Loss) after tax (6.27) (111.41) - (1.18) - 0.23 - (2.92)Other Comprehensive Income - - - - - - - - Total Comprehensive Income (6.27) (111.41) - (1.18) - 0.23 - (2.92)Depreciation - - - - - 0.44 - 0.03 Interest Income - - - - - - - - Interest Expense 91.79 98.30 - 1.69 - 9.37 - 0.00 Group's share in profit and loss - (3.27) - (0.59) - 0.06 - -Group's share in profit and loss not considered for consolidation
(2.51) (41.30) - - - - - (0.41)
Group's share in OCI - - - - - - - -
(` in Crores)Particulars RR Mega City Builders
Limited (Note 2)Rockfirst Real Estate
Limited (Note 4)
Truewin Realty Limited (Note 2)
Top Value Real Estate Development Limited
(Note 3)31-Mar-18 31-Mar-17 31-Mar-18 31-Mar-17 31-Mar-18 31-Mar-17 31-Mar-18 31-Mar-17
Proportion of ownership interest held by the group at the year end
54.38% 14.00% 54.38% 14.00% 54.38% 14.00% 100.00% 14.00%
Revenue - 228.14 - 32.71 - 2.80 - - Profit / (Loss) before tax - (29.96) - (27.87) - (3.98) - (0.12)Tax Expense - (9.80) - (3.69) - (0.24) - - Profit / (Loss) after tax - (20.16) - (24.18) - (3.74) - (0.12)Other Comprehensive Income - - - - - - - - Total Comprehensive Income - (20.16) - (24.18) - (3.74) - (0.12)Depreciation - - - - - - - - Interest Income - 0.00 - 0.01 - 0.00 - 0.05 Interest Expense - 0.00 - 0.00 - 0.00 - - Group's share in profit and loss - (0.68) - - - 1.03 - - Group's share in profit and loss not considered for consolidation
- (2.14) - (3.39) - (0.51) - (0.02)
Group's share in OCI - - - - - - - -
C Movement of Investment using Equity Method
I. Joint Ventures (` in Crores)
Particulars Bridgeview Real Estate Development LLP
Peninsula Brookfield Trustee Private Limited
PenBrook Capital Advisors Private Limited
Hem Infrastructure and Property Developers
Private Limited31-Mar-18 31-Mar-17 31-Mar-18 31-Mar-17 31-Mar-18 31-Mar-17 31-Mar-18 31-Mar-17
Opening Balance - - 0.04 0.01 7.37 6.78 77.10 77.02 Further investment during the year - - - - - - 13.79 - Share of Profit / (Loss) for the year - - 0.01 0.03 0.45 0.59 5.16 0.08 Closing Balance - - 0.05 0.04 7.82 7.37 96.05 77.10

211Annual Report 2017-18
Built for challenges. Preparing for growth.
Notes forming part of the Consolidated Financial Statements
II. Associates(` in Crores)
Particulars RA Realty Ventures LLP JM Realty Management Private Limited (Note 1)
SEW Engineering (India) Private Limited (Note 1)
Goodhome Realty Limited (Note 2)
31-Mar-18 31-Mar-17 31-Mar-18 31-Mar-17 31-Mar-18 31-Mar-17 31-Mar-18 31-Mar-17Opening Balance - 0.39 3.37 3.95 10.80 10.74 - - Transfer to Capital Reserve - - - - - - - - Fees for Financial Guarantee given - 3.60 - - - - - - Investment Held for Sale - - (3.37) - (10.80) - - - Share of Profit / (Loss) for the year - (3.99) - (0.58) - 0.06 - - Closing Balance - - - 3.37 - 10.80 - -
(` in Crores)Particulars RR Mega City Builders
Limited (Note 2)Rockfirst Real Estate
Limited (Note 4)
Truewin Realty Limited (Note 2)
Top Value Real Estate Development Limited
(Note 3)31-Mar-18 31-Mar-17 31-Mar-18 31-Mar-17 31-Mar-18 31-Mar-17 31-Mar-18 31-Mar-17
Opening Balance - 0.68 - - - 0.18 - 0.14 Transfer to Capital Reserve - - - - - - - (0.13)Fees for Financial Guarantee given - - - - - - - - Investment Held for Sale - - - - - - - - Share of Profit / (Loss) for the year - (0.68) - - - (0.18) - - Closing Balance - - - - - - - 0.01
D Reconciliation of carrying amount
I. Joint Ventures(` in Crores)
Particulars Bridgeview Real Estate Development LLP
Peninsula Brookfield Trustee Private Limited
PenBrook Capital Advisors Private Limited
Hem Infrastructure and Property Developers
Private Limited31-Mar-18 31-Mar-17 31-Mar-18 31-Mar-17 31-Mar-18 31-Mar-17 31-Mar-18 31-Mar-17
Net Assets of Joint Venture (20.96) (8.18) 0.10 0.08 16.26 15.04 102.26 103.73 Proportion of Ownership Interest held by the group
50.00% 50.00% 50.00% 50.00% 37.00% 37.00% 57.44% 51.00%
Group's interest in Net Assets - - 0.05 0.04 6.02 5.57 58.74 52.90 Gain / (Loss) on account of disproportionate investment in security premium by co-venturer
- - - - - - 24.20 24.20
Additional Investment during the year - - - - - - 13.80 - Adjustment on account of security premium utilised on redemption of shares
- - - - - - (0.69) -
Transfer of loss to minority - - - - 1.80 1.81 - - Carrying amount of Investment - - 0.05 0.04 7.82 7.38 96.05 77.10
II. Associates(` in Crores)
Particulars RA Realty Ventures LLP JM Realty Management Private Limited (Note 1)
SEW Engineering (India) Private Limited (Note 1)
Goodhome Realty Limited (Note 2)
31-Mar-18 31-Mar-17 31-Mar-18 31-Mar-17 31-Mar-18 31-Mar-17 31-Mar-18 31-Mar-17Net Assets of Associates (including deemed equity) *
(61.21) (54.95) - 0.07 - 24.57 - 31.02
Proportion of Ownership Interest held by the group
40.00% 40.00% - 50.00% - 26.00% 54.38% 14.00%
Group's interest in Net Assets (24.48) (21.98) - - - 6.39 - - Goodwill - - - - - 4.41 - - Carrying amount of Investment - - - - - 10.80 - -
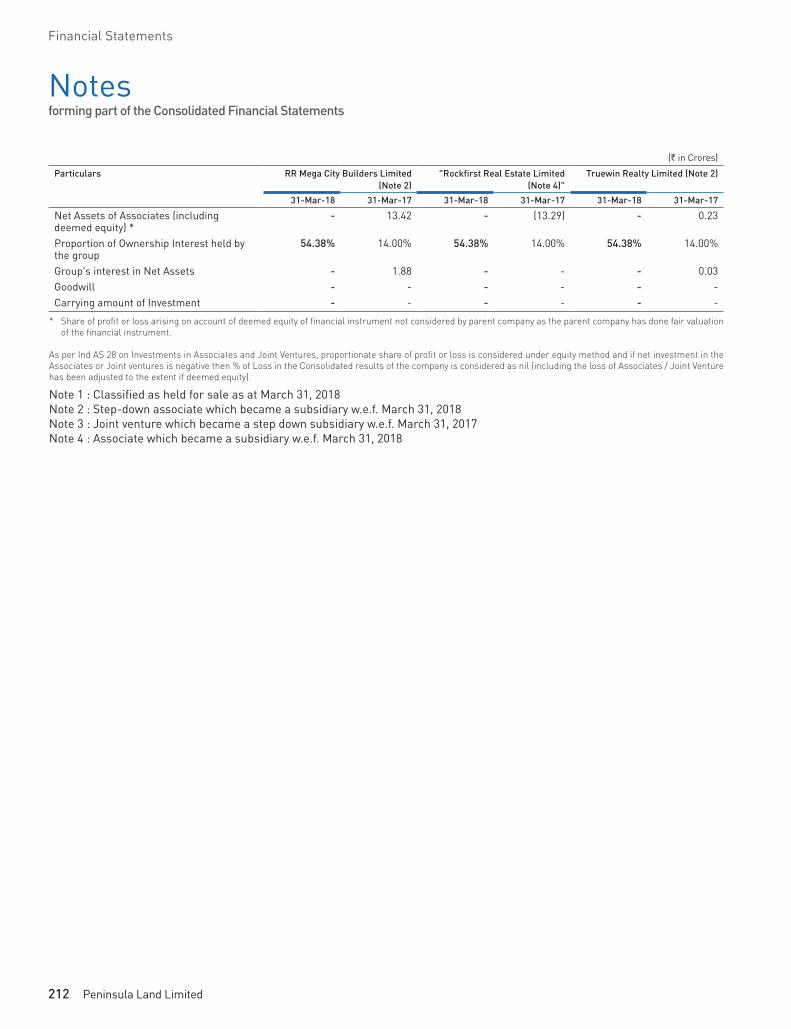
212 Peninsula Land Limited
Financial Statements
Notes forming part of the Consolidated Financial Statements
(` in Crores)
Particulars RR Mega City Builders Limited (Note 2)
"Rockfirst Real Estate Limited (Note 4)"
Truewin Realty Limited (Note 2)
31-Mar-18 31-Mar-17 31-Mar-18 31-Mar-17 31-Mar-18 31-Mar-17
Net Assets of Associates (including deemed equity) *
- 13.42 - (13.29) - 0.23
Proportion of Ownership Interest held by the group
54.38% 14.00% 54.38% 14.00% 54.38% 14.00%
Group's interest in Net Assets - 1.88 - - - 0.03 Goodwill - - - - - - Carrying amount of Investment - - - - - -
* Share of profit or loss arising on account of deemed equity of financial instrument not considered by parent company as the parent company has done fair valuation of the financial instrument.
As per Ind AS 28 on Investments in Associates and Joint Ventures, proportionate share of profit or loss is considered under equity method and if net investment in the Associates or Joint ventures is negative then % of Loss in the Consolidated results of the company is considered as nil (including the loss of Associates / Joint Venture has been adjusted to the extent if deemed equity).
Note 1 : Classified as held for sale as at March 31, 2018 Note 2 : Step-down associate which became a subsidiary w.e.f. March 31, 2018Note 3 : Joint venture which became a step down subsidiary w.e.f. March 31, 2017 Note 4 : Associate which became a subsidiary w.e.f. March 31, 2018

213Annual Report 2017-18
Built for challenges. Preparing for growth.
Notes forming part of the Consolidated Financial Statements
50 S
tate
men
t of
Net
Ass
ets,
Pro
fit o
r Lo
ss,
Oth
er C
ompr
ehen
sive
Inc
ome
and
Tota
l Co
mpr
ehen
sive
Inc
ome
and
Non
Cont
roll
ing
Inte
rest
con
side
red
in th
e Co
nsol
idat
ed F
inan
cial
Sta
tem
ents
Entit
yN
et A
sset
s Sh
are
in P
rofit
or
(Los
s)Sh
are
in O
ther
Com
preh
ensi
ve
Inco
me
Shar
e in
Tot
al C
ompr
ehen
sive
Inco
me
31-M
ar-1
831
-Mar
-17
31-M
ar-1
831
-Mar
-17
31-M
ar-1
831
-Mar
-17
31-M
ar-1
831
-Mar
-17
% o
f co
nsol
i-da
ted
net
asse
ts
Am
ount
%
of
cons
oli-
date
d ne
t as
sets
Am
ount
% o
f con
-so
lidat
ed
profi
t or
(loss
)
Am
ount
% o
f con
-so
lidat
ed
profi
t or
(loss
)
Am
ount
% o
f con
-so
lidat
ed
OCI
Am
ount
% o
f con
-so
lidat
ed
OCI
Am
ount
% o
f con
-so
lidat
ed
tota
l co
mpr
e-he
nsiv
e in
com
e
Am
ount
% o
f con
-so
lidat
ed
tota
l co
mpr
e-he
nsiv
e in
com
e
Am
ount
AH
oldi
ng C
ompa
nyPe
nins
ula
Land
Li
mite
d12
9.25
% 1
,377
.79
112.
91%
1,7
04.7
0 73
.70%
(327
.33)
65.9
7% (1
43.1
0)13
0.30
% 0
.43
85.7
1% (0
.06)
73.6
6% (3
26.9
0)65
.98%
(143
.16)
BSu
bsid
iari
es(i)
Peni
nsul
a H
oldi
ngs
and
Inve
stm
ents
Pr
ivat
e Li
mite
d
3.15
% 3
3.56
6.
48%
97.
85
14.4
8% (6
4.30
)13
.71%
(29.
73)
0.00
% -
0.
00%
-
14.4
9% (6
4.30
)13
.70%
(29.
73)
(ii)
Peni
nsul
a M
ega
Prop
ertie
s Pr
ivat
e Li
mite
d
0.00
% (0
.02)
0.00
% (0
.02)
0.00
% (0
.00)
0.00
% (0
.00)
0.00
% -
0.
00%
-
0.00
% (0
.00)
0.00
% (0
.00)
(iii)
Peni
nsul
a Cr
ossr
oads
Pr
ivat
e Li
mite
d3.
51%
37.
45
2.35
% 3
5.52
-0
.43%
1.9
3 -1
.28%
2.7
9 0.
00%
-
0.00
% -
-0
.44%
1.9
3 -1
.28%
2.7
9
(iv)
Pavu
rott
i Rea
l Est
ate
Priv
ate
Lim
ited
-0.0
1% (0
.12)
-0.0
1% (0
.10)
0.01
% (0
.03)
0.01
% (0
.02)
0.00
% -
0.
00%
-
0.01
% (0
.03)
0.01
% (0
.02)
(v)
Goo
dtim
e R
eal E
stat
e D
evel
opm
ent P
riva
te
Lim
ited
13.8
0% 1
47.1
2 10
.67%
161
.16
4.35
% (1
9.34
)4.
84%
(10.
49)
-39.
45%
(0.1
3)0.
00%
-
4.39
% (1
9.47
)4.
84%
(10.
49)
(vi)
Peni
nsul
a M
ega
Tow
nshi
p D
evel
oper
s Li
mite
d
0.01
% 0
.09
0.01
% 0
.17
0.02
% (0
.07)
0.01
% (0
.03)
0.00
% -
0.
00%
-
0.02
% (0
.07)
0.01
% (0
.03)
(vii)
Mid
land
Tow
nshi
p Pr
ivat
e Li
mite
d0.
00%
(0.0
0)0.
00%
(0.0
0)0.
00%
(0.0
0)0.
00%
(0.0
0)0.
00%
-0.
00%
-
0.00
% (0
.00)
0.00
% (0
.00)
(viii
)In
ox M
erca
ntile
Co
mpa
ny P
riva
te
Lim
ited
-1.0
4% (1
1.08
)-0
.18%
(2.7
6)1.
87%
(8.3
2)3.
31%
(7.1
8)0.
00%
-
0.00
% -
1.
88%
(8.3
2)3.
31%
(7.1
8)
(ix)
Peni
nsul
a Fa
cilit
y M
anag
emen
t Ser
vice
s Li
mite
d
0.88
% 9
.40
0.69
% 1
0.35
0.
21%
(0.9
5)-0
.23%
0.5
0 0.
00%
-
17.8
5% (0
.01)
0.21
% (0
.95)
-0.2
3% 0
.49
(x)
Peni
nsul
a In
vest
men
t M
anag
emen
t Com
pany
Li
mite
d
1.14
% 1
2.13
0.
88%
13.
29
0.26
% (1
.16)
0.47
% (1
.01)
0.00
% -
0.
00%
-
0.26
% (1
.16)
0.47
% (1
.01)
(xi)
Peni
nsul
a Ph
arm
a R
esea
rch
Cent
re
Priv
ate
Lim
ited
-0.4
7% (5
.06)
-0.1
1% (1
.67)
0.76
% (3
.39)
1.35
% (2
.92)
0.00
% -
0.
00%
-
0.76
% (3
.39)
1.35
% (2
.92)
(xii)
Peni
nsul
a Tr
uste
e Li
mite
d0.
02%
0.2
1 0.
01%
0.2
0 0.
00%
0.0
1 -0
.01%
0.0
1 0.
00%
-
0.00
% -
0.
00%
0.0
1 -0
.01%
0.0
1
(xiii
)Pl
anet
view
Mer
cant
ile
Com
pany
Pri
vate
Li
mite
d
-0.3
8% (4
.08)
-0.0
9% (1
.40)
0.61
% (2
.69)
1.07
% (2
.32)
0.00
%-
0.00
% -
0.
61%
(2.6
9)1.
07%
(2.3
2)
(xiv
)R
R R
eal E
stat
e D
evel
opm
ent P
riva
te
Lim
ited
-1.2
4% (1
3.22
)-0
.56%
(8.5
2)1.
06%
(4.7
0)1.
68%
(3.6
4)0.
00%
-
0.00
% -
1.
06%
(4.7
0)1.
68%
(3.6
4)

214 Peninsula Land Limited
Financial Statements
Notes forming part of the Consolidated Financial Statements
Entit
yN
et A
sset
s Sh
are
in P
rofit
or
(Los
s)Sh
are
in O
ther
Com
preh
ensi
ve
Inco
me
Shar
e in
Tot
al C
ompr
ehen
sive
Inco
me
31-M
ar-1
831
-Mar
-17
31-M
ar-1
831
-Mar
-17
31-M
ar-1
831
-Mar
-17
31-M
ar-1
831
-Mar
-17
% o
f co
nsol
i-da
ted
net
asse
ts
Am
ount
%
of
cons
oli-
date
d ne
t as
sets
Am
ount
% o
f con
-so
lidat
ed
profi
t or
(loss
)
Am
ount
% o
f con
-so
lidat
ed
profi
t or
(loss
)
Am
ount
% o
f con
-so
lidat
ed
OCI
Am
ount
% o
f con
-so
lidat
ed
OCI
Am
ount
% o
f con
-so
lidat
ed
tota
l co
mpr
e-he
nsiv
e in
com
e
Am
ount
% o
f con
-so
lidat
ed
tota
l co
mpr
e-he
nsiv
e in
com
e
Am
ount
(xv)
Take
now
Pro
pert
y D
evel
oper
s Pr
ivat
e Li
mite
d
-0.2
3% (2
.46)
-0.1
4% (2
.15)
0.07
% (0
.32)
0.12
% (0
.27)
0.00
% -
0.
00%
-
0.07
% (0
.32)
0.12
% (0
.27)
(xvi
)Pe
nins
ula
Meg
a Ci
ty
Dev
elop
men
t Pri
vate
Li
mite
d
-0.0
4% (0
.41)
-0.0
2% (0
.37)
0.01
% (0
.04)
0.02
% (0
.04)
0.00
% -
0.
00%
-
0.01
% (0
.04)
0.02
% (0
.04)
(xvi
i)Pe
nins
ula
Inte
grat
ed
Land
Dev
elop
ers
Priv
ate
Lim
ited
0.04
% 0
.46
0.03
% 0
.46
0.00
% (0
.00)
0.00
% (0
.00)
0.00
% -
0.
00%
-
0.00
% (0
.00)
0.00
% (0
.00)
(xvi
ii)Sk
etch
Rea
l Est
ate
Priv
ate
Lim
ited
-0.0
1% (0
.08)
0.00
% (0
.00)
0.02
% (0
.08)
0.00
% (0
.00)
0.00
% -
0.
00%
-
0.02
% (0
.08)
0.00
% (0
.00)
(xix
)To
pval
ue R
eal E
stat
e D
evel
opm
ent L
imite
d -
-
2.
91%
43.
93
0.00
% -
-
--
--
--
--
(xx)
Goo
dhom
e R
ealty
Li
mite
d (N
ote
2)1.
78%
18.
97
-
-
-
-
-
-
0.00
% -
-
-
0.
00%
-
-
-
(xxi
)R
R M
ega
City
Bui
lder
s Li
mite
d (N
ote
2)1.
49%
15.
94
-
-
-
-
-
-
0.00
% -
-
-
0.
00%
-
-
-
(xxi
i)R
ockfi
rst R
eal E
stat
e Li
mite
d (N
ote
4)-1
3.26
% (1
41.3
1) -
-
-
-
-
-
0.
00%
-
-
-
0.00
% -
-
-
(xxi
ii)Tr
uew
in R
ealty
Lim
ited
(Not
e 2)
-4.5
3% (4
8.26
) -
-
-
-
-
-
0.
00%
-
-
-
0.00
% -
-
-
CSt
ep d
own
subs
idia
ries
(i)Pe
nins
ula
GSG
MH
P Pr
ojec
t (AO
P) -
-
-
-
-
-
0.00
% (0
.00)
0.00
% -
0.
00%
-
0.00
% -
0.
00%
(0.0
0)
(ii)
Arge
nto
Rea
l Est
ate
LLP
-
-
0.00
% 0
.01
-
-
0.00
% (0
.00)
0.00
% -
0.
00%
-
0.00
% -
0.
00%
(0.0
0)
(iii)
Gor
ena
Rea
l Est
ate
LLP
-
-
0.00
% 0
.01
-
-
0.00
% (0
.00)
0.00
% -
0.
00%
-
0.00
% -
0.
00%
(0.0
0)
(iv)
Max
is R
eal E
stat
e LL
P -
-
0.
00%
0.0
1 -
-
0.
00%
(0.0
0)0.
00%
-
0.00
% -
0.
00%
-
0.00
% (0
.00)
(v)
Neb
usta
r R
eal E
stat
e LL
P -
-
0.
00%
0.0
0 -
-
0.
00%
(0.0
0)0.
00%
-0.
00%
-
0.00
% -
0.
00%
(0.0
0)
(vi)
Reg
ena
Rea
l Est
ate
LLP
-
-
0.00
% 0
.01
-
-
0.00
% (0
.00)
0.00
% -
0.
00%
-
0.00
% -
0.
00%
(0.0
0)
(vii)
East
gate
Rea
l Est
ate
LLP
-
-
0.00
% (0
.00)
-
-
0.00
% (0
.00)
0.00
% -
0.
00%
-
0.00
% -
0.
00%
(0.0
0)
(viii
)W
estg
ate
Rea
l Est
ate
Dev
elop
ers
LLP
-
-
2.83
% 4
2.70
-
-
0.
00%
(0.0
1)0.
00%
-
0.00
% -
0.
00%
-
0.00
% (0
.01)
DAs
soci
ates
(in
clud
ing
step
do
wn
asso
ciat
es)
(i)JM
Rea
lty
Man
agem
ent P
riva
te
Lim
ited
(Not
e 1)
-
-
0.00
% 0
.03
-
-
0.27
% (0
.59)
0.00
% -
0.
00%
-
0.00
% -
0.
27%
(0.5
9)

215Annual Report 2017-18
Built for challenges. Preparing for growth.
Notes forming part of the Consolidated Financial Statements
Entit
yN
et A
sset
s Sh
are
in P
rofit
or
(Los
s)Sh
are
in O
ther
Com
preh
ensi
ve
Inco
me
Shar
e in
Tot
al C
ompr
ehen
sive
Inco
me
31-M
ar-1
831
-Mar
-17
31-M
ar-1
831
-Mar
-17
31-M
ar-1
831
-Mar
-17
31-M
ar-1
831
-Mar
-17
% o
f co
nsol
i-da
ted
net
asse
ts
Am
ount
%
of
cons
oli-
date
d ne
t as
sets
Am
ount
% o
f con
-so
lidat
ed
profi
t or
(loss
)
Am
ount
% o
f con
-so
lidat
ed
profi
t or
(loss
)
Am
ount
% o
f con
-so
lidat
ed
OCI
Am
ount
% o
f con
-so
lidat
ed
OCI
Am
ount
% o
f con
-so
lidat
ed
tota
l co
mpr
e-he
nsiv
e in
com
e
Am
ount
% o
f con
-so
lidat
ed
tota
l co
mpr
e-he
nsiv
e in
com
e
Am
ount
(ii)
SEW
Eng
inee
ring
(In
dia)
Pri
vate
Lim
ited
(Not
e 1)
-
-
0.42
% 6
.39
-
-
-0.0
3% 0
.06
0.00
% -
0.
00%
-
0.00
% -
-0
.03%
0.0
6
(iii)
RA
Rea
lty V
entu
res
LLP
-
-
-1.3
1% (1
9.74
) -
-
8.
95%
(19.
41)
0.00
%-
0.00
% -
0.
00%
-
8.95
% (1
9.41
)
(iv)
Goo
dhom
e R
ealty
Li
mite
d (N
ote
2) -
-
0.
29%
4.3
4 -
-
0.
19%
(0.4
1)0.
00%
-
0.00
% -
0.
00%
-
0.19
% (0
.41)
(v)
RR
Meg
a Ci
ty B
uild
ers
Lim
ited
(Not
e 2)
-
-
0.12
% 1
.88
-
-
1.30
% (2
.82)
0.00
% -
0.
00%
-
0.00
% -
1.
30%
(2.8
2)
(vi)
Roc
kfirs
t Rea
l Est
ate
Lim
ited
(Not
e 4)
-
-
-0.1
2% (1
.86)
-
-
1.56
% (3
.39)
0.00
% -
0.
00%
-
0.00
% -
1.
56%
(3.3
9)
(vii)
True
win
Rea
lty L
imite
d (N
ote
2) -
-
0.
00%
0.0
3 -
-
0.
24%
(0.5
2)0.
00%
-
0.00
% -
0.
00%
-
0.24
% (0
.52)
(viii
)To
p Va
lue
Rea
l Est
ate
Dev
elop
men
t Lim
ited
(Not
e 3)
-
-
- -
-
-
0.
01%
(0.0
2)0.
00%
-
0.00
% -
0.
00%
-
0.01
% (0
.02)
EJo
int V
entu
re
(i)
Bri
dgev
iew
Rea
l Est
ate
Dev
elop
men
t LLP
-0
.98%
(10.
48)
-0.2
7% (4
.09)
1.44
% (6
.40)
1.84
% (4
.00)
0.00
% -
0.
00%
-
1.44
% (6
.40)
1.84
% (4
.00)
(ii)
Peni
nsul
a B
rook
field
Tr
uste
e Pr
ivat
e Li
mite
d
0.00
% 0
.05
0.00
% 0
.04
0.00
% 0
.01
0.00
% 0
.01
0.00
% -
0.
00%
-
0.00
% 0
.01
0.00
% 0
.01
(iii)
PenB
rook
Cap
ital
Advi
sors
Pri
vate
Li
mite
d
0.56
% 6
.02
0.37
% 5
.56
-0.1
1% 0
.49
-0.2
7% 0
.59
-9.0
8% (0
.03)
-9.8
1% 0
.01
-0.1
0% 0
.46
-0.2
7% 0
.59
(iv)
Hem
Infr
astr
uctu
re
and
Prop
erty
D
evel
oper
s Pr
ivat
e Li
mite
d
4.80
% 5
1.13
3.
52%
53.
16
-1.0
1% 4
.49
-0.0
4% 0
.08
0.00
%-
0.00
% -
-1
.01%
4.4
9 -0
.04%
0.0
8
Tota
l13
8.25
% 1
,473
.72
141.
69%
2,1
39.1
2 97
.31%
(432
.18)
105.
06%
(227
.90)
81.7
7% 0
.27
93.7
6% (0
.07)
97.3
2% (4
31.9
1)10
5.06
% (2
27.9
6)N
on C
ontr
ollin
g In
tere
st in
Sub
sidi
arie
s8.
33%
88.
78
-4.9
8% (7
5.23
)1.
89%
(8.4
0)2.
55%
(5.5
3)18
.18%
0.0
6 0.
00%
-1.
91%
(8.4
6)2.
55%
(5.5
3)
Inte
rcom
pany
el
imin
atio
n an
d co
nsol
idat
ion
adju
stm
ents
-46.
58%
(496
.55)
-36.
70%
(554
.13)
0.80
% (3
.55)
-7.6
1% 1
6.52
0.
05%
0.0
0 6.
24%
(0.0
0)0.
80%
(3.5
5)-7
.61%
16.
51
Tota
l10
0% 1
,065
.95
100%
1,5
09.7
6 10
0% (4
44.1
3)10
0% (2
16.9
1)10
0.00
% 0
.33
100%
(0.0
7)10
0.00
% (4
43.8
0)10
0.00
% (2
16.9
8)
Amou
nt `
in C
rore
s
Not
e 1
: Cla
ssifi
ed a
s in
vest
men
t hel
d fo
r sa
le a
s at
Mar
ch 3
1, 2
018
Not
e 2
: Ste
p-do
wn
asso
ciat
e w
hich
bec
ame
a su
bsid
iary
w.e
.f. M
arch
31,
201
8N
ote
3 : J
oint
ven
ture
whi
ch b
ecam
e a
step
dow
n su
bsid
iary
w.e
.f. M
arch
31,
201
7N
ote
4 : A
ssoc
iate
whi
ch b
ecam
e a
subs
idia
ry w
.e.f.
Mar
ch 3
1, 2
018

216 Peninsula Land Limited
Financial Statements
Notes forming part of the Consolidated Financial Statements
51 Corporate Social Responsibility Expenditure (CSR) Disclosure as required under Section 135 of Companies Act, 2013, read with Companies (Corporate Social Responsibility
Policy) Rules, 2014 are as under:
a Gross amount required to be spent by the Group during the year Rs. Nil (31st March 2017 - Nil)
b CSR expenditure incurred during the year
(` in Crores)Particulars In cash Yet to be paid in
cashTotal
On Construction/acquisition of any asset - - - (-) (-) (-)
On purposes other than (i) above (refer note) - - -
(1.65) (-) (1.65)Figures in bracket pertain to previous year
The Group undertakes its Corporate Social Responsibility (CSR) activities through Urvi Ashok Piramal Foundation. The foundation operates in areas of health, vocational skill training, environment and education. The Group has contributed ` Nil (31st March 2017 - ` 1.65 Crores) to the foundation for undertaking CSR activities as defined under CSR rules.
52 Capital Management The Group’s policy is to maintain a strong capital base so as to maintain investor, creditor and market confidence and to
sustain future development of the business. Management monitors the return on capital as well as the level of dividends to ordinary shareholders.
The Group manages its capital structure and makes adjustments in light of changes in economic conditions and the requirements of the financial covenants. The Board of Directors seeks to maintain a balance between the higher returns that might be possible with higher levels of borrowings and the advantages and security afforded by a sound capital position.
The Group monitors capital using a ratio of ‘adjusted net debt’ to ‘adjusted equity’ (gearing ratio). For this purpose, adjusted net debt is defined as total liabilities, comprising interest-bearing loans and borrowings less cash and cash equivalents.
The Group's adjusted net debt to equity ratio as at year end is as follows.
(` in Crores) Year Ended
2017-18 Year Ended
2016-17Total Debt 2,802.87 2,561.59 Less : Cash and cash equivalent 53.23 82.45 Adjusted Net Debt 2,749.64 2,479.14 Total Equity 1,065.95 1,509.75 Less : Hedging Reserve - - Adjusted Equity 1,065.95 1,509.75 Gearing Ratio 2.58 1.64
53 Tax Expense
a Amounts recognised in Profit or Loss(` in Crores)
Year Ended 2017-18
Year Ended 2016-17
Current Income Tax 1.01 1.30 Deferred Tax Expense 2.81 41.22 Tax expense / (benefit) for the year 3.82 42.52

217Annual Report 2017-18
Built for challenges. Preparing for growth.
Notes forming part of the Consolidated Financial Statements
b Amounts recognised in Other Comprehensive Income
(` in Crores)Particulars 2017-18
Before tax Tax (expense)/benefit
Net off tax
Items that will not be reclassified to profit or lossRemeasurements of defined benefit plans 0.52 (0.25) 0.27 Total 0.52 (0.25) 0.27
(` in Crores)Particulars 2016-17
Before tax Tax (expense)/benefit
Net off tax
Items that will not be reclassified to profit or lossRemeasurements of defined benefit plans (0.11) 0.04 (0.07)Total (0.11) 0.04 (0.07)
c Reconciliation of Effective Tax Rate
(` in Crores) Year Ended
2017-18 Year Ended
2016-17Profit / (Loss) before tax (454.36) (177.13)Tax using the Group’s domestic tax rate - 34.94% (31 March 2017 - 34.61%) (145.56) (61.30)Tax effect of:DTA not created on Business losses 121.35 117.88 Permanent Disallowances 0.01 (12.86)Exempt Income (0.09) (0.14)Impact of change in tax rate / differential tax rate applicable (12.98) 28.00 Deduction under Section 24 of the Income Tax Act 1961 (0.05) (0.03)Others 41.14 (29.03)
3.82 42.52
Since the Group has incurred loss during the year ended 31st March 2018 and on virtual certainty basis as per requirements of IND AS 12 on Income Tax Para 36, the Group has not created deferred tax assets on carried forward business losses and hence, effective tax rate calculation will not be represent appropriate rate of tax.
d Major components of deferred tax assets and liabilities are:
(` in Crores)
March 31, 2018 Opening Net Balance Recognised in profit or loss
Recognised in OCI
Acquired under Business Combination
Net Closing Balance
Unabsorbed Losses 7.65 - - - 7.65 Investment Property (54.86) - - - (54.86) Property Plant and Equipment (31.79) - - - (31.79)Inventories (5.53) - - - (5.53)Loans and Borrowings (5.08) - - (19.52) (24.60)Employee Benefits 0.04 (0.05) (0.25) - (0.26) Investment 30.74 (8.70) - - 39.44 Provisions 2.24 (0.50) - - 2.74 Other Current Asset 8.02 - - - 8.02 Other Items (0.25) - - - (0.25) MAT Credit 53.32 - - 1.77 55.09 Unadjusted Tax Credit 52.12 12.06 - - 40.06 Tax Assets/(Liabilities) 56.62 2.81 (0.25) (17.75) 35.71 Set off tax - - - - - Net Tax Assets/(Liabilities) 56.62 2.81 (0.25) (17.75) 35.71

218 Peninsula Land Limited
Financial Statements
Notes forming part of the Consolidated Financial Statements
(` in Crores)March 31, 2017 Opening Net Balance Recognised in profit or
loss Recognised
in OCINet Closing
BalanceUnabsorbed Losses 65.9 (58.25) - 7.65 Investment Property (54.86) - - (54.86)Property Plant and Equipment (31.75) (0.04) - (31.79)Inventories (5.53) - - (5.53)Loans and Borrowings (8.8) 3.72 - (5.08)Employee Benefits - - 0.04 0.04 Investment 16.11 14.63 - 30.74Provisions 2.53 (0.29) - 2.27 Other Current Asset 8.79 (0.77) - 8.02 Other Items - (0.28) - (0.28)MAT Credit 53.32 - - 53.32 Unadjusted Tax Credit 52.12 - - 52.12Tax Assets/(Liabilities) 97.83 (41.25) 0.04 56.62 Set off tax - - - - Net Tax Assets/(Liabilities) 97.83 (41.25) 0.04 56.62
Positive Balances represent deferred tax assets and negative balances represent deferred tax liability.
54 Segment Reporting Based on the "Management Approach" as defined in Ind AS 108 - Operating Segments, the Chief Operating Decision Maker
(CODM) evaluates the Group's performance and allocates resources based on an analysis of various performance indicators of business, the segments in which the Company operates. The Company is primarily engaged in the business of real estate development which the Management and CODM recognise as the sole business segment. Hence disclosure of segment- wise information is not required and accordingly not provided.
55 Joint Operation The Group's share of interest in joint operations as at 31 March 2018 is set out below. The principal place of business of all
these joint operations is in India.
Name of the Project % of area sharing within the Project to project partner * Name of the joint operation partner
Principal activitiesAs at
31-Mar-18 31-Mar-17Celestia Spaces 36.00% 36.00% HEM Bhattad AOP Real Estate Development
* The area sharing to the project partner is in addition to upfront payment made.
Classification of Joint Operation
The Holding Company has entered into an joint operation arrangement through a joint development agreement wherein the Holding Company is the developer and the other partner is land owner with other rights and obligations related to any other operation related matter as defined in the agreement. Rights and obligations related to project are defined in the agreement.
56 Investment Property
(i) Amount recognised in Statement of profit or loss for investment properties
(` in Crores) Year Ended
2017-18 Year Ended
2016-17A Rental income derived from investment properties 31.86 31.25 B Direct operating expenses (including repairs and maintenance) generating rental income 0.66 2.11 C Direct operating expenses (including repairs and maintenance) that did not generate rental income - - D Profit arising from investment properties before depreciation and indirect expenses (A - B - C) 31.20 29.14 E Depreciation 1.42 2.76 F Profit arising from investment properties before indirect expenses (D - E) 29.78 26.38

219Annual Report 2017-18
Built for challenges. Preparing for growth.
Notes forming part of the Consolidated Financial Statements
(ii) Contractual Obligations
Ensuring repairs and preventive maintenance of the property and payment of related municipal taxes.
(iii) Leasing Arrangements
(` in Crores)
Particulars As at 31-Mar-18
As at 31-Mar-17
Within 1 year 32.59 12.85 Later than 1 year but not later than 5 years 46.17 - Later than 5 years - - Total 78.76 12.85
(iv) Fair Value
The Group's investment properties consist of commercial properties in India. The management has determined that the investment properties consist of two classes of assets - land and building - based on the nature, characteristics and risks of each property.
(` in Crores)Particulars As at
31-Mar-18 As at
31-Mar-17Carrying value of investment property - 1 288.74 290.09Carrying value of investment property - 2 1.64 1.67
As at Dec 21, 2017 the fair values of investment property 1 is ` 339.36 crores. The fair value of investment property has been determined by external, independent property valuers, having appropriate recognized professional qualification and recent experience in the location and category of the property being valued.
The management is of the opinion that there would not be any significant change in the fair value of investment property between the valuation date and the reporting date.
Further the valuer has used rent capitalisation approach to arrive at the fair value. Under this approach, the rent received by the lessor less outings is capitalised with a safe rate of return. The determination of the fair value of investment properties requires the use of estimates such as gross average rental, property taxes, capitalisation rate etc.
In respect of Investment property 2, the stamp duty ready reckoner value as at March 31, 2018 as determined by the management is ` 9.36 crores.
Investment properties Valuation Technique
Significant unobservable inputs
Average
Land and building Rent Capitalisation Technique
Estimated gross avg. rental value per sq. ft. per month
214.06
Capitalisation rate 8.80%
57 Goodwill
Particular 31-Mar-18 31-Mar-17Opening balance of gross carrying amount 20.91 20.91 Additions - - Disposals - - Impairments - Considered as exceptional items (11.64) - Other adjustments - (Goodwill written off) (2.28) - Closing balance of gross carrying amount 6.99 20.91
The Company has impaired the equity investments in subsidiary on the basis of the cash flow projections /estimate of the SPVs. On this estimate Group has impaired/written off the goodwill of the SPVs in the consolidated financial statements.

220 Peninsula Land Limited
Financial Statements
Notes forming part of the Consolidated Financial Statements
58 Standards issued but not effective
a Ind AS 115 Revenue from Contracts with Customers
On March 28, 2018, the Ministry of Corporate Affairs (MCA) has notified Indian Accounting Standard (Ind AS) 115, Revenue from Contracts with Customers. Ind AS 115 introduces a five-step model to revenue recognition:
Step 1: Identify the contract(s) with a customerStep 2: Identify the performance obligations in the contractStep 3: Determine the transaction priceStep 4: Allocate the transaction price to the performance obligations in the contractStep 5: Recognise revenue when (or as) the entity satisfies a performance obligation
Under Ind AS 115, revenue is recognised when (or as) the entity satisfies a performance obligation by transferring a promised good or service (i.e., an asset) to a customer (i.e., when (or as) the customer obtains control of that asset) at an amount that reflects the consideration to which the entity expects to be entitled in exchange for transferring goods or services to a customer. The new revenue standard will supersede all current revenue recognition requirements under Ind AS. Either a full retrospective application or a modified retrospective application is required for accounting periods commencing on or after April 1, 2018.
The Group will adopt Ind AS 115 effective from April 1, 2018. As at the date of issuance of the company’s financial statements, the Group is in the process of evaluating the requirements of the said standard and the impact on its financial statements in the period of initial application.
59 Amendments to Standards applicable to the Company
a Amendments to Ind AS 12 Recognition of Deferred Tax Assets for Unrealised Losses
The amendments clarify that an entity needs to consider whether tax law restricts the sources of taxable profits against which it may make deductions on the reversal of that deductible temporary difference. Furthermore, the amendments provide guidance on how an entity should determine future taxable profits and explain the circumstances in which taxable profit may include the recovery of some assets for more than their carrying amount.
Entities are required to apply the amendments retrospectively. However, on initial application of the amendments, the change in the opening equity of the earliest comparative period may be recognised in opening retained earnings (or in another component of equity, as appropriate), without allocating the change between opening retained earnings and other components of equity. Entities applying this relief must disclose that fact.
These amendments are effective for annual periods beginning on or after 1 April 2018. These amendments are not expected to have any impact on the Group as the Group has no deductible temporary differences or assets that are in the scope of the amendments.
b) Appendix B to Ind AS 21 Foreign currency transactions and advance Consideration
The Appendix clarifies that, in determining the spot exchange rate to use on initial recognition of the related asset, expense or income (or part of it) on the derecognition of a non-monetary asset or non-monetary liability relating to advance consideration, the date of the transaction is the date on which an entity initially recognises the non-monetary asset or non-monetary liability arising from the advance consideration. If there are multiple payments or receipts in advance, then the entity must determine the transaction date for each payment or receipt of advance consideration.
Entities may apply the Appendix requirements on a fully retrospective basis. Alternatively, an entity may apply these requirements prospectively to all assets, expenses and income in its scope that are initially recognised on or after:
(i) The beginning of the reporting period in which the entity first applies the Appendix, or
(ii) The beginning of a prior reporting period presented as comparative information in the financial statements of the reporting period in which the entity first applies the Appendix.
The Appendix is effective for annual periods beginning on or after 1 April 2018. However, since the Group’s current practice is in line with the interpretation, the Group does not expect any effect on its consolidated financial statements.

221Annual Report 2017-18
Built for challenges. Preparing for growth.
Notes forming part of the Consolidated Financial Statements
c. Transfers of Investment Property — Amendments to Ind AS 40
The amendments clarify when an entity should transfer property, including property under construction or development into, or out of investment property. The amendments state that a change in use occurs when the property meets, or ceases to meet, the definition of investment property and there is evidence of the change in use. A mere change in management’s intentions for the use of a property does not provide evidence of a change in use.
Entities should apply the amendments prospectively to changes in use that occur on or after the beginning of the annual reporting period in which the entity first applies the amendments. An entity should reassess the classification of property held at that date and, if applicable, reclassify property to reflect the conditions that exist at that date. Retrospective application in accordance with Ind AS 8 is only permitted if it is possible without the use of hindsight.
The amendments are effective for annual periods beginning on or after 1 April 2018. The Group will apply amendments when they become effective. However, since Group's current practice is in line with the clarifications issued, the Group does not expect any effect on its consolidated financial statements.
60 Previous year figures have been regrouped / reclassified wherever necessary to conform to current year's classification.
As per our report of even date For and on behalf of the Board of Directors of Peninsula Land LimitedFor S R B C & CO LLP Sd/- Sd/- Sd/- Chartered Accountants Urvi A. Piramal Rajeev A. Piramal Mahesh S. GuptaICAI Firm registration number: 324982E/E300003 Non Executive Chairperson Executive Vice Chairman & Group Managing DirectorSd/- DIN 00044954 Managing Director DIN 00046810 per Sudhir Soni DIN 00044983Partner Sd/- Sd/- Sd/- Sd/- Membership No.: 41870 Nandan A. Piramal Bhavna Doshi Bharat Sanghavi Rajashekhar Reddy Whole Time Director Director Chief Financial Officer Company SecretaryPlace : Mumbai DIN 00045003 DIN 00400508
Date: May 23, 2018

Notes

Notes

Notes

PENINSULA LAND LIMITEDRegd. Office: Peninsula Spenta, Mathuradas Mills Compound,
Senapati Bapat Marg, Lower Parel, Mumbai – 400 013Telephone No.: +91 022-6622 9300; Fax No.: +91 022 – 6622 9302 Website: www.peninsula.co.in, email:[email protected]
ATTENDANCE SLIP(To be presented at the entrance)
I/We hereby record my/our presence at the 146th Annual General Meeting of the Company held at Monday, August 6, 2018, at 03:00 p.m. at Hall of Culture, Nehru Centre, Dr. Annie Besant Road, Worli, Mumbai – 400 018
Folio No. / *Client ID No.:-……...……………........……..…………………..........................………*DP ID No.:-.........……….……………………….............
Number of shares held : .………………………....…………………..…………………..………………..…………………..…………………..…………………..……………
Name of the Member : …................................................………………………………. Signature : …………………………………………….………………….
Name of Proxy holder : …................................................………………………………. Signature : …………………………………………….………………….
*Applicable for investors holding shares in electronic form
Notes:
1. Only Member / Proxy holder / can attend the Meeting.
2. Member/ Proxy holder should bring his / her copy of the Annual Report for reference at the Meeting.
!


PENINSULA LAND LIMITEDRegd. Office: Peninsula Spenta, Mathuradas Mills Compound,
Senapati Bapat Marg, Lower Parel, Mumbai – 400 013Telephone No.: +91 022-6622 9300; Fax No.: +91 022 – 6622 9302 Website: www.peninsula.co.in, email:[email protected]
Form No. MGT -11
PROXY FORM[Pursuant to section 105(6) of the Companies Act, 2013 and Rule 19(3) of the Companies (Management and Administration) Rules, 2014]
Name of the Member (s):- …………………………..……………………………………..…………………………………………………...…………………………………………………………...
Address :- ………………………………………………………………………………………………………..……………..………………………………….…........……………………………………...
E-mail id :- ………………………………………………………………………………………....……………………..……..…………………………………………………...……………………………
Folio No. / *Client ID No.:-……...……………........……..…………………..........................………*DP ID No.:-.........……….………………………............................………
*Applicable for investors holding shares in electronic form
I/We, being the member (s) of……………….......................................…………. shares of Peninsula Land Limited, hereby appoint
1. Name : …………….…………………….…………………….…………………………………………………………………………………………..………………………………
Address : ………………………………………………………………………………………………………………………………………….........………………………………
…………………………………………………………………………………………………………………………………......………………………………………………………
E-mail Id: …………….....................……............……...……………………………………………... Signature :…............………………………………………
or failing him
2. Name : …………….……………………………………………………………………………………………………………………………………………………………………
Address : …………………………………………………………………………………………………………………………………………………………………………………
…………………………………………………………………………………………………………………………………........………………………………………………………
E-mail Id:……....................................……………………..…………………………………………... Signature :…………………………………………………....
or failing him
3. Name : …………….………………………………………………………………………………………………………………………………………………………………………
Address : …………………………………………………………………………………………………………………………………………………..................………………
…………………………………………………………………………………………………………………………………........……………………………….........………………
E-mail Id:- ….........………………………………………………………………………………………... Signature :…………………………………………………........
as my/our proxy to attend and vote (on a poll) for me/ us and on my/ our behalf at the 146th Annual General Meeting of the Company, to be held on Monday, August 6, 2018, at 03:00 p.m. at Hall of Culture, Nehru Centre, Dr. Annie Besant Road, Worli, Mumbai – 400 018 and at any adjournment thereof in respect of such resolutions as are indicated below:
Ordinary Resolution :1. To receive, consider and adopt the Standalone and Consolidated Financial Statements of the Company for the Financial Year
ended March 31, 2018 and the Reports of the Directors and Auditors thereon.2. To appoint a Director in place of Mr. Nandan A. Piramal (DIN: 00045003), who retires by rotation and is eligible for re-
appointment.3. To ratify the appointment SRBC & Co. LLP (FRN–324982E/ E300003) as the Statutory Auditors of the Company.
Special Resolution: 1. To consider and approve managerial remuneration payable to Mr. Rajeev A. Piramal, Executive Vice-Chairman and Managing
Director.2. To consider and approve managerial remuneration payable to Mr. Nandan A. Piramal, Whole-Time Director.3. To consider and approve managerial remuneration payable to Mr. Mahesh S. Gupta, Group Managing Director.4. Issue of Non-Convertible Debentures on Private Placement Basis.
Signed this…………………………………. Day of ……………………. 2018
Signature of shareholder ……………………………………………………………………………………….
Signature of Proxy holder(s)……………………………………………………………………………………
Note: This form of proxy in order to be effective should be duly completed and deposited at the Registered Office of the Company, not less than 48 hours before the commencement of the Meeting.
!


Peninsula SpentaMathuradas Mills Compound,Senapati Bapat Marg,Lower Parel, Mumbai - 400 013Tel.: + 91 22 66229300www.peninsula.co.in