10-19-21A F T
85
DELAWARE POPULATION CONSORTIUM ANNUAL POPULATION PROJECTIONS October 31, 2021 Version 2021.0 Dover, Delaware D R A F T 10-19-21
Transcript of 10-19-21A F T

DELAWARE POPULATION CONSORTIUM ANNUAL POPULATION PROJECTIONS October 31, 2021 Version 2021.0 Dover, Delaware
D R A F T
10-19
-21

Table of Contents
Introduction ........................................................................................................................ 1 History ................................................................................................................................ 2 Methodology ....................................................................................................................... 5
A. Population Projections 2010 to the Year 2050
State of Delaware ......................................................................................................A-1
Kent County .............................................................................................................A-12
City of Dover .......................................................................................................A-23
New Castle County ..................................................................................................A-25
City of Newark ....................................................................................................A-36
City of Wilmington .............................................................................................A-38
Sussex County .........................................................................................................A-48
Map of Delaware .....................................................................................................A-59 B. Appendices (Supplemental Estimates, Projections and Population Pyramids)
Appendix 1
ACS Place Estimates (2010-2019) and Place Projections 2020-2050 .....B-1
Appendix 2
Seasonal Population Projections by County ............................................B-4
Appendix 3
Delaware Population Pyramids 2020 and 2050 .......................................B-6
Appendix 4
Population Pyramids Delaware Counties 2020 and 2050 .......................B-7
D R A F T
10-19
-21

1
Introduction
The Delaware Population Consortium (DPC) is pleased to continue its program of providing
40-year population and employment projections for the State, the counties, and for selected
municipalities. (The DPC was codified by the State in 2019 with its inclusion in Title 29 of the Delaware
Code by SB7). These projections incorporate new information provided to or generated by DPC
members and other agencies at the federal, state, and local level through 2019.
The 2021 version Delaware Population Projections Series is published in PDF format and as a
series of EXCEL spreadsheets on the web site of the Delaware Population Consortium.1 This site also
contains supporting materials, information about the Consortium, and any special reports or studies
published by the Consortium. This is the last version which terminates in 2050. The 2020-2060 version
will begin next year after we have had access to the most detailed version of the 2020 Census. The
current version does reflect 2020 total populations although modified to move from April 1 to July 1.
The 2020 information was extracted from the Redistricting release of the 2020 Census. In addition,
information gleaned from the five-year version of the 2019 American Community Survey also inform
the projections.
The 2020 projections reflect an increase of 60,000 in the state’s total population in 2050 over
last year’s projections at 2050. This is largely due to the addition of 12,000 people from the 2020
Decennial Census. These data incorporate the actual births and deaths since 2010, the latest Census
Bureau estimates, and the latest migration data from the IRS from 2019. Internally, Kent County
projections increased by roughly 15,000 as of 2050, with an increase of 8,000 in Sussex County. New
Castle County projections increased by roughly 37,000 by 2050 over the previous projection.
In 1997, the DPC issued its first set of projections and estimates on special topics of interest to
policy-makers, planners, and the general public related to the annual projections. Projections are
provided for all municipalities in the state. More detailed projections are provided for Dover, Newark,
and Wilmington. In addition, projections of populations residing in normally vacant seasonal units in
the period June through August are offered for discussion. These projections do not include populations
in hotels, motels, camp grounds, and RV sites or day trippers. These are all under study this year and
will be reported when formalized.
1 https://stateplanning.delaware.gov/demography/dpc.shtml
D R A F T
10-19
-21

2
History
There were many generators of population projections prior to the founding of the Delaware
Population Consortium in 1975. Every new state or local jurisdiction’s capital project or proposed
program seemed to generate a new set of projections. Few were comprehensive in content or geographic
coverage. Most studies provided only statewide or, at best, countywide coverage. Other studies were
localized to single school districts or sewer districts. These projections were often developed to deal
with specific issues, and included projections of the elderly population, of school-age children, or simply
the number of households.
These projections were rarely produced with standardized, accepted methodologies. There was
no assurance that common and nationally recognized techniques for forecasting and projecting were
used. Methodologies ranged from build-out scenarios based on existing zoning to straight-line
projection of past trends. They were frequently arbitrarily adjusted for “local factors.”
The resulting projections were inconsistent and conflicting. For example, there were six
different governmental reports on comprehensive development planning and population change in New
Castle County in the decade spanning the late 1950’s and 1960’s. Those studies included projections of
1980 County populations ranging from 512,900 persons to 672,000 persons versus the US Census
Bureau’s count of 398,115 persons living in New Castle County in 1980.
These six studies were generated by different interest groups and at different levels of
government. Each used different starting and ending points. There was no system to evaluate the results
over time, and no systematic approach to updating these projections. Many of these projections were
issued by consultants whose involvement ended with the completion of a contract.
The Delaware Population Consortium was formed in 1975, with the goal of “providing a
continuing forum for debate and discussion of matters relating to state and local population growth.2”
Parties interested in a common set of reliable projections were brought together under the sponsorship
of the State Planning Office; they called themselves the Delaware Population Consortium (DPC).
Although the State Planning Office provided sponsorship and technical support, direction was by
consensus of the participants. The University of Delaware’s Division of Urban Affairs prepared the
initial report under contract with the State Planning Office and financed through a comprehensive
planning grant from the US Department of Housing and Urban Development.
2 Delaware Population Growth, 1975: University of Delaware, Division of Urban Affairs
D R A F T
10-19
-21

3
The original core members of the DPC were from several departments of State government, the
three counties, the Cities of Newark and Wilmington, WILMAPCO (the federally designated
metropolitan planning organization for transportation), and the 208 Aerated Waste Treatment
Management Program, with technical and methodological assistance provided by the University of
Delaware. In time, the program and the DPC membership has grown to include statewide representation
from private utilities, citizens' groups, non-profit organizations, community, and business interests.
The DPC effort is guided by a set of objectives. They were developed early on and have been
virtually unchanged over the last 40 years. They include:
1. A single set of projections, in the public domain and widely disseminated to all users of
demographic data.
2. A long-term horizon of forty years starting with the most recent Decennial Census and
continuing by single (for selected years) and five-year intervals.
3. A single methodology fine-tuned over time.
4. A regular annual release date during the month of October of each year, to ensure a
predictable flow of information around which policy and decision-making can be built or
monitored.
5. On-going review and update as required.
6. Projections for a consistent set of geographic areas including the State, each county,
Wilmington, Dover and Newark.
The DPC is recognized in the Delaware Code Title 29 as of October 2019. The organization
consists of the Committee-of-the-Whole, a technical or steering committee, administrative support staff,
and technical support staff.
The Committee-of-the-Whole is composed of any group or persons who have an interest in
demographic projections. As a result, the composition of the committee-of-the-whole is never exactly
the same from year to year. The Committee-of-the-Whole usually gathers only for the annual meeting.
Its role is to comment on and adopt a projection series recommended by the steering committee.
The steering committee is composed of a core committee of professional demographers,
planners, analysts, economists, and other interested persons. Its role is to gather, monitor, and analyze
relevant information about changes in births, deaths, migration and employment.
D R A F T
10-19
-21

4
Volunteers are selected from the Committee-of-the-Whole to staff the project. The organization
is governed by a set of by-laws3. A committee Chair, a Vice-Chair, and a Secretary are elected annually.
The steering committee includes participants from the University of Delaware’s Center for
Applied Demography & Survey Research, the Delaware Department of Education, the Delaware Health
Statistics Center of the Delaware Department of Health and Social Services, the Delaware Office of
State Planning Coordination, the Delaware State Housing Authority, and members from the county and
city planning departments, WILMAPCO, The Dover/Kent MPO, and DELDOT.
The process used by DPC to produce an annual projection series is straightforward and is tied
to releases of information throughout the calendar year. The previous year’s projection series is
evaluated against annual US Census estimates (FSCPE). The Technical Committee identifies any
significant changes or newly recognized trends.
The steering committee deliberates and produces a draft report in tabular form. The draft and
revisions are produced during the spring months. The draft is then distributed to the members of the
Committee-of-the-Whole, based on the last annual meeting’s attendance, as well as any interested party.
The product and methodology are reviewed at an annual meeting, usually held in October. At
this time there is discussion of next year’s product, which may include changes or refinements in the
content of the projections, or how significant events might influence the base data and assumptions.
3 https://stateplanning.delaware.gov/demography/documents/dpc/dpc-by-laws.pdf
D R A F T
10-19
-21

5
Methodology
The projection process begins with the 2010 age-race-gender distribution adjusted to July 1,
2010 (obtained from the US Bureau of Census) for the jurisdiction being projected. This distribution is
comprised of 102 separate age cohorts beginning with the 0 age group and ending with the 100-and-
over age group. The 2010 counts are adjusted to the mid-year and 2010-2019 yearly FSCPE estimates
are used to benchmark these projections. The projections also reflect the 2019 race-gender-origin
distributions provided by the Census Bureau. The race component now utilizes new race categories,
namely white alone non-Hispanic, black alone non-Hispanic, Hispanic, and other non-Hispanic.
Appropriate survival rates, derived from Delaware mortality rates, are applied to each single-year, age-
race-gender cohort. A ten-year survival rate is used to account for mortality. Each age group has its
own unique survival rate. Applying the appropriate survival rate to the 0 age group, for example, yields
the likely number of persons alive in 2010 who will survive to age 1 in 2011. This procedure is followed
until all age groups have been survived with the exception of the birth cohort (age 0 in 2011).
The 0 age group in 2011 is formed from all of those persons expected to be born during the
2010-2011 period. This is estimated by applying an annual birth rate for females in each separate age
group beginning with 10 and ending with 49. For example, if the single-year fertility rate for females
age 30 is multiplied by the number of females in that age group in the base year, the result is the likely
number of births for those females over the one-year projection period. This is done for all relevant age
groups. These estimates are summed to produce the new birth cohort. The birth cohort is then survived
to 2015. This procedure is applied for each subsequent time period from 2011 to 2050. The end result
of this two-step process is a projection of population growth due solely to natural increase, which must
be adjusted for net migration.
The conventional procedure to adjust the projections for net migration is to calculate a migration
rate for each age-race-gender category for some past time period (such as 2005-2010), and to make
assumptions about how those rates will change in the future. This procedure works well if the migration
rates from the reference period accurately predict the future. If the nature of migration is changing, the
result will be unsatisfactory. The rapid change in migration during the 1980s, for example, stands in
stark contrast to that of the 1970s. To address that weakness, and to integrate employment projections
with the population projections, another method is used to estimate migration (see Migration on page
7). These estimates are modified based on the FSCPE components of population change issued annually.
D R A F T
10-19
-21
6
Mortality.
Mortality rates are based on age-by-sex-by-race/Hispanic origin, single-year survival rates
calculated from data on the deaths of Delaware residents from 2014-2018 and the underlying population
for each cohort in the 2014-2018 interval. Using actual deaths through 2019, survival rates are scaled
proportionately so the estimated number of deaths agrees with the actual data. This scaling procedure
was followed separately for the State, each of the counties, and the City of Wilmington, resulting in a
slightly different set of mortality assumptions for each. Projections for the cities of Newark and Dover
utilize the county-wide rates since the populations are considered too small to produce stable rates.
Fertility.
The assumptions for fertility rates were derived using births to Delaware residents from 2014-
2018 and the underlying female population groups from the same period. Using these as a base, the rates
were scaled proportionally to produce the estimated number of births in 2014-2019 using actual births
through 2018. Following the same procedures as in mortality above, estimated births in 2018 were
allowed to influence the 2019 projection. This scaling procedure was followed separately for the State,
each of the counties, and the City of Wilmington, resulting in a slightly different set of fertility
assumptions for each. Projections for the cities of Newark and Dover utilize the county-wide rates since
the populations are too small to produce stable rates.
Labor-force.
Resident employment is calculated to balance the employment forecast with the population
projections. This calculation requires a number of assumptions. The first is taken from the Bureau of
Census CPS March 2018-2020, which allows computation of the probability of labor force participation
for each age-sex/Hispanic origin cohort from 2020 through 2050. Applying these rates allows the
derivation of a theoretical labor-force. An unemployment rate is then applied to that theoretical labor-
force. That rate is the same as the one used in generating the employment forecasts. The result of this
calculation is employment by place of residence. Resident jobs are derived from employment by place
of residence by making adjustments for self-employment, agricultural jobs, and workers with multiple-
jobs. BLS also provides labor force estimates from the Current Population Survey (CPS), Local Area
Unemployment Statistics (LAUS), Current Employment Statistics (CES), and the Quarterly Census of
Employment and Wages (QCEW). These are blended to update current employment and establish a
starting point for forecasts.
Bureau of Labor Statistics' estimates and forecasts are used to establish an employment starting
point. A single adjustment is required to generate an estimate for resident jobs from the employment
D R A F T
10-19
-21

7
forecasts. Net commuting (i.e., in-commuters less out-commuters) is used to adjust the employment
forecast.
Migration.
Employment (i.e., number of jobs) is usually forecast using an economic model as opposed to
a demographic model. It is assumed that there will be a sufficient number of persons to fill those jobs.
If the projected population due to natural increase is too low, then net in-migration is required to fill the
jobs. Alternatively, if the projected population is too high, net out-migration will occur. In either case,
the migration rates from the reference year are modified proportionally to produce sufficient net
migration to allow the employment forecasts and the population projection to balance. The final amount
of net migration is an output of that calculation. If that estimate seems too high, adjustments must be
made to the employment forecasts or to one of the other assumptions in the labor-force estimate.
Adjustments.
Projecting population is a risky business and is dependent on the quality of the assumptions.
Those can change from year to year as better data becomes available. Thus, it is imperative that the
projections be reviewed annually. This report is the result of the Consortium's ongoing monitoring and
review process.
There are data that can be used to adjust the path of the projection without going through a major
revision. First, the annual population estimates (not forecasts) provided by the Federal State Cooperative
for Population Estimates (FSCPE) is useful for monitoring the total population. Second, actual birth
and death statistics issued by National Center for Health Statistics (NCHS) and the Delaware Health
Statistics Center are quite valuable. Third, school enrollment data, estimated migration from the Bureau
of Census and the IRS, Medicare enrollment data from HCFA, and the data from the Census Bureau’s
Current Population Survey (CPS) and American Community Survey (ACS) can help guide structural
changes in the age groups. The Census Bureau also annual provides single year estimates of the
population of the state. Finally, data from the US Department of Labor tracks changes in employment
growth. It is imperative that these indicators are tracked and that the projections are modified annually.
These projections were carefully benchmarked to known data in 2019 (e.g. actual births, deaths, and
estimated migration for 2011-2019).
D R A F T
10-19
-21

8
Seasonal populations.
Seasonal populations are those residing in what are usually considered “vacant seasonal” units
during the months of June through August. The principal assumptions are that these units will be
occupied 80% of the time including all weekdays and weekends. In addition, the size of the group in
residence during the period is assumed to be 2.64 persons. These factors were obtained from published
studies of seasonal populations in Florida and Michigan.
To calculate the number of housing units, the number of full-time households for each time
period 2015-2050 are taken from the latest DPC projections. The number of vacant units is estimated
using the number of full-time households divided by the typical occupancy rate observed in the previous
five-year periods. It is held constant over the entire projection period 2015-2050. The individual
categories of vacancies share the total vacancies observed in 2015. Then the numbers of vacant seasonal
residences calculated are expanded to population using the factors provided above. The American
Community Survey provides annual estimates of vacancy status including seasonal use which are
incorporated into the projections.
Municipal populations.
Two series were used provided. The first series is based on the compound annual growth rates
of population using as a base the 2010 Decennial Census population for each municipality which then
is applied over the period 2020-2050. A second series is based on the share of each city’s population of
the respective county’s population observed 2010-2019 and then projected for the period 2020-2050.
Annual population estimates for all Delaware municipalities are published annual and are used to bench
mark the projections.
D R A F T
10-19
-21

9
Notes.
All fertility, mortality, and migration assumptions have changed to better reflect conditions in
2019.
One other point needs clarification. In the 2010 Census, respondents were permitted to check
up to six races. The projection process cannot cope with that differentiation since mortality, fertility, and
migration rates would have to be calculated for very small groups. To avoid that problem, all multiple
race individuals were reclassified to the Other race non-Hispanic category.
Finally, there are several categories on the summary page for the State and each county that
require definition:
Population Change - The net increase (decrease) in persons over the projected period;
Births - The total number of births over the over the projected period;
Deaths - The total number of deaths over the projected period;
Net Migration - The total number of persons moving into the area less the number of persons leaving
the area over the projected period;
Household Change - The net increase (decrease) in households over the projected period, which is
indicative of the number of housing units required;
Jobs by Place of Work - The number of jobs held by civilians working in the area for the projected
period excluding self-employed, private household workers, and those directly working on farms;
Jobs by Residence - The number of jobs held by the employed persons for the projected period,
including the jobs of persons who hold more than one job;
Net Commuting - The number of persons coming into the area to work each day less the number of
persons leaving the area to work each day during the projected period;
D R A F T
10-19
-21

D R A F T
10-19
-21

Delaware Population Consortium
Population Projection Series
October 31, 2021
State of DelawareTotal Population
[As of July 1]
2010 2015 2020 2025 2030 2035 2040 2045 2050
Population 899,600 939,823 992,035 1,018,473 1,042,869 1,065,740 1,085,592 1,101,853 1,115,712
Households 328,808 350,196 365,707 376,970 386,479 394,315 399,407 402,519 403,892
Population Change* 40,223 52,212 26,438 24,396 22,871 19,852 16,261 13,859
Births* 55,190 54,274 53,188 52,501 52,654 53,113 52,708 51,841
Deaths* 40,324 45,375 50,665 56,433 62,407 67,571 70,864 72,401
Net Migration* 25,357 43,313 23,915 28,328 32,624 34,310 34,417 34,419
Household Change* 21,388 15,511 11,263 9,509 7,836 5,092 3,112 1,373
Total Labor Force 441,771 475,214 494,209 498,883 504,941 511,486 517,509 522,325 525,999
Civilian 439,058 472,501 491,496 496,170 502,228 508,773 514,796 519,612 523,286
Employed 400,990 445,331 471,837 476,323 482,139 488,422 494,204 498,828 502,355
Private 323,549 359,430 380,402 383,779 388,262 393,135 397,540 400,914 403,266
Government 56,221 62,300 66,214 66,915 67,784 68,736 69,687 70,568 71,412
Self-Employed 20,503 22,807 24,376 24,774 25,225 25,670 26,083 26,442 26,762
Unpaid Family 717 794 845 855 868 881 894 904 915
Unemployed 38,068 27,170 19,659 19,847 20,089 20,351 20,592 20,784 20,931
Military 2,713 2,713 2,713 2,713 2,713 2,713 2,713 2,713 2,713
Jobs by Place of Work 400,019 432,007 456,269 459,773 464,640 470,108 475,116 478,966 481,649
Jobs by Residence 400,989 445,331 471,836 476,323 482,137 488,421 494,203 498,826 502,354
Net Commuting -970 -13,324 -15,567 -16,550 -17,497 -18,313 -19,087 -19,860 -20,705
*Represents a five-year total beginning with specified year
Version 2021.0 A-1
D R A F T
10-19
-21

Delaware Population Consortium
Population Projection Series
October 31, 2021
State of DelawareTotal Population
[As of July 1]
2010 2011 2012 2013 2014 2015 2016 2017 2018 2019 2020 2025 2030 2035 2040 2045 2050
0 - 4 55,783 55,681 55,714 52,919 52,332 52,390 52,433 55,075 55,085 55,126 55,186 54,197 54,095 55,068 56,060 55,823 55,169
5 - 9 56,360 56,275 56,509 57,145 57,698 57,736 57,712 57,777 57,589 57,115 57,648 56,231 55,524 55,778 56,955 58,021 57,765
10 -14 56,817 57,119 57,344 57,479 57,645 58,082 58,010 58,415 59,253 59,885 61,978 58,627 57,312 56,891 57,399 58,766 59,927
15 -19 64,330 62,166 60,103 58,257 57,963 57,878 58,446 58,795 59,152 59,451 61,517 63,401 59,557 58,332 58,111 58,862 60,455
20 -24 63,006 65,015 66,892 68,474 68,192 66,466 63,633 61,724 59,993 59,746 60,493 62,896 65,224 60,904 59,710 59,632 60,644
25 -29 57,741 58,530 59,172 59,627 60,736 63,402 66,592 69,119 70,488 70,394 69,001 61,774 64,744 67,543 62,631 61,421 61,491
30 -34 54,121 55,774 57,242 58,593 59,529 59,810 59,707 60,886 61,491 62,697 65,587 69,780 63,148 66,695 69,828 64,333 63,134
35 -39 55,030 52,981 51,795 51,736 52,983 54,825 57,072 58,367 59,910 60,948 62,099 66,200 70,550 64,525 68,480 71,903 65,907
40 -44 60,802 60,541 59,873 58,640 57,591 55,961 54,066 53,046 53,134 54,471 56,949 62,819 66,865 71,419 65,766 70,074 73,825
45 -49 67,367 66,437 65,855 64,980 63,541 62,198 61,633 61,187 60,167 59,235 57,940 57,633 63,788 67,803 72,369 67,001 71,667
50 -54 66,176 66,977 67,461 67,725 67,836 67,967 67,741 67,472 66,894 65,603 63,837 58,698 58,680 65,147 68,970 73,434 68,333
55 -59 58,235 60,070 61,685 63,290 64,972 66,592 68,036 68,961 69,634 70,023 69,329 64,332 59,621 59,832 66,460 69,951 74,239
60 -64 53,714 56,253 58,249 57,682 57,937 58,768 60,237 62,231 64,219 66,165 66,649 68,921 64,322 59,971 60,299 66,918 70,051
65 -69 42,150 43,251 44,405 47,881 50,402 52,565 54,915 57,057 56,764 57,124 56,770 64,196 66,801 62,600 58,624 59,105 65,576
70 -74 30,881 32,128 33,267 34,943 37,176 38,929 40,415 41,631 45,052 47,523 48,412 52,270 59,412 62,141 58,415 55,021 55,727
75 -79 23,927 24,082 24,505 24,986 26,102 27,493 28,367 29,490 31,087 33,143 33,922 42,382 45,828 52,342 54,934 51,857 49,235
80 -84 17,267 17,874 18,450 18,781 19,055 19,112 19,578 20,056 20,566 21,545 22,236 27,656 34,689 37,531 42,964 45,259 42,983
85 &up 15,893 16,233 16,893 17,806 18,755 19,649 20,410 21,206 21,912 22,552 22,482 26,460 32,709 41,218 47,617 54,472 59,584
Totals 899,600 907,387 915,414 920,944 930,445 939,823 949,003 962,495 972,390 982,746 992,035 1,018,473 1,042,869 1,065,740 1,085,592 1,101,853 1,115,712
Version 2021.0 A-2
D R A F T
10-19
-21

Delaware Population Consortium
Population Projection Series
October 31, 2021
State of DelawareTotal Population
[As of July 1]
2010 2011 2012 2013 2014 2015 2016 2017 2018 2019 2020 2025 2030 2035 2040 2045 2050
MALES
0 - 4 28,347 28,326 28,305 25,596 25,243 25,216 25,108 27,819 27,823 27,845 27,877 27,380 27,334 27,834 28,336 28,224 27,8915 - 9 28,695 28,679 28,785 29,028 29,208 29,283 29,346 29,354 29,238 29,025 29,174 28,424 28,070 28,206 28,807 29,348 29,221
10 -14 28,919 29,155 29,225 29,372 29,416 29,678 29,567 29,761 30,101 30,331 31,391 29,694 29,002 28,791 29,055 29,753 30,34015 -19 32,539 31,513 30,583 29,783 29,649 29,558 29,791 29,928 30,186 30,287 31,309 32,108 30,136 29,506 29,404 29,794 30,60420 -24 31,564 32,667 33,611 34,058 34,041 33,392 32,163 31,309 30,561 30,456 30,747 31,920 32,950 30,726 30,127 30,093 30,61625 -29 28,789 29,418 29,846 30,409 30,836 31,957 33,389 34,884 35,001 35,076 34,589 31,315 32,770 34,053 31,520 30,919 30,96730 -34 26,555 27,426 28,201 28,917 29,582 29,598 29,746 30,625 31,278 31,757 32,973 34,965 31,955 33,701 35,157 32,323 31,73735 -39 26,907 25,855 25,217 25,192 25,811 26,841 28,000 28,511 29,322 30,038 30,582 33,249 35,327 32,585 34,540 36,148 33,05440 -44 29,421 29,349 29,046 28,381 28,011 27,201 26,276 25,721 25,764 26,435 27,792 30,855 33,511 35,688 33,103 35,239 37,01845 -49 32,677 32,268 32,089 31,592 30,797 30,007 29,716 29,513 28,954 28,639 28,021 28,040 31,215 33,863 36,042 33,573 35,89350 -54 31,797 32,114 32,252 32,565 32,661 32,751 32,710 32,689 32,334 31,611 30,592 28,253 28,454 31,748 34,307 36,426 34,05755 -59 27,342 28,286 29,130 30,009 30,849 31,791 32,428 32,782 33,315 33,562 33,249 30,694 28,575 28,921 32,268 34,659 36,66260 -64 25,194 26,461 27,463 26,916 27,077 27,509 28,206 29,245 30,307 31,281 31,656 32,953 30,602 28,645 29,082 32,386 34,58065 -69 19,607 20,033 20,474 22,288 23,416 24,435 25,564 26,637 26,254 26,465 26,344 30,228 31,701 29,533 27,770 28,304 31,47570 -74 14,253 14,816 15,285 15,968 16,948 17,647 18,318 18,796 20,554 21,636 22,017 23,757 27,417 28,923 27,007 25,566 26,22675 -79 10,685 10,776 10,930 11,104 11,621 12,264 12,596 13,047 13,682 14,561 14,802 18,565 20,091 23,308 24,712 23,149 22,13180 -84 7,226 7,547 7,819 8,050 8,122 8,141 8,324 8,508 8,700 9,134 9,460 11,492 14,461 15,678 18,243 19,459 18,32185 &up 5,174 5,398 5,661 5,954 6,358 6,734 7,094 7,434 7,725 7,959 7,974 9,585 11,794 14,797 16,971 19,636 21,829Totals 435,691 440,087 443,922 445,182 449,646 454,003 458,342 466,563 471,099 476,098 480,549 493,477 505,365 516,506 526,451 534,999 542,622
FEMALES
0 - 4 27,436 27,355 27,409 27,323 27,089 27,174 27,325 27,256 27,262 27,281 27,309 26,817 26,761 27,234 27,724 27,599 27,2785 - 9 27,665 27,596 27,724 28,117 28,490 28,453 28,366 28,423 28,351 28,090 28,474 27,807 27,454 27,572 28,148 28,673 28,544
10 -14 27,898 27,964 28,119 28,107 28,229 28,404 28,443 28,654 29,152 29,554 30,587 28,933 28,310 28,100 28,344 29,013 29,58715 -19 31,791 30,653 29,520 28,474 28,314 28,320 28,655 28,867 28,966 29,164 30,208 31,293 29,421 28,826 28,707 29,068 29,85120 -24 31,442 32,348 33,281 34,416 34,151 33,074 31,470 30,415 29,432 29,290 29,746 30,976 32,274 30,178 29,583 29,539 30,02825 -29 28,952 29,112 29,326 29,218 29,900 31,445 33,203 34,235 35,487 35,318 34,412 30,459 31,974 33,490 31,111 30,502 30,52430 -34 27,566 28,348 29,041 29,676 29,947 30,212 29,961 30,261 30,213 30,940 32,614 34,815 31,193 32,994 34,671 32,010 31,39735 -39 28,123 27,126 26,578 26,544 27,172 27,984 29,072 29,856 30,588 30,910 31,517 32,951 35,223 31,940 33,940 35,755 32,85340 -44 31,381 31,192 30,827 30,259 29,580 28,760 27,790 27,325 27,370 28,036 29,157 31,964 33,354 35,731 32,663 34,835 36,80745 -49 34,690 34,169 33,766 33,388 32,744 32,191 31,917 31,674 31,213 30,596 29,919 29,593 32,573 33,940 36,327 33,428 35,77450 -54 34,379 34,863 35,209 35,160 35,175 35,216 35,031 34,783 34,560 33,992 33,245 30,445 30,226 33,399 34,663 37,008 34,27655 -59 30,893 31,784 32,555 33,281 34,123 34,801 35,608 36,179 36,319 36,461 36,080 33,638 31,046 30,911 34,192 35,292 37,57760 -64 28,520 29,792 30,786 30,766 30,860 31,259 32,031 32,986 33,912 34,884 34,993 35,968 33,720 31,326 31,217 34,532 35,47165 -69 22,543 23,218 23,931 25,593 26,986 28,130 29,351 30,420 30,510 30,659 30,426 33,968 35,100 33,067 30,854 30,801 34,10170 -74 16,628 17,312 17,982 18,975 20,228 21,282 22,097 22,835 24,498 25,887 26,395 28,513 31,995 33,218 31,408 29,455 29,50175 -79 13,242 13,306 13,575 13,882 14,481 15,229 15,771 16,443 17,405 18,582 19,120 23,817 25,737 29,034 30,222 28,708 27,10480 -84 10,041 10,327 10,631 10,731 10,933 10,971 11,254 11,548 11,866 12,411 12,776 16,164 20,228 21,853 24,721 25,800 24,66285 &up 10,719 10,835 11,232 11,852 12,397 12,915 13,316 13,772 14,187 14,593 14,508 16,875 20,915 26,421 30,646 34,836 37,755
Totals 463,909 467,300 471,492 475,762 480,799 485,820 490,661 495,932 501,291 506,648 511,486 524,996 537,504 549,234 559,141 566,854 573,090
Version 2021.0 A-3
D R A F T
10-19
-21

Delaware Population Consortium
Population Projection Series
October 31, 2021
State of DelawareWhite Alone Non-Hispanic Population
[As of July 1]
2010 2011 2012 2013 2014 2015 2016 2017 2018 2019 2020 2025 2030 2035 2040 2045 2050
0 - 4 27,474 27,473 27,907 25,978 26,329 26,809 27,535 29,610 29,474 29,396 27,785 26,028 24,109 22,795 22,470 22,524 22,279
5 - 9 29,339 29,016 28,716 28,648 28,462 28,044 27,638 28,054 28,445 28,783 27,933 27,654 26,094 24,313 23,026 22,683 22,721
10 -14 31,346 31,109 30,826 30,338 29,937 29,620 29,108 28,778 28,738 28,563 26,877 27,729 27,635 26,218 24,473 23,180 22,827
15 -19 37,174 35,441 33,845 32,466 31,910 31,464 31,164 30,802 30,350 30,010 28,377 26,692 27,634 27,639 26,248 24,511 23,214
20 -24 37,853 38,892 39,793 40,293 39,599 37,665 35,411 33,837 32,465 31,891 30,000 28,063 26,570 27,660 27,709 26,311 24,562
25 -29 33,828 34,262 34,581 34,824 35,522 37,213 38,976 39,516 40,346 39,758 36,180 29,906 28,150 26,809 27,909 27,955 26,533
30 -34 31,458 32,467 33,389 33,940 34,245 34,490 34,472 34,818 35,103 35,828 35,776 35,923 30,046 28,416 27,091 28,146 28,185
35 -39 33,138 31,265 30,146 29,758 30,458 31,429 32,624 33,567 34,170 34,519 33,203 35,469 35,865 30,303 28,656 27,297 28,307
40 -44 38,898 38,083 37,164 35,867 34,701 33,109 31,422 30,333 29,981 30,723 30,278 33,003 35,395 35,997 30,560 28,836 27,449
45 -49 46,268 44,808 43,735 42,567 40,974 39,485 38,409 37,543 36,343 35,249 32,165 30,228 33,172 35,645 36,279 30,890 29,076
50 -54 47,834 47,976 47,923 47,570 46,975 46,284 45,523 44,606 43,613 42,108 38,803 32,406 30,631 33,746 36,116 36,693 31,340
55 -59 43,764 44,722 45,664 46,389 47,251 48,115 48,744 48,999 48,935 48,555 45,825 39,195 32,999 31,245 34,361 36,494 37,000
60 -64 42,037 43,681 44,938 43,974 43,805 44,093 44,868 46,078 47,099 48,193 46,978 45,734 39,392 33,257 31,416 34,392 36,261
65 -69 34,021 34,694 35,411 38,189 39,893 41,174 42,635 43,978 43,221 43,138 41,521 45,285 44,439 38,349 32,337 30,482 33,241
70 -74 25,080 25,929 26,763 28,004 29,834 31,207 32,333 33,070 35,785 37,444 36,893 38,111 41,796 41,177 35,479 29,861 28,137
75 -79 20,003 19,939 20,156 20,389 21,136 22,178 22,755 23,558 24,711 26,385 26,381 32,086 33,172 36,484 35,942 30,884 25,957
80 -84 14,843 15,247 15,624 15,820 15,903 15,852 16,055 16,322 16,586 17,229 17,307 21,295 25,973 26,765 29,395 28,893 24,735
85 &up 13,763 14,051 14,562 15,247 15,991 16,598 17,126 17,635 18,073 18,445 17,829 20,008 24,135 29,570 32,591 35,330 35,909
Totals 588,121 589,055 591,143 590,261 592,925 594,829 596,798 601,104 603,438 606,217 580,111 574,815 567,207 556,388 542,058 525,362 507,733
Version 2021.0 A-4
D R A F T
10-19
-21

Delaware Population Consortium
Population Projection Series
October 31, 2021
State of DelawareWhite Alone Non-Hispanic Population
[As of July 1]
2010 2011 2012 2013 2014 2015 2016 2017 2018 2019 2020 2025 2030 2035 2040 2045 2050
MALES
0 - 4 14,063 14,077 14,280 12,103 12,284 12,472 12,732 14,953 14,884 14,845 14,031 13,143 12,173 11,507 11,342 11,368 11,2445 - 9 15,120 14,875 14,672 14,659 14,543 14,293 14,167 14,363 14,497 14,654 14,168 13,970 13,182 12,280 11,628 11,451 11,471
10 -14 16,065 16,021 15,888 15,643 15,410 15,274 14,926 14,709 14,709 14,606 13,709 14,069 13,968 13,249 12,365 11,709 11,53015 -19 18,696 17,875 17,166 16,610 16,353 16,120 15,999 15,830 15,592 15,379 14,561 13,566 13,973 13,933 13,234 12,358 11,70220 -24 18,819 19,288 19,695 19,735 19,482 18,754 17,814 17,103 16,545 16,282 15,319 14,355 13,459 13,937 13,921 13,220 12,34225 -29 16,936 17,300 17,553 17,788 18,021 18,651 19,298 19,373 19,740 19,535 17,984 15,235 14,364 13,547 14,026 14,009 13,30030 -34 15,559 16,007 16,472 16,826 17,065 17,239 17,365 17,628 17,883 18,129 17,891 17,831 15,272 14,470 13,664 14,113 14,09535 -39 16,348 15,336 14,718 14,505 14,869 15,428 16,050 16,527 16,905 17,160 16,552 17,690 17,764 15,360 14,553 13,734 14,15540 -44 19,158 18,743 18,260 17,539 17,013 16,164 15,338 14,735 14,536 14,929 14,802 16,380 17,580 17,769 15,425 14,587 13,76145 -49 22,720 22,043 21,609 21,053 20,210 19,429 18,784 18,324 17,645 17,147 15,581 14,680 16,356 17,589 17,809 15,493 14,62250 -54 23,226 23,246 23,190 23,108 22,868 22,499 22,254 21,899 21,429 20,634 18,958 15,579 14,775 16,525 17,702 17,909 15,61455 -59 20,832 21,339 21,854 22,256 22,703 23,235 23,479 23,572 23,650 23,528 22,178 19,046 15,765 14,993 16,733 17,780 17,96960 -64 20,000 20,788 21,407 20,792 20,718 20,895 21,303 21,961 22,512 23,081 22,624 22,075 19,085 15,822 15,025 16,677 17,57365 -69 15,976 16,294 16,580 18,029 18,828 19,441 20,112 20,780 20,290 20,264 19,562 21,631 21,308 18,434 15,246 14,462 15,97070 -74 11,648 12,025 12,378 12,929 13,734 14,306 14,888 15,193 16,590 17,354 17,109 17,595 19,573 19,367 16,705 13,773 13,07775 -79 9,073 9,025 9,065 9,109 9,481 9,978 10,172 10,506 11,006 11,723 11,681 14,345 14,765 16,475 16,311 14,013 11,52080 -84 6,297 6,547 6,734 6,892 6,879 6,830 6,902 6,978 7,049 7,356 7,420 8,973 11,040 11,319 12,616 12,475 10,65885 &up 4,492 4,699 4,925 5,147 5,478 5,762 6,031 6,268 6,459 6,593 6,389 7,272 8,751 10,715 11,639 12,687 12,961Totals 285,028 285,528 286,446 284,723 285,939 286,770 287,614 290,702 291,921 293,199 280,519 277,435 273,153 267,291 259,944 251,818 243,564
FEMALES
0 - 4 13,411 13,396 13,627 13,875 14,045 14,337 14,803 14,657 14,590 14,551 13,754 12,885 11,936 11,288 11,128 11,156 11,0355 - 9 14,219 14,141 14,044 13,989 13,919 13,751 13,471 13,691 13,948 14,129 13,765 13,684 12,912 12,033 11,398 11,232 11,250
10 -14 15,281 15,088 14,938 14,695 14,527 14,346 14,182 14,069 14,029 13,957 13,168 13,660 13,667 12,969 12,108 11,471 11,29715 -19 18,478 17,566 16,679 15,856 15,557 15,344 15,165 14,972 14,758 14,631 13,816 13,126 13,661 13,706 13,014 12,153 11,51220 -24 19,034 19,604 20,098 20,558 20,117 18,911 17,597 16,734 15,920 15,609 14,681 13,708 13,111 13,723 13,788 13,091 12,22025 -29 16,892 16,962 17,028 17,036 17,501 18,562 19,678 20,143 20,606 20,223 18,196 14,671 13,786 13,262 13,883 13,946 13,23330 -34 15,899 16,460 16,917 17,114 17,180 17,251 17,107 17,190 17,220 17,699 17,885 18,092 14,774 13,946 13,427 14,033 14,09035 -39 16,790 15,929 15,428 15,253 15,589 16,001 16,574 17,040 17,265 17,359 16,651 17,779 18,101 14,943 14,103 13,563 14,15240 -44 19,740 19,340 18,904 18,328 17,688 16,945 16,084 15,598 15,445 15,794 15,476 16,623 17,815 18,228 15,135 14,249 13,68845 -49 23,548 22,765 22,126 21,514 20,764 20,056 19,625 19,219 18,698 18,102 16,584 15,548 16,816 18,056 18,470 15,397 14,45450 -54 24,608 24,730 24,733 24,462 24,107 23,785 23,269 22,707 22,184 21,474 19,845 16,827 15,856 17,221 18,414 18,784 15,72655 -59 22,932 23,383 23,810 24,133 24,548 24,880 25,265 25,427 25,285 25,027 23,647 20,149 17,234 16,252 17,628 18,714 19,03160 -64 22,037 22,893 23,531 23,182 23,087 23,198 23,565 24,117 24,587 25,112 24,354 23,659 20,307 17,435 16,391 17,715 18,68865 -69 18,045 18,400 18,831 20,160 21,065 21,733 22,523 23,198 22,931 22,874 21,959 23,654 23,131 19,915 17,091 16,020 17,27170 -74 13,432 13,904 14,385 15,075 16,100 16,901 17,445 17,877 19,195 20,090 19,784 20,516 22,223 21,810 18,774 16,088 15,06075 -79 10,930 10,914 11,091 11,280 11,655 12,200 12,583 13,052 13,705 14,662 14,700 17,741 18,407 20,009 19,631 16,871 14,43780 -84 8,546 8,700 8,890 8,928 9,024 9,022 9,153 9,344 9,537 9,873 9,887 12,322 14,933 15,446 16,779 16,418 14,07785 &up 9,271 9,352 9,637 10,100 10,513 10,836 11,095 11,367 11,614 11,852 11,440 12,736 15,384 18,855 20,952 22,643 22,948
Totals 303,093 303,527 304,697 305,538 306,986 308,059 309,184 310,402 311,517 313,018 299,592 297,380 294,054 289,097 282,114 273,544 264,169
Version 2021.0 A-5
D R A F T
10-19
-21

Delaware Population Consortium
Population Projection Series
October 31, 2021
State of DelawareBlack Alone Non-Hispanic Population
[As of July 1]
2010 2011 2012 2013 2014 2015 2016 2017 2018 2019 2020 2025 2030 2035 2040 2045 2050
0 - 4 13,627 13,507 13,860 13,355 13,482 13,808 14,033 14,737 14,761 14,761 14,370 13,973 13,451 13,304 13,251 13,230 13,157
5 - 9 13,982 13,675 13,534 13,564 13,806 13,887 14,029 14,494 14,820 15,101 14,854 14,334 13,915 13,464 13,369 13,361 13,371
10 -14 14,775 14,830 14,767 14,666 14,463 14,366 14,188 14,146 14,261 14,570 14,181 14,788 14,234 13,891 13,499 13,453 13,479
15 -19 16,741 16,308 15,927 15,351 15,198 15,164 15,327 15,370 15,360 15,206 14,632 14,055 14,615 14,130 13,852 13,509 13,507
20 -24 14,572 15,406 16,104 16,874 17,182 17,320 16,858 16,581 16,065 15,970 15,447 14,494 13,875 14,495 14,074 13,846 13,548
25 -29 12,487 12,702 12,984 13,349 13,954 14,784 15,970 16,828 17,763 18,167 17,728 15,351 14,343 13,788 14,460 14,092 13,915
30 -34 12,073 12,339 12,502 12,850 13,057 13,143 13,116 13,508 13,975 14,680 15,077 17,434 15,178 14,220 13,724 14,448 14,126
35 -39 12,469 11,961 11,511 11,430 11,606 12,106 12,677 12,939 13,384 13,657 13,328 14,823 16,997 15,002 14,094 13,646 14,409
40 -44 13,988 14,161 14,046 13,605 13,137 12,679 12,213 11,850 11,835 12,062 12,214 13,109 14,425 16,548 14,779 13,914 13,513
45 -49 14,466 14,697 14,864 14,771 14,664 14,392 14,370 14,361 14,003 13,571 12,727 11,949 12,770 14,008 16,074 14,506 13,682
50 -54 13,207 13,525 13,750 14,028 14,312 14,691 14,817 15,098 15,102 15,059 14,339 12,364 11,587 12,405 13,569 15,578 14,191
55 -59 10,556 11,068 11,438 11,920 12,438 12,920 13,449 13,780 14,151 14,498 14,433 13,750 11,816 11,125 11,933 13,019 14,945
60 -64 8,598 9,269 9,767 9,993 10,218 10,469 10,831 11,286 11,842 12,407 12,489 13,627 12,942 11,153 10,548 11,323 12,325
65 -69 5,975 6,268 6,565 7,054 7,588 8,174 8,831 9,377 9,669 9,934 9,856 11,480 12,494 11,909 10,285 9,771 10,496
70 -74 4,228 4,467 4,632 4,886 5,220 5,511 5,743 6,074 6,577 7,119 7,429 8,717 10,135 11,066 10,578 9,146 8,727
75 -79 2,966 3,078 3,180 3,298 3,489 3,721 3,904 4,085 4,351 4,676 4,778 6,289 7,349 8,588 9,401 9,013 7,794
80 -84 1,824 1,974 2,120 2,196 2,300 2,339 2,511 2,624 2,751 2,929 3,029 3,782 4,979 5,838 6,853 7,532 7,236
85 &up 1,651 1,669 1,749 1,893 2,034 2,222 2,380 2,570 2,742 2,906 2,949 3,736 4,661 6,038 7,445 8,924 10,181
Totals 188,185 190,904 193,300 195,083 198,148 201,696 205,247 209,708 213,412 217,273 213,860 218,055 219,766 220,972 221,788 222,311 222,602
Version 2021.0 A-6
D R A F T
10-19
-21

Delaware Population Consortium
Population Projection Series
October 31, 2021
State of DelawareBlack Alone Non-Hispanic Population
[As of July 1]
2010 2011 2012 2013 2014 2015 2016 2017 2018 2019 2020 2025 2030 2035 2040 2045 2050
MALES
0 - 4 6,896 6,869 7,045 6,410 6,446 6,618 6,703 7,429 7,440 7,441 7,243 7,044 6,784 6,714 6,688 6,682 6,6465 - 9 7,045 6,927 6,888 6,894 6,969 7,060 7,135 7,369 7,517 7,672 7,505 7,228 7,019 6,795 6,749 6,748 6,756
10 -14 7,576 7,554 7,464 7,438 7,347 7,273 7,188 7,198 7,246 7,354 7,212 7,474 7,181 7,012 6,814 6,794 6,80815 -19 8,491 8,311 8,128 7,810 7,729 7,721 7,793 7,758 7,776 7,711 7,395 7,132 7,372 7,116 6,978 6,807 6,80920 -24 7,207 7,731 8,161 8,525 8,707 8,762 8,558 8,430 8,142 8,093 7,837 7,297 7,013 7,282 7,061 6,946 6,79925 -29 5,998 6,080 6,238 6,574 6,886 7,354 7,983 8,490 8,934 9,165 8,928 7,759 7,193 6,941 7,234 7,042 6,95430 -34 5,595 5,732 5,831 6,000 6,165 6,232 6,257 6,469 6,859 7,221 7,475 8,777 7,650 7,106 6,883 7,202 7,03735 -39 5,803 5,524 5,281 5,250 5,340 5,596 5,865 6,013 6,228 6,427 6,299 7,335 8,556 7,540 7,022 6,824 7,16140 -44 6,319 6,448 6,447 6,204 6,035 5,846 5,619 5,418 5,412 5,526 5,621 6,175 7,116 8,320 7,404 6,908 6,73545 -49 6,697 6,732 6,779 6,728 6,658 6,474 6,515 6,562 6,359 6,208 5,841 5,485 5,993 6,890 8,071 7,241 6,76650 -54 5,994 6,145 6,212 6,377 6,491 6,699 6,748 6,848 6,842 6,800 6,413 5,645 5,303 5,794 6,643 7,797 7,04755 -59 4,630 4,859 5,030 5,322 5,577 5,822 6,066 6,185 6,392 6,536 6,538 6,104 5,358 5,065 5,538 6,337 7,44660 -64 3,798 4,158 4,419 4,397 4,478 4,586 4,699 4,910 5,231 5,503 5,567 6,102 5,690 5,006 4,765 5,203 5,94565 -69 2,640 2,735 2,844 3,078 3,306 3,557 3,887 4,165 4,176 4,270 4,233 5,026 5,486 5,142 4,533 4,343 4,74270 -74 1,848 1,968 2,035 2,124 2,264 2,375 2,420 2,541 2,776 3,004 3,128 3,617 4,289 4,688 4,412 3,894 3,75475 -79 1,209 1,276 1,329 1,398 1,469 1,548 1,636 1,705 1,799 1,930 1,956 2,517 2,900 3,462 3,791 3,579 3,16080 -84 663 722 783 819 847 900 978 1,032 1,099 1,162 1,186 1,454 1,871 2,159 2,590 2,843 2,69085 &up 515 511 519 558 618 660 717 779 835 885 910 1,185 1,473 1,888 2,273 2,731 3,116Totals 88,924 90,282 91,433 91,906 93,332 95,083 96,767 99,301 101,063 102,908 101,287 103,356 104,247 104,920 105,449 105,921 106,371
FEMALES
0 - 4 6,731 6,638 6,815 6,945 7,036 7,190 7,330 7,308 7,321 7,320 7,127 6,929 6,667 6,590 6,563 6,548 6,5115 - 9 6,937 6,748 6,646 6,670 6,837 6,827 6,894 7,125 7,303 7,429 7,349 7,106 6,896 6,669 6,620 6,613 6,615
10 -14 7,199 7,276 7,303 7,228 7,116 7,093 7,000 6,948 7,015 7,216 6,969 7,314 7,053 6,879 6,685 6,659 6,67115 -19 8,250 7,997 7,799 7,541 7,469 7,443 7,534 7,612 7,584 7,495 7,237 6,923 7,243 7,014 6,874 6,702 6,69820 -24 7,365 7,675 7,943 8,349 8,475 8,558 8,300 8,151 7,923 7,877 7,610 7,197 6,862 7,213 7,013 6,900 6,74925 -29 6,489 6,622 6,746 6,775 7,068 7,430 7,987 8,338 8,829 9,002 8,800 7,592 7,150 6,847 7,226 7,050 6,96130 -34 6,478 6,607 6,671 6,850 6,892 6,911 6,859 7,039 7,116 7,459 7,602 8,657 7,528 7,114 6,841 7,246 7,08935 -39 6,666 6,437 6,230 6,180 6,266 6,510 6,812 6,926 7,156 7,230 7,029 7,488 8,441 7,462 7,072 6,822 7,24840 -44 7,669 7,713 7,599 7,401 7,102 6,833 6,594 6,432 6,423 6,536 6,593 6,934 7,309 8,228 7,375 7,006 6,77845 -49 7,769 7,965 8,085 8,043 8,006 7,918 7,855 7,799 7,644 7,363 6,886 6,464 6,777 7,118 8,003 7,265 6,91650 -54 7,213 7,380 7,538 7,651 7,821 7,992 8,069 8,250 8,260 8,259 7,926 6,719 6,284 6,611 6,926 7,781 7,14455 -59 5,926 6,209 6,408 6,598 6,861 7,098 7,383 7,595 7,759 7,962 7,895 7,646 6,458 6,060 6,395 6,682 7,49960 -64 4,800 5,111 5,348 5,596 5,740 5,883 6,132 6,376 6,611 6,904 6,922 7,525 7,252 6,147 5,783 6,120 6,38065 -69 3,335 3,533 3,721 3,976 4,282 4,617 4,944 5,212 5,493 5,664 5,623 6,454 7,008 6,767 5,752 5,428 5,75470 -74 2,380 2,499 2,597 2,762 2,956 3,136 3,323 3,533 3,801 4,115 4,301 5,100 5,846 6,378 6,166 5,252 4,97375 -79 1,757 1,802 1,851 1,900 2,020 2,173 2,268 2,380 2,552 2,746 2,822 3,772 4,449 5,126 5,610 5,434 4,63480 -84 1,161 1,252 1,337 1,377 1,453 1,439 1,533 1,592 1,652 1,767 1,843 2,328 3,108 3,679 4,263 4,689 4,54685 &up 1,136 1,158 1,230 1,335 1,416 1,562 1,663 1,791 1,907 2,021 2,039 2,551 3,188 4,150 5,172 6,193 7,065
Totals 99,261 100,622 101,867 103,177 104,816 106,613 108,480 110,407 112,349 114,365 112,573 114,699 115,519 116,052 116,339 116,390 116,231
Version 2021.0 A-7
D R A F T
10-19
-21
Delaware Population Consortium
Population Projection Series
October 31, 2021
State of DelawareOther Races, Including Two or More Races, Non-Hispanic Population
[As of July 1]
2010 2011 2012 2013 2014 2015 2016 2017 2018 2019 2020 2025 2030 2035 2040 2045 2050
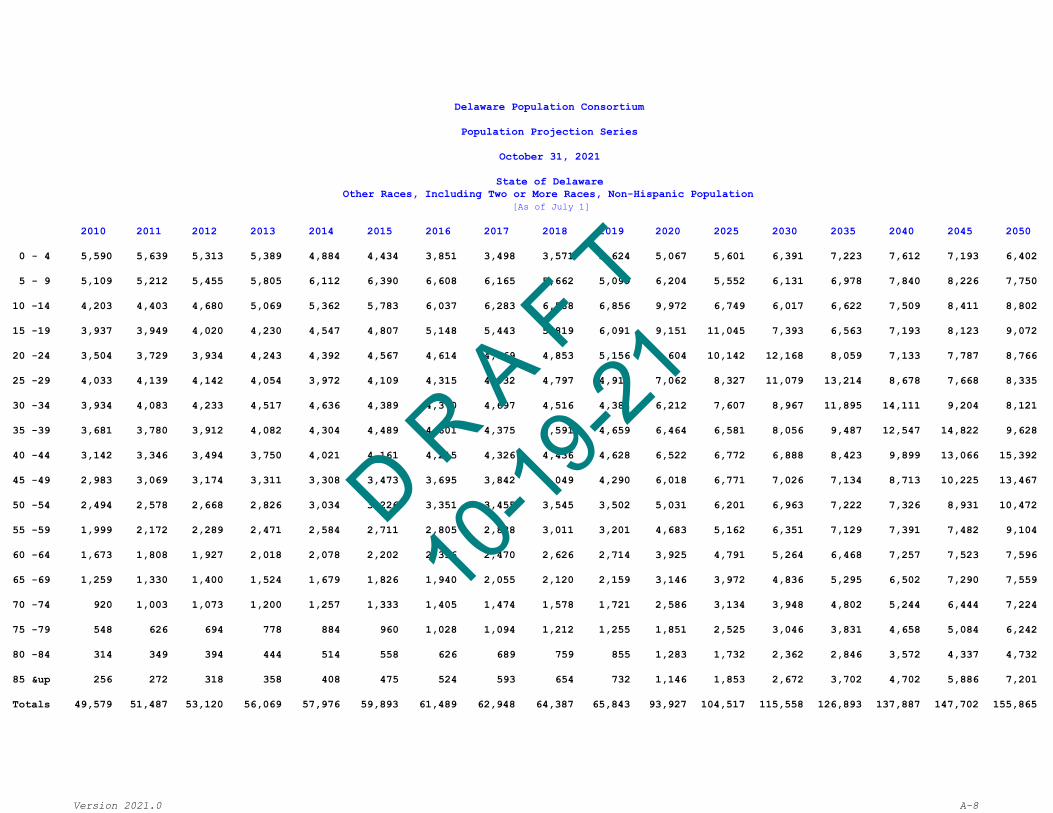
0 - 4 5,590 5,639 5,313 5,389 4,884 4,434 3,851 3,498 3,571 3,624 5,067 5,601 6,391 7,223 7,612 7,193 6,402
5 - 9 5,109 5,212 5,455 5,805 6,112 6,390 6,608 6,165 5,662 5,099 6,204 5,552 6,131 6,978 7,840 8,226 7,750
10 -14 4,203 4,403 4,680 5,069 5,362 5,783 6,037 6,283 6,588 6,856 9,972 6,749 6,017 6,622 7,509 8,411 8,802
15 -19 3,937 3,949 4,020 4,230 4,547 4,807 5,148 5,443 5,819 6,091 9,151 11,045 7,393 6,563 7,193 8,123 9,072
20 -24 3,504 3,729 3,934 4,243 4,392 4,567 4,614 4,669 4,853 5,156 7,604 10,142 12,168 8,059 7,133 7,787 8,766
25 -29 4,033 4,139 4,142 4,054 3,972 4,109 4,315 4,932 4,797 4,917 7,062 8,327 11,079 13,214 8,678 7,668 8,335
30 -34 3,934 4,083 4,233 4,517 4,636 4,389 4,370 4,697 4,516 4,384 6,212 7,607 8,967 11,895 14,111 9,204 8,121
35 -39 3,681 3,780 3,912 4,082 4,304 4,489 4,601 4,375 4,591 4,659 6,464 6,581 8,056 9,487 12,547 14,822 9,628
40 -44 3,142 3,346 3,494 3,750 4,021 4,161 4,215 4,326 4,436 4,628 6,522 6,772 6,888 8,423 9,899 13,066 15,392
45 -49 2,983 3,069 3,174 3,311 3,308 3,473 3,695 3,842 4,049 4,290 6,018 6,771 7,026 7,134 8,713 10,225 13,467
50 -54 2,494 2,578 2,668 2,826 3,034 3,226 3,351 3,455 3,545 3,502 5,031 6,201 6,963 7,222 7,326 8,931 10,472
55 -59 1,999 2,172 2,289 2,471 2,584 2,711 2,805 2,888 3,011 3,201 4,683 5,162 6,351 7,129 7,391 7,482 9,104
60 -64 1,673 1,808 1,927 2,018 2,078 2,202 2,356 2,470 2,626 2,714 3,925 4,791 5,264 6,468 7,257 7,523 7,596
65 -69 1,259 1,330 1,400 1,524 1,679 1,826 1,940 2,055 2,120 2,159 3,146 3,972 4,836 5,295 6,502 7,290 7,559
70 -74 920 1,003 1,073 1,200 1,257 1,333 1,405 1,474 1,578 1,721 2,586 3,134 3,948 4,802 5,244 6,444 7,224
75 -79 548 626 694 778 884 960 1,028 1,094 1,212 1,255 1,851 2,525 3,046 3,831 4,658 5,084 6,242
80 -84 314 349 394 444 514 558 626 689 759 855 1,283 1,732 2,362 2,846 3,572 4,337 4,732
85 &up 256 272 318 358 408 475 524 593 654 732 1,146 1,853 2,672 3,702 4,702 5,886 7,201
Totals 49,579 51,487 53,120 56,069 57,976 59,893 61,489 62,948 64,387 65,843 93,927 104,517 115,558 126,893 137,887 147,702 155,865
Version 2021.0 A-8
D R A F T
10-19
-21

Delaware Population Consortium
Population Projection Series
October 31, 2021
State of DelawareOther Races, Including Two or More Races, Non-Hispanic Population
[As of July 1]
2010 2011 2012 2013 2014 2015 2016 2017 2018 2019 2020 2025 2030 2035 2040 2045 2050
MALES
0 - 4 2,769 2,670 2,521 2,802 2,560 2,393 2,134 1,774 1,810 1,837 2,567 2,837 3,237 3,660 3,858 3,648 3,2455 - 9 2,466 2,503 2,632 2,786 2,902 3,049 3,140 2,938 2,726 2,493 3,087 2,822 3,115 3,545 3,983 4,179 3,938
10 -14 2,064 2,089 2,217 2,431 2,578 2,787 2,923 3,057 3,184 3,281 4,799 3,378 3,077 3,383 3,836 4,294 4,49115 -19 1,971 1,947 1,981 2,076 2,237 2,343 2,463 2,597 2,812 2,951 4,428 5,365 3,718 3,372 3,693 4,168 4,65120 -24 1,653 1,773 1,893 2,043 2,124 2,249 2,279 2,309 2,386 2,540 3,706 4,919 5,939 4,057 3,671 4,004 4,50225 -29 1,820 1,900 1,907 1,885 1,841 1,881 2,056 2,585 2,312 2,380 3,472 4,061 5,376 6,467 4,372 3,946 4,28630 -34 1,895 1,905 1,969 2,083 2,151 1,826 1,819 2,168 2,105 2,038 2,852 3,752 4,386 5,789 6,932 4,650 4,18935 -39 1,802 1,802 1,854 1,942 2,062 2,125 2,155 1,848 1,926 1,970 2,705 3,033 3,986 4,653 6,123 7,304 4,87540 -44 1,479 1,561 1,640 1,766 1,883 1,992 2,011 2,049 2,109 2,215 3,073 2,834 3,177 4,170 4,858 6,378 7,59245 -49 1,366 1,406 1,484 1,530 1,538 1,603 1,724 1,802 1,906 2,007 2,861 3,194 2,941 3,294 4,314 5,018 6,57650 -54 1,167 1,149 1,176 1,286 1,371 1,476 1,532 1,612 1,634 1,623 2,310 2,940 3,279 3,014 3,374 4,415 5,13155 -59 874 953 1,015 1,075 1,136 1,193 1,239 1,262 1,358 1,434 2,120 2,356 2,992 3,337 3,061 3,424 4,47460 -64 732 766 814 861 912 973 1,031 1,090 1,136 1,187 1,707 2,161 2,394 3,034 3,386 3,101 3,46265 -69 578 563 583 657 694 756 818 862 897 940 1,371 1,715 2,164 2,386 3,024 3,371 3,08370 -74 443 461 480 515 549 570 588 610 672 701 1,053 1,352 1,688 2,127 2,340 2,968 3,31275 -79 222 269 315 350 388 430 461 476 506 535 765 1,006 1,286 1,600 2,018 2,215 2,80780 -84 136 142 158 183 231 246 269 310 337 371 564 710 927 1,185 1,472 1,853 2,02785 &up 84 88 108 121 133 166 192 217 242 283 444 766 1,082 1,428 1,829 2,293 2,874Totals 23,521 23,947 24,747 26,392 27,290 28,058 28,834 29,566 30,058 30,786 43,884 49,201 54,764 60,501 66,144 71,229 75,515
FEMALES
0 - 4 2,821 2,969 2,792 2,587 2,324 2,041 1,717 1,724 1,761 1,787 2,500 2,764 3,154 3,563 3,754 3,545 3,1575 - 9 2,643 2,709 2,823 3,019 3,210 3,341 3,468 3,227 2,936 2,606 3,117 2,730 3,016 3,433 3,857 4,047 3,812
10 -14 2,139 2,314 2,463 2,638 2,784 2,996 3,114 3,226 3,404 3,575 5,173 3,371 2,940 3,239 3,673 4,117 4,31115 -19 1,966 2,002 2,039 2,154 2,310 2,464 2,685 2,846 3,007 3,140 4,723 5,680 3,675 3,191 3,500 3,955 4,42120 -24 1,851 1,956 2,041 2,200 2,268 2,318 2,335 2,360 2,467 2,616 3,898 5,223 6,229 4,002 3,462 3,783 4,26425 -29 2,213 2,239 2,235 2,169 2,131 2,228 2,259 2,347 2,485 2,537 3,590 4,266 5,703 6,747 4,306 3,722 4,04930 -34 2,039 2,178 2,264 2,434 2,485 2,563 2,551 2,529 2,411 2,346 3,360 3,855 4,581 6,106 7,179 4,554 3,93235 -39 1,879 1,978 2,058 2,140 2,242 2,364 2,446 2,527 2,665 2,689 3,759 3,548 4,070 4,834 6,424 7,518 4,75340 -44 1,663 1,785 1,854 1,984 2,138 2,169 2,204 2,277 2,327 2,413 3,449 3,938 3,711 4,253 5,041 6,688 7,80045 -49 1,617 1,663 1,690 1,781 1,770 1,870 1,971 2,040 2,143 2,283 3,157 3,577 4,085 3,840 4,399 5,207 6,89150 -54 1,327 1,429 1,492 1,540 1,663 1,750 1,819 1,843 1,911 1,879 2,721 3,261 3,684 4,208 3,952 4,516 5,34155 -59 1,125 1,219 1,274 1,396 1,448 1,518 1,566 1,626 1,653 1,767 2,563 2,806 3,359 3,792 4,330 4,058 4,63060 -64 941 1,042 1,113 1,157 1,166 1,229 1,325 1,380 1,490 1,527 2,218 2,630 2,870 3,434 3,871 4,422 4,13465 -69 681 767 817 867 985 1,070 1,122 1,193 1,223 1,219 1,775 2,257 2,672 2,909 3,478 3,919 4,47670 -74 477 542 593 685 708 763 817 864 906 1,020 1,533 1,782 2,260 2,675 2,904 3,476 3,91275 -79 326 357 379 428 496 530 567 618 706 720 1,086 1,519 1,760 2,231 2,640 2,869 3,43580 -84 178 207 236 261 283 312 357 379 422 484 719 1,022 1,435 1,661 2,100 2,484 2,70585 &up 172 184 210 237 275 309 332 376 412 449 702 1,087 1,590 2,274 2,873 3,593 4,327
Totals 26,058 27,540 28,373 29,677 30,686 31,835 32,655 33,382 34,329 35,057 50,043 55,316 60,794 66,392 71,743 76,473 80,350
Version 2021.0 A-9
D R A F T
10-19
-21

Delaware Population Consortium
Population Projection Series
October 31, 2021
State of DelawareHispanic Population
[As of July 1]
2010 2011 2012 2013 2014 2015 2016 2017 2018 2019 2020 2025 2030 2035 2040 2045 2050
0 - 4 9,092 9,062 8,634 8,197 7,637 7,339 7,014 7,230 7,279 7,345 7,964 8,595 10,144 11,746 12,727 12,876 13,331
5 - 9 7,930 8,372 8,804 9,128 9,318 9,415 9,437 9,064 8,662 8,132 8,657 8,691 9,384 11,023 12,720 13,751 13,923
10 -14 6,493 6,777 7,071 7,406 7,883 8,313 8,677 9,208 9,666 9,896 10,948 9,361 9,426 10,160 11,918 13,722 14,819
15 -19 6,478 6,468 6,311 6,210 6,308 6,443 6,807 7,180 7,623 8,144 9,357 11,609 9,915 10,000 10,818 12,719 14,662
20 -24 7,077 6,988 7,061 7,064 7,019 6,914 6,750 6,637 6,610 6,729 7,442 10,197 12,611 10,690 10,794 11,688 13,768
25 -29 7,393 7,427 7,465 7,400 7,288 7,296 7,331 7,843 7,582 7,552 8,031 8,190 11,172 13,732 11,584 11,706 12,708
30 -34 6,656 6,885 7,118 7,286 7,591 7,788 7,749 7,863 7,897 7,805 8,522 8,816 8,957 12,164 14,902 12,535 12,702
35 -39 5,742 5,975 6,226 6,466 6,615 6,801 7,170 7,486 7,765 8,113 9,104 9,327 9,632 9,733 13,183 16,138 13,563
40 -44 4,774 4,951 5,169 5,418 5,732 6,012 6,216 6,537 6,882 7,058 7,935 9,935 10,157 10,451 10,528 14,258 17,471
45 -49 3,650 3,863 4,082 4,331 4,595 4,848 5,159 5,441 5,772 6,125 7,030 8,685 10,820 11,016 11,303 11,380 15,442
50 -54 2,641 2,898 3,120 3,301 3,515 3,766 4,050 4,313 4,634 4,934 5,664 7,727 9,499 11,774 11,959 12,232 12,330
55 -59 1,916 2,108 2,294 2,510 2,699 2,846 3,038 3,294 3,537 3,769 4,388 6,225 8,455 10,333 12,775 12,956 13,190
60 -64 1,406 1,495 1,617 1,697 1,836 2,004 2,182 2,397 2,652 2,851 3,257 4,769 6,724 9,093 11,078 13,680 13,869
65 -69 895 959 1,029 1,114 1,242 1,391 1,509 1,647 1,754 1,893 2,247 3,459 5,032 7,047 9,500 11,562 14,280
70 -74 653 729 799 853 865 878 934 1,013 1,112 1,239 1,504 2,308 3,533 5,096 7,114 9,570 11,639
75 -79 410 439 475 521 593 634 680 753 813 827 912 1,482 2,261 3,439 4,933 6,876 9,242
80 -84 286 304 312 321 338 363 386 421 470 532 617 847 1,375 2,082 3,144 4,497 6,280
85 &up 223 241 264 308 322 354 380 408 443 469 558 863 1,241 1,908 2,879 4,332 6,293
Totals 73,715 75,941 77,851 79,531 81,396 83,405 85,469 88,735 91,153 93,413 104,137 121,086 140,338 161,487 183,859 206,478 229,512
Version 2021.0 A-10
D R A F T
10-19
-21

Delaware Population Consortium
Population Projection Series
October 31, 2021
State of DelawareHispanic Population
[As of July 1]
2010 2011 2012 2013 2014 2015 2016 2017 2018 2019 2020 2025 2030 2035 2040 2045 2050
MALES
0 - 4 4,619 4,710 4,459 4,281 3,953 3,733 3,539 3,663 3,689 3,722 4,036 4,356 5,140 5,953 6,448 6,526 6,7565 - 9 4,064 4,374 4,593 4,689 4,794 4,881 4,904 4,684 4,498 4,206 4,414 4,404 4,754 5,586 6,447 6,970 7,056
10 -14 3,214 3,491 3,656 3,860 4,081 4,344 4,530 4,797 4,962 5,090 5,671 4,773 4,776 5,147 6,040 6,956 7,51115 -19 3,381 3,380 3,308 3,287 3,330 3,374 3,536 3,743 4,006 4,246 4,925 6,045 5,073 5,085 5,499 6,461 7,44220 -24 3,885 3,875 3,862 3,755 3,728 3,627 3,512 3,467 3,488 3,541 3,885 5,349 6,539 5,450 5,474 5,923 6,97325 -29 4,035 4,138 4,148 4,162 4,088 4,071 4,052 4,436 4,015 3,996 4,205 4,260 5,837 7,098 5,888 5,922 6,42730 -34 3,506 3,782 3,929 4,008 4,201 4,301 4,305 4,360 4,431 4,369 4,755 4,605 4,647 6,336 7,678 6,358 6,41635 -39 2,954 3,193 3,364 3,495 3,540 3,692 3,930 4,123 4,263 4,481 5,026 5,191 5,021 5,032 6,842 8,286 6,86340 -44 2,465 2,597 2,699 2,872 3,080 3,199 3,308 3,519 3,707 3,765 4,296 5,466 5,638 5,429 5,416 7,366 8,93045 -49 1,894 2,087 2,217 2,281 2,391 2,501 2,693 2,825 3,044 3,277 3,738 4,681 5,925 6,090 5,848 5,821 7,92950 -54 1,410 1,574 1,674 1,794 1,931 2,077 2,176 2,330 2,429 2,554 2,911 4,089 5,097 6,415 6,588 6,305 6,26555 -59 1,006 1,135 1,231 1,356 1,433 1,541 1,644 1,763 1,915 2,064 2,413 3,188 4,460 5,526 6,936 7,118 6,77360 -64 664 749 823 866 969 1,055 1,173 1,284 1,428 1,510 1,758 2,615 3,433 4,783 5,906 7,405 7,60065 -69 413 441 467 524 588 681 747 830 891 991 1,178 1,856 2,743 3,571 4,967 6,128 7,68070 -74 314 362 392 400 401 396 422 452 516 577 727 1,193 1,867 2,741 3,550 4,931 6,08375 -79 181 206 221 247 283 308 327 360 371 373 400 697 1,140 1,771 2,592 3,342 4,64480 -84 130 136 144 156 165 165 175 188 215 245 290 355 623 1,015 1,565 2,288 2,94685 &up 83 100 109 128 129 146 154 170 189 198 231 362 488 766 1,230 1,925 2,878Totals 38,218 40,330 41,296 42,161 43,085 44,092 45,127 46,994 48,057 49,205 54,859 63,485 73,201 83,794 94,914 106,031 117,172
FEMALES
0 - 4 4,473 4,352 4,175 3,916 3,684 3,606 3,475 3,567 3,590 3,623 3,928 4,239 5,004 5,793 6,279 6,350 6,5755 - 9 3,866 3,998 4,211 4,439 4,524 4,534 4,533 4,380 4,164 3,926 4,243 4,287 4,630 5,437 6,273 6,781 6,867
10 -14 3,279 3,286 3,415 3,546 3,802 3,969 4,147 4,411 4,704 4,806 5,277 4,588 4,650 5,013 5,878 6,766 7,30815 -19 3,097 3,088 3,003 2,923 2,978 3,069 3,271 3,437 3,617 3,898 4,432 5,564 4,842 4,915 5,319 6,258 7,22020 -24 3,192 3,113 3,199 3,309 3,291 3,287 3,238 3,170 3,122 3,188 3,557 4,848 6,072 5,240 5,320 5,765 6,79525 -29 3,358 3,289 3,317 3,238 3,200 3,225 3,279 3,407 3,567 3,556 3,826 3,930 5,335 6,634 5,696 5,784 6,28130 -34 3,150 3,103 3,189 3,278 3,390 3,487 3,444 3,503 3,466 3,436 3,767 4,211 4,310 5,828 7,224 6,177 6,28635 -39 2,788 2,782 2,862 2,971 3,075 3,109 3,240 3,363 3,502 3,632 4,078 4,136 4,611 4,701 6,341 7,852 6,70040 -44 2,309 2,354 2,470 2,546 2,652 2,813 2,908 3,018 3,175 3,293 3,639 4,469 4,519 5,022 5,112 6,892 8,54145 -49 1,756 1,776 1,865 2,050 2,204 2,347 2,466 2,616 2,728 2,848 3,292 4,004 4,895 4,926 5,455 5,559 7,51350 -54 1,231 1,324 1,446 1,507 1,584 1,689 1,874 1,983 2,205 2,380 2,753 3,638 4,402 5,359 5,371 5,927 6,06555 -59 910 973 1,063 1,154 1,266 1,305 1,394 1,531 1,622 1,705 1,975 3,037 3,995 4,807 5,839 5,838 6,41760 -64 742 746 794 831 867 949 1,009 1,113 1,224 1,341 1,499 2,154 3,291 4,310 5,172 6,275 6,26965 -69 482 518 562 590 654 710 762 817 863 902 1,069 1,603 2,289 3,476 4,533 5,434 6,60070 -74 339 367 407 453 464 482 512 561 596 662 777 1,115 1,666 2,355 3,564 4,639 5,55675 -79 229 233 254 274 310 326 353 393 442 454 512 785 1,121 1,668 2,341 3,534 4,59880 -84 156 168 168 165 173 198 211 233 255 287 327 492 752 1,067 1,579 2,209 3,33485 &up 140 141 155 180 193 208 226 238 254 271 327 501 753 1,142 1,649 2,407 3,415
Totals 35,497 35,611 36,555 37,370 38,311 39,313 40,342 41,741 43,096 44,208 49,278 57,601 67,137 77,693 88,945 100,447 112,340
Version 2021.0 A-11
D R A F T
10-19
-21

Delaware Population Consortium
Population Projection Series
October 31, 2021
Kent CountyTotal Population
[As of July 1]
2010 2015 2020 2025 2030 2035 2040 2045 2050
Population 162,955 172,965 182,481 183,690 184,613 186,828 190,631 196,339 204,411
Households 54,885 65,318 69,250 70,828 71,888 72,997 74,316 76,084 78,599
Population Change* 10,010 9,516 1,209 923 2,215 3,803 5,708 8,072
Births* 11,022 10,873 10,592 10,456 10,428 10,460 10,357 10,235
Deaths* 7,104 8,197 9,122 9,901 10,681 11,331 11,736 12,016
Net Migration* 6,092 6,840 -261 368 2,468 4,674 7,087 9,853
Household Change* 10,433 3,932 1,578 1,060 1,109 1,319 1,768 2,515
Total Labor Force 74,744 77,864 81,710 82,040 82,483 83,436 85,095 87,536 90,931
Civilian 72,744 75,864 79,710 80,040 80,483 81,436 83,095 85,536 88,931
Employed 66,015 71,617 76,522 76,838 77,264 78,179 79,771 82,115 85,374
Private 47,251 51,261 54,772 54,998 55,303 55,957 57,097 58,775 61,108
Government 14,796 16,052 17,152 17,222 17,318 17,523 17,880 18,405 19,135
Self-Employed 3,793 4,115 4,396 4,415 4,439 4,492 4,583 4,718 4,905
Unpaid Family 175 189 202 203 204 207 211 217 226
Unemployed 6,729 4,247 3,188 3,202 3,219 3,257 3,324 3,421 3,557
Military 2,000 2,000 2,000 2,000 2,000 2,000 2,000 2,000 2,000
Jobs by Place of Work 60,704 65,625 71,077 71,370 71,765 72,614 74,094 76,270 79,298
Jobs by Residence 66,015 71,617 76,523 76,838 77,264 78,178 79,771 82,114 85,374
Net Commuting -5,311 -5,992 -5,446 -5,468 -5,499 -5,564 -5,677 -5,844 -6,076
*Represents a five-year total beginning with specified year
Version 2021.0 A-12
D R A F T
10-19
-21

Delaware Population Consortium
Population Projection Series
October 31, 2021
Kent CountyTotal Population
[As of July 1]
2010 2011 2012 2013 2014 2015 2016 2017 2018 2019 2020 2025 2030 2035 2040 2045 2050
0 - 4 11,145 11,054 11,052 10,940 10,888 10,975 10,994 11,239 11,202 11,222 11,028 10,766 10,747 10,874 11,006 11,127 11,476
5 - 9 11,281 11,301 11,357 11,476 11,581 11,524 11,525 11,502 11,521 11,523 11,556 10,985 10,806 10,965 11,242 11,492 11,717
10 -14 11,134 11,311 11,533 11,657 11,690 11,784 11,774 11,836 12,000 12,120 12,407 11,516 11,001 10,974 11,323 11,767 12,141
15 -19 12,355 11,943 11,494 11,123 11,357 11,513 11,753 11,979 12,145 12,186 12,576 12,454 11,500 11,108 11,249 11,808 12,442
20 -24 12,296 12,847 13,430 13,704 13,479 13,007 12,404 11,931 11,572 11,822 12,205 12,566 12,567 11,594 11,337 11,645 12,443
25 -29 10,553 10,702 10,966 11,353 11,851 12,566 13,305 14,388 14,296 14,092 13,668 12,132 12,614 12,805 11,799 11,684 12,185
30 -34 9,611 9,906 10,148 10,471 10,707 10,943 11,032 11,292 11,720 12,250 13,008 13,405 12,072 12,778 13,179 12,124 12,156
35 -39 9,788 9,568 9,460 9,316 9,624 9,933 10,192 10,428 10,781 11,027 11,275 12,858 13,142 12,120 13,069 13,707 12,587
40 -44 10,774 10,764 10,693 10,568 10,399 10,123 9,819 9,706 9,581 9,888 10,218 11,219 12,722 13,004 12,261 13,485 14,399
45 -49 12,025 11,879 11,801 11,751 11,498 11,154 10,986 10,913 10,812 10,631 10,368 10,141 11,181 12,674 12,982 12,500 14,033
50 -54 11,199 11,527 11,752 11,773 11,975 12,040 12,031 11,941 11,921 11,669 11,284 10,178 10,047 11,194 12,690 13,049 12,813
55 -59 9,520 9,954 10,324 10,627 10,987 11,252 11,507 11,714 11,761 11,964 11,933 10,889 9,891 9,926 11,174 12,688 13,105
60 -64 9,098 9,412 9,671 9,532 9,472 9,553 9,775 10,126 10,447 10,792 10,954 11,325 10,357 9,547 9,751 11,105 12,630
65 -69 7,318 7,585 7,767 8,231 8,569 8,779 8,988 9,213 9,116 9,058 9,036 10,140 10,474 9,674 9,072 9,445 10,880
70 -74 5,510 5,744 5,926 6,159 6,478 6,795 6,939 7,087 7,529 7,842 7,944 8,013 9,013 9,364 8,749 8,359 8,878
75 -79 4,236 4,281 4,343 4,457 4,696 4,854 4,949 5,101 5,325 5,586 5,792 6,665 6,696 7,611 7,957 7,541 7,354
80 -84 2,681 2,856 2,997 3,110 3,229 3,235 3,372 3,417 3,528 3,709 3,791 4,455 5,124 5,170 5,937 6,248 6,020
85 &up 2,431 2,468 2,589 2,658 2,785 2,935 3,021 3,153 3,287 3,398 3,438 3,983 4,659 5,446 5,854 6,565 7,152
Totals 162,955 165,102 167,303 168,906 171,265 172,965 174,366 176,966 178,544 180,779 182,481 183,690 184,613 186,828 190,631 196,339 204,411
Version 2021.0 A-13
D R A F T
10-19
-21

Delaware Population Consortium
Population Projection Series
October 31, 2021
Kent CountyTotal Population
[As of July 1]
2010 2011 2012 2013 2014 2015 2016 2017 2018 2019 2020 2025 2030 2035 2040 2045 2050
MALES
0 - 4 5,706 5,618 5,604 5,436 5,396 5,430 5,411 5,623 5,604 5,614 5,516 5,387 5,381 5,450 5,517 5,584 5,7625 - 9 5,723 5,715 5,717 5,815 5,841 5,824 5,850 5,829 5,791 5,813 5,807 5,496 5,408 5,493 5,637 5,763 5,881
10 -14 5,707 5,791 5,892 5,948 5,930 5,989 5,949 5,949 6,069 6,103 6,229 5,785 5,505 5,496 5,675 5,903 6,09415 -19 6,200 6,035 5,872 5,706 5,848 5,894 6,008 6,110 6,187 6,170 6,362 6,242 5,770 5,558 5,632 5,920 6,24220 -24 6,173 6,441 6,718 6,810 6,665 6,482 6,252 6,082 5,920 6,071 6,208 6,345 6,281 5,807 5,667 5,824 6,23125 -29 5,116 5,214 5,400 5,665 5,983 6,288 6,658 7,405 7,081 6,943 6,776 6,157 6,356 6,384 5,898 5,833 6,09030 -34 4,495 4,610 4,710 4,964 5,126 5,303 5,364 5,550 5,834 6,169 6,470 6,651 6,112 6,418 6,550 6,048 6,06135 -39 4,597 4,470 4,425 4,288 4,438 4,584 4,730 4,827 5,094 5,262 5,441 6,396 6,528 6,117 6,545 6,792 6,26440 -44 5,206 5,178 5,122 5,029 4,913 4,751 4,570 4,525 4,391 4,538 4,663 5,410 6,330 6,460 6,166 6,729 7,11245 -49 5,809 5,677 5,621 5,607 5,483 5,296 5,260 5,199 5,120 4,996 4,817 4,629 5,388 6,307 6,450 6,257 6,97250 -54 5,295 5,520 5,650 5,660 5,769 5,797 5,721 5,660 5,658 5,531 5,299 4,710 4,590 5,387 6,309 6,472 6,37655 -59 4,400 4,607 4,800 4,955 5,126 5,302 5,471 5,593 5,616 5,726 5,688 5,085 4,548 4,529 5,359 6,296 6,47760 -64 4,244 4,422 4,570 4,450 4,373 4,421 4,470 4,651 4,812 4,969 5,074 5,339 4,789 4,342 4,427 5,287 6,23165 -69 3,380 3,489 3,564 3,809 3,958 4,021 4,141 4,271 4,176 4,102 4,078 4,622 4,854 4,392 4,052 4,235 5,10970 -74 2,528 2,612 2,667 2,750 2,935 3,052 3,088 3,140 3,369 3,510 3,505 3,511 3,992 4,213 3,848 3,617 3,88575 -79 1,924 1,893 1,874 1,915 2,022 2,090 2,130 2,167 2,244 2,389 2,435 2,777 2,777 3,195 3,396 3,137 3,01380 -84 1,127 1,227 1,294 1,336 1,342 1,353 1,391 1,376 1,418 1,493 1,521 1,744 1,991 2,004 2,333 2,499 2,33585 &up 770 814 858 884 941 987 1,024 1,080 1,118 1,136 1,144 1,293 1,474 1,700 1,799 2,046 2,281Totals 78,400 79,333 80,358 81,027 82,089 82,864 83,488 85,037 85,502 86,535 87,033 87,579 88,074 89,252 91,260 94,242 98,416
FEMALES
0 - 4 5,439 5,436 5,448 5,504 5,492 5,545 5,583 5,616 5,598 5,608 5,512 5,379 5,366 5,424 5,489 5,543 5,7145 - 9 5,558 5,586 5,640 5,661 5,740 5,700 5,675 5,673 5,730 5,710 5,749 5,489 5,398 5,472 5,605 5,729 5,836
10 -14 5,427 5,520 5,641 5,709 5,760 5,795 5,825 5,887 5,931 6,017 6,178 5,731 5,496 5,478 5,648 5,864 6,04715 -19 6,155 5,908 5,622 5,417 5,509 5,619 5,745 5,869 5,958 6,016 6,214 6,212 5,730 5,550 5,617 5,888 6,20020 -24 6,123 6,406 6,712 6,894 6,814 6,525 6,152 5,849 5,652 5,751 5,997 6,221 6,286 5,787 5,670 5,821 6,21225 -29 5,437 5,488 5,566 5,688 5,868 6,278 6,647 6,983 7,215 7,149 6,892 5,975 6,258 6,421 5,901 5,851 6,09530 -34 5,116 5,296 5,438 5,507 5,581 5,640 5,668 5,742 5,886 6,081 6,538 6,754 5,960 6,360 6,629 6,076 6,09535 -39 5,191 5,098 5,035 5,028 5,186 5,349 5,462 5,601 5,687 5,765 5,834 6,462 6,614 6,003 6,524 6,915 6,32340 -44 5,568 5,586 5,571 5,539 5,486 5,372 5,249 5,181 5,190 5,350 5,555 5,809 6,392 6,544 6,095 6,756 7,28745 -49 6,216 6,202 6,180 6,144 6,015 5,858 5,726 5,714 5,692 5,635 5,551 5,512 5,793 6,367 6,532 6,243 7,06150 -54 5,904 6,007 6,102 6,113 6,206 6,243 6,310 6,281 6,263 6,138 5,985 5,468 5,457 5,807 6,381 6,577 6,43755 -59 5,120 5,347 5,524 5,672 5,861 5,950 6,036 6,121 6,145 6,238 6,245 5,804 5,343 5,397 5,815 6,392 6,62860 -64 4,854 4,990 5,101 5,082 5,099 5,132 5,305 5,475 5,635 5,823 5,880 5,986 5,568 5,205 5,324 5,818 6,39965 -69 3,938 4,096 4,203 4,422 4,611 4,758 4,847 4,942 4,940 4,956 4,958 5,518 5,620 5,282 5,020 5,210 5,77170 -74 2,982 3,132 3,259 3,409 3,543 3,743 3,851 3,947 4,160 4,332 4,439 4,502 5,021 5,151 4,901 4,742 4,99375 -79 2,312 2,388 2,469 2,542 2,674 2,764 2,819 2,934 3,081 3,197 3,357 3,888 3,919 4,416 4,561 4,404 4,34180 -84 1,554 1,629 1,703 1,774 1,887 1,882 1,981 2,041 2,110 2,216 2,270 2,711 3,133 3,166 3,604 3,749 3,68585 &up 1,661 1,654 1,731 1,774 1,844 1,948 1,997 2,073 2,169 2,262 2,294 2,690 3,185 3,746 4,055 4,519 4,871
Totals 84,555 85,769 86,945 87,879 89,176 90,101 90,878 91,929 93,042 94,244 95,448 96,111 96,539 97,576 99,371 102,097 105,995
Version 2021.0 A-14
D R A F T
10-19
-21

Delaware Population Consortium
Population Projection Series
October 31, 2021
Kent CountyWhite Alone Non-Hispanic Population
[As of July 1]
2010 2011 2012 2013 2014 2015 2016 2017 2018 2019 2020 2025 2030 2035 2040 2045 2050
0 - 4 6,072 5,953 6,086 5,833 5,993 6,125 6,311 6,752 6,658 6,608 6,238 5,993 5,875 5,947 6,155 6,305 6,306
5 - 9 6,305 6,275 6,254 6,189 6,167 6,090 5,992 6,096 6,258 6,408 6,294 6,305 6,057 5,937 6,010 6,222 6,372
10 -14 6,356 6,426 6,484 6,483 6,476 6,428 6,325 6,269 6,188 6,141 5,836 6,369 6,381 6,129 6,009 6,083 6,297
15 -19 6,682 6,287 6,270 6,275 6,369 6,431 6,469 6,491 6,471 6,440 6,151 5,896 6,436 6,446 6,193 6,072 6,145
20 -24 6,956 7,261 7,152 6,937 6,788 6,465 6,322 6,273 6,260 6,325 6,146 6,206 5,953 6,498 6,510 6,251 6,128
25 -29 6,707 6,818 6,955 7,059 7,190 7,301 7,300 6,842 6,915 6,741 6,177 6,202 6,263 6,006 6,556 6,569 6,308
30 -34 6,255 6,444 6,597 6,720 6,755 6,848 6,844 6,949 7,029 7,131 6,968 6,225 6,247 6,311 6,052 6,606 6,617
35 -39 6,348 6,126 6,043 5,895 6,094 6,313 6,467 6,585 6,689 6,695 6,531 7,017 6,266 6,293 6,356 6,095 6,655
40 -44 7,289 7,094 6,955 6,818 6,713 6,434 6,129 6,019 5,853 6,026 6,006 6,562 7,048 6,294 6,318 6,382 6,120
45 -49 8,383 8,167 8,058 7,915 7,634 7,291 7,079 6,906 6,751 6,617 6,105 6,017 6,571 7,059 6,303 6,326 6,392
50 -54 7,990 8,157 8,276 8,238 8,272 8,210 8,103 7,954 7,790 7,480 6,871 6,075 5,991 6,541 7,026 6,273 6,295
55 -59 6,849 7,080 7,299 7,459 7,694 7,842 7,990 8,063 8,004 8,006 7,641 6,746 5,965 5,885 6,426 6,900 6,156
60 -64 6,781 6,922 7,065 6,857 6,746 6,719 6,820 6,997 7,130 7,322 7,177 7,378 6,513 5,757 5,687 6,206 6,663
65 -69 5,647 5,810 5,906 6,229 6,410 6,449 6,491 6,586 6,383 6,253 5,990 6,746 6,933 6,113 5,407 5,350 5,834
70 -74 4,254 4,387 4,493 4,642 4,877 5,123 5,215 5,268 5,551 5,691 5,504 5,381 6,060 6,225 5,480 4,849 4,814
75 -79 3,357 3,360 3,392 3,425 3,576 3,655 3,693 3,763 3,887 4,061 4,102 4,636 4,528 5,102 5,237 4,601 4,074
80 -84 2,201 2,322 2,408 2,492 2,550 2,522 2,574 2,591 2,621 2,717 2,666 3,146 3,558 3,469 3,910 4,005 3,507
85 &up 1,999 2,015 2,090 2,111 2,190 2,278 2,330 2,393 2,464 2,507 2,415 2,661 3,081 3,533 3,653 3,958 4,134
Totals 106,431 106,904 107,783 107,577 108,494 108,524 108,454 108,797 108,902 109,169 104,818 105,561 105,726 105,545 105,288 105,053 104,817
Version 2021.0 A-15
D R A F T
10-19
-21

Delaware Population Consortium
Population Projection Series
October 31, 2021
Kent CountyWhite Alone Non-Hispanic Population
[As of July 1]
2010 2011 2012 2013 2014 2015 2016 2017 2018 2019 2020 2025 2030 2035 2040 2045 2050
MALES
0 - 4 3,159 3,055 3,095 2,718 2,794 2,855 2,933 3,376 3,329 3,303 3,118 2,996 2,937 2,973 3,077 3,152 3,1535 - 9 3,270 3,260 3,240 3,232 3,199 3,134 3,075 3,100 3,147 3,225 3,164 3,151 3,028 2,968 3,004 3,109 3,185
10 -14 3,302 3,356 3,391 3,363 3,352 3,331 3,285 3,248 3,231 3,185 3,002 3,201 3,189 3,063 3,003 3,040 3,14815 -19 3,434 3,298 3,281 3,293 3,350 3,378 3,376 3,392 3,354 3,331 3,185 3,032 3,232 3,219 3,093 3,033 3,06920 -24 3,553 3,716 3,705 3,590 3,498 3,359 3,311 3,277 3,279 3,320 3,223 3,208 3,055 3,257 3,244 3,115 3,05425 -29 3,302 3,353 3,435 3,541 3,653 3,700 3,729 3,389 3,574 3,468 3,205 3,246 3,232 3,076 3,280 3,268 3,13930 -34 2,997 3,092 3,169 3,271 3,296 3,354 3,358 3,423 3,518 3,614 3,523 3,222 3,263 3,249 3,094 3,298 3,28435 -39 3,038 2,911 2,859 2,770 2,880 2,994 3,098 3,159 3,250 3,260 3,195 3,542 3,237 3,281 3,266 3,110 3,31540 -44 3,622 3,531 3,455 3,337 3,272 3,088 2,905 2,841 2,742 2,840 2,841 3,201 3,549 3,244 3,286 3,271 3,11445 -49 4,108 3,947 3,880 3,850 3,724 3,594 3,511 3,419 3,293 3,213 2,920 2,835 3,194 3,542 3,238 3,279 3,26550 -54 3,851 3,970 4,050 4,018 4,021 3,967 3,899 3,812 3,773 3,633 3,373 2,893 2,810 3,165 3,509 3,209 3,24955 -59 3,230 3,356 3,476 3,551 3,681 3,777 3,864 3,920 3,880 3,866 3,668 3,289 2,819 2,742 3,088 3,424 3,12960 -64 3,243 3,310 3,377 3,255 3,173 3,198 3,197 3,295 3,357 3,464 3,419 3,501 3,140 2,690 2,619 2,949 3,27165 -69 2,662 2,767 2,824 2,972 3,027 3,012 3,047 3,090 2,975 2,887 2,799 3,154 3,227 2,893 2,477 2,417 2,72070 -74 1,944 2,002 2,044 2,118 2,271 2,362 2,408 2,439 2,565 2,604 2,488 2,432 2,742 2,802 2,509 2,146 2,10375 -79 1,573 1,520 1,482 1,485 1,544 1,583 1,595 1,617 1,678 1,791 1,791 1,979 1,931 2,181 2,225 1,990 1,69980 -84 937 1,023 1,066 1,100 1,095 1,081 1,083 1,051 1,057 1,089 1,073 1,275 1,406 1,370 1,550 1,576 1,40785 &up 630 668 699 705 741 780 809 841 862 863 830 873 1,004 1,125 1,137 1,237 1,286Totals 51,855 52,135 52,528 52,169 52,571 52,547 52,483 52,689 52,864 52,956 50,817 51,030 50,995 50,840 50,699 50,623 50,590
FEMALES
0 - 4 2,913 2,898 2,991 3,115 3,199 3,270 3,378 3,376 3,329 3,305 3,120 2,997 2,938 2,974 3,078 3,153 3,1535 - 9 3,035 3,015 3,014 2,957 2,968 2,956 2,917 2,996 3,111 3,183 3,130 3,154 3,029 2,969 3,006 3,113 3,187
10 -14 3,054 3,070 3,093 3,120 3,124 3,097 3,040 3,021 2,957 2,956 2,834 3,168 3,192 3,066 3,006 3,043 3,14915 -19 3,248 2,989 2,989 2,982 3,019 3,053 3,093 3,099 3,117 3,109 2,966 2,864 3,204 3,227 3,100 3,039 3,07620 -24 3,403 3,545 3,447 3,347 3,290 3,106 3,011 2,996 2,981 3,005 2,923 2,998 2,898 3,241 3,266 3,136 3,07425 -29 3,405 3,465 3,520 3,518 3,537 3,601 3,571 3,453 3,341 3,273 2,972 2,956 3,031 2,930 3,276 3,301 3,16930 -34 3,258 3,352 3,428 3,449 3,459 3,494 3,486 3,526 3,511 3,517 3,445 3,003 2,984 3,062 2,958 3,308 3,33335 -39 3,310 3,215 3,184 3,125 3,214 3,319 3,369 3,426 3,439 3,435 3,336 3,475 3,029 3,012 3,090 2,985 3,34040 -44 3,667 3,563 3,500 3,481 3,441 3,346 3,224 3,178 3,111 3,186 3,165 3,361 3,499 3,050 3,032 3,111 3,00645 -49 4,275 4,220 4,178 4,065 3,910 3,697 3,568 3,487 3,458 3,404 3,185 3,182 3,377 3,517 3,065 3,047 3,12750 -54 4,139 4,187 4,226 4,220 4,251 4,243 4,204 4,142 4,017 3,847 3,498 3,182 3,181 3,376 3,517 3,064 3,04655 -59 3,619 3,724 3,823 3,908 4,013 4,065 4,126 4,143 4,124 4,140 3,973 3,457 3,146 3,143 3,338 3,476 3,02760 -64 3,538 3,612 3,688 3,602 3,573 3,521 3,623 3,702 3,773 3,858 3,758 3,877 3,373 3,067 3,068 3,257 3,39265 -69 2,985 3,043 3,082 3,257 3,383 3,437 3,444 3,496 3,408 3,366 3,191 3,592 3,706 3,220 2,930 2,933 3,11470 -74 2,310 2,385 2,449 2,524 2,606 2,761 2,807 2,829 2,986 3,087 3,016 2,949 3,318 3,423 2,971 2,703 2,71175 -79 1,784 1,840 1,910 1,940 2,032 2,072 2,098 2,146 2,209 2,270 2,311 2,657 2,597 2,921 3,012 2,611 2,37580 -84 1,264 1,299 1,342 1,392 1,455 1,441 1,491 1,540 1,564 1,628 1,593 1,871 2,152 2,099 2,360 2,429 2,10085 &up 1,369 1,347 1,391 1,406 1,449 1,498 1,521 1,552 1,602 1,644 1,585 1,788 2,077 2,408 2,516 2,721 2,848
Totals 54,576 54,769 55,255 55,408 55,923 55,977 55,971 56,108 56,038 56,213 54,001 54,531 54,731 54,705 54,589 54,430 54,227
Version 2021.0 A-16
D R A F T
10-19
-21

Delaware Population Consortium
Population Projection Series
October 31, 2021
Kent CountyBlack Alone Non-Hispanic Population
[As of July 1]
2010 2011 2012 2013 2014 2015 2016 2017 2018 2019 2020 2025 2030 2035 2040 2045 2050
0 - 4 2,765 2,766 2,806 2,783 2,839 2,939 3,009 3,105 3,097 3,113 2,964 2,471 1,964 1,589 1,328 1,109 908
5 - 9 2,897 2,881 2,853 2,921 2,943 2,910 2,933 3,001 3,083 3,193 3,152 2,648 2,128 1,694 1,368 1,145 956
10 -14 3,024 3,039 3,069 3,065 2,990 3,043 3,059 3,059 3,170 3,235 3,062 2,819 2,286 1,838 1,461 1,180 989
15 -19 3,983 3,917 3,492 3,065 3,084 3,109 3,227 3,286 3,323 3,285 3,198 2,738 2,432 1,970 1,586 1,260 1,019
20 -24 3,759 3,988 4,558 4,991 4,881 4,663 4,150 3,736 3,323 3,386 3,265 2,855 2,359 2,096 1,700 1,366 1,085
25 -29 2,436 2,440 2,516 2,701 3,044 3,552 4,222 4,869 5,402 5,347 4,893 2,912 2,458 2,031 1,804 1,463 1,177
30 -34 2,140 2,132 2,147 2,289 2,406 2,483 2,576 2,680 2,918 3,329 3,720 4,354 2,501 2,111 1,743 1,551 1,256
35 -39 2,280 2,229 2,154 2,087 2,110 2,185 2,246 2,285 2,464 2,624 2,593 3,302 3,732 2,142 1,809 1,494 1,328
40 -44 2,455 2,574 2,585 2,543 2,456 2,387 2,344 2,289 2,244 2,297 2,279 2,298 2,825 3,190 1,831 1,547 1,279
45 -49 2,655 2,692 2,702 2,744 2,719 2,689 2,695 2,730 2,723 2,662 2,477 2,011 1,957 2,409 2,718 1,559 1,317
50 -54 2,385 2,503 2,573 2,585 2,674 2,775 2,805 2,838 2,922 2,933 2,778 2,176 1,706 1,661 2,043 2,305 1,324
55 -59 2,082 2,184 2,258 2,339 2,413 2,469 2,564 2,661 2,711 2,839 2,822 2,404 1,817 1,425 1,388 1,708 1,923
60 -64 1,766 1,907 1,984 2,021 2,069 2,145 2,208 2,301 2,418 2,526 2,478 2,408 1,981 1,496 1,174 1,143 1,406
65 -69 1,266 1,353 1,423 1,544 1,632 1,744 1,874 1,964 2,032 2,109 2,096 2,060 1,933 1,589 1,200 946 918
70 -74 959 1,005 1,047 1,105 1,180 1,235 1,284 1,361 1,498 1,607 1,648 1,688 1,601 1,499 1,234 931 733
75 -79 688 725 745 778 829 872 908 956 1,028 1,110 1,117 1,272 1,257 1,193 1,113 920 691
80 -84 346 385 426 450 496 534 606 626 666 720 730 799 880 872 823 769 636
85 &up 343 349 379 407 437 474 492 540 595 649 677 805 876 957 990 969 918
Totals 38,229 39,069 39,717 40,418 41,202 42,208 43,202 44,287 45,617 46,964 45,949 42,020 36,693 31,762 27,313 23,365 19,863
Version 2021.0 A-17
D R A F T
10-19
-21

Delaware Population Consortium
Population Projection Series
October 31, 2021
Kent CountyBlack Alone Non-Hispanic Population
[As of July 1]
2010 2011 2012 2013 2014 2015 2016 2017 2018 2019 2020 2025 2030 2035 2040 2045 2050
MALES
0 - 4 1,413 1,444 1,457 1,388 1,412 1,451 1,468 1,550 1,545 1,553 1,478 1,230 978 792 662 554 4535 - 9 1,422 1,407 1,387 1,458 1,463 1,484 1,530 1,557 1,572 1,627 1,590 1,320 1,059 843 681 570 477
10 -14 1,552 1,560 1,573 1,569 1,521 1,534 1,495 1,487 1,582 1,609 1,561 1,422 1,139 916 727 587 49215 -19 1,915 1,894 1,748 1,532 1,554 1,567 1,656 1,685 1,700 1,671 1,613 1,394 1,226 981 789 627 50720 -24 1,806 1,903 2,144 2,350 2,294 2,197 2,006 1,870 1,660 1,707 1,645 1,439 1,201 1,057 846 679 54025 -29 1,133 1,161 1,216 1,311 1,499 1,732 2,012 2,286 2,538 2,510 2,301 1,465 1,238 1,033 908 727 58530 -34 918 895 884 1,006 1,081 1,160 1,225 1,294 1,413 1,637 1,813 2,046 1,257 1,061 885 780 62435 -39 1,022 1,023 997 922 917 932 939 940 1,079 1,176 1,208 1,606 1,749 1,073 907 757 66640 -44 1,124 1,177 1,179 1,170 1,113 1,098 1,072 1,056 987 994 968 1,067 1,368 1,490 915 773 64745 -49 1,260 1,270 1,265 1,271 1,263 1,202 1,230 1,241 1,250 1,203 1,137 851 906 1,165 1,268 778 65750 -54 1,075 1,173 1,211 1,220 1,278 1,344 1,318 1,324 1,348 1,356 1,237 995 720 767 984 1,071 65855 -59 917 945 979 1,040 1,073 1,110 1,196 1,248 1,274 1,352 1,361 1,064 827 597 638 819 88960 -64 780 878 933 919 910 932 944 988 1,064 1,110 1,103 1,150 869 674 488 520 66865 -69 568 590 612 681 734 785 848 907 908 911 895 902 909 685 532 386 41270 -74 455 456 458 481 524 543 546 570 644 708 725 703 685 689 519 402 29075 -79 291 313 323 333 358 375 390 394 423 466 464 530 495 484 487 367 28380 -84 142 156 179 187 190 216 250 261 274 298 302 319 354 329 320 324 24485 &up 107 112 118 130 149 152 155 176 196 209 221 267 283 309 304 293 292Totals 17,900 18,357 18,663 18,968 19,333 19,814 20,280 20,834 21,457 22,097 21,622 19,770 17,263 14,945 12,860 11,014 9,384
FEMALES
0 - 4 1,352 1,322 1,349 1,395 1,427 1,488 1,541 1,555 1,552 1,560 1,486 1,241 986 797 666 555 4555 - 9 1,475 1,474 1,466 1,463 1,480 1,426 1,403 1,444 1,511 1,566 1,562 1,328 1,069 851 687 575 479
10 -14 1,472 1,479 1,496 1,496 1,469 1,509 1,564 1,572 1,588 1,626 1,501 1,397 1,147 922 734 593 49715 -19 2,068 2,023 1,744 1,533 1,530 1,542 1,571 1,601 1,623 1,614 1,585 1,344 1,206 989 797 633 51220 -24 1,953 2,085 2,414 2,641 2,587 2,466 2,144 1,866 1,663 1,679 1,620 1,416 1,158 1,039 854 687 54525 -29 1,303 1,279 1,300 1,390 1,545 1,820 2,210 2,583 2,864 2,837 2,592 1,447 1,220 998 896 736 59230 -34 1,222 1,237 1,263 1,283 1,325 1,323 1,351 1,386 1,505 1,692 1,907 2,308 1,244 1,050 858 771 63235 -39 1,258 1,206 1,157 1,165 1,193 1,253 1,307 1,345 1,385 1,448 1,385 1,696 1,983 1,069 902 737 66240 -44 1,331 1,397 1,406 1,373 1,343 1,289 1,272 1,233 1,257 1,303 1,311 1,231 1,457 1,700 916 774 63245 -49 1,395 1,422 1,437 1,473 1,456 1,487 1,465 1,489 1,473 1,459 1,340 1,160 1,051 1,244 1,450 781 66050 -54 1,310 1,330 1,362 1,365 1,396 1,431 1,487 1,514 1,574 1,577 1,541 1,181 986 894 1,059 1,234 66655 -59 1,165 1,239 1,279 1,299 1,340 1,359 1,368 1,413 1,437 1,487 1,461 1,340 990 828 750 889 1,03460 -64 986 1,029 1,051 1,102 1,159 1,213 1,264 1,313 1,354 1,416 1,375 1,258 1,112 822 686 623 73865 -69 698 763 811 863 898 959 1,026 1,057 1,124 1,198 1,201 1,158 1,024 904 668 560 50670 -74 504 549 589 624 656 692 738 791 854 899 923 985 916 810 715 529 44375 -79 397 412 422 445 471 497 518 562 605 644 653 742 762 709 626 553 40880 -84 204 229 247 263 306 318 356 365 392 422 428 480 526 543 503 445 39285 &up 236 237 261 277 288 322 337 364 399 440 456 538 593 648 686 676 626
Totals 20,329 20,712 21,054 21,450 21,869 22,394 22,922 23,453 24,160 24,867 24,327 22,250 19,430 16,817 14,453 12,351 10,479
Version 2021.0 A-18
D R A F T
10-19
-21

Delaware Population Consortium
Population Projection Series
October 31, 2021
Kent CountyOther Races, Including Two or More Races, Non-Hispanic Population
[As of July 1]
2010 2011 2012 2013 2014 2015 2016 2017 2018 2019 2020 2025 2030 2035 2040 2045 2050
0 - 4 1,081 1,108 998 1,052 905 791 624 404 431 436 721 928 1,050 1,023 858 682 613
5 - 9 1,040 1,010 1,018 1,073 1,119 1,167 1,223 1,111 939 805 998 734 947 1,071 1,042 874 695
10 -14 923 963 1,026 1,072 1,064 1,092 1,116 1,134 1,205 1,249 1,967 1,019 749 966 1,092 1,062 891
15 -19 791 818 842 876 967 1,015 1,064 1,141 1,199 1,184 1,841 2,007 1,037 763 983 1,112 1,082
20 -24 646 645 706 759 780 852 900 935 983 1,077 1,709 1,877 2,046 1,057 775 1,000 1,133
25 -29 548 576 597 628 641 692 715 1,194 850 869 1,434 1,742 1,911 2,080 1,075 791 1,018
30 -34 495 506 523 551 558 601 636 664 703 714 1,164 1,461 1,772 1,945 2,116 1,094 803
35 -39 527 530 534 546 568 569 559 581 618 621 1,008 1,182 1,485 1,800 1,975 2,148 1,111
40 -44 520 554 553 553 567 588 584 591 611 630 956 1,023 1,202 1,507 1,826 2,004 2,182
45 -49 508 541 555 586 587 586 607 613 616 626 982 970 1,037 1,217 1,526 1,850 2,028
50 -54 454 458 462 489 531 552 591 615 651 646 977 993 977 1,047 1,228 1,540 1,867
55 -59 344 390 431 441 466 496 500 509 541 582 915 982 995 981 1,047 1,230 1,540
60 -64 318 329 339 369 363 387 422 468 483 505 811 910 972 986 972 1,041 1,218
65 -69 264 263 270 283 317 345 353 365 399 390 629 793 887 948 963 948 1,013
70 -74 178 205 217 242 247 265 277 286 299 331 542 599 755 844 898 915 902
75 -79 120 130 139 153 174 192 206 220 245 249 405 501 549 692 775 825 838
80 -84 73 84 97 109 117 118 129 138 149 168 275 353 436 479 600 671 711
85 &up 40 45 55 63 82 100 112 131 140 154 254 370 488 621 725 866 1,004
Totals 8,870 9,155 9,362 9,845 10,053 10,408 10,618 11,100 11,062 11,236 17,588 18,444 19,295 20,027 20,476 20,653 20,649
Version 2021.0 A-19
D R A F T
10-19
-21

Delaware Population Consortium
Population Projection Series
October 31, 2021
Kent CountyOther Races, Including Two or More Races, Non-Hispanic Population
[As of July 1]
2010 2011 2012 2013 2014 2015 2016 2017 2018 2019 2020 2025 2030 2035 2040 2045 2050
MALES
0 - 4 528 513 466 603 532 495 410 202 215 218 360 464 524 511 428 341 3065 - 9 501 481 482 505 520 537 565 519 438 389 497 367 473 535 521 436 347
10 -14 467 459 487 514 501 524 532 537 567 581 906 508 374 483 546 531 44515 -19 402 393 403 418 470 484 508 542 575 557 883 923 516 381 490 555 54120 -24 313 295 327 358 360 404 431 447 468 522 815 900 940 525 387 499 56525 -29 245 253 265 285 295 302 328 772 401 401 679 830 915 955 534 394 50730 -34 209 197 215 230 244 271 279 295 319 328 507 691 843 930 970 543 39935 -39 236 208 203 197 205 209 218 239 258 272 454 514 702 855 943 983 55140 -44 215 225 224 231 231 232 228 224 221 227 350 461 522 710 867 955 99845 -49 207 221 232 235 236 241 245 248 257 255 386 354 466 528 718 876 96550 -54 192 172 165 190 208 223 241 257 261 259 401 389 355 469 530 722 88155 -59 121 146 170 169 176 190 186 181 209 227 370 402 388 355 467 529 72060 -64 128 125 132 138 138 143 157 183 184 189 307 364 395 381 350 462 52065 -69 95 82 80 96 117 126 134 142 148 148 230 297 351 380 368 335 44470 -74 75 80 81 82 75 83 84 84 99 119 193 214 277 327 352 342 31275 -79 33 33 39 47 59 67 77 78 79 73 122 172 189 243 289 312 30180 -84 26 26 27 31 36 35 33 38 44 54 91 101 143 157 201 239 25785 &up 14 14 18 20 23 27 32 35 35 38 65 100 125 168 198 242 296Totals 4,007 3,923 4,016 4,349 4,426 4,593 4,688 5,023 4,778 4,857 7,616 8,051 8,498 8,893 9,159 9,296 9,355
FEMALES
0 - 4 553 595 532 449 373 296 214 202 216 218 361 464 526 512 430 341 3075 - 9 539 529 536 568 599 630 658 592 501 416 501 367 474 536 521 438 348
10 -14 456 504 539 558 563 568 584 597 638 668 1,061 511 375 483 546 531 44615 -19 389 425 439 458 497 531 556 599 624 627 958 1,084 521 382 493 557 54120 -24 333 350 379 401 420 448 469 488 515 555 894 977 1,106 532 388 501 56825 -29 303 323 332 343 346 390 387 422 449 468 755 912 996 1,125 541 397 51130 -34 286 309 308 321 314 330 357 369 384 386 657 770 929 1,015 1,146 551 40435 -39 291 322 331 349 363 360 341 342 360 349 554 668 783 945 1,032 1,165 56040 -44 305 329 329 322 336 356 356 367 390 403 606 562 680 797 959 1,049 1,18445 -49 301 320 323 351 351 345 362 365 359 371 596 616 571 689 808 974 1,06350 -54 262 286 297 299 323 329 350 358 390 387 576 604 622 578 698 818 98655 -59 223 244 261 272 290 306 314 328 332 355 545 580 607 626 580 701 82060 -64 190 204 207 231 225 244 265 285 299 316 504 546 577 605 622 579 69865 -69 169 181 190 187 200 219 219 223 251 242 399 496 536 568 595 613 56970 -74 103 125 136 160 172 182 193 202 200 212 349 385 478 517 546 573 59075 -79 87 97 100 106 115 125 129 142 166 176 283 329 360 449 486 513 53780 -84 47 58 70 78 81 83 96 100 105 114 184 252 293 322 399 432 45485 &up 26 31 37 43 59 73 80 96 105 116 189 270 363 453 527 624 708
Totals 4,863 5,232 5,346 5,496 5,627 5,815 5,930 6,077 6,284 6,379 9,972 10,393 10,797 11,134 11,317 11,357 11,294
Version 2021.0 A-20
D R A F T
10-19
-21

Delaware Population Consortium
Population Projection Series
October 31, 2021
Kent CountyHispanic Population
[As of July 1]
2010 2011 2012 2013 2014 2015 2016 2017 2018 2019 2020 2025 2030 2035 2040 2045 2050
0 - 4 1,227 1,227 1,162 1,272 1,151 1,120 1,050 978 1,016 1,065 1,105 1,374 1,858 2,315 2,665 3,031 3,649
5 - 9 1,039 1,135 1,232 1,293 1,352 1,357 1,377 1,294 1,241 1,117 1,112 1,298 1,674 2,263 2,822 3,251 3,694
10 -14 831 883 954 1,037 1,160 1,221 1,274 1,374 1,437 1,495 1,542 1,309 1,585 2,041 2,761 3,442 3,964
15 -19 899 921 890 907 937 958 993 1,061 1,152 1,277 1,386 1,813 1,595 1,929 2,487 3,364 4,196
20 -24 935 953 1,014 1,017 1,030 1,027 1,032 987 1,006 1,034 1,085 1,628 2,209 1,943 2,352 3,028 4,097
25 -29 862 868 898 965 976 1,021 1,068 1,483 1,129 1,135 1,164 1,276 1,982 2,688 2,364 2,861 3,682
30 -34 721 824 881 911 988 1,011 976 999 1,070 1,076 1,156 1,365 1,552 2,411 3,268 2,873 3,480
35 -39 633 683 729 788 852 866 920 977 1,010 1,087 1,143 1,357 1,659 1,885 2,929 3,970 3,493
40 -44 510 542 600 654 663 714 762 807 873 935 977 1,336 1,647 2,013 2,286 3,552 4,818
45 -49 479 479 486 506 558 588 605 664 722 726 804 1,143 1,616 1,989 2,435 2,765 4,296
50 -54 370 409 441 461 498 503 532 534 558 610 658 934 1,373 1,945 2,393 2,931 3,327
55 -59 245 300 336 388 414 445 453 481 505 537 555 757 1,114 1,635 2,313 2,850 3,486
60 -64 233 254 283 285 294 302 325 360 416 439 488 629 891 1,308 1,918 2,715 3,343
65 -69 141 159 168 175 210 241 270 298 302 306 321 541 721 1,024 1,502 2,201 3,115
70 -74 119 147 169 170 174 172 163 172 181 213 250 345 597 796 1,137 1,664 2,429
75 -79 71 66 67 101 117 135 142 162 165 166 168 256 362 624 832 1,195 1,751
80 -84 61 65 66 59 66 61 63 62 92 104 120 157 250 350 604 803 1,166
85 &up 49 59 65 77 76 83 87 89 88 88 92 147 214 335 486 772 1,096
Totals 9,425 9,974 10,441 11,066 11,516 11,825 12,092 12,782 12,963 13,410 14,126 17,665 22,899 29,494 37,554 47,268 59,082
Version 2021.0 A-21
D R A F T
10-19
-21

Delaware Population Consortium
Population Projection Series
October 31, 2021
Kent CountyHispanic Population
[As of July 1]
2010 2011 2012 2013 2014 2015 2016 2017 2018 2019 2020 2025 2030 2035 2040 2045 2050
MALES
0 - 4 606 606 586 727 658 629 600 495 515 540 560 697 942 1,174 1,350 1,537 1,8505 - 9 530 567 608 620 659 669 680 653 634 572 556 658 848 1,147 1,431 1,648 1,872
10 -14 386 416 441 502 556 600 637 677 689 728 760 654 803 1,034 1,399 1,745 2,00915 -19 449 450 440 463 474 465 468 491 558 611 681 893 796 977 1,260 1,705 2,12520 -24 501 527 542 512 513 522 504 488 513 522 525 798 1,085 968 1,190 1,531 2,07225 -29 436 447 484 528 536 554 589 958 568 564 591 616 971 1,320 1,176 1,444 1,85930 -34 371 426 442 457 505 518 502 538 584 590 627 692 749 1,178 1,601 1,427 1,75435 -39 301 328 366 399 436 449 475 489 507 554 584 734 840 908 1,429 1,942 1,73240 -44 245 245 264 291 297 333 365 404 441 477 504 681 891 1,016 1,098 1,730 2,35345 -49 234 239 244 251 260 259 274 291 320 325 374 589 822 1,072 1,226 1,324 2,08550 -54 177 205 224 232 262 263 263 267 276 283 288 433 705 986 1,286 1,470 1,58855 -59 132 160 175 195 196 225 225 244 253 281 289 330 514 835 1,166 1,524 1,73960 -64 93 109 128 138 152 148 172 185 207 206 245 324 385 597 970 1,356 1,77265 -69 55 50 48 60 80 98 112 132 145 156 154 269 367 434 675 1,097 1,53370 -74 54 74 84 69 65 64 50 47 61 79 99 162 288 395 468 727 1,18075 -79 27 27 30 50 61 65 68 78 64 59 58 96 162 287 395 468 73080 -84 22 22 22 18 21 21 25 26 43 52 55 49 88 148 262 360 42785 &up 19 20 23 29 28 28 28 28 25 26 28 53 62 98 160 274 407Totals 4,638 4,918 5,151 5,541 5,759 5,910 6,037 6,491 6,403 6,625 6,978 8,728 11,318 14,574 18,542 23,309 29,087
FEMALES
0 - 4 621 621 576 545 493 491 450 483 501 525 545 677 916 1,141 1,315 1,494 1,7995 - 9 509 568 624 673 693 688 697 641 607 545 556 640 826 1,116 1,391 1,603 1,822
10 -14 445 467 513 535 604 621 637 697 748 767 782 655 782 1,007 1,362 1,697 1,95515 -19 450 471 450 444 463 493 525 570 594 666 705 920 799 952 1,227 1,659 2,07120 -24 434 426 472 505 517 505 528 499 493 512 560 830 1,124 975 1,162 1,497 2,02525 -29 426 421 414 437 440 467 479 525 561 571 573 660 1,011 1,368 1,188 1,417 1,82330 -34 350 398 439 454 483 493 474 461 486 486 529 673 803 1,233 1,667 1,446 1,72635 -39 332 355 363 389 416 417 445 488 503 533 559 623 819 977 1,500 2,028 1,76140 -44 265 297 336 363 366 381 397 403 432 458 473 655 756 997 1,188 1,822 2,46545 -49 245 240 242 255 298 329 331 373 402 401 430 554 794 917 1,209 1,441 2,21150 -54 193 204 217 229 236 240 269 267 282 327 370 501 668 959 1,107 1,461 1,73955 -59 113 140 161 193 218 220 228 237 252 256 266 427 600 800 1,147 1,326 1,74760 -64 140 145 155 147 142 154 153 175 209 233 243 305 506 711 948 1,359 1,57165 -69 86 109 120 115 130 143 158 166 157 150 167 272 354 590 827 1,104 1,58270 -74 65 73 85 101 109 108 113 125 120 134 151 183 309 401 669 937 1,24975 -79 44 39 37 51 56 70 74 84 101 107 110 160 200 337 437 727 1,02180 -84 39 43 44 41 45 40 38 36 49 52 65 108 162 202 342 443 73985 &up 30 39 42 48 48 55 59 61 63 62 64 94 152 237 326 498 689
Totals 4,787 5,056 5,290 5,525 5,757 5,915 6,055 6,291 6,560 6,785 7,148 8,937 11,581 14,920 19,012 23,959 29,995
Version 2021.0 A-22
D R A F T
10-19
-21

Delaware Population Consortium
Population Projection Series
October 31, 2021
City of DoverTotal Population
[As of July 1]
2010 2011 2012 2013 2014 2015 2016 2017 2018 2019 2020 2025 2030 2035 2040 2045 2050
0 - 4 2,362 2,389 2,416 2,417 2,431 2,435 2,452 2,464 2,503 2,514 2,601 2,636 2,672 2,730 2,787 2,874 2,961
5 - 9 2,193 2,217 2,243 2,243 2,257 2,261 2,277 2,288 2,324 2,334 2,415 2,448 2,481 2,535 2,588 2,669 2,750
10 -14 1,974 1,996 2,019 2,019 2,032 2,032 2,047 2,057 2,090 2,098 2,171 2,201 2,231 2,279 2,327 2,400 2,472
15 -19 3,436 3,475 3,515 3,516 3,537 3,539 3,564 3,582 3,638 3,653 3,780 3,832 3,884 3,967 4,051 4,178 4,304
20 -24 4,523 4,574 4,627 4,627 4,656 4,658 4,691 4,714 4,789 4,809 4,976 5,044 5,112 5,222 5,332 5,499 5,665
25 -29 2,883 2,915 2,949 2,949 2,967 2,969 2,990 3,005 3,052 3,065 3,171 3,215 3,258 3,328 3,399 3,505 3,611
30 -34 2,042 2,065 2,089 2,090 2,102 2,103 2,118 2,129 2,162 2,171 2,247 2,277 2,308 2,358 2,408 2,483 2,558
35 -39 1,848 1,869 1,891 1,891 1,902 1,903 1,917 1,926 1,957 1,965 2,033 2,061 2,089 2,134 2,179 2,247 2,315
40 -44 1,858 1,879 1,901 1,901 1,913 1,913 1,927 1,937 1,967 1,975 2,044 2,072 2,100 2,145 2,191 2,259 2,327
45 -49 2,118 2,142 2,167 2,167 2,180 2,181 2,196 2,207 2,242 2,252 2,330 2,362 2,393 2,445 2,497 2,575 2,653
50 -54 2,061 2,085 2,109 2,109 2,122 2,122 2,138 2,148 2,182 2,191 2,267 2,298 2,329 2,380 2,430 2,506 2,582
55 -59 1,760 1,780 1,801 1,801 1,812 1,813 1,826 1,835 1,864 1,872 1,936 1,963 1,989 2,032 2,075 2,140 2,205
60 -64 1,652 1,671 1,690 1,690 1,701 1,701 1,713 1,722 1,749 1,756 1,817 1,842 1,867 1,907 1,947 2,008 2,069
65 -69 1,410 1,426 1,442 1,443 1,451 1,452 1,462 1,470 1,493 1,499 1,551 1,572 1,593 1,628 1,662 1,714 1,766
70 -74 1,073 1,086 1,098 1,098 1,105 1,105 1,113 1,119 1,136 1,141 1,181 1,197 1,213 1,239 1,265 1,305 1,344
75 -79 1,029 1,040 1,052 1,052 1,059 1,059 1,067 1,072 1,089 1,093 1,131 1,147 1,162 1,187 1,213 1,250 1,288
80 -84 756 764 773 773 778 778 784 788 800 803 831 843 854 872 891 919 946
85 &up 916 926 937 937 943 943 950 954 970 974 1,007 1,021 1,035 1,057 1,080 1,113 1,147
Totals 35,894 36,300 36,720 36,724 36,949 36,967 37,229 37,416 38,008 38,166 39,491 40,031 40,570 41,446 42,322 43,643 44,964
Version 2021.0 A-23
D R A F T
10-19
-21

Delaware Population Consortium
Population Projection Series
October 31, 2021
City of DoverTotal Population
[As of July 1]
2010 2011 2012 2013 2014 2015 2016 2017 2018 2019 2020 2025 2030 2035 2040 2045 2050
MALES
0 - 4 1,221 1,235 1,249 1,249 1,257 1,258 1,267 1,274 1,294 1,299 1,344 1,363 1,381 1,411 1,441 1,486 1,5315 - 9 1,067 1,080 1,092 1,092 1,099 1,100 1,108 1,114 1,131 1,136 1,175 1,192 1,208 1,234 1,260 1,299 1,338
10 -14 1,008 1,019 1,031 1,031 1,037 1,039 1,046 1,051 1,068 1,072 1,110 1,125 1,140 1,165 1,189 1,226 1,26315 -19 1,639 1,658 1,677 1,677 1,687 1,689 1,701 1,710 1,737 1,744 1,805 1,830 1,854 1,894 1,934 1,995 2,05520 -24 2,282 2,308 2,335 2,335 2,349 2,353 2,369 2,381 2,419 2,429 2,513 2,548 2,582 2,638 2,693 2,777 2,86125 -29 1,441 1,457 1,474 1,474 1,483 1,485 1,496 1,503 1,527 1,533 1,587 1,608 1,630 1,665 1,700 1,753 1,80730 -34 930 941 951 952 957 959 965 970 986 990 1,024 1,038 1,052 1,075 1,098 1,132 1,16635 -39 884 894 905 905 910 911 918 923 937 941 974 987 1,000 1,022 1,043 1,076 1,10940 -44 883 893 904 904 909 910 917 921 936 940 973 986 999 1,021 1,042 1,075 1,10745 -49 960 971 982 982 988 989 996 1,001 1,017 1,022 1,057 1,071 1,086 1,109 1,133 1,168 1,20450 -54 930 941 951 952 957 959 965 970 986 990 1,024 1,038 1,052 1,075 1,098 1,132 1,16655 -59 739 747 756 756 761 762 767 771 783 786 814 825 836 854 872 899 92660 -64 713 721 729 729 734 735 740 744 756 759 785 796 807 824 841 868 89465 -69 620 627 635 635 639 639 644 647 657 660 683 692 702 717 732 755 77870 -74 438 443 448 448 451 452 455 457 464 466 482 489 496 506 517 533 54975 -79 419 424 429 429 432 432 435 437 444 446 462 468 474 484 495 510 52680 -84 258 261 264 264 265 266 268 269 273 274 284 288 292 298 304 314 32385 &up 234 237 239 239 241 241 243 244 248 249 258 261 265 270 276 285 293Totals 16,667 16,855 17,050 17,052 17,157 17,180 17,302 17,389 17,664 17,737 18,353 18,604 18,854 19,262 19,669 20,283 20,897
FEMALES
0 - 4 1,141 1,154 1,167 1,168 1,175 1,176 1,185 1,191 1,209 1,214 1,257 1,274 1,291 1,319 1,347 1,389 1,4315 - 9 1,125 1,138 1,151 1,151 1,158 1,160 1,169 1,174 1,193 1,198 1,240 1,257 1,273 1,301 1,328 1,370 1,411
10 -14 966 977 988 988 994 994 1,001 1,006 1,022 1,026 1,062 1,076 1,091 1,114 1,138 1,173 1,20915 -19 1,797 1,818 1,839 1,839 1,850 1,849 1,862 1,872 1,901 1,909 1,975 2,002 2,029 2,073 2,117 2,183 2,24920 -24 2,240 2,266 2,292 2,292 2,306 2,305 2,321 2,333 2,370 2,380 2,462 2,496 2,530 2,584 2,639 2,721 2,80425 -29 1,442 1,458 1,475 1,475 1,484 1,483 1,494 1,501 1,525 1,532 1,585 1,606 1,628 1,663 1,698 1,751 1,80430 -34 1,112 1,125 1,138 1,138 1,145 1,144 1,152 1,158 1,177 1,181 1,222 1,239 1,256 1,283 1,310 1,351 1,39235 -39 964 975 986 986 992 992 999 1,004 1,020 1,024 1,059 1,074 1,088 1,112 1,135 1,171 1,20640 -44 975 986 997 997 1,003 1,003 1,010 1,015 1,031 1,036 1,071 1,086 1,101 1,125 1,148 1,184 1,22045 -49 1,158 1,171 1,185 1,185 1,192 1,191 1,200 1,206 1,225 1,230 1,273 1,290 1,308 1,336 1,364 1,407 1,44950 -54 1,131 1,144 1,157 1,157 1,164 1,164 1,172 1,178 1,197 1,202 1,243 1,260 1,277 1,305 1,332 1,374 1,41655 -59 1,022 1,033 1,045 1,045 1,052 1,051 1,059 1,064 1,081 1,085 1,123 1,138 1,154 1,178 1,203 1,241 1,27960 -64 939 950 961 961 967 966 973 978 993 997 1,032 1,046 1,060 1,083 1,106 1,141 1,17565 -69 790 799 808 808 813 812 818 822 835 839 868 880 892 911 930 959 98870 -74 635 642 650 650 654 654 658 662 672 675 698 708 717 733 748 772 79575 -79 609 616 623 623 627 627 631 635 645 647 670 679 688 703 718 740 76380 -84 498 504 509 509 513 512 516 518 527 529 547 555 562 574 586 605 62385 &up 682 690 698 698 702 702 707 710 722 725 750 760 770 787 803 829 854
Totals 19,227 19,445 19,670 19,672 19,792 19,787 19,927 20,027 20,344 20,429 21,138 21,427 21,715 22,184 22,653 23,360 24,067
Version 2021.0 A-24
D R A F T
10-19
-21

Delaware Population Consortium
Population Projection Series
October 31, 2021
New Castle CountyTotal Population
[As of July 1]
2010 2015 2020 2025 2030 2035 2040 2045 2050
Population 538,753 552,378 571,058 578,589 585,990 593,626 599,650 603,078 603,757
Households 198,207 203,043 204,221 205,410 206,220 207,211 207,130 206,384 204,116
Population Change* 13,625 18,680 7,531 7,401 7,636 6,024 3,428 679
Births* 33,054 31,942 30,997 29,729 29,201 29,221 28,856 28,053
Deaths* 21,555 24,173 26,547 29,004 31,886 34,652 36,599 37,578
Net Migration* 2,126 10,911 3,081 6,676 10,321 11,455 11,171 10,204
Household Change* 4,836 1,178 1,189 810 991 -81 -746 -2,268
Total Labor Force 272,401 293,557 298,602 297,452 297,601 298,569 298,952 297,910 295,070
Civilian 271,852 293,008 298,053 296,903 297,052 298,020 298,403 297,361 294,521
Employed 247,824 275,293 286,131 285,027 285,170 286,099 286,467 285,467 282,740
Private 208,875 232,027 241,161 240,232 240,351 241,135 241,444 240,602 238,303
Government 28,867 32,066 33,329 33,200 33,217 33,325 33,368 33,251 32,934
Self-Employed 9,718 10,796 11,221 11,177 11,183 11,219 11,234 11,195 11,088
Unpaid Family 364 404 420 418 419 420 421 419 415
Unemployed 24,028 17,715 11,922 11,876 11,882 11,921 11,936 11,894 11,781
Military 549 549 549 549 549 549 549 549 549
Jobs by Place of Work 263,947 285,877 295,182 294,045 294,191 295,150 295,528 294,498 291,683
Jobs by Residence 247,823 275,293 286,130 285,027 285,169 286,099 286,466 285,467 282,738
Net Commuting 16,124 10,584 9,052 9,018 9,022 9,051 9,062 9,031 8,945
*Represents a five-year total beginning with specified year
Version 2021.0 A-25
D R A F T
10-19
-21

Delaware Population Consortium
Population Projection Series
October 31, 2021
New Castle CountyTotal Population
[As of July 1]
2010 2011 2012 2013 2014 2015 2016 2017 2018 2019 2020 2025 2030 2035 2040 2045 2050
0 - 4 33,167 33,123 33,263 30,745 30,334 30,344 30,414 32,455 32,478 32,330 32,424 31,402 30,355 30,317 30,750 30,394 29,391
5 - 9 34,018 33,792 33,751 34,078 34,283 34,124 33,988 34,148 33,885 33,523 33,800 32,850 31,995 31,112 31,155 31,613 31,200
10 -14 34,994 34,933 34,832 34,670 34,601 34,806 34,558 34,616 35,029 35,278 35,992 34,262 33,407 32,689 31,856 31,946 32,429
15 -19 40,762 39,382 37,448 35,919 35,463 35,272 35,478 35,465 35,444 35,503 36,419 36,726 34,864 34,042 33,351 32,545 32,694
20 -24 40,496 41,733 43,305 44,529 44,091 42,338 39,872 38,028 36,549 36,129 36,241 37,014 37,590 35,600 34,749 34,046 33,262
25 -29 36,333 36,927 37,118 37,141 37,731 39,757 42,127 43,762 45,052 44,711 43,048 36,611 37,730 38,563 36,334 35,420 34,707
30 -34 34,580 35,512 36,387 37,076 37,569 37,347 36,998 37,600 37,630 38,243 40,274 43,123 37,011 38,441 39,386 36,918 35,943
35 -39 34,884 33,406 32,495 32,569 33,299 34,397 35,821 36,394 37,122 37,649 38,065 40,158 43,210 37,393 38,980 39,979 37,299
40 -44 38,187 38,180 37,824 36,892 35,982 34,792 33,508 32,685 32,800 33,568 35,095 37,926 40,045 43,304 37,606 39,289 40,328
45 -49 41,401 40,849 40,523 39,855 38,979 38,253 37,950 37,689 36,836 36,005 35,097 34,839 37,770 39,945 43,221 37,607 39,367
50 -54 40,501 40,697 40,753 40,890 40,708 40,631 40,253 40,016 39,425 38,650 37,766 34,571 34,558 37,592 39,677 42,898 37,394
55 -59 34,200 35,303 36,302 37,314 38,138 38,995 39,577 39,685 39,871 39,791 39,283 36,616 33,880 34,111 37,099 39,030 42,143
60 -64 28,690 30,245 31,752 31,747 32,275 32,832 33,758 34,743 35,747 36,604 36,800 37,310 35,162 32,892 33,237 36,079 37,825
65 -69 20,773 21,192 21,842 23,870 25,373 26,771 28,288 29,700 29,732 30,281 30,252 34,076 34,909 33,251 31,313 31,738 34,384
70 -74 14,943 15,479 15,913 16,674 17,627 18,361 19,127 19,733 21,573 22,978 23,769 26,987 30,655 31,736 30,443 28,866 29,378
75 -79 12,103 12,018 12,030 12,130 12,514 13,047 13,272 13,661 14,326 15,172 15,492 20,158 23,066 26,436 27,571 26,641 25,494
80 -84 9,451 9,684 9,819 9,746 9,638 9,485 9,472 9,514 9,607 9,935 10,158 12,150 15,957 18,417 21,220 22,324 21,796
85 &up 9,270 9,450 9,706 10,146 10,494 10,826 11,070 11,282 11,355 11,391 11,083 11,810 13,826 17,785 21,702 25,745 28,723
Totals 538,753 541,905 545,063 545,991 549,099 552,378 555,531 561,176 564,461 567,741 571,058 578,589 585,990 593,626 599,650 603,078 603,757
Version 2021.0 A-26
D R A F T
10-19
-21

Delaware Population Consortium
Population Projection Series
October 31, 2021
New Castle CountyTotal Population
[As of July 1]
2010 2011 2012 2013 2014 2015 2016 2017 2018 2019 2020 2025 2030 2035 2040 2045 2050
MALES
0 - 4 16,800 16,868 16,902 14,527 14,295 14,251 14,207 16,419 16,431 16,356 16,406 15,888 15,360 15,342 15,563 15,382 14,8735 - 9 17,282 17,257 17,253 17,334 17,323 17,303 17,297 17,341 17,236 17,068 17,128 16,623 16,192 15,746 15,769 16,004 15,796
10 -14 17,809 17,874 17,790 17,714 17,705 17,810 17,648 17,696 17,816 17,829 18,231 17,369 16,916 16,550 16,131 16,181 16,42815 -19 20,552 19,919 19,059 18,467 18,221 18,056 18,133 18,099 18,091 18,137 18,583 18,593 17,657 17,230 16,883 16,478 16,55820 -24 20,153 20,848 21,613 21,907 21,849 21,206 20,131 19,317 18,753 18,531 18,515 18,849 18,989 17,983 17,550 17,195 16,80225 -29 18,107 18,621 18,767 19,020 19,157 20,018 21,011 21,815 22,146 22,137 21,549 18,669 19,168 19,438 18,311 17,848 17,48930 -34 17,023 17,534 18,003 18,331 18,702 18,441 18,424 18,951 19,220 19,374 20,221 21,566 18,840 19,499 19,819 18,570 18,07935 -39 17,191 16,466 15,955 16,059 16,408 16,987 17,645 17,782 18,131 18,516 18,662 20,133 21,580 19,001 19,737 20,085 18,72840 -44 18,347 18,461 18,340 17,830 17,551 17,005 16,463 15,998 16,123 16,496 17,296 18,535 20,029 21,576 19,056 19,841 20,21345 -49 20,038 19,849 19,778 19,405 18,880 18,449 18,267 18,195 17,726 17,489 17,107 17,123 18,395 19,917 21,467 18,996 19,81650 -54 19,557 19,590 19,533 19,673 19,578 19,529 19,461 19,431 19,098 18,625 18,112 16,786 16,930 18,230 19,707 21,227 18,81355 -59 16,165 16,742 17,252 17,835 18,252 18,767 18,914 18,882 19,047 19,000 18,748 17,438 16,355 16,621 17,876 19,270 20,73360 -64 13,432 14,250 15,003 14,848 15,135 15,371 15,855 16,353 16,919 17,348 17,528 17,657 16,601 15,757 16,082 17,238 18,53165 -69 9,529 9,651 9,875 10,961 11,710 12,423 13,116 13,807 13,683 13,972 13,936 15,986 16,287 15,472 14,805 15,168 16,19870 -74 6,703 6,966 7,168 7,467 7,828 8,102 8,476 8,680 9,641 10,311 10,708 12,095 14,006 14,435 13,810 13,340 13,74275 -79 5,132 5,185 5,217 5,240 5,412 5,669 5,734 5,907 6,156 6,464 6,559 8,702 9,920 11,601 12,065 11,626 11,37280 -84 3,786 3,887 3,928 3,943 3,902 3,844 3,857 3,894 3,917 4,055 4,175 4,848 6,491 7,481 8,812 9,274 9,03485 &up 3,023 3,142 3,227 3,359 3,484 3,605 3,700 3,769 3,805 3,813 3,733 4,078 4,765 6,196 7,557 9,108 10,263Totals 260,629 263,110 264,663 263,920 265,392 266,836 268,339 272,336 273,939 275,521 277,197 280,938 284,481 288,075 291,000 292,831 293,468
FEMALES
0 - 4 16,367 16,255 16,361 16,218 16,039 16,093 16,207 16,036 16,047 15,974 16,018 15,514 14,995 14,975 15,187 15,012 14,5185 - 9 16,736 16,535 16,498 16,744 16,960 16,821 16,691 16,807 16,649 16,455 16,672 16,227 15,803 15,366 15,386 15,609 15,404
10 -14 17,185 17,059 17,042 16,956 16,896 16,996 16,910 16,920 17,213 17,449 17,761 16,893 16,491 16,139 15,725 15,765 16,00115 -19 20,210 19,463 18,389 17,452 17,242 17,216 17,345 17,366 17,353 17,366 17,836 18,133 17,207 16,812 16,468 16,067 16,13620 -24 20,343 20,885 21,692 22,622 22,242 21,132 19,741 18,711 17,796 17,598 17,726 18,165 18,601 17,617 17,199 16,851 16,46025 -29 18,226 18,306 18,351 18,121 18,574 19,739 21,116 21,947 22,906 22,574 21,499 17,942 18,562 19,125 18,023 17,572 17,21830 -34 17,557 17,978 18,384 18,745 18,867 18,906 18,574 18,649 18,410 18,869 20,053 21,557 18,171 18,942 19,567 18,348 17,86435 -39 17,693 16,940 16,540 16,510 16,891 17,410 18,176 18,612 18,991 19,133 19,403 20,025 21,630 18,392 19,243 19,894 18,57140 -44 19,840 19,719 19,484 19,062 18,431 17,787 17,045 16,687 16,677 17,072 17,799 19,391 20,016 21,728 18,550 19,448 20,11545 -49 21,363 21,000 20,745 20,450 20,099 19,804 19,683 19,494 19,110 18,516 17,990 17,716 19,375 20,028 21,754 18,611 19,55150 -54 20,944 21,107 21,220 21,217 21,130 21,102 20,792 20,585 20,327 20,025 19,654 17,785 17,628 19,362 19,970 21,671 18,58155 -59 18,035 18,561 19,050 19,479 19,886 20,228 20,663 20,803 20,824 20,791 20,535 19,178 17,525 17,490 19,223 19,760 21,41060 -64 15,258 15,995 16,749 16,899 17,140 17,461 17,903 18,390 18,828 19,256 19,272 19,653 18,561 17,135 17,155 18,841 19,29465 -69 11,244 11,541 11,967 12,909 13,663 14,348 15,172 15,893 16,049 16,309 16,316 18,090 18,622 17,779 16,508 16,570 18,18670 -74 8,240 8,513 8,745 9,207 9,799 10,259 10,651 11,053 11,932 12,667 13,061 14,892 16,649 17,301 16,633 15,526 15,63675 -79 6,971 6,833 6,813 6,890 7,102 7,378 7,538 7,754 8,170 8,708 8,933 11,456 13,146 14,835 15,506 15,015 14,12280 -84 5,665 5,797 5,891 5,803 5,736 5,641 5,615 5,620 5,690 5,880 5,983 7,302 9,466 10,936 12,408 13,050 12,76285 &up 6,247 6,308 6,479 6,787 7,010 7,221 7,370 7,513 7,550 7,578 7,350 7,732 9,061 11,589 14,145 16,637 18,460
Totals 278,124 278,795 280,400 282,071 283,707 285,542 287,192 288,840 290,522 292,220 293,861 297,651 301,509 305,551 308,650 310,247 310,289
Version 2021.0 A-27
D R A F T
10-19
-21

Delaware Population Consortium
Population Projection Series
October 31, 2021
New Castle CountyWhite Alone Non-Hispanic Population
[As of July 1]
2010 2011 2012 2013 2014 2015 2016 2017 2018 2019 2020 2025 2030 2035 2040 2045 2050
0 - 4 15,226 15,363 15,696 14,365 14,458 14,705 15,134 16,200 16,071 15,816 14,722 13,049 11,240 9,867 9,200 8,857 8,422
5 - 9 16,525 16,333 16,095 16,006 15,798 15,405 15,037 15,331 15,418 15,535 15,024 14,137 12,651 11,018 9,701 9,041 8,696
10 -14 18,151 17,809 17,491 17,033 16,649 16,417 16,037 15,768 15,693 15,520 14,408 14,484 13,754 12,436 10,861 9,562 8,902
15 -19 23,121 22,036 20,187 18,825 18,311 17,880 17,611 17,245 16,844 16,563 15,592 14,063 14,216 13,588 12,306 10,749 9,455
20 -24 24,441 24,943 26,148 26,724 25,832 23,834 21,570 19,712 18,355 17,863 16,597 14,966 13,627 13,934 13,353 12,088 10,547
25 -29 20,250 20,554 20,607 20,662 21,211 22,829 24,376 25,513 26,061 25,245 22,167 15,910 14,486 13,340 13,680 13,106 11,853
30 -34 18,761 19,277 19,791 20,048 20,202 20,180 20,075 20,084 20,126 20,705 21,211 21,237 15,384 14,162 13,078 13,409 12,833
35 -39 19,593 18,309 17,490 17,315 17,657 18,120 18,786 19,244 19,486 19,672 18,701 20,273 20,487 15,002 13,851 12,785 13,097
40 -44 22,873 22,516 21,975 20,969 20,035 18,878 17,793 16,963 16,785 17,154 16,755 17,828 19,506 19,923 14,632 13,502 12,454
45 -49 26,897 25,982 25,260 24,418 23,408 22,533 21,816 21,247 20,265 19,401 17,399 15,919 17,093 18,907 19,360 14,213 13,106
50 -54 28,036 27,828 27,541 27,236 26,550 25,849 25,061 24,315 23,491 22,562 20,669 16,450 15,197 16,490 18,293 18,719 13,730
55 -59 24,527 25,080 25,642 25,971 26,217 26,519 26,570 26,239 25,924 25,314 23,449 19,323 15,519 14,504 15,775 17,504 17,879
60 -64 21,026 21,964 22,925 22,670 22,922 23,130 23,559 24,033 24,317 24,583 23,650 21,541 17,913 14,538 13,635 14,819 16,441
65 -69 15,594 15,747 16,092 17,593 18,547 19,344 20,222 21,048 20,799 21,063 20,217 21,271 19,544 16,417 13,353 12,540 13,603
70 -74 11,301 11,620 11,885 12,400 13,065 13,534 14,007 14,278 15,600 16,467 16,321 17,531 18,590 17,243 14,515 11,795 11,092
75 -79 9,719 9,458 9,314 9,262 9,412 9,725 9,783 9,991 10,407 10,983 10,814 13,379 14,468 15,468 14,373 12,089 9,806
80 -84 7,950 8,051 8,053 7,887 7,698 7,477 7,295 7,177 7,120 7,237 7,096 8,112 10,096 10,985 11,751 10,903 9,157
85 &up 7,977 8,134 8,312 8,615 8,826 8,964 9,049 9,070 8,973 8,850 8,229 7,740 8,280 9,934 11,284 12,277 12,059
Totals 331,968 331,004 330,504 327,999 326,798 325,323 323,781 323,458 321,735 320,533 303,021 287,213 272,051 257,756 243,001 227,958 213,132
Version 2021.0 A-28
D R A F T
10-19
-21

Delaware Population Consortium
Population Projection Series
October 31, 2021
New Castle CountyWhite Alone Non-Hispanic Population
[As of July 1]
2010 2011 2012 2013 2014 2015 2016 2017 2018 2019 2020 2025 2030 2035 2040 2045 2050
MALES
0 - 4 7,758 7,866 8,029 6,650 6,716 6,786 6,924 8,197 8,131 8,002 7,448 6,601 5,686 4,991 4,655 4,480 4,2605 - 9 8,466 8,327 8,196 8,139 7,980 7,787 7,698 7,841 7,884 7,960 7,650 7,151 6,399 5,572 4,906 4,572 4,398
10 -14 9,296 9,153 8,982 8,752 8,565 8,443 8,176 8,030 7,977 7,840 7,284 7,376 6,959 6,290 5,493 4,836 4,50215 -19 11,494 10,937 10,136 9,601 9,339 9,091 9,019 8,827 8,617 8,473 7,965 7,070 7,208 6,853 6,208 5,423 4,76920 -24 12,020 12,200 12,689 12,754 12,421 11,662 10,695 9,887 9,355 9,108 8,439 7,638 6,843 7,055 6,727 6,091 5,31425 -29 10,212 10,501 10,596 10,688 10,820 11,436 11,910 12,367 12,425 12,127 10,836 8,083 7,384 6,690 6,918 6,593 5,96530 -34 9,315 9,513 9,769 9,938 10,092 10,159 10,237 10,307 10,390 10,541 10,605 10,360 7,799 7,205 6,544 6,766 6,44235 -39 9,809 9,155 8,708 8,608 8,735 8,961 9,246 9,473 9,634 9,800 9,389 10,107 9,963 7,584 7,026 6,378 6,59040 -44 11,240 11,065 10,793 10,279 9,898 9,317 8,867 8,418 8,315 8,459 8,258 8,917 9,690 9,654 7,370 6,825 6,19245 -49 13,245 12,850 12,557 12,118 11,564 11,103 10,672 10,389 9,887 9,539 8,547 7,807 8,510 9,346 9,334 7,126 6,59350 -54 13,735 13,584 13,405 13,288 12,968 12,611 12,332 12,026 11,598 11,088 10,131 8,037 7,413 8,165 8,993 8,975 6,84655 -59 11,839 12,142 12,448 12,658 12,772 12,973 12,879 12,680 12,557 12,275 11,355 9,399 7,526 7,022 7,754 8,540 8,50860 -64 10,045 10,526 11,017 10,803 10,945 11,002 11,300 11,559 11,739 11,860 11,456 10,327 8,626 6,978 6,535 7,213 7,94165 -69 7,224 7,240 7,340 8,199 8,741 9,179 9,541 9,956 9,754 9,896 9,460 10,134 9,214 7,772 6,301 5,910 6,51370 -74 5,107 5,256 5,383 5,599 5,824 6,019 6,270 6,338 7,081 7,557 7,538 7,974 8,611 7,901 6,675 5,408 5,08175 -79 4,142 4,096 4,056 4,003 4,096 4,249 4,249 4,346 4,509 4,693 4,608 5,924 6,302 6,863 6,306 5,322 4,30480 -84 3,217 3,259 3,242 3,205 3,118 3,032 2,975 2,944 2,895 2,964 2,916 3,242 4,202 4,489 4,892 4,487 3,77885 &up 2,620 2,730 2,795 2,882 2,963 3,011 3,040 3,038 3,005 2,953 2,740 2,598 2,768 3,429 3,853 4,217 4,090Totals 160,784 160,400 160,141 158,164 157,557 156,821 156,030 156,623 155,753 155,135 146,625 138,745 131,103 123,859 116,490 109,162 102,086
FEMALES
0 - 4 7,468 7,497 7,667 7,715 7,742 7,919 8,210 8,003 7,940 7,814 7,274 6,448 5,554 4,876 4,545 4,377 4,1625 - 9 8,059 8,006 7,899 7,867 7,818 7,618 7,339 7,490 7,534 7,575 7,374 6,986 6,252 5,446 4,795 4,469 4,298
10 -14 8,855 8,656 8,509 8,281 8,084 7,974 7,861 7,738 7,716 7,680 7,124 7,108 6,795 6,146 5,368 4,726 4,40015 -19 11,627 11,099 10,051 9,224 8,972 8,789 8,592 8,418 8,227 8,090 7,627 6,993 7,008 6,735 6,098 5,326 4,68620 -24 12,421 12,743 13,459 13,970 13,411 12,172 10,875 9,825 9,000 8,755 8,158 7,328 6,784 6,879 6,626 5,997 5,23325 -29 10,038 10,053 10,011 9,974 10,391 11,393 12,466 13,146 13,636 13,118 11,331 7,827 7,102 6,650 6,762 6,513 5,88830 -34 9,446 9,764 10,022 10,110 10,110 10,021 9,838 9,777 9,736 10,164 10,606 10,877 7,585 6,957 6,534 6,643 6,39135 -39 9,784 9,154 8,782 8,707 8,922 9,159 9,540 9,771 9,852 9,872 9,312 10,166 10,524 7,418 6,825 6,407 6,50740 -44 11,633 11,451 11,182 10,690 10,137 9,561 8,926 8,545 8,470 8,695 8,497 8,911 9,816 10,269 7,262 6,677 6,26245 -49 13,652 13,132 12,703 12,300 11,844 11,430 11,144 10,858 10,378 9,862 8,852 8,112 8,583 9,561 10,026 7,087 6,51350 -54 14,301 14,244 14,136 13,948 13,582 13,238 12,729 12,289 11,893 11,474 10,538 8,413 7,784 8,325 9,300 9,744 6,88455 -59 12,688 12,938 13,194 13,313 13,445 13,546 13,691 13,559 13,367 13,039 12,094 9,924 7,993 7,482 8,021 8,964 9,37160 -64 10,981 11,438 11,908 11,867 11,977 12,128 12,259 12,474 12,578 12,723 12,194 11,214 9,287 7,560 7,100 7,606 8,50065 -69 8,370 8,507 8,752 9,394 9,806 10,165 10,681 11,092 11,045 11,167 10,757 11,137 10,330 8,645 7,052 6,630 7,09070 -74 6,194 6,364 6,502 6,801 7,241 7,515 7,737 7,940 8,519 8,910 8,783 9,557 9,979 9,342 7,840 6,387 6,01175 -79 5,577 5,362 5,258 5,259 5,316 5,476 5,534 5,645 5,898 6,290 6,206 7,455 8,166 8,605 8,067 6,767 5,50280 -84 4,733 4,792 4,811 4,682 4,580 4,445 4,320 4,233 4,225 4,273 4,180 4,870 5,894 6,496 6,859 6,416 5,37985 &up 5,357 5,404 5,517 5,733 5,863 5,953 6,009 6,032 5,968 5,897 5,489 5,142 5,512 6,505 7,431 8,060 7,969
Totals 171,184 170,604 170,363 169,835 169,241 168,502 167,751 166,835 165,982 165,398 156,396 148,468 140,948 133,897 126,511 118,796 111,046
Version 2021.0 A-29
D R A F T
10-19
-21

Delaware Population Consortium
Population Projection Series
October 31, 2021
New Castle CountyBlack Alone Non-Hispanic Population
[As of July 1]
2010 2011 2012 2013 2014 2015 2016 2017 2018 2019 2020 2025 2030 2035 2040 2045 2050
0 - 4 8,897 8,795 9,063 8,515 8,588 8,759 8,901 9,524 9,498 9,463 9,429 9,519 9,482 9,631 9,741 9,859 9,939
5 - 9 9,229 8,916 8,787 8,746 8,917 9,007 9,117 9,466 9,709 9,848 9,814 9,704 9,799 9,759 9,912 10,029 10,148
10 -14 9,913 9,909 9,801 9,706 9,591 9,437 9,217 9,155 9,167 9,372 9,339 10,073 9,960 10,058 10,018 10,174 10,295
15 -19 10,679 10,429 10,497 10,341 10,165 10,137 10,195 10,161 10,125 10,031 9,738 9,539 10,290 10,173 10,273 10,233 10,393
20 -24 9,076 9,579 9,708 10,025 10,400 10,676 10,728 10,884 10,787 10,633 10,463 9,951 9,746 10,514 10,395 10,496 10,453
25 -29 8,412 8,603 8,767 8,897 9,115 9,387 9,881 10,089 10,481 10,905 11,047 10,718 10,193 9,983 10,768 10,647 10,751
30 -34 8,486 8,677 8,762 8,902 8,978 8,983 8,853 9,095 9,284 9,541 9,691 11,290 10,951 10,414 10,201 11,005 10,881
35 -39 8,792 8,402 8,064 8,037 8,123 8,457 8,879 9,036 9,241 9,347 9,224 9,852 11,473 11,131 10,586 10,371 11,187
40 -44 9,780 9,890 9,825 9,533 9,210 8,884 8,526 8,253 8,275 8,390 8,619 9,304 9,936 11,570 11,224 10,675 10,459
45 -49 9,937 10,126 10,297 10,161 10,128 9,946 9,968 9,985 9,749 9,445 8,992 8,635 9,320 9,951 11,586 11,240 10,688
50 -54 8,965 9,135 9,272 9,499 9,718 10,007 10,143 10,403 10,330 10,330 10,008 8,954 8,601 9,280 9,908 11,535 11,191
55 -59 6,958 7,300 7,551 7,945 8,327 8,702 9,041 9,254 9,547 9,799 9,953 9,851 8,811 8,466 9,134 9,753 11,349
60 -64 5,643 6,095 6,454 6,585 6,705 6,832 7,109 7,421 7,860 8,267 8,520 9,651 9,546 8,534 8,206 8,848 9,447
65 -69 3,803 3,983 4,188 4,539 4,902 5,295 5,780 6,173 6,349 6,491 6,525 8,054 9,122 9,020 8,054 7,752 8,355
70 -74 2,670 2,801 2,878 2,999 3,234 3,447 3,618 3,848 4,203 4,564 4,866 5,926 7,312 8,282 8,183 7,295 7,034
75 -79 1,803 1,911 2,002 2,083 2,190 2,334 2,427 2,519 2,652 2,876 3,027 4,236 5,149 6,351 7,195 7,105 6,323
80 -84 1,143 1,253 1,357 1,403 1,435 1,451 1,559 1,655 1,741 1,841 1,935 2,488 3,486 4,228 5,213 5,909 5,827
85 &up 989 1,001 1,038 1,130 1,236 1,369 1,482 1,614 1,721 1,820 1,882 2,485 3,222 4,375 5,579 6,947 8,167
Totals 125,175 126,805 128,311 129,046 130,962 133,110 135,424 138,535 140,719 142,963 143,072 150,230 156,399 161,720 166,176 169,873 172,887
Version 2021.0 A-30
D R A F T
10-19
-21

Delaware Population Consortium
Population Projection Series
October 31, 2021
New Castle CountyBlack Alone Non-Hispanic Population
[As of July 1]
2010 2011 2012 2013 2014 2015 2016 2017 2018 2019 2020 2025 2030 2035 2040 2045 2050
MALES
0 - 4 4,477 4,441 4,587 3,953 3,971 4,083 4,151 4,810 4,797 4,780 4,763 4,808 4,789 4,865 4,920 4,980 5,0215 - 9 4,708 4,560 4,509 4,452 4,511 4,576 4,605 4,791 4,916 4,983 4,953 4,902 4,951 4,931 5,008 5,067 5,128
10 -14 5,068 5,038 4,944 4,905 4,868 4,777 4,716 4,698 4,666 4,741 4,746 5,085 5,033 5,083 5,062 5,141 5,20215 -19 5,510 5,412 5,407 5,324 5,212 5,191 5,170 5,113 5,103 5,077 4,916 4,834 5,180 5,126 5,176 5,156 5,23720 -24 4,551 4,886 5,048 5,195 5,413 5,530 5,539 5,577 5,524 5,423 5,329 4,996 4,913 5,264 5,210 5,260 5,23925 -29 4,049 4,099 4,185 4,375 4,485 4,686 5,014 5,220 5,405 5,649 5,693 5,432 5,092 5,008 5,364 5,310 5,36130 -34 3,986 4,083 4,152 4,193 4,259 4,247 4,200 4,323 4,547 4,676 4,819 5,797 5,528 5,182 5,096 5,460 5,40535 -39 4,088 3,858 3,660 3,688 3,769 3,962 4,162 4,266 4,338 4,419 4,347 4,884 5,872 5,601 5,250 5,164 5,53240 -44 4,365 4,478 4,507 4,314 4,216 4,069 3,898 3,730 3,781 3,878 4,022 4,367 4,907 5,899 5,626 5,274 5,18945 -49 4,526 4,556 4,618 4,579 4,536 4,458 4,491 4,559 4,391 4,306 4,101 4,012 4,356 4,895 5,885 5,612 5,25950 -54 4,045 4,102 4,142 4,260 4,344 4,453 4,541 4,642 4,633 4,605 4,465 4,064 3,978 4,318 4,853 5,833 5,56355 -59 3,007 3,150 3,259 3,483 3,682 3,890 4,029 4,105 4,252 4,351 4,400 4,363 3,972 3,891 4,222 4,748 5,70560 -64 2,464 2,694 2,868 2,859 2,899 2,959 3,034 3,171 3,413 3,620 3,772 4,226 4,187 3,810 3,737 4,052 4,55965 -69 1,649 1,721 1,806 1,957 2,103 2,270 2,513 2,700 2,713 2,761 2,781 3,511 3,933 3,895 3,539 3,478 3,76970 -74 1,127 1,203 1,242 1,278 1,375 1,448 1,508 1,601 1,751 1,892 2,016 2,438 3,081 3,449 3,413 3,096 3,05375 -79 728 778 819 866 897 949 993 1,035 1,078 1,166 1,213 1,674 2,018 2,553 2,858 2,825 2,55980 -84 401 446 480 505 516 544 592 631 677 706 735 930 1,286 1,544 1,958 2,191 2,16185 &up 294 291 295 321 356 390 432 470 506 535 564 767 993 1,343 1,680 2,108 2,467Totals 59,043 59,796 60,528 60,507 61,412 62,482 63,588 65,442 66,491 67,568 67,635 71,090 74,069 76,657 78,857 80,755 82,409
FEMALES
0 - 4 4,420 4,354 4,476 4,562 4,617 4,676 4,750 4,714 4,701 4,683 4,666 4,711 4,693 4,766 4,821 4,879 4,9185 - 9 4,521 4,356 4,278 4,294 4,406 4,431 4,512 4,675 4,793 4,865 4,861 4,802 4,848 4,828 4,904 4,962 5,020
10 -14 4,845 4,871 4,857 4,801 4,723 4,660 4,501 4,457 4,501 4,631 4,593 4,988 4,927 4,975 4,956 5,033 5,09315 -19 5,169 5,017 5,090 5,017 4,953 4,946 5,025 5,048 5,022 4,954 4,822 4,705 5,110 5,047 5,097 5,077 5,15620 -24 4,525 4,693 4,660 4,830 4,987 5,146 5,189 5,307 5,263 5,210 5,134 4,955 4,833 5,250 5,185 5,236 5,21425 -29 4,363 4,504 4,582 4,522 4,630 4,701 4,867 4,869 5,076 5,256 5,354 5,286 5,101 4,975 5,404 5,337 5,39030 -34 4,500 4,594 4,610 4,709 4,719 4,736 4,653 4,772 4,737 4,865 4,872 5,493 5,423 5,232 5,105 5,545 5,47635 -39 4,704 4,544 4,404 4,349 4,354 4,495 4,717 4,770 4,903 4,928 4,877 4,968 5,601 5,530 5,336 5,207 5,65540 -44 5,415 5,412 5,318 5,219 4,994 4,815 4,628 4,523 4,494 4,512 4,597 4,937 5,029 5,671 5,598 5,401 5,27045 -49 5,411 5,570 5,679 5,582 5,592 5,488 5,477 5,426 5,358 5,139 4,891 4,623 4,964 5,056 5,701 5,628 5,42950 -54 4,920 5,033 5,130 5,239 5,374 5,554 5,602 5,761 5,697 5,725 5,543 4,890 4,623 4,962 5,055 5,702 5,62855 -59 3,951 4,150 4,292 4,462 4,645 4,812 5,012 5,149 5,295 5,448 5,553 5,488 4,839 4,575 4,912 5,005 5,64460 -64 3,179 3,401 3,586 3,726 3,806 3,873 4,075 4,250 4,447 4,647 4,748 5,425 5,359 4,724 4,469 4,796 4,88865 -69 2,154 2,262 2,382 2,582 2,799 3,025 3,267 3,473 3,636 3,730 3,744 4,543 5,189 5,125 4,515 4,274 4,58670 -74 1,543 1,598 1,636 1,721 1,859 1,999 2,110 2,247 2,452 2,672 2,850 3,488 4,231 4,833 4,770 4,199 3,98175 -79 1,075 1,133 1,183 1,217 1,293 1,385 1,434 1,484 1,574 1,710 1,814 2,562 3,131 3,798 4,337 4,280 3,76480 -84 742 807 877 898 919 907 967 1,024 1,064 1,135 1,200 1,558 2,200 2,684 3,255 3,718 3,66685 &up 695 710 743 809 880 979 1,050 1,144 1,215 1,285 1,318 1,718 2,229 3,032 3,899 4,839 5,700
Totals 66,132 67,009 67,783 68,539 69,550 70,628 71,836 73,093 74,228 75,395 75,437 79,140 82,330 85,063 87,319 89,118 90,478
Version 2021.0 A-31
D R A F T
10-19
-21

Delaware Population Consortium
Population Projection Series
October 31, 2021
New Castle CountyOther Races, Including Two or More Races, Non-Hispanic Population
[As of July 1]
2010 2011 2012 2013 2014 2015 2016 2017 2018 2019 2020 2025 2030 2035 2040 2045 2050
0 - 4 3,649 3,703 3,563 3,449 3,224 3,028 2,759 2,814 2,840 2,861 3,775 3,803 4,115 4,802 5,477 5,475 4,935
5 - 9 3,284 3,399 3,584 3,862 4,050 4,212 4,310 4,103 3,885 3,617 4,406 4,085 4,117 4,457 5,199 5,928 5,923
10 -14 2,640 2,752 2,902 3,159 3,388 3,734 3,934 4,105 4,311 4,469 6,025 4,739 4,394 4,426 4,791 5,590 6,374
15 -19 2,606 2,606 2,595 2,706 2,879 3,043 3,218 3,362 3,566 3,783 5,404 6,554 5,161 4,781 4,818 5,212 6,081
20 -24 2,526 2,709 2,813 3,052 3,104 3,135 3,053 3,008 3,058 3,217 4,406 5,886 7,136 5,617 5,206 5,246 5,679
25 -29 3,159 3,203 3,167 3,050 2,928 2,975 3,140 3,230 3,414 3,433 4,496 4,750 6,346 7,696 6,052 5,613 5,654
30 -34 3,120 3,263 3,386 3,606 3,696 3,386 3,300 3,583 3,362 3,193 4,205 4,775 5,051 6,745 8,177 6,425 5,963
35 -39 2,825 2,899 3,033 3,185 3,386 3,555 3,679 3,420 3,555 3,604 4,719 4,405 5,001 5,293 7,070 8,571 6,733
40 -44 2,294 2,482 2,627 2,882 3,088 3,215 3,242 3,357 3,435 3,613 4,916 4,906 4,578 5,200 5,501 7,352 8,909
45 -49 2,068 2,106 2,195 2,332 2,341 2,535 2,758 2,895 3,093 3,276 4,420 5,080 5,072 4,731 5,370 5,684 7,594
50 -54 1,710 1,752 1,808 1,926 2,100 2,256 2,326 2,401 2,483 2,465 3,462 4,536 5,214 5,208 4,856 5,509 5,835
55 -59 1,389 1,493 1,567 1,713 1,771 1,853 1,930 1,975 2,048 2,208 3,075 3,543 4,643 5,340 5,339 4,974 5,641
60 -64 1,099 1,199 1,300 1,367 1,435 1,542 1,638 1,704 1,814 1,855 2,513 3,134 3,617 4,736 5,447 5,450 5,075
65 -69 796 860 918 1,023 1,118 1,220 1,302 1,397 1,432 1,485 2,068 2,534 3,162 3,644 4,771 5,488 5,501
70 -74 575 625 676 766 812 858 919 975 1,057 1,145 1,618 2,060 2,524 3,148 3,634 4,752 5,466
75 -79 321 373 420 477 557 609 661 706 783 820 1,123 1,598 2,027 2,484 3,098 3,573 4,661
80 -84 184 193 213 256 300 336 380 425 470 542 766 1,063 1,513 1,919 2,351 2,932 3,385
85 &up 170 181 211 229 248 291 319 355 397 441 652 1,083 1,615 2,335 3,106 3,937 4,894
Totals 34,415 35,798 36,978 39,040 40,425 41,783 42,868 43,815 45,003 46,027 62,049 68,534 75,286 82,562 90,263 97,711 104,303
Version 2021.0 A-32
D R A F T
10-19
-21

Delaware Population Consortium
Population Projection Series
October 31, 2021
New Castle CountyOther Races, Including Two or More Races, Non-Hispanic Population
[As of July 1]
2010 2011 2012 2013 2014 2015 2016 2017 2018 2019 2020 2025 2030 2035 2040 2045 2050
MALES
0 - 4 1,815 1,772 1,698 1,658 1,561 1,493 1,382 1,429 1,443 1,453 1,917 1,931 2,091 2,439 2,782 2,781 2,5065 - 9 1,569 1,667 1,767 1,893 1,949 2,024 2,068 1,961 1,881 1,776 2,203 2,079 2,095 2,268 2,646 3,017 3,014
10 -14 1,289 1,327 1,403 1,532 1,652 1,837 1,936 2,031 2,120 2,158 2,905 2,377 2,244 2,259 2,446 2,854 3,25415 -19 1,308 1,310 1,304 1,361 1,459 1,515 1,557 1,629 1,735 1,850 2,665 3,169 2,595 2,447 2,466 2,668 3,11320 -24 1,177 1,302 1,373 1,477 1,511 1,567 1,533 1,511 1,536 1,629 2,190 2,900 3,447 2,820 2,663 2,683 2,90425 -29 1,426 1,499 1,484 1,441 1,374 1,374 1,509 1,575 1,651 1,669 2,245 2,359 3,123 3,713 3,037 2,868 2,88930 -34 1,527 1,556 1,594 1,690 1,738 1,389 1,358 1,682 1,592 1,503 1,948 2,389 2,514 3,327 3,953 3,232 3,05335 -39 1,414 1,441 1,503 1,586 1,689 1,735 1,758 1,422 1,476 1,503 1,942 2,045 2,508 2,640 3,496 4,153 3,39540 -44 1,093 1,187 1,265 1,383 1,484 1,601 1,611 1,662 1,709 1,801 2,398 2,017 2,124 2,607 2,742 3,634 4,31645 -49 965 993 1,055 1,121 1,129 1,193 1,317 1,392 1,483 1,572 2,198 2,476 2,085 2,194 2,689 2,830 3,75050 -54 808 810 830 902 973 1,061 1,093 1,151 1,190 1,186 1,625 2,250 2,534 2,134 2,245 2,752 2,89855 -59 629 687 728 779 815 848 886 900 952 1,015 1,435 1,651 2,287 2,577 2,171 2,282 2,79860 -64 483 520 556 607 651 708 750 787 819 849 1,142 1,455 1,676 2,320 2,615 2,203 2,31665 -69 390 397 417 459 474 519 558 590 628 666 939 1,139 1,451 1,669 2,312 2,606 2,19770 -74 280 297 315 344 383 394 420 440 470 479 681 925 1,122 1,429 1,647 2,279 2,56975 -79 147 183 211 233 253 286 304 318 341 376 500 651 883 1,069 1,363 1,569 2,16980 -84 82 88 102 122 159 166 184 210 226 243 354 466 605 822 996 1,271 1,46185 &up 58 62 75 84 89 114 130 149 170 200 293 501 720 954 1,277 1,615 2,037Totals 16,460 17,098 17,680 18,672 19,343 19,824 20,354 20,839 21,422 21,928 29,580 32,780 36,104 39,688 43,546 47,297 50,639
FEMALES
0 - 4 1,834 1,931 1,865 1,791 1,663 1,535 1,377 1,385 1,397 1,408 1,858 1,872 2,024 2,363 2,695 2,694 2,4295 - 9 1,715 1,732 1,817 1,969 2,101 2,188 2,242 2,142 2,004 1,841 2,203 2,006 2,022 2,189 2,553 2,911 2,909
10 -14 1,351 1,425 1,499 1,627 1,736 1,897 1,998 2,074 2,191 2,311 3,120 2,362 2,150 2,167 2,345 2,736 3,12015 -19 1,298 1,296 1,291 1,345 1,420 1,528 1,661 1,733 1,831 1,933 2,739 3,385 2,566 2,334 2,352 2,544 2,96820 -24 1,349 1,407 1,440 1,575 1,593 1,568 1,520 1,497 1,522 1,588 2,216 2,986 3,689 2,797 2,543 2,563 2,77525 -29 1,733 1,704 1,683 1,609 1,554 1,601 1,631 1,655 1,763 1,764 2,251 2,391 3,223 3,983 3,015 2,745 2,76530 -34 1,593 1,707 1,792 1,916 1,958 1,997 1,942 1,901 1,770 1,690 2,257 2,386 2,537 3,418 4,224 3,193 2,91035 -39 1,411 1,458 1,530 1,599 1,697 1,820 1,921 1,998 2,079 2,101 2,777 2,360 2,493 2,653 3,574 4,418 3,33840 -44 1,201 1,295 1,362 1,499 1,604 1,614 1,631 1,695 1,726 1,812 2,518 2,889 2,454 2,593 2,759 3,718 4,59345 -49 1,103 1,113 1,140 1,211 1,212 1,342 1,441 1,503 1,610 1,704 2,222 2,604 2,987 2,537 2,681 2,854 3,84450 -54 902 942 978 1,024 1,127 1,195 1,233 1,250 1,293 1,279 1,837 2,286 2,680 3,074 2,611 2,757 2,93755 -59 760 806 839 934 956 1,005 1,044 1,075 1,096 1,193 1,640 1,892 2,356 2,763 3,168 2,692 2,84360 -64 616 679 744 760 784 834 888 917 995 1,006 1,371 1,679 1,941 2,416 2,832 3,247 2,75965 -69 406 463 501 564 644 701 744 807 804 819 1,129 1,395 1,711 1,975 2,459 2,882 3,30470 -74 295 328 361 422 429 464 499 535 587 666 937 1,135 1,402 1,719 1,987 2,473 2,89775 -79 174 190 209 244 304 323 357 388 442 444 623 947 1,144 1,415 1,735 2,004 2,49280 -84 102 105 111 134 141 170 196 215 244 299 412 597 908 1,097 1,355 1,661 1,92485 &up 112 119 136 145 159 177 189 206 227 241 359 582 895 1,381 1,829 2,322 2,857
Totals 17,955 18,700 19,298 20,368 21,082 21,959 22,514 22,976 23,581 24,099 32,469 35,754 39,182 42,874 46,717 50,414 53,664
Version 2021.0 A-33
D R A F T
10-19
-21

Delaware Population Consortium
Population Projection Series
October 31, 2021
New Castle CountyHispanic Population
[As of July 1]
2010 2011 2012 2013 2014 2015 2016 2017 2018 2019 2020 2025 2030 2035 2040 2045 2050
0 - 4 5,395 5,262 4,941 4,416 4,064 3,852 3,620 3,917 4,069 4,190 4,498 5,031 5,518 6,017 6,332 6,203 6,095
5 - 9 4,980 5,144 5,285 5,464 5,518 5,500 5,524 5,248 4,873 4,523 4,556 4,924 5,428 5,878 6,343 6,615 6,433
10 -14 4,290 4,463 4,638 4,772 4,973 5,218 5,370 5,588 5,858 5,917 6,220 4,966 5,299 5,769 6,186 6,620 6,858
15 -19 4,356 4,311 4,169 4,047 4,108 4,212 4,454 4,697 4,909 5,126 5,685 6,570 5,197 5,500 5,954 6,351 6,765
20 -24 4,453 4,502 4,636 4,728 4,755 4,693 4,521 4,424 4,349 4,416 4,775 6,211 7,081 5,535 5,795 6,216 6,583
25 -29 4,512 4,567 4,577 4,532 4,477 4,566 4,730 4,930 5,096 5,128 5,338 5,233 6,705 7,544 5,834 6,054 6,449
30 -34 4,213 4,295 4,448 4,520 4,693 4,798 4,770 4,838 4,858 4,804 5,167 5,821 5,625 7,120 7,930 6,079 6,266
35 -39 3,674 3,796 3,908 4,032 4,133 4,265 4,477 4,694 4,840 5,026 5,421 5,628 6,249 5,967 7,473 8,252 6,282
40 -44 3,240 3,292 3,397 3,508 3,649 3,815 3,947 4,112 4,305 4,411 4,805 5,888 6,025 6,611 6,249 7,760 8,506
45 -49 2,499 2,635 2,771 2,944 3,102 3,239 3,408 3,562 3,729 3,883 4,286 5,205 6,285 6,356 6,905 6,470 7,979
50 -54 1,790 1,982 2,132 2,229 2,340 2,519 2,723 2,897 3,121 3,293 3,627 4,631 5,546 6,614 6,620 7,135 6,638
55 -59 1,326 1,430 1,542 1,685 1,823 1,921 2,036 2,217 2,352 2,470 2,806 3,899 4,907 5,801 6,851 6,799 7,274
60 -64 922 987 1,073 1,125 1,213 1,328 1,452 1,585 1,756 1,899 2,117 2,984 4,086 5,084 5,949 6,962 6,862
65 -69 580 602 644 715 806 912 984 1,082 1,152 1,242 1,442 2,217 3,081 4,170 5,135 5,958 6,925
70 -74 397 433 474 509 516 522 583 632 713 802 964 1,470 2,229 3,063 4,111 5,024 5,786
75 -79 260 276 294 308 355 379 401 445 484 493 528 945 1,422 2,133 2,905 3,874 4,704
80 -84 174 187 196 200 205 221 238 257 276 315 361 487 862 1,285 1,905 2,580 3,427
85 &up 134 134 145 172 184 202 220 243 264 280 320 502 709 1,141 1,733 2,584 3,603
Totals 47,195 48,298 49,270 49,906 50,914 52,162 53,458 55,368 57,004 58,218 62,916 72,612 82,254 91,588 100,210 107,536 113,435
Version 2021.0 A-34
D R A F T
10-19
-21
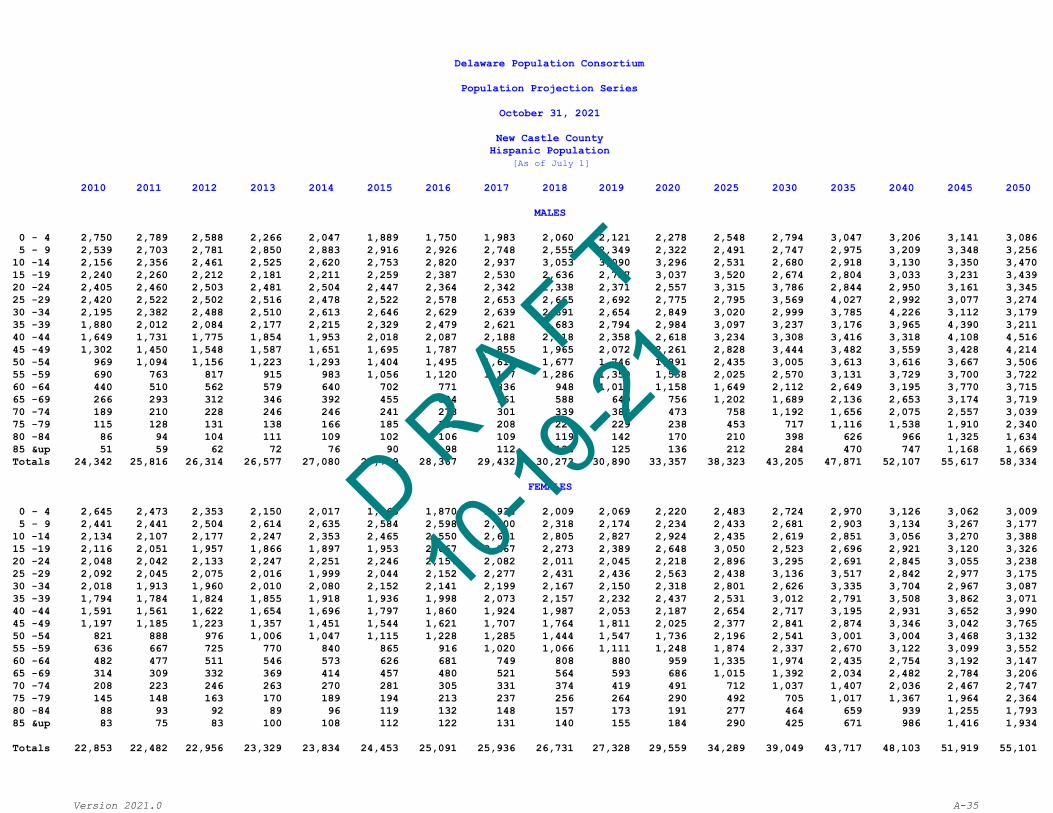
Delaware Population Consortium
Population Projection Series
October 31, 2021
New Castle CountyHispanic Population
[As of July 1]
2010 2011 2012 2013 2014 2015 2016 2017 2018 2019 2020 2025 2030 2035 2040 2045 2050
MALES
0 - 4 2,750 2,789 2,588 2,266 2,047 1,889 1,750 1,983 2,060 2,121 2,278 2,548 2,794 3,047 3,206 3,141 3,0865 - 9 2,539 2,703 2,781 2,850 2,883 2,916 2,926 2,748 2,555 2,349 2,322 2,491 2,747 2,975 3,209 3,348 3,256
10 -14 2,156 2,356 2,461 2,525 2,620 2,753 2,820 2,937 3,053 3,090 3,296 2,531 2,680 2,918 3,130 3,350 3,47015 -19 2,240 2,260 2,212 2,181 2,211 2,259 2,387 2,530 2,636 2,737 3,037 3,520 2,674 2,804 3,033 3,231 3,43920 -24 2,405 2,460 2,503 2,481 2,504 2,447 2,364 2,342 2,338 2,371 2,557 3,315 3,786 2,844 2,950 3,161 3,34525 -29 2,420 2,522 2,502 2,516 2,478 2,522 2,578 2,653 2,665 2,692 2,775 2,795 3,569 4,027 2,992 3,077 3,27430 -34 2,195 2,382 2,488 2,510 2,613 2,646 2,629 2,639 2,691 2,654 2,849 3,020 2,999 3,785 4,226 3,112 3,17935 -39 1,880 2,012 2,084 2,177 2,215 2,329 2,479 2,621 2,683 2,794 2,984 3,097 3,237 3,176 3,965 4,390 3,21140 -44 1,649 1,731 1,775 1,854 1,953 2,018 2,087 2,188 2,318 2,358 2,618 3,234 3,308 3,416 3,318 4,108 4,51645 -49 1,302 1,450 1,548 1,587 1,651 1,695 1,787 1,855 1,965 2,072 2,261 2,828 3,444 3,482 3,559 3,428 4,21450 -54 969 1,094 1,156 1,223 1,293 1,404 1,495 1,612 1,677 1,746 1,891 2,435 3,005 3,613 3,616 3,667 3,50655 -59 690 763 817 915 983 1,056 1,120 1,197 1,286 1,359 1,558 2,025 2,570 3,131 3,729 3,700 3,72260 -64 440 510 562 579 640 702 771 836 948 1,019 1,158 1,649 2,112 2,649 3,195 3,770 3,71565 -69 266 293 312 346 392 455 504 561 588 649 756 1,202 1,689 2,136 2,653 3,174 3,71970 -74 189 210 228 246 246 241 278 301 339 383 473 758 1,192 1,656 2,075 2,557 3,03975 -79 115 128 131 138 166 185 188 208 228 229 238 453 717 1,116 1,538 1,910 2,34080 -84 86 94 104 111 109 102 106 109 119 142 170 210 398 626 966 1,325 1,63485 &up 51 59 62 72 76 90 98 112 124 125 136 212 284 470 747 1,168 1,669Totals 24,342 25,816 26,314 26,577 27,080 27,709 28,367 29,432 30,273 30,890 33,357 38,323 43,205 47,871 52,107 55,617 58,334
FEMALES
0 - 4 2,645 2,473 2,353 2,150 2,017 1,963 1,870 1,934 2,009 2,069 2,220 2,483 2,724 2,970 3,126 3,062 3,0095 - 9 2,441 2,441 2,504 2,614 2,635 2,584 2,598 2,500 2,318 2,174 2,234 2,433 2,681 2,903 3,134 3,267 3,177
10 -14 2,134 2,107 2,177 2,247 2,353 2,465 2,550 2,651 2,805 2,827 2,924 2,435 2,619 2,851 3,056 3,270 3,38815 -19 2,116 2,051 1,957 1,866 1,897 1,953 2,067 2,167 2,273 2,389 2,648 3,050 2,523 2,696 2,921 3,120 3,32620 -24 2,048 2,042 2,133 2,247 2,251 2,246 2,157 2,082 2,011 2,045 2,218 2,896 3,295 2,691 2,845 3,055 3,23825 -29 2,092 2,045 2,075 2,016 1,999 2,044 2,152 2,277 2,431 2,436 2,563 2,438 3,136 3,517 2,842 2,977 3,17530 -34 2,018 1,913 1,960 2,010 2,080 2,152 2,141 2,199 2,167 2,150 2,318 2,801 2,626 3,335 3,704 2,967 3,08735 -39 1,794 1,784 1,824 1,855 1,918 1,936 1,998 2,073 2,157 2,232 2,437 2,531 3,012 2,791 3,508 3,862 3,07140 -44 1,591 1,561 1,622 1,654 1,696 1,797 1,860 1,924 1,987 2,053 2,187 2,654 2,717 3,195 2,931 3,652 3,99045 -49 1,197 1,185 1,223 1,357 1,451 1,544 1,621 1,707 1,764 1,811 2,025 2,377 2,841 2,874 3,346 3,042 3,76550 -54 821 888 976 1,006 1,047 1,115 1,228 1,285 1,444 1,547 1,736 2,196 2,541 3,001 3,004 3,468 3,13255 -59 636 667 725 770 840 865 916 1,020 1,066 1,111 1,248 1,874 2,337 2,670 3,122 3,099 3,55260 -64 482 477 511 546 573 626 681 749 808 880 959 1,335 1,974 2,435 2,754 3,192 3,14765 -69 314 309 332 369 414 457 480 521 564 593 686 1,015 1,392 2,034 2,482 2,784 3,20670 -74 208 223 246 263 270 281 305 331 374 419 491 712 1,037 1,407 2,036 2,467 2,74775 -79 145 148 163 170 189 194 213 237 256 264 290 492 705 1,017 1,367 1,964 2,36480 -84 88 93 92 89 96 119 132 148 157 173 191 277 464 659 939 1,255 1,79385 &up 83 75 83 100 108 112 122 131 140 155 184 290 425 671 986 1,416 1,934
Totals 22,853 22,482 22,956 23,329 23,834 24,453 25,091 25,936 26,731 27,328 29,559 34,289 39,049 43,717 48,103 51,919 55,101
Version 2021.0 A-35
D R A F T
10-19
-21

Delaware Population Consortium
Population Projection Series
October 31, 2021
City of NewarkTotal Population
[As of July 1]
2010 2011 2012 2013 2014 2015 2016 2017 2018 2019 2020 2025 2030 2035 2040 2045 2050
0 - 4 886 897 910 913 922 940 936 947 945 952 959 994 1,031 1,063 1,096 1,127 1,158
5 - 9 956 968 982 986 995 1,014 1,010 1,022 1,020 1,027 1,035 1,073 1,112 1,147 1,183 1,216 1,250
10 -14 926 938 951 955 964 982 978 990 988 995 1,002 1,039 1,077 1,111 1,146 1,178 1,211
15 -19 6,075 6,151 6,236 6,260 6,319 6,441 6,414 6,491 6,478 6,520 6,569 6,811 7,062 7,282 7,510 7,720 7,935
20 -24 9,615 9,735 9,870 9,908 10,002 10,194 10,152 10,275 10,255 10,322 10,399 10,782 11,180 11,528 11,888 12,220 12,562
25 -29 1,787 1,809 1,834 1,841 1,859 1,894 1,887 1,910 1,906 1,919 1,933 2,005 2,079 2,143 2,210 2,272 2,336
30 -34 1,162 1,176 1,192 1,197 1,208 1,231 1,226 1,241 1,239 1,247 1,257 1,303 1,351 1,393 1,437 1,477 1,518
35 -39 1,064 1,078 1,093 1,097 1,107 1,129 1,124 1,138 1,136 1,143 1,152 1,194 1,238 1,277 1,317 1,353 1,391
40 -44 1,103 1,117 1,133 1,137 1,148 1,170 1,165 1,179 1,177 1,185 1,194 1,238 1,283 1,323 1,364 1,403 1,442
45 -49 1,193 1,207 1,224 1,229 1,240 1,264 1,259 1,274 1,272 1,280 1,290 1,337 1,387 1,430 1,475 1,516 1,558
50 -54 1,337 1,353 1,372 1,377 1,390 1,417 1,411 1,428 1,426 1,435 1,446 1,499 1,554 1,603 1,653 1,699 1,746
55 -59 1,246 1,261 1,279 1,283 1,296 1,321 1,315 1,331 1,329 1,337 1,347 1,397 1,448 1,494 1,540 1,583 1,628
60 -64 1,149 1,163 1,179 1,183 1,195 1,218 1,213 1,227 1,225 1,233 1,242 1,288 1,336 1,377 1,420 1,460 1,501
65 -69 898 910 922 926 934 953 949 960 958 964 972 1,007 1,045 1,077 1,111 1,142 1,174
70 -74 611 619 627 630 636 648 645 653 652 656 661 685 711 733 756 777 799
75 -79 550 557 565 567 572 583 581 588 587 591 595 617 640 660 680 699 719
80 -84 439 445 451 453 457 466 464 469 468 471 475 492 510 526 543 558 573
85 &up 470 476 483 485 489 499 496 502 501 505 508 527 546 563 581 597 614
Totals 31,468 31,861 32,302 32,426 32,732 33,363 33,225 33,629 33,563 33,782 34,035 35,289 36,589 37,731 38,908 39,996 41,114
Version 2021.0 A-36
D R A F T
10-19
-21

Delaware Population Consortium
Population Projection Series
October 31, 2021
City of NewarkTotal Population
[As of July 1]
2010 2011 2012 2013 2014 2015 2016 2017 2018 2019 2020 2025 2030 2035 2040 2045 2050
MALES
0 - 4 427 433 439 440 444 453 451 457 456 460 463 480 498 514 530 544 5605 - 9 485 491 498 500 505 514 513 519 518 522 526 546 566 583 602 618 636
10 -14 453 459 465 467 471 480 479 485 484 488 491 510 528 545 562 578 59415 -19 2,606 2,639 2,675 2,686 2,711 2,763 2,753 2,788 2,784 2,804 2,826 2,930 3,038 3,133 3,231 3,321 3,41420 -24 4,399 4,454 4,516 4,533 4,576 4,664 4,647 4,706 4,699 4,732 4,770 4,946 5,128 5,288 5,453 5,606 5,76225 -29 1,004 1,017 1,031 1,035 1,045 1,065 1,061 1,075 1,073 1,081 1,089 1,129 1,171 1,208 1,245 1,280 1,31630 -34 624 632 641 643 649 662 659 668 667 672 677 702 728 750 774 796 81835 -39 562 569 577 579 585 596 594 601 601 605 610 632 655 676 697 716 73740 -44 527 534 541 543 548 559 557 564 563 567 572 593 615 634 654 672 69145 -49 582 590 598 600 606 617 615 623 622 626 631 655 679 700 722 742 76350 -54 649 657 666 669 675 688 686 695 694 698 704 730 757 781 805 827 85155 -59 604 612 620 623 629 641 638 646 646 650 655 679 704 726 749 770 79260 -64 563 570 578 580 586 597 595 603 602 606 611 633 657 677 698 718 73865 -69 401 406 412 413 417 425 424 429 429 432 435 451 468 482 497 511 52670 -74 278 282 285 287 289 295 294 298 297 299 302 313 324 334 345 354 36475 -79 216 219 222 223 225 229 228 231 231 232 234 243 252 260 268 275 28380 -84 151 153 155 156 157 160 160 162 161 163 164 170 176 182 187 193 19885 &up 154 156 158 159 160 163 163 165 165 166 167 173 180 185 191 196 202Totals 14,689 14,872 15,078 15,136 15,279 15,573 15,517 15,714 15,691 15,802 15,928 16,515 17,124 17,658 18,209 18,718 19,241
FEMALES
0 - 4 459 465 471 473 478 487 485 490 489 492 496 514 533 549 566 582 5995 - 9 471 477 484 486 490 500 497 503 502 505 508 527 547 564 581 598 614
10 -14 473 479 486 488 492 502 499 505 504 507 511 529 549 566 584 600 61715 -19 3,469 3,512 3,560 3,574 3,608 3,677 3,661 3,703 3,694 3,717 3,743 3,881 4,024 4,149 4,279 4,398 4,52120 -24 5,216 5,281 5,355 5,375 5,426 5,530 5,505 5,569 5,556 5,590 5,629 5,836 6,051 6,240 6,435 6,615 6,80025 -29 782 792 803 806 814 829 826 835 833 838 844 875 908 936 965 992 1,02030 -34 537 544 551 554 559 570 567 574 572 576 580 601 623 643 663 681 70035 -39 502 508 516 518 522 532 530 536 535 538 542 562 583 601 620 637 65540 -44 576 583 592 594 599 611 608 615 614 617 622 645 669 689 711 731 75145 -49 610 618 626 629 635 647 644 652 650 654 659 683 708 730 753 774 79650 -54 687 696 706 708 715 729 725 734 732 736 742 769 797 822 848 872 89655 -59 641 649 658 661 667 680 677 685 683 687 692 718 744 767 791 813 83660 -64 585 593 601 603 609 621 618 625 623 627 632 655 679 700 722 742 76365 -69 497 503 510 512 517 527 525 531 530 533 537 556 577 595 613 631 64870 -74 333 337 342 343 347 353 352 356 355 357 360 373 386 399 411 422 43475 -79 334 338 343 344 348 354 353 357 356 358 361 374 388 400 412 424 43680 -84 288 292 296 297 300 305 304 308 307 309 311 322 334 345 355 365 37685 &up 316 320 325 326 329 335 334 338 337 339 341 354 367 378 390 401 412
Totals 16,779 16,989 17,224 17,290 17,453 17,790 17,708 17,915 17,872 17,980 18,107 18,774 19,466 20,073 20,699 21,278 21,873
Version 2021.0 A-37
D R A F T
10-19
-21

Delaware Population Consortium
Population Projection Series
October 31, 2021
City of WilmingtonTotal Population
[As of July 1]
2010 2011 2012 2013 2014 2015 2016 2017 2018 2019 2020 2025 2030 2035 2040 2045 2050
0 - 4 5,071 5,173 5,231 5,261 5,383 5,408 5,354 5,226 5,100 4,968 5,006 4,521 4,442 4,628 4,842 4,942 4,874
5 - 9 4,582 4,670 4,800 4,790 4,889 4,994 5,064 5,055 5,087 5,138 5,298 4,947 4,462 4,374 4,570 4,786 4,899
10 -14 4,349 4,384 4,483 4,569 4,585 4,539 4,594 4,633 4,615 4,656 4,885 5,256 4,906 4,421 4,332 4,530 4,748
15 -19 4,691 4,641 4,388 4,277 4,271 4,309 4,329 4,365 4,406 4,354 4,420 4,855 5,242 4,880 4,387 4,302 4,497
20 -24 5,129 4,863 4,731 4,737 4,689 4,619 4,569 4,293 4,121 4,053 4,161 4,366 4,808 5,202 4,846 4,349 4,264
25 -29 6,410 6,216 5,957 5,618 5,238 4,990 4,745 4,597 4,540 4,427 4,441 4,101 4,308 4,756 5,158 4,800 4,295
30 -34 5,545 5,837 6,154 6,236 6,329 6,159 5,971 5,737 5,417 5,002 4,772 4,366 4,031 4,235 4,692 5,100 4,739
35 -39 4,744 4,600 4,589 4,695 4,990 5,319 5,598 5,903 6,010 6,069 5,929 4,679 4,269 3,945 4,146 4,607 5,018
40 -44 4,730 4,737 4,649 4,609 4,581 4,528 4,392 4,387 4,496 4,761 5,103 5,831 4,575 4,151 3,837 4,047 4,503
45 -49 5,071 4,958 4,836 4,706 4,483 4,501 4,525 4,442 4,365 4,315 4,279 4,990 5,714 4,450 4,024 3,725 3,925
50 -54 4,949 4,929 4,826 4,858 4,838 4,792 4,710 4,616 4,430 4,200 4,221 4,157 4,859 5,571 4,312 3,884 3,592
55 -59 4,181 4,257 4,352 4,421 4,489 4,598 4,610 4,564 4,516 4,462 4,401 4,036 3,986 4,672 5,371 4,127 3,697
60 -64 3,425 3,558 3,587 3,675 3,730 3,791 3,891 4,033 4,050 4,080 4,149 4,122 3,786 3,745 4,414 5,087 3,871
65 -69 2,480 2,485 2,624 2,738 2,824 3,012 3,153 3,233 3,272 3,306 3,330 3,779 3,753 3,455 3,433 4,077 4,703
70 -74 1,881 1,875 1,896 1,985 2,013 2,082 2,097 2,256 2,335 2,403 2,525 2,904 3,287 3,265 3,022 3,016 3,613
75 -79 1,534 1,506 1,459 1,462 1,496 1,484 1,488 1,532 1,594 1,611 1,645 2,084 2,400 2,702 2,680 2,501 2,508
80 -84 1,201 1,185 1,169 1,140 1,099 1,100 1,102 1,083 1,077 1,090 1,085 1,250 1,587 1,827 2,050 2,036 1,915
85 &up 1,481 1,422 1,394 1,358 1,343 1,342 1,318 1,331 1,291 1,266 1,253 1,255 1,398 1,685 1,996 2,300 2,453
Totals 71,454 71,296 71,125 71,135 71,270 71,567 71,510 71,286 70,722 70,161 70,903 71,499 71,813 71,964 72,112 72,216 72,114
Version 2021.0 A-38
D R A F T
10-19
-21

Delaware Population Consortium
Population Projection Series
October 31, 2021
City of WilmingtonTotal Population
[As of July 1]
2010 2011 2012 2013 2014 2015 2016 2017 2018 2019 2020 2025 2030 2035 2040 2045 2050
MALES
0 - 4 2,526 2,593 2,616 2,627 2,669 2,699 2,671 2,607 2,545 2,480 2,498 2,256 2,218 2,310 2,418 2,469 2,4335 - 9 2,304 2,351 2,425 2,386 2,447 2,487 2,536 2,523 2,533 2,545 2,642 2,467 2,226 2,181 2,280 2,387 2,445
10 -14 2,206 2,217 2,250 2,318 2,341 2,284 2,314 2,339 2,302 2,331 2,426 2,621 2,447 2,205 2,161 2,261 2,37115 -19 2,384 2,331 2,198 2,146 2,147 2,182 2,186 2,189 2,232 2,222 2,228 2,410 2,610 2,433 2,186 2,145 2,24220 -24 2,582 2,493 2,453 2,476 2,393 2,345 2,290 2,145 2,064 2,033 2,097 2,198 2,383 2,588 2,413 2,165 2,12325 -29 3,130 3,038 2,921 2,720 2,607 2,508 2,430 2,378 2,370 2,254 2,257 2,060 2,168 2,354 2,564 2,388 2,13430 -34 2,774 2,859 3,051 3,099 3,084 2,996 2,901 2,794 2,611 2,480 2,385 2,211 2,020 2,125 2,316 2,530 2,35035 -39 2,350 2,289 2,263 2,306 2,487 2,642 2,724 2,898 2,960 2,940 2,872 2,327 2,152 1,967 2,071 2,262 2,47840 -44 2,275 2,278 2,213 2,237 2,245 2,223 2,163 2,136 2,194 2,360 2,508 2,807 2,259 2,078 1,897 2,007 2,19845 -49 2,411 2,375 2,345 2,235 2,120 2,142 2,150 2,090 2,098 2,099 2,076 2,436 2,731 2,179 1,995 1,825 1,93150 -54 2,372 2,321 2,280 2,329 2,290 2,253 2,230 2,206 2,085 1,976 1,998 2,000 2,358 2,644 2,093 1,909 1,74255 -59 1,956 2,001 2,044 2,057 2,118 2,175 2,140 2,124 2,140 2,087 2,040 1,894 1,900 2,244 2,527 1,983 1,79860 -64 1,571 1,643 1,670 1,712 1,739 1,748 1,800 1,857 1,852 1,896 1,929 1,885 1,755 1,762 2,096 2,367 1,83465 -69 1,070 1,051 1,134 1,200 1,243 1,351 1,422 1,466 1,490 1,508 1,502 1,722 1,681 1,575 1,586 1,902 2,15170 -74 762 791 755 793 813 861 849 934 985 1,017 1,090 1,261 1,439 1,407 1,335 1,344 1,63475 -79 557 541 554 564 582 564 592 572 602 618 645 853 993 1,122 1,096 1,058 1,06880 -84 410 395 394 383 366 365 363 377 379 391 383 454 608 706 793 776 76485 &up 357 359 353 334 336 346 340 350 338 335 336 355 419 531 647 753 789Totals 33,997 33,926 33,919 33,922 34,027 34,171 34,101 33,985 33,780 33,572 33,912 34,217 34,367 34,411 34,474 34,531 34,485
FEMALES
0 - 4 2,545 2,580 2,615 2,634 2,714 2,709 2,683 2,619 2,555 2,488 2,508 2,265 2,224 2,318 2,424 2,473 2,4415 - 9 2,278 2,319 2,375 2,404 2,442 2,507 2,528 2,532 2,554 2,593 2,656 2,480 2,236 2,193 2,290 2,399 2,454
10 -14 2,143 2,167 2,233 2,251 2,244 2,255 2,280 2,294 2,313 2,325 2,459 2,635 2,459 2,216 2,171 2,269 2,37715 -19 2,307 2,310 2,190 2,131 2,124 2,127 2,143 2,176 2,174 2,132 2,192 2,445 2,632 2,447 2,201 2,157 2,25520 -24 2,547 2,370 2,278 2,261 2,296 2,274 2,279 2,148 2,057 2,020 2,064 2,168 2,425 2,614 2,433 2,184 2,14125 -29 3,280 3,178 3,036 2,898 2,631 2,482 2,315 2,219 2,170 2,173 2,184 2,041 2,140 2,402 2,594 2,412 2,16130 -34 2,771 2,978 3,103 3,137 3,245 3,163 3,070 2,943 2,806 2,522 2,387 2,155 2,011 2,110 2,376 2,570 2,38935 -39 2,394 2,311 2,326 2,389 2,503 2,677 2,874 3,005 3,050 3,129 3,057 2,352 2,117 1,978 2,075 2,345 2,54040 -44 2,455 2,459 2,436 2,372 2,336 2,305 2,229 2,251 2,302 2,401 2,595 3,024 2,316 2,073 1,940 2,040 2,30545 -49 2,660 2,583 2,491 2,471 2,363 2,359 2,375 2,352 2,267 2,216 2,203 2,554 2,983 2,271 2,029 1,900 1,99450 -54 2,577 2,608 2,546 2,529 2,548 2,539 2,480 2,410 2,345 2,224 2,223 2,157 2,501 2,927 2,219 1,975 1,85055 -59 2,225 2,256 2,308 2,364 2,371 2,423 2,470 2,440 2,376 2,375 2,361 2,142 2,086 2,428 2,844 2,144 1,89960 -64 1,854 1,915 1,917 1,963 1,991 2,043 2,091 2,176 2,198 2,184 2,220 2,237 2,031 1,983 2,318 2,720 2,03765 -69 1,410 1,434 1,490 1,538 1,581 1,661 1,731 1,767 1,782 1,798 1,828 2,057 2,072 1,880 1,847 2,175 2,55270 -74 1,119 1,084 1,141 1,192 1,200 1,221 1,248 1,322 1,350 1,386 1,435 1,643 1,848 1,858 1,687 1,672 1,97975 -79 977 965 905 898 914 920 896 960 992 993 1,000 1,231 1,407 1,580 1,584 1,443 1,44080 -84 791 790 775 757 733 735 739 706 698 699 702 796 979 1,121 1,257 1,260 1,15185 &up 1,124 1,063 1,041 1,024 1,007 996 978 981 953 931 917 900 979 1,154 1,349 1,547 1,664
Totals 37,457 37,370 37,206 37,213 37,243 37,396 37,409 37,301 36,942 36,589 36,991 37,282 37,446 37,553 37,638 37,685 37,629
Version 2021.0 A-39
D R A F T
10-19
-21
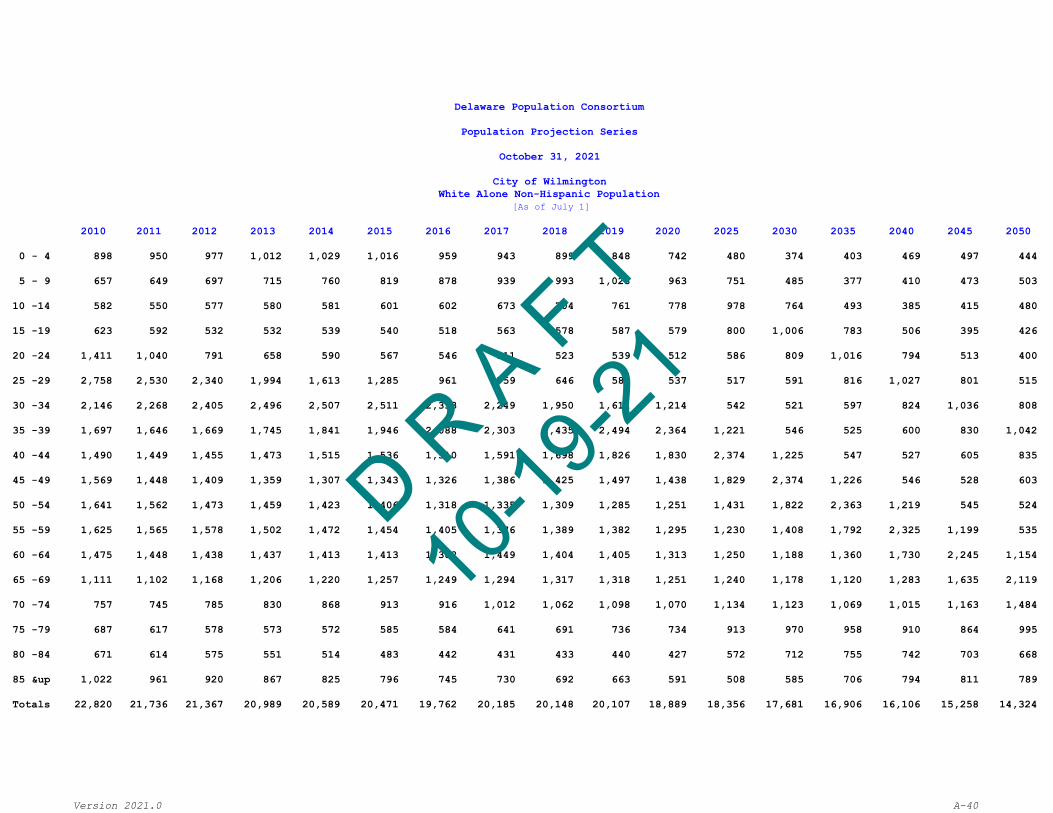
Delaware Population Consortium
Population Projection Series
October 31, 2021
City of WilmingtonWhite Alone Non-Hispanic Population
[As of July 1]
2010 2011 2012 2013 2014 2015 2016 2017 2018 2019 2020 2025 2030 2035 2040 2045 2050
0 - 4 898 950 977 1,012 1,029 1,016 959 943 899 848 742 480 374 403 469 497 444
5 - 9 657 649 697 715 760 819 878 939 993 1,028 963 751 485 377 410 473 503
10 -14 582 550 577 580 581 601 602 673 704 761 778 978 764 493 385 415 480
15 -19 623 592 532 532 539 540 518 563 578 587 579 800 1,006 783 506 395 426
20 -24 1,411 1,040 791 658 590 567 546 511 523 539 512 586 809 1,016 794 513 400
25 -29 2,758 2,530 2,340 1,994 1,613 1,285 961 759 646 589 537 517 591 816 1,027 801 515
30 -34 2,146 2,268 2,405 2,496 2,507 2,511 2,333 2,249 1,950 1,611 1,214 542 521 597 824 1,036 808
35 -39 1,697 1,646 1,669 1,745 1,841 1,946 2,088 2,303 2,435 2,494 2,364 1,221 546 525 600 830 1,042
40 -44 1,490 1,449 1,455 1,473 1,515 1,536 1,510 1,591 1,698 1,826 1,830 2,374 1,225 547 527 605 835
45 -49 1,569 1,448 1,409 1,359 1,307 1,343 1,326 1,386 1,425 1,497 1,438 1,829 2,374 1,226 546 528 603
50 -54 1,641 1,562 1,473 1,459 1,423 1,406 1,318 1,335 1,309 1,285 1,251 1,431 1,822 2,363 1,219 545 524
55 -59 1,625 1,565 1,578 1,502 1,472 1,454 1,405 1,376 1,389 1,382 1,295 1,230 1,408 1,792 2,325 1,199 535
60 -64 1,475 1,448 1,438 1,437 1,413 1,413 1,382 1,449 1,404 1,405 1,313 1,250 1,188 1,360 1,730 2,245 1,154
65 -69 1,111 1,102 1,168 1,206 1,220 1,257 1,249 1,294 1,317 1,318 1,251 1,240 1,178 1,120 1,283 1,635 2,119
70 -74 757 745 785 830 868 913 916 1,012 1,062 1,098 1,070 1,134 1,123 1,069 1,015 1,163 1,484
75 -79 687 617 578 573 572 585 584 641 691 736 734 913 970 958 910 864 995
80 -84 671 614 575 551 514 483 442 431 433 440 427 572 712 755 742 703 668
85 &up 1,022 961 920 867 825 796 745 730 692 663 591 508 585 706 794 811 789
Totals 22,820 21,736 21,367 20,989 20,589 20,471 19,762 20,185 20,148 20,107 18,889 18,356 17,681 16,906 16,106 15,258 14,324
Version 2021.0 A-40
D R A F T
10-19
-21

Delaware Population Consortium
Population Projection Series
October 31, 2021
City of WilmingtonWhite Alone Non-Hispanic Population
[As of July 1]
2010 2011 2012 2013 2014 2015 2016 2017 2018 2019 2020 2025 2030 2035 2040 2045 2050
MALES
0 - 4 460 483 496 510 511 506 478 471 448 424 370 239 187 201 234 248 2215 - 9 312 318 348 358 383 419 446 477 500 511 480 374 242 188 205 235 251
10 -14 291 263 273 277 287 284 294 336 352 383 398 488 381 245 192 207 24015 -19 321 307 270 265 266 269 247 265 275 289 272 407 499 389 251 196 21120 -24 713 529 408 353 305 292 282 260 261 266 255 275 412 503 393 254 19825 -29 1,415 1,314 1,206 1,011 812 649 489 391 347 304 277 256 278 415 508 397 25530 -34 1,169 1,176 1,247 1,271 1,274 1,285 1,208 1,157 987 810 612 278 259 279 418 512 39935 -39 913 910 911 962 1,028 1,057 1,079 1,190 1,236 1,263 1,207 613 280 260 280 420 51340 -44 833 800 794 800 821 823 832 865 933 1,016 990 1,207 613 280 260 281 42145 -49 848 787 783 753 729 748 729 752 770 807 767 986 1,201 610 277 259 27850 -54 860 813 780 789 746 756 712 738 723 714 693 759 977 1,190 603 276 25555 -59 809 806 797 767 769 757 726 723 746 720 691 676 742 953 1,161 589 26860 -64 725 696 709 708 701 697 705 724 710 727 676 661 647 710 912 1,110 56165 -69 513 512 553 577 573 607 590 627 637 643 606 629 613 601 659 848 1,03170 -74 318 337 332 349 387 409 414 465 494 500 503 534 553 541 531 581 74975 -79 260 229 227 238 234 234 253 258 277 313 315 410 438 453 443 434 47780 -84 228 198 191 186 177 170 152 158 167 168 160 229 301 320 329 322 31685 &up 233 237 227 210 199 195 185 186 175 173 157 145 189 243 277 292 292Totals 11,221 10,715 10,552 10,384 10,202 10,157 9,821 10,043 10,038 10,031 9,429 9,166 8,812 8,381 7,933 7,461 6,936
FEMALES
0 - 4 438 467 481 502 518 510 481 472 451 424 372 241 187 202 235 249 2235 - 9 345 331 349 357 377 400 432 462 493 517 483 377 243 189 205 238 252
10 -14 291 287 304 303 294 317 308 337 352 378 380 490 383 248 193 208 24015 -19 302 285 262 267 273 271 271 298 303 298 307 393 507 394 255 199 21520 -24 698 511 383 305 285 275 264 251 262 273 257 311 397 513 401 259 20225 -29 1,343 1,216 1,134 983 801 636 472 368 299 285 260 261 313 401 519 404 26030 -34 977 1,092 1,158 1,225 1,233 1,226 1,125 1,092 963 801 602 264 262 318 406 524 40935 -39 784 736 758 783 813 889 1,009 1,113 1,199 1,231 1,157 608 266 265 320 410 52940 -44 657 649 661 673 694 713 678 726 765 810 840 1,167 612 267 267 324 41445 -49 721 661 626 606 578 595 597 634 655 690 671 843 1,173 616 269 269 32550 -54 781 749 693 670 677 650 606 597 586 571 558 672 845 1,173 616 269 26955 -59 816 759 781 735 703 697 679 653 643 662 604 554 666 839 1,164 610 26760 -64 750 752 729 729 712 716 677 725 694 678 637 589 541 650 818 1,135 59365 -69 598 590 615 629 647 650 659 667 680 675 645 611 565 519 624 787 1,08870 -74 439 408 453 481 481 504 502 547 568 598 567 600 570 528 484 582 73575 -79 427 388 351 335 338 351 331 383 414 423 419 503 532 505 467 430 51880 -84 443 416 384 365 337 313 290 273 266 272 267 343 411 435 413 381 35285 &up 789 724 693 657 626 601 560 544 517 490 434 363 396 463 517 519 497
Totals 11,599 11,021 10,815 10,605 10,387 10,314 9,941 10,142 10,110 10,076 9,460 9,190 8,869 8,525 8,173 7,797 7,388
Version 2021.0 A-41
D R A F T
10-19
-21

Delaware Population Consortium
Population Projection Series
October 31, 2021
City of WilmingtonBlack Alone Non-Hispanic Population
[As of July 1]
2010 2011 2012 2013 2014 2015 2016 2017 2018 2019 2020 2025 2030 2035 2040 2045 2050
0 - 4 3,098 3,157 3,090 3,149 3,137 3,172 3,254 3,243 3,111 2,983 2,941 2,811 2,790 2,815 2,824 2,788 2,748
5 - 9 2,947 2,986 2,960 3,024 3,000 3,040 3,135 3,142 3,028 2,959 2,956 2,894 2,768 2,742 2,768 2,777 2,745
10 -14 2,959 2,995 2,947 3,046 2,952 2,906 2,978 3,022 2,918 2,842 2,849 2,922 2,862 2,738 2,711 2,738 2,746
15 -19 3,320 3,299 3,078 3,017 2,926 2,916 2,986 3,011 2,945 2,798 2,723 2,815 2,890 2,829 2,705 2,680 2,707
20 -24 2,918 3,062 3,116 3,310 3,272 3,263 3,282 3,138 2,906 2,765 2,724 2,684 2,778 2,849 2,791 2,668 2,646
25 -29 2,682 2,718 2,649 2,766 2,754 2,864 3,041 3,167 3,181 3,082 3,039 2,680 2,641 2,732 2,803 2,744 2,623
30 -34 2,577 2,678 2,719 2,768 2,728 2,624 2,688 2,683 2,649 2,586 2,658 2,980 2,626 2,586 2,676 2,746 2,689
35 -39 2,390 2,289 2,200 2,244 2,348 2,506 2,636 2,740 2,638 2,549 2,424 2,590 2,903 2,559 2,520 2,609 2,678
40 -44 2,642 2,677 2,520 2,528 2,391 2,307 2,237 2,202 2,122 2,179 2,300 2,348 2,508 2,809 2,475 2,438 2,524
45 -49 2,980 2,986 2,824 2,770 2,555 2,537 2,603 2,511 2,379 2,208 2,106 2,216 2,264 2,411 2,703 2,380 2,345
50 -54 2,917 2,955 2,899 2,957 2,911 2,845 2,887 2,796 2,593 2,347 2,304 2,019 2,124 2,169 2,311 2,589 2,279
55 -59 2,217 2,337 2,372 2,543 2,612 2,736 2,809 2,818 2,721 2,627 2,537 2,171 1,901 2,000 2,043 2,175 2,436
60 -64 1,712 1,852 1,876 1,957 1,988 2,032 2,169 2,253 2,288 2,300 2,383 2,335 1,996 1,745 1,843 1,880 1,998
65 -69 1,206 1,218 1,258 1,343 1,378 1,515 1,657 1,718 1,696 1,690 1,708 2,114 2,072 1,772 1,547 1,637 1,669
70 -74 992 983 956 1,010 994 1,005 1,030 1,088 1,101 1,108 1,203 1,427 1,769 1,734 1,484 1,292 1,372
75 -79 768 801 772 784 797 771 775 773 770 746 744 942 1,117 1,381 1,355 1,161 1,005
80 -84 470 511 529 533 514 546 582 571 549 543 522 533 677 799 989 972 832
85 &up 404 404 408 437 452 461 489 518 504 492 509 538 559 656 778 945 1,010
Totals 39,199 39,908 39,173 40,186 39,709 40,046 41,238 41,394 40,099 38,804 38,630 39,019 39,245 39,326 39,326 39,219 39,052
Version 2021.0 A-42
D R A F T
10-19
-21

Delaware Population Consortium
Population Projection Series
October 31, 2021
City of WilmingtonBlack Alone Non-Hispanic Population
[As of July 1]
2010 2011 2012 2013 2014 2015 2016 2017 2018 2019 2020 2025 2030 2035 2040 2045 2050
MALES
0 - 4 1,527 1,576 1,533 1,557 1,543 1,577 1,616 1,611 1,546 1,482 1,461 1,396 1,386 1,398 1,403 1,385 1,3655 - 9 1,490 1,505 1,484 1,496 1,493 1,498 1,564 1,558 1,495 1,454 1,467 1,437 1,374 1,360 1,373 1,378 1,362
10 -14 1,513 1,522 1,498 1,564 1,510 1,469 1,501 1,514 1,444 1,415 1,404 1,449 1,420 1,359 1,345 1,358 1,36315 -19 1,662 1,642 1,539 1,513 1,478 1,490 1,516 1,530 1,512 1,431 1,376 1,387 1,433 1,403 1,341 1,330 1,34320 -24 1,465 1,564 1,601 1,704 1,648 1,632 1,632 1,568 1,457 1,395 1,391 1,354 1,367 1,411 1,383 1,322 1,31125 -29 1,197 1,219 1,214 1,280 1,351 1,435 1,551 1,625 1,636 1,550 1,517 1,366 1,331 1,342 1,387 1,358 1,29730 -34 1,196 1,239 1,269 1,293 1,230 1,166 1,200 1,224 1,220 1,263 1,327 1,482 1,334 1,299 1,310 1,354 1,32535 -39 1,094 1,036 986 1,002 1,065 1,155 1,211 1,270 1,224 1,141 1,069 1,284 1,434 1,292 1,257 1,268 1,31140 -44 1,153 1,182 1,093 1,125 1,074 1,044 1,001 975 937 977 1,049 1,024 1,231 1,373 1,236 1,204 1,21545 -49 1,306 1,315 1,248 1,197 1,092 1,094 1,133 1,075 1,044 980 941 997 974 1,170 1,305 1,176 1,14450 -54 1,315 1,317 1,284 1,318 1,286 1,231 1,256 1,219 1,105 990 981 891 945 920 1,108 1,235 1,11255 -59 970 1,015 1,048 1,113 1,151 1,214 1,232 1,228 1,194 1,142 1,081 909 825 875 853 1,028 1,14660 -64 725 809 815 849 867 872 923 974 981 992 1,037 974 817 742 791 769 92765 -69 485 469 491 535 557 623 702 723 714 715 710 893 838 702 637 682 66170 -74 383 384 352 378 365 381 373 399 413 422 467 559 705 659 554 501 54075 -79 267 278 284 286 292 274 279 262 265 252 259 338 404 508 474 399 35980 -84 155 171 173 170 161 169 181 189 178 177 165 165 218 258 326 304 25485 &up 103 101 101 106 111 117 123 129 121 119 122 124 128 157 189 234 237Totals 18,006 18,344 18,013 18,486 18,274 18,441 18,994 19,073 18,486 17,897 17,824 18,029 18,164 18,228 18,272 18,285 18,272
FEMALES
0 - 4 1,571 1,581 1,557 1,592 1,594 1,595 1,638 1,632 1,565 1,501 1,480 1,415 1,404 1,417 1,421 1,403 1,3835 - 9 1,457 1,481 1,476 1,528 1,507 1,542 1,571 1,584 1,533 1,505 1,489 1,457 1,394 1,382 1,395 1,399 1,383
10 -14 1,446 1,473 1,449 1,482 1,442 1,437 1,477 1,508 1,474 1,427 1,445 1,473 1,442 1,379 1,366 1,380 1,38315 -19 1,658 1,657 1,539 1,504 1,448 1,426 1,470 1,481 1,433 1,367 1,347 1,428 1,457 1,426 1,364 1,350 1,36420 -24 1,453 1,498 1,515 1,606 1,624 1,631 1,650 1,570 1,449 1,370 1,333 1,330 1,411 1,438 1,408 1,346 1,33525 -29 1,485 1,499 1,435 1,486 1,403 1,429 1,490 1,542 1,545 1,532 1,522 1,314 1,310 1,390 1,416 1,386 1,32630 -34 1,381 1,439 1,450 1,475 1,498 1,458 1,488 1,459 1,429 1,323 1,331 1,498 1,292 1,287 1,366 1,392 1,36435 -39 1,296 1,253 1,214 1,242 1,283 1,351 1,425 1,470 1,414 1,408 1,355 1,306 1,469 1,267 1,263 1,341 1,36740 -44 1,489 1,495 1,427 1,403 1,317 1,263 1,236 1,227 1,185 1,202 1,251 1,324 1,277 1,436 1,239 1,234 1,30945 -49 1,674 1,671 1,576 1,573 1,463 1,443 1,470 1,436 1,335 1,228 1,165 1,219 1,290 1,241 1,398 1,204 1,20150 -54 1,602 1,638 1,615 1,639 1,625 1,614 1,631 1,577 1,488 1,357 1,323 1,128 1,179 1,249 1,203 1,354 1,16755 -59 1,247 1,322 1,324 1,430 1,461 1,522 1,577 1,590 1,527 1,485 1,456 1,262 1,076 1,125 1,190 1,147 1,29060 -64 987 1,043 1,061 1,108 1,121 1,160 1,246 1,279 1,307 1,308 1,346 1,361 1,179 1,003 1,052 1,111 1,07165 -69 721 749 767 808 821 892 955 995 982 975 998 1,221 1,234 1,070 910 955 1,00870 -74 609 599 604 632 629 624 657 689 688 686 736 868 1,064 1,075 930 791 83275 -79 501 523 488 498 505 497 496 511 505 494 485 604 713 873 881 762 64680 -84 315 340 356 363 353 377 401 382 371 366 357 368 459 541 663 668 57885 &up 301 303 307 331 341 344 366 389 383 373 387 414 431 499 589 711 773
Totals 21,193 21,564 21,160 21,700 21,435 21,605 22,244 22,321 21,613 20,907 20,806 20,990 21,081 21,098 21,054 20,934 20,780
Version 2021.0 A-43
D R A F T
10-19
-21

Delaware Population Consortium
Population Projection Series
October 31, 2021
City of WilmingtonOther Races, Including Two or More Races, Non-Hispanic Population
[As of July 1]
2010 2011 2012 2013 2014 2015 2016 2017 2018 2019 2020 2025 2030 2035 2040 2045 2050
0 - 4 135 162 161 116 153 194 209 230 232 232 394 347 378 450 559 677 726
5 - 9 108 129 124 89 126 161 181 216 237 253 444 418 371 402 482 596 720
10 -14 90 111 106 74 97 127 142 166 183 204 368 468 442 392 424 510 631
15 -19 89 102 96 65 86 105 124 144 151 162 292 393 501 472 419 454 543
20 -24 85 91 78 53 77 106 115 128 134 141 245 313 419 536 506 449 485
25 -29 134 152 133 82 90 100 102 105 111 125 243 261 333 447 568 537 475
30 -34 122 150 151 100 132 158 168 173 167 147 225 254 274 349 470 597 563
35 -39 77 99 95 74 111 141 164 197 204 215 354 231 264 284 360 486 618
40 -44 69 79 72 50 62 86 105 124 150 177 316 366 240 270 291 374 501
45 -49 57 64 65 44 60 79 87 93 97 97 194 326 375 247 280 302 385
50 -54 62 67 55 38 49 64 69 83 86 99 175 198 334 383 250 287 308
55 -59 50 58 61 46 57 72 71 73 73 75 142 179 203 341 392 258 293
60 -64 35 52 43 30 42 55 62 80 89 91 156 144 183 206 346 403 263
65 -69 23 26 29 20 30 39 55 54 57 68 120 157 146 184 211 356 409
70 -74 24 28 23 20 23 28 27 37 39 45 85 122 160 147 190 216 361
75 -79 20 25 24 14 24 28 28 30 38 33 58 87 126 165 151 192 218
80 -84 11 13 14 13 17 22 25 28 29 34 60 58 88 126 164 152 192
85 &up 16 19 20 9 15 26 31 37 45 52 88 123 152 195 260 353 415
Totals 1,207 1,427 1,350 937 1,251 1,591 1,765 1,998 2,122 2,250 3,959 4,445 4,989 5,596 6,323 7,199 8,106
Version 2021.0 A-44
D R A F T
10-19
-21

Delaware Population Consortium
Population Projection Series
October 31, 2021
City of WilmingtonOther Races, Including Two or More Races, Non-Hispanic Population
[As of July 1]
2010 2011 2012 2013 2014 2015 2016 2017 2018 2019 2020 2025 2030 2035 2040 2045 2050
MALES
0 - 4 62 75 77 56 75 97 105 115 116 116 197 174 189 225 280 339 3635 - 9 58 74 68 47 62 76 84 104 114 124 222 209 186 201 242 299 361
10 -14 40 51 50 36 50 69 82 93 96 102 173 235 222 197 213 257 31715 -19 48 48 44 32 42 46 56 68 74 84 158 186 251 238 211 228 27320 -24 39 51 44 28 39 57 54 58 64 68 108 170 198 270 255 226 24425 -29 64 67 65 38 40 46 57 59 60 63 131 115 181 211 286 271 23830 -34 52 65 61 43 62 76 74 84 77 67 103 137 120 190 223 301 28435 -39 32 40 39 33 48 61 71 81 88 100 171 106 143 126 196 231 31240 -44 37 41 37 24 28 35 42 51 67 77 136 176 110 146 129 204 23845 -49 21 25 28 21 29 42 45 47 46 43 79 140 180 113 151 134 21050 -54 25 28 23 17 20 24 27 36 40 47 93 80 144 183 114 154 13655 -59 22 27 23 17 22 30 28 30 32 29 53 95 82 146 187 118 15760 -64 13 20 20 14 19 24 29 30 32 35 62 53 96 82 147 192 11965 -69 10 11 12 8 12 15 21 25 26 30 53 63 53 97 85 151 19470 -74 10 11 10 8 10 12 11 16 16 18 33 54 63 53 100 86 15375 -79 8 12 9 4 9 12 11 12 17 15 25 34 56 65 54 101 8780 -84 5 6 7 8 9 9 12 10 9 13 25 25 35 56 65 55 10185 &up 5 6 7 1 5 10 12 16 21 23 35 54 66 79 111 146 162Totals 551 658 624 435 581 741 821 935 995 1,054 1,857 2,106 2,375 2,678 3,049 3,493 3,949
FEMALES
0 - 4 73 87 84 60 78 97 104 115 116 116 197 173 189 225 279 338 3635 - 9 50 55 56 42 64 85 97 112 123 129 222 209 185 201 240 297 359
10 -14 50 60 56 38 47 58 60 73 87 102 195 233 220 195 211 253 31415 -19 41 54 52 33 44 59 68 76 77 78 134 207 250 234 208 226 27020 -24 46 40 34 25 38 49 61 70 70 73 137 143 221 266 251 223 24125 -29 70 85 68 44 50 54 45 46 51 62 112 146 152 236 282 266 23730 -34 70 85 90 57 70 82 94 89 90 80 122 117 154 159 247 296 27935 -39 45 59 56 41 63 80 93 116 116 115 183 125 121 158 164 255 30640 -44 32 38 35 26 34 51 63 73 83 100 180 190 130 124 162 170 26345 -49 36 39 37 23 31 37 42 46 51 54 115 186 195 134 129 168 17550 -54 37 39 32 21 29 40 42 47 46 52 82 118 190 200 136 133 17255 -59 28 31 38 29 35 42 43 43 41 46 89 84 121 195 205 140 13660 -64 22 32 23 16 23 31 33 50 57 56 94 91 87 124 199 211 14465 -69 13 15 17 12 18 24 34 29 31 38 67 94 93 87 126 205 21570 -74 14 17 13 12 13 16 16 21 23 27 52 68 97 94 90 130 20875 -79 12 13 15 10 15 16 17 18 21 18 33 53 70 100 97 91 13180 -84 6 7 7 5 8 13 13 18 20 21 35 33 53 70 99 97 9185 &up 11 13 13 8 10 16 19 21 24 29 53 69 86 116 149 207 253
Totals 656 769 726 502 670 850 944 1,063 1,127 1,196 2,102 2,339 2,614 2,918 3,274 3,706 4,157
Version 2021.0 A-45
D R A F T
10-19
-21

Delaware Population Consortium
Population Projection Series
October 31, 2021
City of WilmingtonHispanic Population
[As of July 1]
2010 2011 2012 2013 2014 2015 2016 2017 2018 2019 2020 2025 2030 2035 2040 2045 2050
0 - 4 940 904 1,003 984 1,064 1,026 932 810 858 905 929 883 900 960 990 980 956
5 - 9 870 906 1,019 962 1,003 974 870 758 829 898 935 884 838 853 910 940 931
10 -14 718 728 853 869 955 905 872 772 810 849 890 888 838 798 812 867 891
15 -19 659 648 682 663 720 748 701 647 732 807 826 847 845 796 757 773 821
20 -24 715 670 746 716 750 683 626 516 558 608 680 783 802 801 755 719 733
25 -29 836 816 835 776 781 741 641 566 602 631 622 643 743 761 760 718 682
30 -34 700 741 879 872 962 866 782 632 651 658 675 590 610 703 722 721 679
35 -39 580 566 625 632 690 726 710 663 733 811 787 637 556 577 666 682 680
40 -44 529 532 602 558 613 599 540 470 526 579 657 743 602 525 544 630 643
45 -49 465 460 538 533 561 542 509 452 464 513 541 619 701 566 495 515 592
50 -54 329 345 399 404 455 477 436 402 442 469 491 509 579 656 532 463 481
55 -59 289 297 341 330 348 336 325 297 333 378 427 456 474 539 611 495 433
60 -64 203 206 230 251 287 291 278 251 269 284 297 393 419 434 495 559 456
65 -69 140 139 169 169 196 201 192 167 202 230 251 268 357 379 392 449 506
70 -74 108 119 132 125 128 136 124 119 133 152 167 221 235 315 333 345 396
75 -79 59 63 85 91 103 100 101 88 95 96 109 142 187 198 264 284 290
80 -84 49 47 51 43 54 49 53 53 66 73 76 87 110 147 155 209 223
85 &up 39 38 46 45 51 59 53 46 50 59 65 86 102 128 164 191 239
Totals 8,228 8,225 9,235 9,023 9,721 9,459 8,745 7,709 8,353 9,000 9,425 9,679 9,898 10,136 10,357 10,540 10,632
Version 2021.0 A-46
D R A F T
10-19
-21

Delaware Population Consortium
Population Projection Series
October 31, 2021
City of WilmingtonHispanic Population
[As of July 1]
2010 2011 2012 2013 2014 2015 2016 2017 2018 2019 2020 2025 2030 2035 2040 2045 2050
MALES
0 - 4 477 459 510 504 540 519 472 410 435 458 470 447 456 486 501 497 4845 - 9 444 454 525 485 509 494 442 384 424 456 473 447 424 432 460 475 471
10 -14 362 381 429 441 494 462 437 396 410 431 451 449 424 404 411 439 45115 -19 353 334 345 336 361 377 367 326 371 418 422 430 427 403 383 391 41520 -24 365 349 400 391 401 364 322 259 282 304 343 399 406 404 382 363 37025 -29 454 438 436 391 404 378 333 303 327 337 332 323 378 386 383 362 34430 -34 357 379 474 492 518 469 419 329 327 340 343 314 307 357 365 363 34235 -39 311 303 327 309 346 369 363 357 412 436 425 324 295 289 338 343 34240 -44 252 255 289 288 322 321 288 245 257 290 333 400 305 279 272 318 32445 -49 236 248 286 264 270 258 243 216 238 269 289 313 376 286 262 256 29950 -54 172 163 193 205 238 242 235 213 217 225 231 270 292 351 268 244 23955 -59 155 153 176 160 176 174 154 143 168 196 215 214 251 270 326 248 22760 -64 108 118 126 141 152 155 143 129 129 142 154 197 195 228 246 296 22765 -69 62 59 78 80 101 106 109 91 113 120 133 137 177 175 205 221 26570 -74 51 59 61 58 51 59 51 54 62 77 87 114 118 154 150 176 19275 -79 22 22 34 36 47 44 49 40 43 38 46 71 95 96 125 124 14580 -84 22 20 23 19 19 17 18 20 25 33 33 35 54 72 73 95 9385 &up 16 15 18 17 21 24 20 19 21 20 22 32 36 52 70 81 98Totals 4,219 4,209 4,730 4,617 4,970 4,832 4,465 3,934 4,261 4,590 4,802 4,916 5,016 5,124 5,220 5,292 5,328
FEMALES
0 - 4 463 445 493 480 524 507 460 400 423 447 459 436 444 474 489 483 4725 - 9 426 452 494 477 494 480 428 374 405 442 462 437 414 421 450 465 460
10 -14 356 347 424 428 461 443 435 376 400 418 439 439 414 394 401 428 44015 -19 306 314 337 327 359 371 334 321 361 389 404 417 418 393 374 382 40620 -24 350 321 346 325 349 319 304 257 276 304 337 384 396 397 373 356 36325 -29 382 378 399 385 377 363 308 263 275 294 290 320 365 375 377 356 33830 -34 343 362 405 380 444 397 363 303 324 318 332 276 303 346 357 358 33735 -39 269 263 298 323 344 357 347 306 321 375 362 313 261 288 328 339 33840 -44 277 277 313 270 291 278 252 225 269 289 324 343 297 246 272 312 31945 -49 229 212 252 269 291 284 266 236 226 244 252 306 325 280 233 259 29350 -54 157 182 206 199 217 235 201 189 225 244 260 239 287 305 264 219 24255 -59 134 144 165 170 172 162 171 154 165 182 212 242 223 269 285 247 20660 -64 95 88 104 110 135 136 135 122 140 142 143 196 224 206 249 263 22965 -69 78 80 91 89 95 95 83 76 89 110 118 131 180 204 187 228 24170 -74 57 60 71 67 77 77 73 65 71 75 80 107 117 161 183 169 20475 -79 37 41 51 55 56 56 52 48 52 58 63 71 92 102 139 160 14580 -84 27 27 28 24 35 32 35 33 41 40 43 52 56 75 82 114 13085 &up 23 23 28 28 30 35 33 27 29 39 43 54 66 76 94 110 141
Totals 4,009 4,016 4,505 4,406 4,751 4,627 4,280 3,775 4,092 4,410 4,623 4,763 4,882 5,012 5,137 5,248 5,304
Version 2021.0 A-47
D R A F T
10-19
-21

Population Projection Series
October 31, 2021
Sussex CountyTotal Population[As of July 1]
2010 2015 2020 2025 2030 2035 2040 2045 2050
Population 197,892 214,480 238,496 256,194 272,266 285,286 295,311 302,436 307,544
Households 75,716 81,835 92,236 100,732 108,371 114,107 117,961 120,051 121,177
Population Change* 16,588 24,016 17,698 16,072 13,020 10,025 7,125 5,108
Births* 11,114 11,459 11,599 12,316 13,025 13,432 13,495 13,553
Deaths* 11,665 13,005 14,996 17,528 19,840 21,588 22,529 22,807
Net Migration* 17,139 25,562 21,095 21,284 19,835 18,181 16,159 14,362
Household Change* 6,119 10,401 8,496 7,639 5,736 3,854 2,090 1,126
Total Labor Force 94,626 103,793 113,897 119,391 124,857 129,481 133,462 136,879 139,998
Civilian 94,462 103,629 113,733 119,227 124,693 129,317 133,298 136,715 139,834
Employed 87,151 98,421 109,184 114,458 119,705 124,144 127,966 131,246 134,241
Private 67,423 76,142 84,469 88,549 92,608 96,043 98,999 101,537 103,855
Government 12,558 14,182 15,733 16,493 17,249 17,888 18,439 18,912 19,343
Self-Employed 6,992 7,896 8,759 9,182 9,603 9,959 10,266 10,529 10,769
Unpaid Family 178 201 223 234 245 254 262 268 274
Unemployed 7,311 5,208 4,549 4,769 4,988 5,173 5,332 5,469 5,593
Military 164 164 164 164 164 164 164 164 164
Jobs by Place of Work 75,368 80,505 90,010 94,358 98,684 102,344 105,494 108,198 110,668
Jobs by Residence 87,151 98,421 109,183 114,458 119,704 124,144 127,966 131,245 134,242
Net Commuting -11,783 -17,916 -19,173 -20,100 -21,020 -21,800 -22,472 -23,047 -23,574
*Represents a five-year total beginning with specified year
Version 2021.0 A-48
D R A F T
10-19
-21
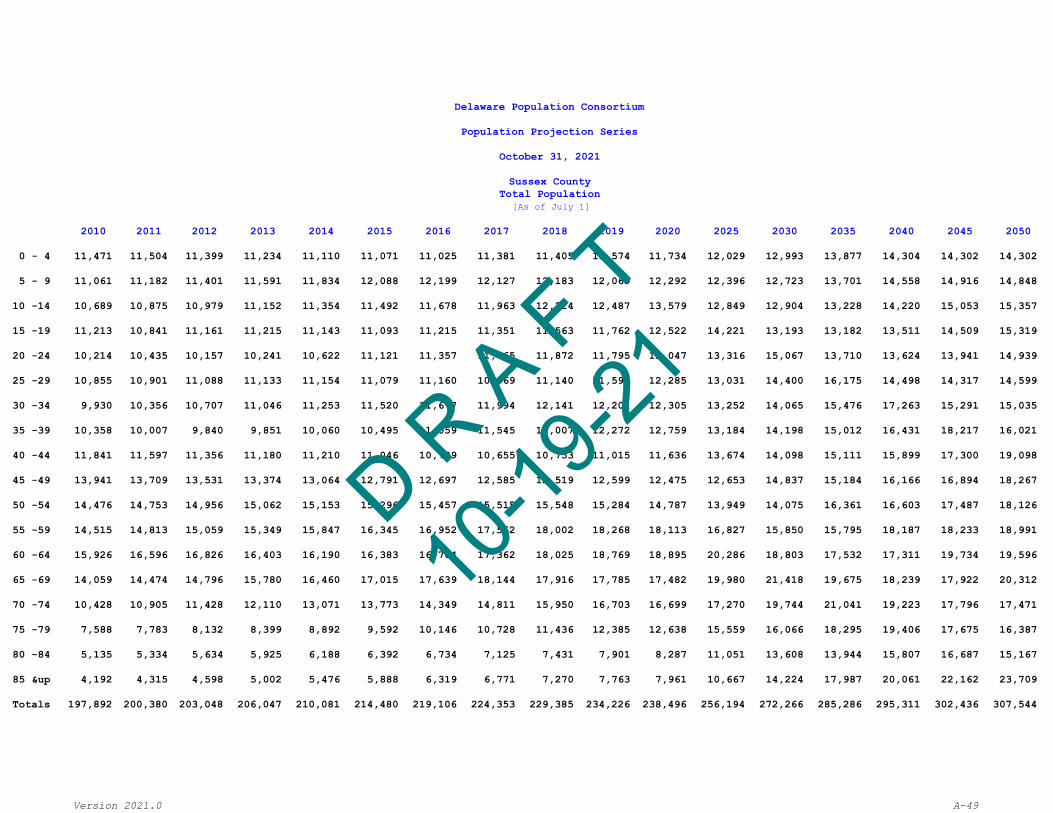
Delaware Population Consortium
Population Projection Series
October 31, 2021
Sussex CountyTotal Population
[As of July 1]
2010 2011 2012 2013 2014 2015 2016 2017 2018 2019 2020 2025 2030 2035 2040 2045 2050
0 - 4 11,471 11,504 11,399 11,234 11,110 11,071 11,025 11,381 11,405 11,574 11,734 12,029 12,993 13,877 14,304 14,302 14,302
5 - 9 11,061 11,182 11,401 11,591 11,834 12,088 12,199 12,127 12,183 12,069 12,292 12,396 12,723 13,701 14,558 14,916 14,848
10 -14 10,689 10,875 10,979 11,152 11,354 11,492 11,678 11,963 12,224 12,487 13,579 12,849 12,904 13,228 14,220 15,053 15,357
15 -19 11,213 10,841 11,161 11,215 11,143 11,093 11,215 11,351 11,563 11,762 12,522 14,221 13,193 13,182 13,511 14,509 15,319
20 -24 10,214 10,435 10,157 10,241 10,622 11,121 11,357 11,765 11,872 11,795 12,047 13,316 15,067 13,710 13,624 13,941 14,939
25 -29 10,855 10,901 11,088 11,133 11,154 11,079 11,160 10,969 11,140 11,591 12,285 13,031 14,400 16,175 14,498 14,317 14,599
30 -34 9,930 10,356 10,707 11,046 11,253 11,520 11,677 11,994 12,141 12,204 12,305 13,252 14,065 15,476 17,263 15,291 15,035
35 -39 10,358 10,007 9,840 9,851 10,060 10,495 11,059 11,545 12,007 12,272 12,759 13,184 14,198 15,012 16,431 18,217 16,021
40 -44 11,841 11,597 11,356 11,180 11,210 11,046 10,739 10,655 10,753 11,015 11,636 13,674 14,098 15,111 15,899 17,300 19,098
45 -49 13,941 13,709 13,531 13,374 13,064 12,791 12,697 12,585 12,519 12,599 12,475 12,653 14,837 15,184 16,166 16,894 18,267
50 -54 14,476 14,753 14,956 15,062 15,153 15,296 15,457 15,515 15,548 15,284 14,787 13,949 14,075 16,361 16,603 17,487 18,126
55 -59 14,515 14,813 15,059 15,349 15,847 16,345 16,952 17,562 18,002 18,268 18,113 16,827 15,850 15,795 18,187 18,233 18,991
60 -64 15,926 16,596 16,826 16,403 16,190 16,383 16,704 17,362 18,025 18,769 18,895 20,286 18,803 17,532 17,311 19,734 19,596
65 -69 14,059 14,474 14,796 15,780 16,460 17,015 17,639 18,144 17,916 17,785 17,482 19,980 21,418 19,675 18,239 17,922 20,312
70 -74 10,428 10,905 11,428 12,110 13,071 13,773 14,349 14,811 15,950 16,703 16,699 17,270 19,744 21,041 19,223 17,796 17,471
75 -79 7,588 7,783 8,132 8,399 8,892 9,592 10,146 10,728 11,436 12,385 12,638 15,559 16,066 18,295 19,406 17,675 16,387
80 -84 5,135 5,334 5,634 5,925 6,188 6,392 6,734 7,125 7,431 7,901 8,287 11,051 13,608 13,944 15,807 16,687 15,167
85 &up 4,192 4,315 4,598 5,002 5,476 5,888 6,319 6,771 7,270 7,763 7,961 10,667 14,224 17,987 20,061 22,162 23,709
Totals 197,892 200,380 203,048 206,047 210,081 214,480 219,106 224,353 229,385 234,226 238,496 256,194 272,266 285,286 295,311 302,436 307,544
Version 2021.0 A-49
D R A F T
10-19
-21

Delaware Population Consortium
Population Projection Series
October 31, 2021
Sussex CountyTotal Population
[As of July 1]
2010 2011 2012 2013 2014 2015 2016 2017 2018 2019 2020 2025 2030 2035 2040 2045 2050
MALES
0 - 4 5,841 5,840 5,799 5,633 5,552 5,535 5,490 5,777 5,788 5,875 5,955 6,105 6,593 7,042 7,256 7,258 7,2565 - 9 5,690 5,707 5,815 5,879 6,044 6,156 6,199 6,184 6,211 6,144 6,239 6,305 6,470 6,967 7,401 7,581 7,544
10 -14 5,403 5,490 5,543 5,710 5,781 5,879 5,970 6,116 6,216 6,399 6,931 6,540 6,581 6,745 7,249 7,669 7,81815 -19 5,787 5,559 5,652 5,610 5,580 5,608 5,650 5,719 5,908 5,980 6,364 7,273 6,709 6,718 6,889 7,396 7,80420 -24 5,238 5,378 5,280 5,341 5,527 5,704 5,780 5,910 5,888 5,854 6,024 6,726 7,680 6,936 6,910 7,074 7,58325 -29 5,566 5,583 5,679 5,724 5,696 5,651 5,720 5,664 5,774 5,996 6,264 6,489 7,246 8,231 7,311 7,238 7,38830 -34 5,037 5,282 5,488 5,622 5,754 5,854 5,958 6,124 6,224 6,214 6,282 6,748 7,003 7,784 8,788 7,705 7,59735 -39 5,119 4,919 4,837 4,845 4,965 5,270 5,625 5,902 6,097 6,260 6,479 6,720 7,219 7,467 8,258 9,271 8,06240 -44 5,868 5,710 5,584 5,522 5,547 5,445 5,243 5,198 5,250 5,401 5,833 6,910 7,152 7,652 7,881 8,669 9,69345 -49 6,830 6,742 6,690 6,580 6,434 6,262 6,189 6,119 6,108 6,154 6,097 6,288 7,432 7,639 8,125 8,320 9,10550 -54 6,945 7,004 7,069 7,232 7,314 7,425 7,528 7,598 7,578 7,455 7,181 6,757 6,934 8,131 8,291 8,727 8,86855 -59 6,777 6,937 7,078 7,219 7,471 7,722 8,043 8,307 8,652 8,836 8,813 8,171 7,672 7,771 9,033 9,093 9,45260 -64 7,518 7,789 7,890 7,618 7,569 7,717 7,881 8,241 8,576 8,964 9,054 9,957 9,212 8,546 8,573 9,861 9,81865 -69 6,698 6,893 7,035 7,518 7,748 7,991 8,307 8,559 8,395 8,391 8,330 9,620 10,560 9,669 8,913 8,901 10,16870 -74 5,022 5,238 5,450 5,751 6,185 6,493 6,754 6,976 7,544 7,815 7,804 8,151 9,419 10,275 9,349 8,609 8,59975 -79 3,629 3,698 3,839 3,949 4,187 4,505 4,732 4,973 5,282 5,708 5,808 7,086 7,394 8,512 9,251 8,386 7,74680 -84 2,313 2,433 2,597 2,771 2,878 2,944 3,076 3,238 3,365 3,586 3,764 4,900 5,979 6,193 7,098 7,686 6,95285 &up 1,381 1,442 1,576 1,711 1,933 2,142 2,370 2,585 2,802 3,010 3,097 4,214 5,555 6,901 7,615 8,482 9,285Totals 96,662 97,644 98,901 100,235 102,165 104,303 106,515 109,190 111,658 114,042 116,319 124,960 132,810 139,179 144,191 147,926 150,738
FEMALES
0 - 4 5,630 5,664 5,600 5,601 5,558 5,536 5,535 5,604 5,617 5,699 5,779 5,924 6,400 6,835 7,048 7,044 7,0465 - 9 5,371 5,475 5,586 5,712 5,790 5,932 6,000 5,943 5,972 5,925 6,053 6,091 6,253 6,734 7,157 7,335 7,304
10 -14 5,286 5,385 5,436 5,442 5,573 5,613 5,708 5,847 6,008 6,088 6,648 6,309 6,323 6,483 6,971 7,384 7,53915 -19 5,426 5,282 5,509 5,605 5,563 5,485 5,565 5,632 5,655 5,782 6,158 6,948 6,484 6,464 6,622 7,113 7,51520 -24 4,976 5,057 4,877 4,900 5,095 5,417 5,577 5,855 5,984 5,941 6,023 6,590 7,387 6,774 6,714 6,867 7,35625 -29 5,289 5,318 5,409 5,409 5,458 5,428 5,440 5,305 5,366 5,595 6,021 6,542 7,154 7,944 7,187 7,079 7,21130 -34 4,893 5,074 5,219 5,424 5,499 5,666 5,719 5,870 5,917 5,990 6,023 6,504 7,062 7,692 8,475 7,586 7,43835 -39 5,239 5,088 5,003 5,006 5,095 5,225 5,434 5,643 5,910 6,012 6,280 6,464 6,979 7,545 8,173 8,946 7,95940 -44 5,973 5,887 5,772 5,658 5,663 5,601 5,496 5,457 5,503 5,614 5,803 6,764 6,946 7,459 8,018 8,631 9,40545 -49 7,111 6,967 6,841 6,794 6,630 6,529 6,508 6,466 6,411 6,445 6,378 6,365 7,405 7,545 8,041 8,574 9,16250 -54 7,531 7,749 7,887 7,830 7,839 7,871 7,929 7,917 7,970 7,829 7,606 7,192 7,141 8,230 8,312 8,760 9,25855 -59 7,738 7,876 7,981 8,130 8,376 8,623 8,909 9,255 9,350 9,432 9,300 8,656 8,178 8,024 9,154 9,140 9,53960 -64 8,408 8,807 8,936 8,785 8,621 8,666 8,823 9,121 9,449 9,805 9,841 10,329 9,591 8,986 8,738 9,873 9,77865 -69 7,361 7,581 7,761 8,262 8,712 9,024 9,332 9,585 9,521 9,394 9,152 10,360 10,858 10,006 9,326 9,021 10,14470 -74 5,406 5,667 5,978 6,359 6,886 7,280 7,595 7,835 8,406 8,888 8,895 9,119 10,325 10,766 9,874 9,187 8,87275 -79 3,959 4,085 4,293 4,450 4,705 5,087 5,414 5,755 6,154 6,677 6,830 8,473 8,672 9,783 10,155 9,289 8,64180 -84 2,822 2,901 3,037 3,154 3,310 3,448 3,658 3,887 4,066 4,315 4,523 6,151 7,629 7,751 8,709 9,001 8,21585 &up 2,811 2,873 3,022 3,291 3,543 3,746 3,949 4,186 4,468 4,753 4,864 6,453 8,669 11,086 12,446 13,680 14,424
Totals 101,230 102,736 104,147 105,812 107,916 110,177 112,591 115,163 117,727 120,184 122,177 131,234 139,456 146,107 151,120 154,510 156,806
Version 2021.0 A-50
D R A F T
10-19
-21

Delaware Population Consortium
Population Projection Series
October 31, 2021
Sussex CountyWhite Alone Non-Hispanic Population
[As of July 1]
2010 2011 2012 2013 2014 2015 2016 2017 2018 2019 2020 2025 2030 2035 2040 2045 2050
0 - 4 6,176 6,157 6,125 5,780 5,878 5,979 6,090 6,658 6,745 6,972 6,825 6,986 6,994 6,981 7,115 7,362 7,551
5 - 9 6,509 6,408 6,367 6,453 6,497 6,549 6,609 6,627 6,769 6,840 6,615 7,212 7,386 7,358 7,315 7,420 7,653
10 -14 6,839 6,874 6,851 6,822 6,812 6,775 6,746 6,741 6,857 6,902 6,633 6,876 7,500 7,653 7,603 7,535 7,628
15 -19 7,371 7,118 7,388 7,366 7,230 7,153 7,084 7,066 7,035 7,007 6,634 6,733 6,982 7,605 7,749 7,690 7,614
20 -24 6,456 6,688 6,493 6,632 6,979 7,366 7,519 7,852 7,850 7,703 7,257 6,891 6,990 7,228 7,846 7,972 7,887
25 -29 6,871 6,890 7,019 7,103 7,121 7,083 7,300 7,161 7,370 7,772 7,836 7,794 7,401 7,463 7,673 8,280 8,372
30 -34 6,442 6,746 7,001 7,172 7,288 7,462 7,553 7,785 7,948 7,992 7,597 8,461 8,415 7,943 7,961 8,131 8,735
35 -39 7,197 6,830 6,613 6,548 6,707 6,996 7,371 7,738 7,995 8,152 7,971 8,179 9,112 9,008 8,449 8,417 8,555
40 -44 8,736 8,473 8,234 8,080 7,953 7,797 7,500 7,351 7,343 7,543 7,517 8,613 8,841 9,780 9,610 8,952 8,875
45 -49 10,988 10,659 10,417 10,234 9,932 9,661 9,514 9,390 9,327 9,231 8,661 8,292 9,508 9,679 10,616 10,351 9,578
50 -54 11,808 11,991 12,106 12,096 12,153 12,225 12,359 12,337 12,332 12,066 11,263 9,881 9,443 10,715 10,797 11,701 11,315
55 -59 12,388 12,562 12,723 12,959 13,340 13,754 14,184 14,697 15,007 15,235 14,735 13,126 11,515 10,856 12,160 12,090 12,965
60 -64 14,230 14,795 14,948 14,447 14,137 14,244 14,489 15,048 15,652 16,288 16,151 16,815 14,966 12,962 12,094 13,367 13,157
65 -69 12,780 13,137 13,413 14,367 14,936 15,381 15,922 16,344 16,039 15,822 15,314 17,268 17,962 15,819 13,577 12,592 13,804
70 -74 9,525 9,922 10,385 10,962 11,892 12,550 13,111 13,524 14,634 15,286 15,068 15,199 17,146 17,709 15,484 13,217 12,231
75 -79 6,927 7,121 7,450 7,702 8,148 8,798 9,279 9,804 10,417 11,341 11,465 14,071 14,176 15,914 16,332 14,194 12,077
80 -84 4,692 4,874 5,163 5,441 5,655 5,853 6,186 6,554 6,845 7,275 7,545 10,037 12,319 12,311 13,734 13,985 12,071
85 &up 3,787 3,902 4,160 4,521 4,975 5,356 5,747 6,172 6,636 7,088 7,185 9,607 12,774 16,103 17,654 19,095 19,716
Totals 149,722 151,147 152,856 154,685 157,633 160,982 164,563 168,849 172,801 176,515 172,272 182,041 189,430 193,087 193,769 192,351 189,784
Version 2021.0 A-51
D R A F T
10-19
-21
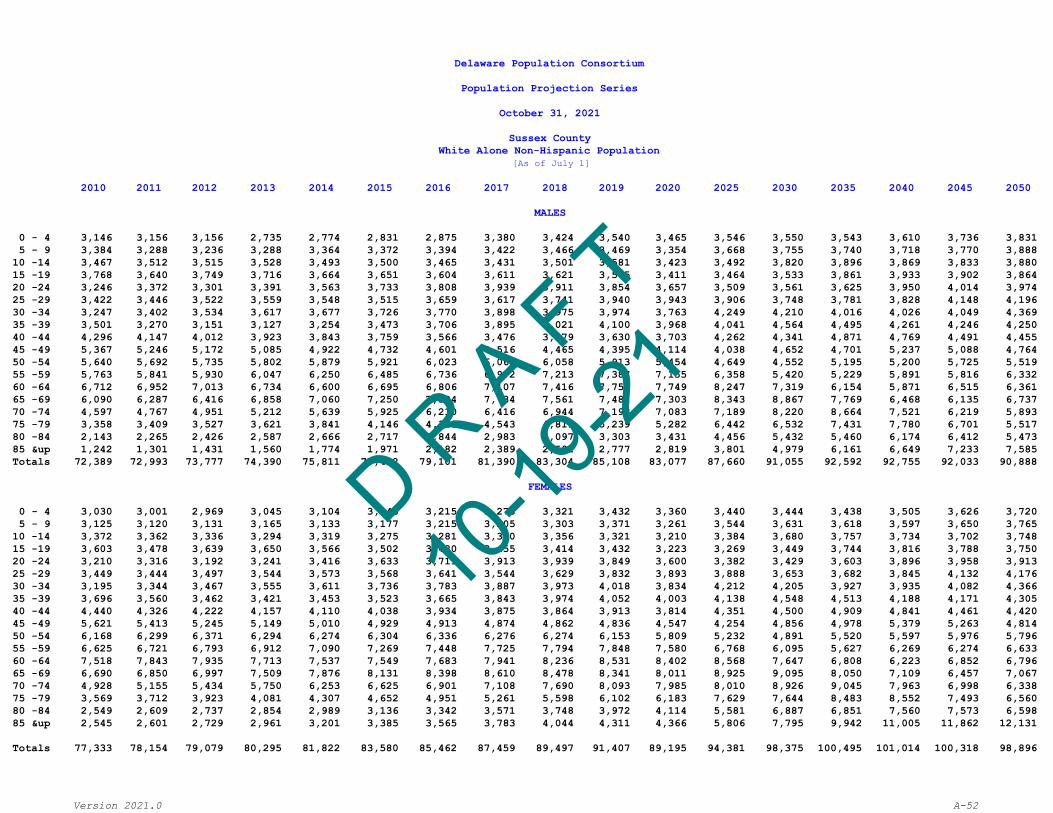
Delaware Population Consortium
Population Projection Series
October 31, 2021
Sussex CountyWhite Alone Non-Hispanic Population
[As of July 1]
2010 2011 2012 2013 2014 2015 2016 2017 2018 2019 2020 2025 2030 2035 2040 2045 2050
MALES
0 - 4 3,146 3,156 3,156 2,735 2,774 2,831 2,875 3,380 3,424 3,540 3,465 3,546 3,550 3,543 3,610 3,736 3,8315 - 9 3,384 3,288 3,236 3,288 3,364 3,372 3,394 3,422 3,466 3,469 3,354 3,668 3,755 3,740 3,718 3,770 3,888
10 -14 3,467 3,512 3,515 3,528 3,493 3,500 3,465 3,431 3,501 3,581 3,423 3,492 3,820 3,896 3,869 3,833 3,88015 -19 3,768 3,640 3,749 3,716 3,664 3,651 3,604 3,611 3,621 3,575 3,411 3,464 3,533 3,861 3,933 3,902 3,86420 -24 3,246 3,372 3,301 3,391 3,563 3,733 3,808 3,939 3,911 3,854 3,657 3,509 3,561 3,625 3,950 4,014 3,97425 -29 3,422 3,446 3,522 3,559 3,548 3,515 3,659 3,617 3,741 3,940 3,943 3,906 3,748 3,781 3,828 4,148 4,19630 -34 3,247 3,402 3,534 3,617 3,677 3,726 3,770 3,898 3,975 3,974 3,763 4,249 4,210 4,016 4,026 4,049 4,36935 -39 3,501 3,270 3,151 3,127 3,254 3,473 3,706 3,895 4,021 4,100 3,968 4,041 4,564 4,495 4,261 4,246 4,25040 -44 4,296 4,147 4,012 3,923 3,843 3,759 3,566 3,476 3,479 3,630 3,703 4,262 4,341 4,871 4,769 4,491 4,45545 -49 5,367 5,246 5,172 5,085 4,922 4,732 4,601 4,516 4,465 4,395 4,114 4,038 4,652 4,701 5,237 5,088 4,76450 -54 5,640 5,692 5,735 5,802 5,879 5,921 6,023 6,061 6,058 5,913 5,454 4,649 4,552 5,195 5,200 5,725 5,51955 -59 5,763 5,841 5,930 6,047 6,250 6,485 6,736 6,972 7,213 7,387 7,155 6,358 5,420 5,229 5,891 5,816 6,33260 -64 6,712 6,952 7,013 6,734 6,600 6,695 6,806 7,107 7,416 7,757 7,749 8,247 7,319 6,154 5,871 6,515 6,36165 -69 6,090 6,287 6,416 6,858 7,060 7,250 7,524 7,734 7,561 7,481 7,303 8,343 8,867 7,769 6,468 6,135 6,73770 -74 4,597 4,767 4,951 5,212 5,639 5,925 6,210 6,416 6,944 7,193 7,083 7,189 8,220 8,664 7,521 6,219 5,89375 -79 3,358 3,409 3,527 3,621 3,841 4,146 4,328 4,543 4,819 5,239 5,282 6,442 6,532 7,431 7,780 6,701 5,51780 -84 2,143 2,265 2,426 2,587 2,666 2,717 2,844 2,983 3,097 3,303 3,431 4,456 5,432 5,460 6,174 6,412 5,47385 &up 1,242 1,301 1,431 1,560 1,774 1,971 2,182 2,389 2,592 2,777 2,819 3,801 4,979 6,161 6,649 7,233 7,585Totals 72,389 72,993 73,777 74,390 75,811 77,402 79,101 81,390 83,304 85,108 83,077 87,660 91,055 92,592 92,755 92,033 90,888
FEMALES
0 - 4 3,030 3,001 2,969 3,045 3,104 3,148 3,215 3,278 3,321 3,432 3,360 3,440 3,444 3,438 3,505 3,626 3,7205 - 9 3,125 3,120 3,131 3,165 3,133 3,177 3,215 3,205 3,303 3,371 3,261 3,544 3,631 3,618 3,597 3,650 3,765
10 -14 3,372 3,362 3,336 3,294 3,319 3,275 3,281 3,310 3,356 3,321 3,210 3,384 3,680 3,757 3,734 3,702 3,74815 -19 3,603 3,478 3,639 3,650 3,566 3,502 3,480 3,455 3,414 3,432 3,223 3,269 3,449 3,744 3,816 3,788 3,75020 -24 3,210 3,316 3,192 3,241 3,416 3,633 3,711 3,913 3,939 3,849 3,600 3,382 3,429 3,603 3,896 3,958 3,91325 -29 3,449 3,444 3,497 3,544 3,573 3,568 3,641 3,544 3,629 3,832 3,893 3,888 3,653 3,682 3,845 4,132 4,17630 -34 3,195 3,344 3,467 3,555 3,611 3,736 3,783 3,887 3,973 4,018 3,834 4,212 4,205 3,927 3,935 4,082 4,36635 -39 3,696 3,560 3,462 3,421 3,453 3,523 3,665 3,843 3,974 4,052 4,003 4,138 4,548 4,513 4,188 4,171 4,30540 -44 4,440 4,326 4,222 4,157 4,110 4,038 3,934 3,875 3,864 3,913 3,814 4,351 4,500 4,909 4,841 4,461 4,42045 -49 5,621 5,413 5,245 5,149 5,010 4,929 4,913 4,874 4,862 4,836 4,547 4,254 4,856 4,978 5,379 5,263 4,81450 -54 6,168 6,299 6,371 6,294 6,274 6,304 6,336 6,276 6,274 6,153 5,809 5,232 4,891 5,520 5,597 5,976 5,79655 -59 6,625 6,721 6,793 6,912 7,090 7,269 7,448 7,725 7,794 7,848 7,580 6,768 6,095 5,627 6,269 6,274 6,63360 -64 7,518 7,843 7,935 7,713 7,537 7,549 7,683 7,941 8,236 8,531 8,402 8,568 7,647 6,808 6,223 6,852 6,79665 -69 6,690 6,850 6,997 7,509 7,876 8,131 8,398 8,610 8,478 8,341 8,011 8,925 9,095 8,050 7,109 6,457 7,06770 -74 4,928 5,155 5,434 5,750 6,253 6,625 6,901 7,108 7,690 8,093 7,985 8,010 8,926 9,045 7,963 6,998 6,33875 -79 3,569 3,712 3,923 4,081 4,307 4,652 4,951 5,261 5,598 6,102 6,183 7,629 7,644 8,483 8,552 7,493 6,56080 -84 2,549 2,609 2,737 2,854 2,989 3,136 3,342 3,571 3,748 3,972 4,114 5,581 6,887 6,851 7,560 7,573 6,59885 &up 2,545 2,601 2,729 2,961 3,201 3,385 3,565 3,783 4,044 4,311 4,366 5,806 7,795 9,942 11,005 11,862 12,131
Totals 77,333 78,154 79,079 80,295 81,822 83,580 85,462 87,459 89,497 91,407 89,195 94,381 98,375 100,495 101,014 100,318 98,896
Version 2021.0 A-52
D R A F T
10-19
-21

Delaware Population Consortium
Population Projection Series
October 31, 2021
Sussex CountyBlack Alone Non-Hispanic Population
[As of July 1]
2010 2011 2012 2013 2014 2015 2016 2017 2018 2019 2020 2025 2030 2035 2040 2045 2050
0 - 4 1,965 1,946 1,991 2,057 2,055 2,110 2,123 2,108 2,166 2,185 1,977 1,983 2,005 2,084 2,182 2,262 2,310
5 - 9 1,856 1,878 1,894 1,897 1,946 1,970 1,979 2,027 2,028 2,060 1,888 1,982 1,988 2,011 2,089 2,187 2,267
10 -14 1,838 1,882 1,897 1,895 1,882 1,886 1,912 1,932 1,924 1,963 1,780 1,896 1,988 1,995 2,020 2,099 2,195
15 -19 2,079 1,962 1,938 1,945 1,949 1,918 1,905 1,923 1,912 1,890 1,696 1,778 1,893 1,987 1,993 2,016 2,095
20 -24 1,737 1,839 1,838 1,858 1,901 1,981 1,980 1,961 1,955 1,951 1,719 1,688 1,770 1,885 1,979 1,984 2,010
25 -29 1,639 1,659 1,701 1,751 1,795 1,845 1,867 1,870 1,880 1,915 1,788 1,721 1,692 1,774 1,888 1,982 1,987
30 -34 1,447 1,530 1,593 1,659 1,673 1,677 1,687 1,733 1,773 1,810 1,666 1,790 1,726 1,695 1,780 1,892 1,989
35 -39 1,397 1,330 1,293 1,306 1,373 1,464 1,552 1,618 1,679 1,686 1,511 1,669 1,792 1,729 1,699 1,781 1,894
40 -44 1,753 1,697 1,636 1,529 1,471 1,408 1,343 1,308 1,316 1,375 1,316 1,507 1,664 1,788 1,724 1,692 1,775
45 -49 1,874 1,879 1,865 1,866 1,817 1,757 1,707 1,646 1,531 1,464 1,258 1,303 1,493 1,648 1,770 1,707 1,677
50 -54 1,857 1,887 1,905 1,944 1,920 1,909 1,869 1,857 1,850 1,796 1,553 1,234 1,280 1,464 1,618 1,738 1,676
55 -59 1,516 1,584 1,629 1,636 1,698 1,749 1,844 1,865 1,893 1,860 1,658 1,495 1,188 1,234 1,411 1,558 1,673
60 -64 1,189 1,267 1,329 1,387 1,444 1,492 1,514 1,564 1,564 1,614 1,491 1,568 1,415 1,123 1,168 1,332 1,472
65 -69 906 932 954 971 1,054 1,135 1,177 1,240 1,288 1,334 1,235 1,366 1,439 1,300 1,031 1,073 1,223
70 -74 599 661 707 782 806 829 841 865 876 948 915 1,103 1,222 1,285 1,161 920 960
75 -79 475 442 433 437 470 515 569 610 671 690 634 781 943 1,044 1,093 988 780
80 -84 335 336 337 343 369 354 346 343 344 368 364 495 613 738 817 854 773
85 &up 319 319 332 356 361 379 406 416 426 437 390 446 563 706 876 1,008 1,096
Totals 24,781 25,030 25,272 25,619 25,984 26,378 26,621 26,886 27,076 27,346 24,839 25,805 26,674 27,490 28,299 29,073 29,852
Version 2021.0 A-53
D R A F T
10-19
-21
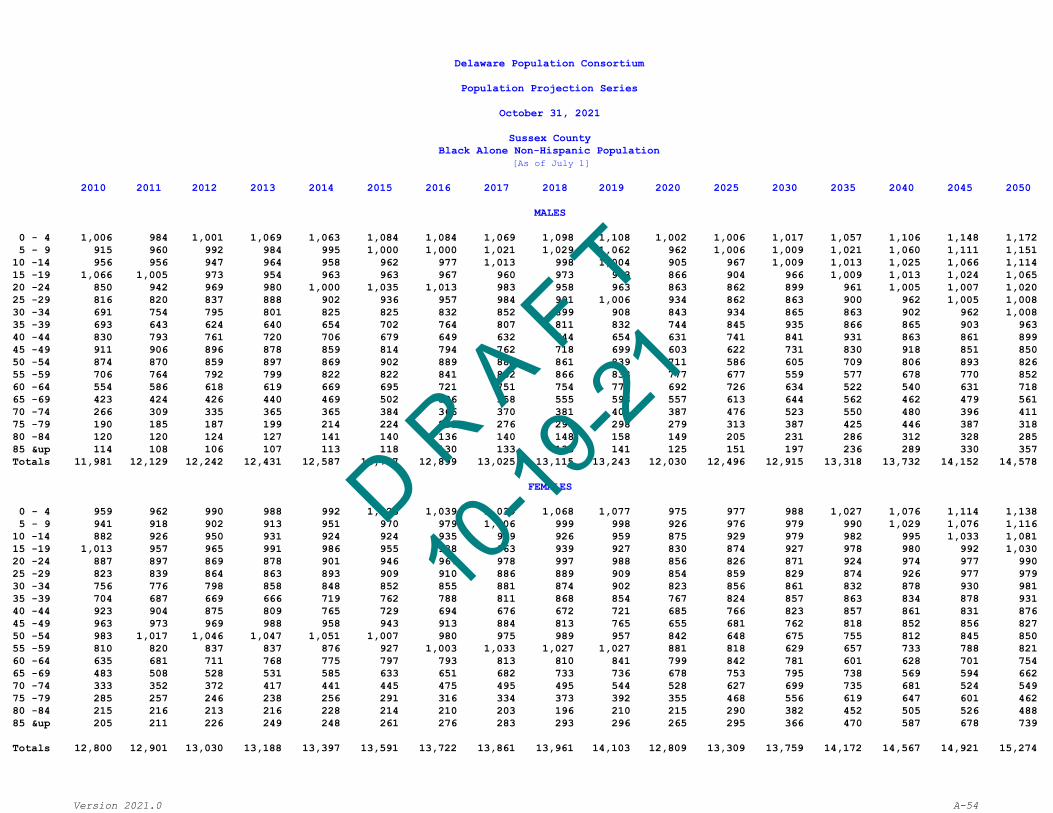
Delaware Population Consortium
Population Projection Series
October 31, 2021
Sussex CountyBlack Alone Non-Hispanic Population
[As of July 1]
2010 2011 2012 2013 2014 2015 2016 2017 2018 2019 2020 2025 2030 2035 2040 2045 2050
MALES
0 - 4 1,006 984 1,001 1,069 1,063 1,084 1,084 1,069 1,098 1,108 1,002 1,006 1,017 1,057 1,106 1,148 1,1725 - 9 915 960 992 984 995 1,000 1,000 1,021 1,029 1,062 962 1,006 1,009 1,021 1,060 1,111 1,151
10 -14 956 956 947 964 958 962 977 1,013 998 1,004 905 967 1,009 1,013 1,025 1,066 1,11415 -19 1,066 1,005 973 954 963 963 967 960 973 963 866 904 966 1,009 1,013 1,024 1,06520 -24 850 942 969 980 1,000 1,035 1,013 983 958 963 863 862 899 961 1,005 1,007 1,02025 -29 816 820 837 888 902 936 957 984 991 1,006 934 862 863 900 962 1,005 1,00830 -34 691 754 795 801 825 825 832 852 899 908 843 934 865 863 902 962 1,00835 -39 693 643 624 640 654 702 764 807 811 832 744 845 935 866 865 903 96340 -44 830 793 761 720 706 679 649 632 644 654 631 741 841 931 863 861 89945 -49 911 906 896 878 859 814 794 762 718 699 603 622 731 830 918 851 85050 -54 874 870 859 897 869 902 889 882 861 839 711 586 605 709 806 893 82655 -59 706 764 792 799 822 822 841 832 866 833 777 677 559 577 678 770 85260 -64 554 586 618 619 669 695 721 751 754 773 692 726 634 522 540 631 71865 -69 423 424 426 440 469 502 526 558 555 598 557 613 644 562 462 479 56170 -74 266 309 335 365 365 384 366 370 381 404 387 476 523 550 480 396 41175 -79 190 185 187 199 214 224 253 276 298 298 279 313 387 425 446 387 31880 -84 120 120 124 127 141 140 136 140 148 158 149 205 231 286 312 328 28585 &up 114 108 106 107 113 118 130 133 133 141 125 151 197 236 289 330 357Totals 11,981 12,129 12,242 12,431 12,587 12,787 12,899 13,025 13,115 13,243 12,030 12,496 12,915 13,318 13,732 14,152 14,578
FEMALES
0 - 4 959 962 990 988 992 1,026 1,039 1,039 1,068 1,077 975 977 988 1,027 1,076 1,114 1,1385 - 9 941 918 902 913 951 970 979 1,006 999 998 926 976 979 990 1,029 1,076 1,116
10 -14 882 926 950 931 924 924 935 919 926 959 875 929 979 982 995 1,033 1,08115 -19 1,013 957 965 991 986 955 938 963 939 927 830 874 927 978 980 992 1,03020 -24 887 897 869 878 901 946 967 978 997 988 856 826 871 924 974 977 99025 -29 823 839 864 863 893 909 910 886 889 909 854 859 829 874 926 977 97930 -34 756 776 798 858 848 852 855 881 874 902 823 856 861 832 878 930 98135 -39 704 687 669 666 719 762 788 811 868 854 767 824 857 863 834 878 93140 -44 923 904 875 809 765 729 694 676 672 721 685 766 823 857 861 831 87645 -49 963 973 969 988 958 943 913 884 813 765 655 681 762 818 852 856 82750 -54 983 1,017 1,046 1,047 1,051 1,007 980 975 989 957 842 648 675 755 812 845 85055 -59 810 820 837 837 876 927 1,003 1,033 1,027 1,027 881 818 629 657 733 788 82160 -64 635 681 711 768 775 797 793 813 810 841 799 842 781 601 628 701 75465 -69 483 508 528 531 585 633 651 682 733 736 678 753 795 738 569 594 66270 -74 333 352 372 417 441 445 475 495 495 544 528 627 699 735 681 524 54975 -79 285 257 246 238 256 291 316 334 373 392 355 468 556 619 647 601 46280 -84 215 216 213 216 228 214 210 203 196 210 215 290 382 452 505 526 48885 &up 205 211 226 249 248 261 276 283 293 296 265 295 366 470 587 678 739
Totals 12,800 12,901 13,030 13,188 13,397 13,591 13,722 13,861 13,961 14,103 12,809 13,309 13,759 14,172 14,567 14,921 15,274
Version 2021.0 A-54
D R A F T
10-19
-21

Delaware Population Consortium
Population Projection Series
October 31, 2021
Sussex CountyOther Races, Including Two or More Races, Non-Hispanic Population
[As of July 1]
2010 2011 2012 2013 2014 2015 2016 2017 2018 2019 2020 2025 2030 2035 2040 2045 2050
0 - 4 860 828 752 888 755 615 468 280 300 327 571 870 1,226 1,398 1,277 1,036 854
5 - 9 785 803 853 870 943 1,011 1,075 951 838 677 800 733 1,067 1,450 1,599 1,424 1,132
10 -14 640 688 752 838 910 957 987 1,044 1,072 1,138 1,980 991 874 1,230 1,626 1,759 1,537
15 -19 540 525 583 648 701 749 866 940 1,054 1,124 1,906 2,484 1,195 1,019 1,392 1,799 1,909
20 -24 332 375 415 432 508 580 661 726 812 862 1,489 2,379 2,986 1,385 1,152 1,541 1,954
25 -29 326 360 378 376 403 442 460 508 533 615 1,132 1,835 2,822 3,438 1,551 1,264 1,663
30 -34 319 314 324 360 382 402 434 450 451 477 843 1,371 2,144 3,205 3,818 1,685 1,355
35 -39 329 351 345 351 350 365 363 374 418 434 737 994 1,570 2,394 3,502 4,103 1,784
40 -44 328 310 314 315 366 358 389 378 390 385 650 843 1,108 1,716 2,572 3,710 4,301
45 -49 407 422 424 393 380 352 330 334 340 388 616 721 917 1,186 1,817 2,691 3,845
50 -54 330 368 398 411 403 418 434 439 411 391 592 672 772 967 1,242 1,882 2,770
55 -59 266 289 291 317 347 362 375 404 422 411 693 637 713 808 1,005 1,278 1,923
60 -64 256 280 288 282 280 273 296 298 329 354 601 747 675 746 838 1,032 1,303
65 -69 199 207 212 218 244 261 285 293 289 284 449 645 787 703 768 854 1,045
70 -74 167 173 180 192 198 210 209 213 222 245 426 475 669 810 712 777 856
75 -79 107 123 135 148 153 159 161 168 184 186 323 426 470 655 785 686 743
80 -84 57 72 84 79 97 104 117 126 140 145 242 316 413 448 621 734 636
85 &up 46 46 52 66 78 84 93 107 117 137 240 400 569 746 871 1,083 1,303
Totals 6,294 6,534 6,780 7,184 7,498 7,702 8,003 8,033 8,322 8,580 14,290 17,539 20,977 24,304 27,148 29,338 30,913
Version 2021.0 A-55
D R A F T
10-19
-21

Delaware Population Consortium
Population Projection Series
October 31, 2021
Sussex CountyOther Races, Including Two or More Races, Non-Hispanic Population
[As of July 1]
2010 2011 2012 2013 2014 2015 2016 2017 2018 2019 2020 2025 2030 2035 2040 2045 2050
MALES
0 - 4 426 385 357 541 467 405 342 143 152 166 290 442 622 710 648 526 4335 - 9 396 355 383 388 433 488 507 458 407 328 387 376 547 742 816 726 577
10 -14 308 303 327 385 425 426 455 489 497 542 988 493 459 641 844 909 79215 -19 261 244 274 297 308 344 398 426 502 544 880 1,273 607 544 737 945 99720 -24 163 176 193 208 253 278 315 351 382 389 701 1,119 1,552 712 621 822 1,03325 -29 149 148 158 159 172 205 219 238 260 310 548 872 1,338 1,799 801 684 89030 -34 159 152 160 163 169 166 182 191 194 207 397 672 1,029 1,532 2,009 875 73735 -39 152 153 148 159 168 181 179 187 192 195 309 474 776 1,158 1,684 2,168 92940 -44 171 149 151 152 168 159 172 163 179 187 325 356 531 853 1,249 1,789 2,27845 -49 194 192 197 174 173 169 162 162 166 180 277 364 390 572 907 1,312 1,86150 -54 167 167 181 194 190 192 198 204 183 178 284 301 390 411 599 941 1,35255 -59 124 120 117 127 145 155 167 181 197 192 315 303 317 405 423 613 95660 -64 121 121 126 116 123 122 124 120 133 149 258 342 323 333 421 436 62665 -69 93 84 86 102 103 111 126 130 121 126 202 279 362 337 344 430 44270 -74 88 84 84 89 91 93 84 86 103 103 179 213 289 371 341 347 43175 -79 42 53 65 70 76 77 80 80 86 86 143 183 214 288 366 334 33780 -84 28 28 29 30 36 45 52 62 67 74 119 143 179 206 275 343 30985 &up 12 12 15 17 21 25 30 33 37 45 86 165 237 306 354 436 541Totals 3,054 2,926 3,051 3,371 3,521 3,641 3,792 3,704 3,858 4,001 6,688 8,370 10,162 11,920 13,439 14,636 15,521
FEMALES
0 - 4 434 443 395 347 288 210 126 137 148 161 281 428 604 688 629 510 4215 - 9 389 448 470 482 510 523 568 493 431 349 413 357 520 708 783 698 555
10 -14 332 385 425 453 485 531 532 555 575 596 992 498 415 589 782 850 74515 -19 279 281 309 351 393 405 468 514 552 580 1,026 1,211 588 475 655 854 91220 -24 169 199 222 224 255 302 346 375 430 473 788 1,260 1,434 673 531 719 92125 -29 177 212 220 217 231 237 241 270 273 305 584 963 1,484 1,639 750 580 77330 -34 160 162 164 197 213 236 252 259 257 270 446 699 1,115 1,673 1,809 810 61835 -39 177 198 197 192 182 184 184 187 226 239 428 520 794 1,236 1,818 1,935 85540 -44 157 161 163 163 198 199 217 215 211 198 325 487 577 863 1,323 1,921 2,02345 -49 213 230 227 219 207 183 168 172 174 208 339 357 527 614 910 1,379 1,98450 -54 163 201 217 217 213 226 236 235 228 213 308 371 382 556 643 941 1,41855 -59 142 169 174 190 202 207 208 223 225 219 378 334 396 403 582 665 96760 -64 135 159 162 166 157 151 172 178 196 205 343 405 352 413 417 596 67765 -69 106 123 126 116 141 150 159 163 168 158 247 366 425 366 424 424 60370 -74 79 89 96 103 107 117 125 127 119 142 247 262 380 439 371 430 42575 -79 65 70 70 78 77 82 81 88 98 100 180 243 256 367 419 352 40680 -84 29 44 55 49 61 59 65 64 73 71 123 173 234 242 346 391 32785 &up 34 34 37 49 57 59 63 74 80 92 154 235 332 440 517 647 762
Totals 3,240 3,608 3,729 3,813 3,977 4,061 4,211 4,329 4,464 4,579 7,602 9,169 10,815 12,384 13,709 14,702 15,392
Version 2021.0 A-56
D R A F T
10-19
-21

Delaware Population Consortium
Population Projection Series
October 31, 2021
Sussex CountyHispanic Population
[As of July 1]
2010 2011 2012 2013 2014 2015 2016 2017 2018 2019 2020 2025 2030 2035 2040 2045 2050
0 - 4 2,470 2,573 2,531 2,509 2,422 2,367 2,344 2,335 2,194 2,090 2,361 2,190 2,768 3,414 3,730 3,642 3,587
5 - 9 1,911 2,093 2,287 2,371 2,448 2,558 2,536 2,522 2,548 2,492 2,989 2,469 2,282 2,882 3,555 3,885 3,796
10 -14 1,372 1,431 1,479 1,597 1,750 1,874 2,033 2,246 2,371 2,484 3,186 3,086 2,542 2,350 2,971 3,660 3,997
15 -19 1,223 1,236 1,252 1,256 1,263 1,273 1,360 1,422 1,562 1,741 2,286 3,226 3,123 2,571 2,377 3,004 3,701
20 -24 1,689 1,533 1,411 1,319 1,234 1,194 1,197 1,226 1,255 1,279 1,582 2,358 3,321 3,212 2,647 2,444 3,088
25 -29 2,019 1,992 1,990 1,903 1,835 1,709 1,533 1,430 1,357 1,289 1,529 1,681 2,485 3,500 3,386 2,791 2,577
30 -34 1,722 1,766 1,789 1,855 1,910 1,979 2,003 2,026 1,969 1,925 2,199 1,630 1,780 2,633 3,704 3,583 2,956
35 -39 1,435 1,496 1,589 1,646 1,630 1,670 1,773 1,815 1,915 2,000 2,540 2,342 1,724 1,881 2,781 3,916 3,788
40 -44 1,024 1,117 1,172 1,256 1,420 1,483 1,507 1,618 1,704 1,712 2,153 2,711 2,485 1,827 1,993 2,946 4,147
45 -49 672 749 825 881 935 1,021 1,146 1,215 1,321 1,516 1,940 2,337 2,919 2,671 1,963 2,145 3,167
50 -54 481 507 547 611 677 744 795 882 955 1,031 1,379 2,162 2,580 3,215 2,946 2,166 2,365
55 -59 345 378 416 437 462 480 549 596 680 762 1,027 1,569 2,434 2,897 3,611 3,307 2,430
60 -64 251 254 261 287 329 374 405 452 480 513 652 1,156 1,747 2,701 3,211 4,003 3,664
65 -69 174 198 217 224 226 238 255 267 300 345 484 701 1,230 1,853 2,863 3,403 4,240
70 -74 137 149 156 174 175 184 188 209 218 224 290 493 707 1,237 1,866 2,882 3,424
75 -79 79 97 114 112 121 120 137 146 164 168 216 281 477 682 1,196 1,807 2,787
80 -84 51 52 50 62 67 81 85 102 102 113 136 203 263 447 635 1,114 1,687
85 &up 40 48 54 59 62 69 73 76 91 101 146 214 318 432 660 976 1,594
Totals 17,095 17,669 18,140 18,559 18,966 19,418 19,919 20,585 21,186 21,785 27,095 30,809 35,185 40,405 46,095 51,674 56,995
Version 2021.0 A-57
D R A F T
10-19
-21

Delaware Population Consortium
Population Projection Series
October 31, 2021
Sussex CountyHispanic Population
[As of July 1]
2010 2011 2012 2013 2014 2015 2016 2017 2018 2019 2020 2025 2030 2035 2040 2045 2050
MALES
0 - 4 1,263 1,315 1,285 1,288 1,248 1,215 1,189 1,185 1,114 1,061 1,198 1,111 1,404 1,732 1,892 1,848 1,8205 - 9 995 1,104 1,204 1,219 1,252 1,296 1,298 1,283 1,309 1,285 1,536 1,255 1,159 1,464 1,807 1,974 1,928
10 -14 672 719 754 833 905 991 1,073 1,183 1,220 1,272 1,615 1,588 1,293 1,195 1,511 1,861 2,03215 -19 692 670 656 643 645 650 681 722 812 898 1,207 1,632 1,603 1,304 1,206 1,525 1,87820 -24 979 888 817 762 711 658 644 637 637 648 803 1,236 1,668 1,638 1,334 1,231 1,55625 -29 1,179 1,169 1,162 1,118 1,074 995 885 825 782 740 839 849 1,297 1,751 1,720 1,401 1,29430 -34 940 974 999 1,041 1,083 1,137 1,174 1,183 1,156 1,125 1,279 893 899 1,373 1,851 1,819 1,48335 -39 773 853 914 919 889 914 976 1,013 1,073 1,133 1,458 1,360 944 948 1,448 1,954 1,92040 -44 571 621 660 727 830 848 856 927 948 930 1,174 1,551 1,439 997 1,000 1,528 2,06145 -49 358 398 425 443 480 547 632 679 759 880 1,103 1,264 1,659 1,536 1,063 1,069 1,63050 -54 264 275 294 339 376 410 418 451 476 525 732 1,221 1,387 1,816 1,686 1,168 1,17155 -59 184 212 239 246 254 260 299 322 376 424 566 833 1,376 1,560 2,041 1,894 1,31260 -64 131 130 133 149 177 205 230 263 273 285 355 642 936 1,537 1,741 2,279 2,11365 -69 92 98 107 118 116 128 131 137 158 186 268 385 687 1,001 1,639 1,857 2,42870 -74 71 78 80 85 90 91 94 104 116 115 155 273 387 690 1,007 1,647 1,86475 -79 39 51 60 59 56 58 71 74 79 85 104 148 261 368 659 964 1,57480 -84 22 20 18 27 35 42 44 53 53 51 65 96 137 241 337 603 88585 &up 13 21 24 27 25 28 28 30 40 47 67 97 142 198 323 483 802Totals 9,238 9,596 9,831 10,043 10,246 10,473 10,723 11,071 11,381 11,690 14,524 16,434 18,678 21,349 24,265 27,105 29,751
FEMALES
0 - 4 1,207 1,258 1,246 1,221 1,174 1,152 1,155 1,150 1,080 1,029 1,163 1,079 1,364 1,682 1,838 1,794 1,7675 - 9 916 989 1,083 1,152 1,196 1,262 1,238 1,239 1,239 1,207 1,453 1,214 1,123 1,418 1,748 1,911 1,868
10 -14 700 712 725 764 845 883 960 1,063 1,151 1,212 1,571 1,498 1,249 1,155 1,460 1,799 1,96515 -19 531 566 596 613 618 623 679 700 750 843 1,079 1,594 1,520 1,267 1,171 1,479 1,82320 -24 710 645 594 557 523 536 553 589 618 631 779 1,122 1,653 1,574 1,313 1,213 1,53225 -29 840 823 828 785 761 714 648 605 575 549 690 832 1,188 1,749 1,666 1,390 1,28330 -34 782 792 790 814 827 842 829 843 813 800 920 737 881 1,260 1,853 1,764 1,47335 -39 662 643 675 727 741 756 797 802 842 867 1,082 982 780 933 1,333 1,962 1,86840 -44 453 496 512 529 590 635 651 691 756 782 979 1,160 1,046 830 993 1,418 2,08645 -49 314 351 400 438 455 474 514 536 562 636 837 1,073 1,260 1,135 900 1,076 1,53750 -54 217 232 253 272 301 334 377 431 479 506 647 941 1,193 1,399 1,260 998 1,19455 -59 161 166 177 191 208 220 250 274 304 338 461 736 1,058 1,337 1,570 1,413 1,11860 -64 120 124 128 138 152 169 175 189 207 228 297 514 811 1,164 1,470 1,724 1,55165 -69 82 100 110 106 110 110 124 130 142 159 216 316 543 852 1,224 1,546 1,81270 -74 66 71 76 89 85 93 94 105 102 109 135 220 320 547 859 1,235 1,56075 -79 40 46 54 53 65 62 66 72 85 83 112 133 216 314 537 843 1,21380 -84 29 32 32 35 32 39 41 49 49 62 71 107 126 206 298 511 80285 &up 27 27 30 32 37 41 45 46 51 54 79 117 176 234 337 493 792
Totals 7,857 8,073 8,309 8,516 8,720 8,945 9,196 9,514 9,805 10,095 12,571 14,375 16,507 19,056 21,830 24,569 27,244
Version 2021.0 A-58
D R A F T
10-19
-21

Dover
Wilmington
Newark
State of Delaware
±
0 6 12 18 243Miles
County Line
County Line
New CastleCounty
KentCounty
SussexCounty
A-59
D R A F T
10-19
-21

D R A F T
10-19
-21

Appendix 1
ACS Place Estimates (2010‐2019) and Place
Projections 2020‐2050
D R A F T
10-19
-21

Kent County Estimates and Projections for Places 10/31/21
2010 2011 2012 2013 2014 2015 2016 2017 2018 2019 2020 2030 2040 2050
Bowers town 338 342 345 350 355 360 362 366 370 374 277 311 299 298
Camden town 3,450 3,456 3,467 3,458 3,468 3,458 3,452 3,468 3,493 3,551 3,722 3,801 3,967 4,216
Cheswold town 1,501 1,521 1,544 1,563 1,568 1,571 1,594 1,615 1,652 1,695 1,939 2,009 2,226 2,511
Clayton town 2,946 2,980 3,019 3,057 3,092 3,147 3,195 3,259 3,363 3,508 3,991 4,231 4,797 5,545
Dover city 35,894 36,300 36,720 36,724 36,949 36,967 37,229 37,416 38,008 38,166 39,491 40,570 42,322 44,964
Farmington town 110 113 113 115 116 118 119 119 120 122 92 102 99 98
Felton town 1,286 1,299 1,316 1,328 1,349 1,366 1,374 1,389 1,399 1,414 1,316 1,386 1,406 1,456
Frederica town 763 771 782 790 803 813 820 829 837 849 1,082 1,117 1,302 1,548
Harrington city 3,571 3,610 3,653 3,690 3,688 3,678 3,665 3,648 3,634 3,638 3,779 3,807 3,901 4,075
Hartly town 68 68 71 70 73 72 74 73 75 76 73 77 79 84
Houston town 369 374 378 383 388 391 394 399 400 405 381 400 406 421
Kenton town 243 246 249 251 257 261 261 265 268 271 214 236 230 231
Leipsic town 186 188 191 193 195 198 199 202 202 205 178 190 189 192
Little Creek town 215 218 221 223 226 227 231 232 234 235 194 210 205 207
Magnolia town 267 270 273 275 278 282 283 286 288 289 278 290 296 308
Milford city (Kent part) 3,805 3,860 3,927 4,063 4,125 4,191 4,275 4,364 4,491 4,640 4,125 4,489 4,590 4,793
Smyrna town 10,171 10,486 10,667 10,849 11,095 11,248 11,323 11,515 11,593 11,813 12,964 13,481 14,680 16,270
Viola town 152 155 155 158 160 160 161 162 163 165 140 150 147 149
Woodside town 176 179 179 182 184 186 187 191 192 193 190 198 204 215
Wyoming town 1,321 1,338 1,376 1,392 1,426 1,447 1,470 1,499 1,536 1,549 1,690 1,773 1,944 2,169
Population in Places 66,832 67,774 68,646 69,114 69,795 70,141 70,668 71,297 72,318 73,158 76,116 78,828 83,290 89,753
Population in County 162,955 165,102 167,303 168,906 171,265 172,965 176,966 178,544 178,544 180,779 182,481 184,613 190,631 204,411
Percent of County in Places 41.0% 41.0% 41.0% 40.9% 40.8% 40.6% 39.9% 39.9% 40.5% 40.5% 41.7% 42.7% 43.7% 43.9%
Version 2021.0 B-1
D R A F T
10-19
-21

New Castle County Estimates and Projections for Places 10/31/21
2010 2011 2012 2013 2014 2015 2016 2017 2018 2019 2020 2030 2040 2050
Arden village 433 435 435 438 438 440 440 441 441 440 440 444 447 446
Ardencroft village 211 212 213 214 216 215 217 216 216 216 216 219 220 220
Ardentown village 267 268 268 270 270 272 271 270 271 270 270 272 273 272
Bellefonte town 1,191 1,192 1,192 1,192 1,186 1,181 1,174 1,163 1,163 1,164 1,162 1,159 1,153 1,137
Delaware City city 1,777 1,786 1,793 1,805 1,813 1,822 1,826 1,826 1,832 1,837 1,840 1,867 1,889 1,895
Elsmere town 6,067 6,074 6,077 6,074 6,054 6,030 5,992 5,947 5,905 5,872 5,858 5,819 5,765 5,666
Middletown town 18,970 19,324 19,519 19,739 20,041 20,501 21,055 21,611 22,358 22,900 23,166 24,849 26,667 28,521
New Castle city 5,148 5,161 5,175 5,186 5,180 5,171 5,154 5,135 5,357 5,392 5,408 5,534 5,647 5,719
Newark city 31,468 31,861 32,302 32,426 32,732 33,363 33,225 33,629 33,563 33,782 34,035 36,589 38,908 41,114
Newport town 1,072 1,072 1,074 1,073 1,071 1,066 1,059 1,053 1,045 1,039 1,037 1,030 1,021 1,004
Odessa town 362 361 370 369 369 366 365 361 360 360 359 358 356 351
Townsend town 2,054 2,069 2,080 2,097 2,128 2,192 2,333 2,450 2,557 2,659 2,693 2,993 3,343 3,741
Wilmington city 71,454 71,296 71,125 71,135 71,270 71,567 71,510 71,286 70,722 70,161 70,903 71,813 72,112 72,114
Population in Places 140,474 141,111 141,623 142,018 142,768 144,186 144,621 145,388 145,790 146,092 147,389 152,946 157,802 162,202
Population in County 538,753 541,905 545,063 545,991 549,099 552,378 555,531 561,176 564,461 567,741 571,058 585,990 599,650 603,757
Percent of County in Places 26.1% 26.0% 26.0% 26.0% 26.0% 26.1% 26.0% 25.9% 25.8% 25.7% 25.8% 26.1% 26.3% 26.9%
Version 2021.0 B-2
D R A F T
10-19
-21

Sussex County Estimates and Projections for Places 10/31/21
2010 2011 2012 2013 2014 2015 2016 2017 2018 2019 2020 2030 2040 2050
Bethany Beach town 1,059 1,072 1,086 1,103 1,123 1,146 1,169 1,194 1,221 1,245 1,271 1,422 1,549 1,655
Bethel town 173 175 177 179 182 187 189 193 196 201 205 229 249 265
Blades town 1,244 1,259 1,274 1,292 1,315 1,340 1,367 1,396 1,426 1,454 1,484 1,658 1,804 1,925
Bridgeville town 2,015 2,040 2,065 2,096 2,137 2,176 2,221 2,270 2,320 2,366 2,416 2,702 2,944 3,146
Dagsboro town 792 802 812 824 838 855 871 892 910 927 946 1,057 1,150 1,227
Delmar town 1,590 1,596 1,614 1,641 1,669 1,695 1,727 1,764 1,787 1,822 1,858 2,065 2,235 2,371
Dewey Beach town 341 346 350 355 362 369 376 384 392 400 408 456 497 530
Ellendale town 370 376 379 385 390 400 407 416 424 434 443 495 539 576
Fenwick Island town 380 384 389 394 402 410 418 427 436 445 454 508 554 592
Frankford town 848 855 866 878 895 910 929 947 969 987 1,007 1,125 1,223 1,305
Georgetown town 6,452 6,529 6,607 6,704 6,827 6,959 7,099 7,248 7,418 7,563 7,721 8,635 9,403 10,046
Greenwood town 976 988 998 1,014 1,033 1,052 1,073 1,095 1,118 1,139 1,163 1,298 1,411 1,505
Henlopen Acres town 123 124 126 128 130 132 135 138 141 144 147 164 179 191
Laurel town 3,733 3,775 3,820 3,873 3,943 4,017 4,098 4,185 4,272 4,356 4,446 4,966 5,401 5,761
Lewes city 2,858 2,893 2,927 2,968 3,020 3,077 3,137 3,201 3,261 3,322 3,389 3,778 4,101 4,366
Milford city (Sussex part) 5,815 5,900 6,001 6,209 6,304 6,406 6,534 6,669 6,865 7,092 7,257 8,164 8,946 9,623
Millsboro town 3,876 3,901 3,950 4,004 4,078 4,155 4,239 4,329 4,445 4,533 4,629 5,183 5,653 6,048
Millville town 530 537 544 553 564 575 587 600 614 626 639 716 781 836
Milton town 2,570 2,602 2,633 2,672 2,722 2,775 2,830 2,891 2,953 3,012 3,075 3,438 3,742 3,997
Ocean View town 1,852 1,876 1,902 1,932 1,970 2,010 2,052 2,099 2,146 2,190 2,237 2,506 2,735 2,928
Rehoboth Beach city 1,324 1,339 1,355 1,374 1,399 1,426 1,454 1,485 1,516 1,546 1,578 1,763 1,918 2,046
Seaford city 6,918 7,002 7,082 7,177 7,298 7,427 7,567 7,718 7,865 8,013 8,174 9,103 9,870 10,494
Selbyville town 2,172 2,196 2,224 2,257 2,298 2,341 2,389 2,440 2,492 2,540 2,593 2,897 3,151 3,363
Slaughter Beach town 207 209 212 215 218 222 227 232 237 241 246 274 298 317
South Bethany town 451 456 462 469 478 487 498 508 519 530 541 606 660 706
Population in Places 48,669 49,232 49,855 50,696 51,595 52,549 53,593 54,721 55,943 57,128 58,326 65,209 70,991 75,818
Population in County 197,892 200,380 203,048 206,047 210,081 214,480 219,106 224,353 229,385 234,226 238,496 272,266 295,311 307,544
Percent of County in Places 24.6% 24.6% 24.6% 24.6% 24.6% 24.5% 24.5% 24.4% 24.4% 24.4% 24.5% 24.0% 24.0% 24.7%
Version 2021.0 B-3
D R A F T
10-19
-21

Appendix 2
Seasonal Population Projections by County
D R A F T
10-19
-21
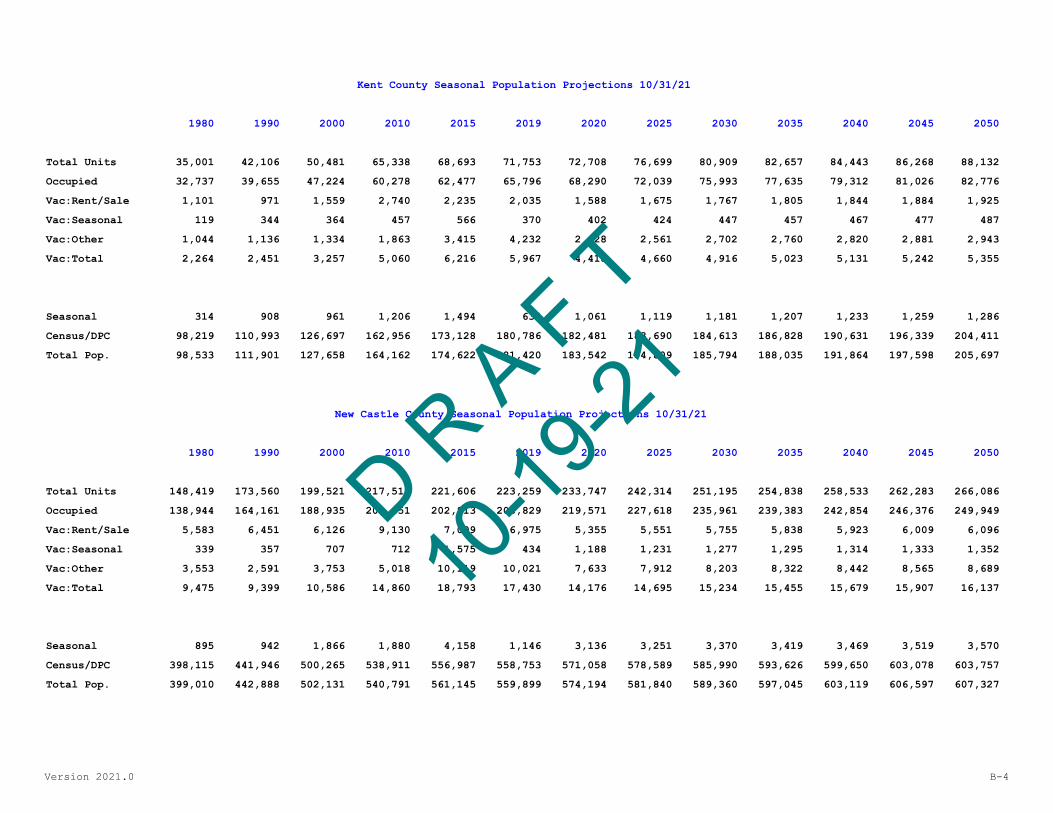
1980 1990 2000 2010 2015 2019 2020 2025 2030 2035 2040 2045 2050
Total Units 35,001 42,106 50,481 65,338 68,693 71,753 72,708 76,699 80,909 82,657 84,443 86,268 88,132
Occupied 32,737 39,655 47,224 60,278 62,477 65,796 68,290 72,039 75,993 77,635 79,312 81,026 82,776
Vac:Rent/Sale 1,101 971 1,559 2,740 2,235 2,035 1,588 1,675 1,767 1,805 1,844 1,884 1,925
Vac:Seasonal 119 344 364 457 566 370 402 424 447 457 467 477 487
Vac:Other 1,044 1,136 1,334 1,863 3,415 4,232 2,428 2,561 2,702 2,760 2,820 2,881 2,943
Vac:Total 2,264 2,451 3,257 5,060 6,216 5,967 4,418 4,660 4,916 5,023 5,131 5,242 5,355
Seasonal 314 908 961 1,206 1,494 634 1,061 1,119 1,181 1,207 1,233 1,259 1,286
Census/DPC 98,219 110,993 126,697 162,956 173,128 180,786 182,481 183,690 184,613 186,828 190,631 196,339 204,411
Total Pop. 98,533 111,901 127,658 164,162 174,622 181,420 183,542 184,809 185,794 188,035 191,864 197,598 205,697
1980 1990 2000 2010 2015 2019 2020 2025 2030 2035 2040 2045 2050
Total Units 148,419 173,560 199,521 217,511 221,606 223,259 233,747 242,314 251,195 254,838 258,533 262,283 266,086
Occupied 138,944 164,161 188,935 202,651 202,813 205,829 219,571 227,618 235,961 239,383 242,854 246,376 249,949
Vac:Rent/Sale 5,583 6,451 6,126 9,130 7,099 6,975 5,355 5,551 5,755 5,838 5,923 6,009 6,096
Vac:Seasonal 339 357 707 712 1,575 434 1,188 1,231 1,277 1,295 1,314 1,333 1,352
Vac:Other 3,553 2,591 3,753 5,018 10,119 10,021 7,633 7,912 8,203 8,322 8,442 8,565 8,689
Vac:Total 9,475 9,399 10,586 14,860 18,793 17,430 14,176 14,695 15,234 15,455 15,679 15,907 16,137
Seasonal 895 942 1,866 1,880 4,158 1,146 3,136 3,251 3,370 3,419 3,469 3,519 3,570
Census/DPC 398,115 441,946 500,265 538,911 556,987 558,753 571,058 578,589 585,990 593,626 599,650 603,078 603,757
Total Pop. 399,010 442,888 502,131 540,791 561,145 559,899 574,194 581,840 589,360 597,045 603,119 606,597 607,327
Kent County Seasonal Population Projections 10/31/21
New Castle County Seasonal Population Projections 10/31/21
Version 2021.0 B-4
D R A F T
10-19
-21

1980 1990 2000 2010 2015 2019* 2020 2025 2030 2035 2040 2045 2050
Total Units 46,687 74,253 93,070 123,036 131,435 138,183 142,280 153,003 164,534 169,386 174,381 179,524 184,818
Occupied 35,400 43,681 62,577 79,368 87,305 91,967 98,514 105,938 113,923 117,282 120,741 124,302 127,967
Vac:Rent/Sale 2,338 2,792 2,981 5,514 3,489 3,663 2,927 2,789 4,121 4,246 4,326 4,373 4,413
Vac:Seasonal 7,281 18,793 24,906 34,770 36,518 36,982 35,953 38,663 41,576 42,802 44,064 45,363 46,701
Vac:Other 1,668 8,987 2,606 3,384 4,123 5,841 4,886 4,655 4,869 5,018 5,113 5,167 5,214
Vac:Total 11,287 30,572 30,493 43,668 44,130 46,486 43,766 47,064 50,610 52,103 53,640 55,221 56,850
Seasonal 19,222 49,614 65,752 91,793 96,408 97,632 94,916 102,069 109,760 112,996 116,329 119,759 123,291
Census/DPC 98,004 113,229 156,638 197,892 215,622 234,226 238,496 256,194 272,266 285,286 295,311 302,436 307,544
Total Pop. 117,226 162,843 222,390 289,685 312,030 331,858 333,412 358,263 382,026 398,282 411,640 422,195 430,835
Sussex County Seasonal Population Projections 10/31/21
Version 2021.0 B-5
D R A F T
10-19
-21

Appendix 3
Population Pyramids Delaware 2020 and 2050
D R A F T
10-19
-21

Version 2021.0 B-6
27,891
29,221
30,340
30,604
30,616
30,967
31,737
33,054
37,018
35,893
34,057
36,662
34,580
31,475
26,226
22,131
18,321
21,829
27,278
28,544
29,587
29,851
30,028
30,524
31,397
32,853
36,807
35,774
34,276
37,577
35,471
34,101
29,501
27,104
24,662
37,755
40,000 30,000 20,000 10,000 0 10,000 20,000 30,000 40,000
0 ‐ 4
5 ‐ 9
10 ‐14
15 ‐19
20 ‐24
25 ‐29
30 ‐34
35 ‐39
40 ‐44
45 ‐49
50 ‐54
55 ‐59
60 ‐64
65 ‐69
70 ‐74
75 ‐79
80 ‐84
85 &up
Delaware Population Pyramid 2050
Males Females
27,877
29,174
31,391
31,309
30,747
34,589
32,973
30,582
27,792
28,021
30,592
33,249
31,656
26,344
22,017
14,802
9,460
7,974
27,309
28,474
30,587
30,208
29,746
34,412
32,614
31,517
29,157
29,919
33,245
36,080
34,993
30,426
26,395
19,120
12,776
14,508
40,000 30,000 20,000 10,000 0 10,000 20,000 30,000 40,000
0 ‐ 4
5 ‐ 9
10 ‐14
15 ‐19
20 ‐24
25 ‐29
30 ‐34
35 ‐39
40 ‐44
45 ‐49
50 ‐54
55 ‐59
60 ‐64
65 ‐69
70 ‐74
75 ‐79
80 ‐84
85 &up
Delaware Population Pyramid 2020
Males Females
D R A F T
10-19
-21

Appendix 4
Population Pyramids Delaware Counties 2020 and
2050
D R A F T
10-19
-21

Version 2021.0 B-7
5,516
5,807
6,229
6,362
6,208
6,776
6,470
5,441
4,663
4,817
5,299
5,688
5,074
4,078
3,505
2,435
1,521
1,144
5,512
5,749
6,178
6,214
5,997
6,892
6,538
5,834
5,555
5,551
5,985
6,245
5,880
4,958
4,439
3,357
2,270
2,294
10,000 8,000 6,000 4,000 2,000 0 2,000 4,000 6,000 8,000 10,000
0 ‐ 4
5 ‐ 9
10 ‐14
15 ‐19
20 ‐24
25 ‐29
30 ‐34
35 ‐39
40 ‐44
45 ‐49
50 ‐54
55 ‐59
60 ‐64
65 ‐69
70 ‐74
75 ‐79
80 ‐84
85 &up
Kent County County Population Pyramid 2020
Males Females
5,762
5,881
6,094
6,242
6,231
6,090
6,061
6,264
7,112
6,972
6,376
6,477
6,231
5,109
3,885
3,013
2,335
2,281
5,714
5,836
6,047
6,200
6,212
6,095
6,095
6,323
7,287
7,061
6,437
6,628
6,399
5,771
4,993
4,341
3,685
4,871
10,000 8,000 6,000 4,000 2,000 0 2,000 4,000 6,000 8,000 10,000
0 ‐ 4
5 ‐ 9
10 ‐14
15 ‐19
20 ‐24
25 ‐29
30 ‐34
35 ‐39
40 ‐44
45 ‐49
50 ‐54
55 ‐59
60 ‐64
65 ‐69
70 ‐74
75 ‐79
80 ‐84
85 &up
Kent County County Population Pyramid 2050
Males Females
D R A F T
10-19
-21

Version 2021.0 B-8
16,406
17,128
18,231
18,583
18,515
21,549
20,221
18,662
17,296
17,107
18,112
18,748
17,528
13,936
10,708
6,559
4,175
3,733
16,018
16,672
17,761
17,836
17,726
21,499
20,053
19,403
17,799
17,990
19,654
20,535
19,272
16,316
13,061
8,933
5,983
7,350
30,000 20,000 10,000 0 10,000 20,000 30,000
0 ‐ 4
5 ‐ 9
10 ‐14
15 ‐19
20 ‐24
25 ‐29
30 ‐34
35 ‐39
40 ‐44
45 ‐49
50 ‐54
55 ‐59
60 ‐64
65 ‐69
70 ‐74
75 ‐79
80 ‐84
85 &up
New Castle County Population Pyramid 2020
Males Females
14,873
15,796
16,428
16,558
16,802
17,489
18,079
18,728
20,213
19,816
18,813
20,733
18,531
16,198
13,742
11,372
9,034
10,263
14,518
15,404
16,001
16,136
16,460
17,218
17,864
18,571
20,115
19,551
18,581
21,410
19,294
18,186
15,636
14,122
12,762
18,460
30,000 20,000 10,000 0 10,000 20,000 30,000
0 ‐ 4
5 ‐ 9
10 ‐14
15 ‐19
20 ‐24
25 ‐29
30 ‐34
35 ‐39
40 ‐44
45 ‐49
50 ‐54
55 ‐59
60 ‐64
65 ‐69
70 ‐74
75 ‐79
80 ‐84
85 &up
New Castle County Population Pyramid 2050
Males Females
D R A F T
10-19
-21

Version 2021.0 B-9
5,955
6,239
6,931
6,364
6,024
6,264
6,282
6,479
5,833
6,097
7,181
8,813
9,054
8,330
7,804
5,808
3,764
3,097
5,779
6,053
6,648
6,158
6,023
6,021
6,023
6,280
5,803
6,378
7,606
9,300
9,841
9,152
8,895
6,830
4,523
4,864
10,000 8,000 6,000 4,000 2,000 0 2,000 4,000 6,000 8,000 10,000
0 ‐ 4
5 ‐ 9
10 ‐14
15 ‐19
20 ‐24
25 ‐29
30 ‐34
35 ‐39
40 ‐44
45 ‐49
50 ‐54
55 ‐59
60 ‐64
65 ‐69
70 ‐74
75 ‐79
80 ‐84
85 &up
Sussex County Population Pyramid 2020
Males Females
7,256
7,544
7,818
7,804
7,583
7,388
7,597
8,062
9,693
9,105
8,868
9,452
9,818
10,168
8,599
7,746
6,952
9,285
7,046
7,304
7,539
7,515
7,356
7,211
7,438
7,959
9,405
9,162
9,258
9,539
9,778
10,144
8,872
8,641
8,215
14,424
15,000 10,000 5,000 0 5,000 10,000 15,000
0 ‐ 4
5 ‐ 9
10 ‐14
15 ‐19
20 ‐24
25 ‐29
30 ‐34
35 ‐39
40 ‐44
45 ‐49
50 ‐54
55 ‐59
60 ‐64
65 ‐69
70 ‐74
75 ‐79
80 ‐84
85 &up
Sussex County Population Pyramid 2050
Males Females
D RA F
T
10-19
-21