Seismic studies of the unevenness of open fracturing and ...
10
Surface Unevenness of Fabrics
Eva Moučková, Petra Jirásková and Petr Ursíny Technical University of Liberec
The Czech Republic
1. Introduction
Unevenness of plain textile is counted among qualitative parameters of fabric still more often. It shows itself, for example, in the appearance of plain textile (fluttering, cloudy appearance with thick and thin places) as well as in a mass variation of fabric samples. The appearance of plain textiles is influenced by irregularity of yarns that plain textiles are made from and by manufacturing process of plain textile, i.e. by weaving or knitting. The yarn mass irregularity displays itself in the plain textile by specific known ways (stripiness and a moiré effect). These faults are caused by a periodical irregularity of yarns. A non-periodical yarn irregularity gives cloudiness in the woven or knitted fabric. Parameters and characteristic functions of mass irregularity (a spectrogram, a variance length curve) are usually used for the evaluation of unevenness of longitudinal textiles (yarns) (Slater, 1986). The parameters indicate a value of irregularity. The characteristic functions describe a structure of mass irregularity and enable to find the causes of irregularity. We can predicate unevenness of plain textile (surface unevenness) on the base of course of the spectrogram as well as the variance length curve. Knowledge of these problems are already known and verified (Zellweger Uster, 1971); (Zellweger Uster, 1988). Currently, there are other possibilities for the prediction of surface unevenness. One of them is the application of so called a DR function (Deviation Rate). It is determined, for example, by means of the Uster Tester IV-SX. Today, studies of relation between the magnitude DR and surface unevenness are in progress. Instrumentation used for mass irregularity measurement (for example, the system Oasys from Zweigle, the apparatus Uster-Tester IV-SX from Zellweger Uster) makes, among others, simulation of surface appearance of plain textile (knitted and woven fabric of selected weave) possible. This image is simulated on the basis of signal of measured yarn mass irregularity. This way, the surface appearance of plain textile can be visually evaluated without plain textile manufacturing. But the image evaluation is only subjective in practice because it is realized as a visually judgment of the plain textile appearance. In the literature (Militký, 2005); (Wegener & Hoth, 1958); (Ursíny et al., 2008); (Suh, 2005), the surface unevenness of plain textile is described by means of the variation coefficient (CV) of various properties of plain textile or by means of derived statistical functions. A sample of plain textile is, in these cases, divided into square fields, where individual properties, e.g. mass, are measured. On the basis of results, so-called an area-variation curve is constructed as a parallel to the variance length curve. The area variation curve is constructed also in the works (Suh, 2005); (Moučková & Jirásková, 2006); (Moučková & Jirásková, 2007).
www.intechopen.com
Woven Fabric Engineering
196
Other statistical functions, by means of them the surface variability is possible to be described, use the fact, that magnitude z(x,y) is a random function of two variables (random field). For example, the co-variation function or so-called directional semivariograms belong to these functions (Militký & Klička, 2005); (Militký et al., 2000); (Militký & Bajzik, 2000). This chapter summarises obtained experimental knowledge from the problem area of
surface unevenness prediction and evaluation. The behaviour of the parameter DR in
dependence on other parameters and characteristic functions of mass irregularity is studied
here. The possibility of utilization of the parameter DR for prediction of surface unevenness
is analysed. The simulated image of plain textile as well as the image of real woven fabric is
used for the surface unevenness evaluation. The simulated appearance of plain textile,
obtained from the measuring instrument, is in the greyscale with various intensity of
greyness according to yarn irregularity. The image of real woven fabric is obtained by
scanning the fabric sample and then is converted into the greyscale. Thus, unevenness of
plain textiles (simulated or real) can be converted into unevenness of coloration, which is
interpreted by various intensity of grey. A fluctuation of greyness degree in the image is
evaluated by means of area variation curves and semivariograms, constructed by means of
a special programme created by Militký, J. (Technical University of Liberec) in the
programming environment Matlab. Courses of semivariograms are studied in dependence
on the woven fabric parameters (the fabric sett, the fabric weave) as well as woven fabric
”quality”.
2. Structure of yarn mass irregularity and surface unevenness
We find the term “structure of mass irregularity” as components of periodical irregularity expressed by the spectrogram and as non-periodical irregularity in a certain range of yarn length-sections, which expressed external mass irregularity (the variance length function). Newly, the structure of mass irregularity is possible to be described by the DR function (Deviation Rate Function) too. The characteristic functions can be used for prediction of some typical forms of surface unevenness (the moiré effect, stripiness, cloudiness). In following part, we focus on the utilization of DR function, eventually its individual values, with the aim of clearing up the relation between this function and other characteristic functions, especially the variance length curve. Thus, we will also be able to illuminate its connection with surface unevenness. The application of DR function in mentioned area and also the possibility of surface unevenness quantification is an important assumption for extension of possibilities of surface unevenness prediction based on characteristic functions representing structure of yarn mass irregularity.
2.1 Definition of DR function The magnitude DR and the DR function are one of the outputs of the apparatus Uster-Tester
IV-SX. The value of DR determinates what percentage of the total yarn length exceeds or
falls below a pre-set limit of yarn mass deviation (Zellweger Uster, 2001). It is calculated for
a certain yarn cut-length. The definition of deviation rate (Zellweger Uster, 2001):
( )[ ] 1, % 100
k
ii
TOT
l
DR x yL== ⋅∑
(1)
www.intechopen.com
Surface Unevenness of Fabrics
197
Where: DR(x,y) is the deviation rate, sum of parts length li [m] of all mass deviation, which are same or higher than ± x [%], relative to total length LTOT[m]; x is the set limit of mass deviation [%]; y is the length of section of fibrous product (yarn), which is used - so-called “cut length” [m]; li is the length of “i -th part” of fibrous product (yarn), which surpass the limits ± x [%]; LT is the total length of fibrous product (yarn), k is number of parts (i = 1, 2, ...., k). A definite relation between the DR-value and the variance-length function (CV(L)) results from the definition of DR function (Ursíny et al., 2008); (Pinčáková, 2006). It is possible to observe the deviation rate and amount of mass variability in various length sections (cut lengths).
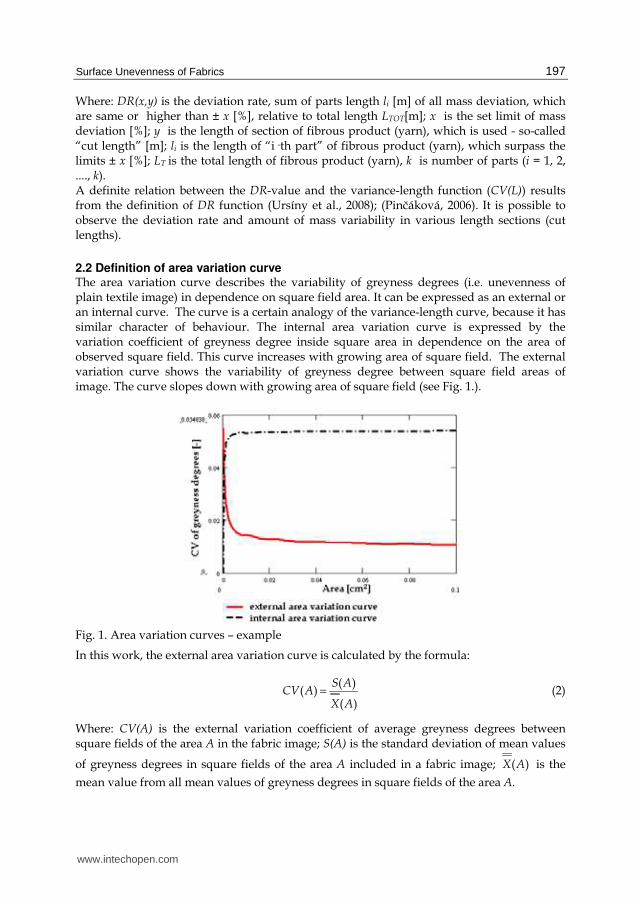
2.2 Definition of area variation curve The area variation curve describes the variability of greyness degrees (i.e. unevenness of plain textile image) in dependence on square field area. It can be expressed as an external or an internal curve. The curve is a certain analogy of the variance-length curve, because it has similar character of behaviour. The internal area variation curve is expressed by the variation coefficient of greyness degree inside square area in dependence on the area of observed square field. This curve increases with growing area of square field. The external variation curve shows the variability of greyness degree between square field areas of image. The curve slopes down with growing area of square field (see Fig. 1.).
Fig. 1. Area variation curves – example
In this work, the external area variation curve is calculated by the formula:
( )
( )( )
S ACV A
X A= (2)
Where: CV(A) is the external variation coefficient of average greyness degrees between square fields of the area A in the fabric image; S(A) is the standard deviation of mean values
of greyness degrees in square fields of the area A included in a fabric image; ( )X A is the
mean value from all mean values of greyness degrees in square fields of the area A.
www.intechopen.com
Woven Fabric Engineering
198
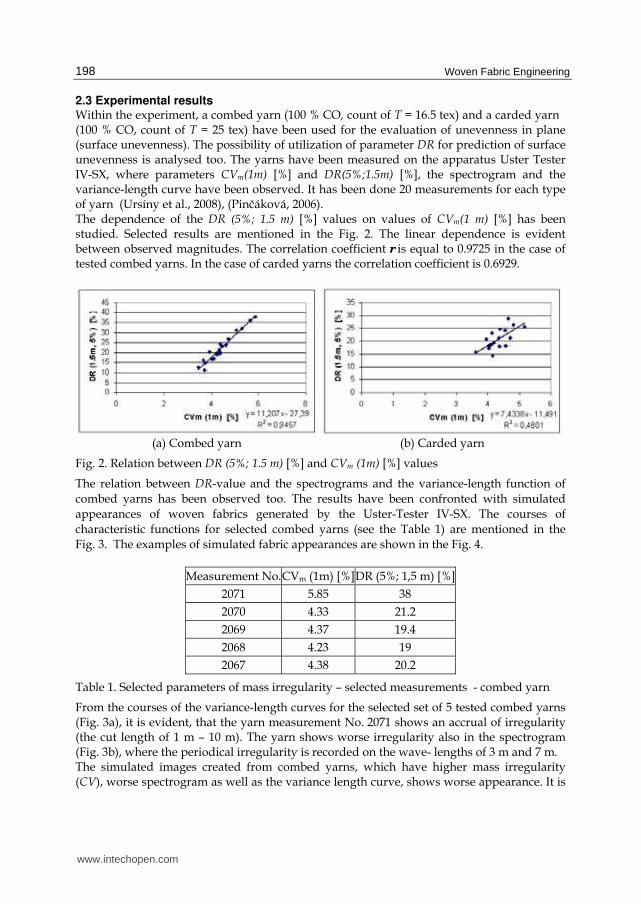
2.3 Experimental results Within the experiment, a combed yarn (100 % CO, count of T = 16.5 tex) and a carded yarn (100 % CO, count of T = 25 tex) have been used for the evaluation of unevenness in plane (surface unevenness). The possibility of utilization of parameter DR for prediction of surface unevenness is analysed too. The yarns have been measured on the apparatus Uster Tester IV-SX, where parameters CVm(1m) [%] and DR(5%;1.5m) [%], the spectrogram and the variance-length curve have been observed. It has been done 20 measurements for each type of yarn (Ursíny et al., 2008), (Pinčáková, 2006). The dependence of the DR (5%; 1.5 m) [%] values on values of CVm(1 m) [%] has been studied. Selected results are mentioned in the Fig. 2. The linear dependence is evident between observed magnitudes. The correlation coefficient r is equal to 0.9725 in the case of tested combed yarns. In the case of carded yarns the correlation coefficient is 0.6929.
(a) Combed yarn (b) Carded yarn
Fig. 2. Relation between DR (5%; 1.5 m) [%] and CVm (1m) [%] values
The relation between DR-value and the spectrograms and the variance-length function of
combed yarns has been observed too. The results have been confronted with simulated
appearances of woven fabrics generated by the Uster-Tester IV-SX. The courses of
characteristic functions for selected combed yarns (see the Table 1) are mentioned in the
Fig. 3. The examples of simulated fabric appearances are shown in the Fig. 4.
Measurement No.CVm (1m) [%]DR (5%; 1,5 m) [%]
2071 5.85 38
2070 4.33 21.2
2069 4.37 19.4
2068 4.23 19
2067 4.38 20.2
Table 1. Selected parameters of mass irregularity – selected measurements - combed yarn
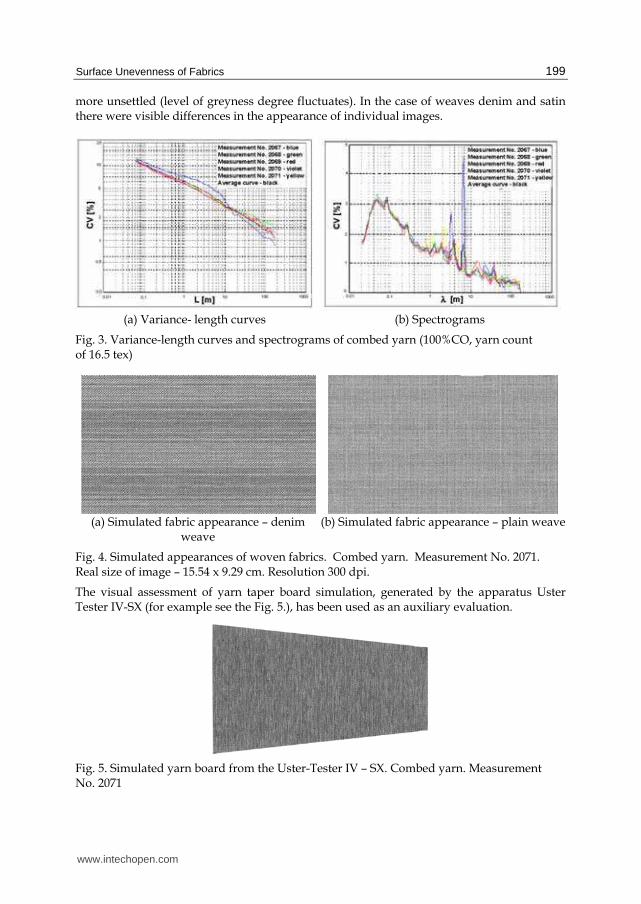
From the courses of the variance-length curves for the selected set of 5 tested combed yarns (Fig. 3a), it is evident, that the yarn measurement No. 2071 shows an accrual of irregularity (the cut length of 1 m – 10 m). The yarn shows worse irregularity also in the spectrogram (Fig. 3b), where the periodical irregularity is recorded on the wave- lengths of 3 m and 7 m. The simulated images created from combed yarns, which have higher mass irregularity (CV), worse spectrogram as well as the variance length curve, shows worse appearance. It is
www.intechopen.com
Surface Unevenness of Fabrics
199
more unsettled (level of greyness degree fluctuates). In the case of weaves denim and satin there were visible differences in the appearance of individual images.
(a) Variance- length curves (b) Spectrograms
Fig. 3. Variance-length curves and spectrograms of combed yarn (100%CO, yarn count of 16.5 tex)
(a) Simulated fabric appearance – denim
weave (b) Simulated fabric appearance – plain weave
Fig. 4. Simulated appearances of woven fabrics. Combed yarn. Measurement No. 2071. Real size of image – 15.54 x 9.29 cm. Resolution 300 dpi.
The visual assessment of yarn taper board simulation, generated by the apparatus Uster Tester IV-SX (for example see the Fig. 5.), has been used as an auxiliary evaluation.
Fig. 5. Simulated yarn board from the Uster-Tester IV – SX. Combed yarn. Measurement No. 2071
www.intechopen.com
Woven Fabric Engineering
200
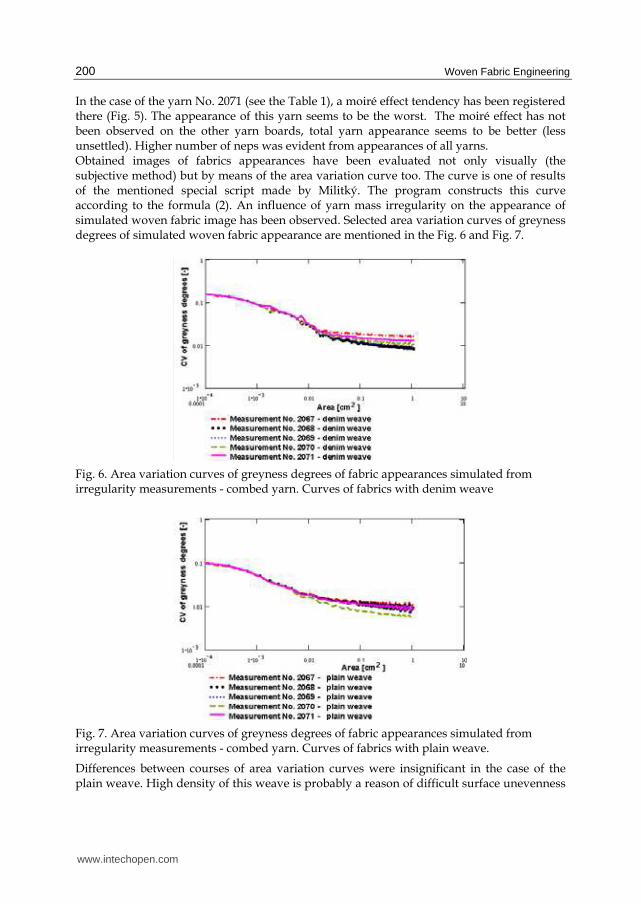
In the case of the yarn No. 2071 (see the Table 1), a moiré effect tendency has been registered there (Fig. 5). The appearance of this yarn seems to be the worst. The moiré effect has not been observed on the other yarn boards, total yarn appearance seems to be better (less unsettled). Higher number of neps was evident from appearances of all yarns. Obtained images of fabrics appearances have been evaluated not only visually (the subjective method) but by means of the area variation curve too. The curve is one of results of the mentioned special script made by Militký. The program constructs this curve according to the formula (2). An influence of yarn mass irregularity on the appearance of simulated woven fabric image has been observed. Selected area variation curves of greyness degrees of simulated woven fabric appearance are mentioned in the Fig. 6 and Fig. 7.
Fig. 6. Area variation curves of greyness degrees of fabric appearances simulated from irregularity measurements - combed yarn. Curves of fabrics with denim weave
Fig. 7. Area variation curves of greyness degrees of fabric appearances simulated from irregularity measurements - combed yarn. Curves of fabrics with plain weave.
Differences between courses of area variation curves were insignificant in the case of the plain weave. High density of this weave is probably a reason of difficult surface unevenness
www.intechopen.com
Surface Unevenness of Fabrics
201
identification, because the plain weave does not have so called a float thread and so mass irregularity of yarn hides up. In the case of weave, that are not so dense (the denim weave, the satin weave), differences in the appearance of flat textile are visible and identifiable. The appearance of flat textile corresponds with measured values of yarn irregularity and yarn appearance more. The yarn, that showed higher CV value, worse spectrogram as well as the course of the variance-length curve, had worse appearance of simulated fabric too – see the measurement No. 2071 where the curve is deflected up. In the case of these weaves, yarn irregularity does not hide and it is identifiable on the float thread. If courses of both variance-length curve and spectrogram are faultless, behaviours of area variation curves are nearly congruent. Total observed area of simulated fabrics image has been divided into square fields during construction of the area-variation curves. The area of square field gradually increased (from several pixels to several thousands of pixels). The area of evaluated square has an influence on the value of variability of greyness degree. This value decreases with increasing area of square field, but simultaneously number of square fields, i.e. number of measurements, grades down. Stability of ascertained results corresponds with this fact. It shows itself by “a saw-toothed” course of area variation curve. For results reliability, a certain minimal number of square fields is necessary; therefore the evaluated area of one square was at the most of 1cm2.
3. Utilization of semivariograms for surface unevenness evaluation
3.1 Definition of semivariograms The semivariogram expresses spatial dissimilarity between values at point xi and xj. Generally, it is defined as one-half variance of differences (z(xi) - z(xi+lag)) (Cressie, 1993); (Militký et al, 2000); (Březina & Militký, 2002); (Militký & Klička, 2005):
( ) 0,5 . ( ( ) ( ))i ilag D z x z x lagΓ = − + (3)
The magnitude lag is a directional vector (0°; 90°, 45°) representing separation between two spatial locations. For uniformly distributed points, x values of vector lag express the multiples of distance between squares in direction of columns (0°), rows (90°) and diagonals (45°) (Militký & Klička, 2005). Thus, 3 types of semivariograms are obtained (in direction of columns, rows and diagonals). Omni-directional semivariogram is calculated by averaging of all 3 types of semivariograms. For stationary random field the mean value is constant in individual locations. Then this formula holds (Cressie, 1993); (Militký et al, 2000):
2( ) 0,5 . ( ( ) ( ))i ilag E z x z x lagΓ = − + (4)
If Γ(lag) = const., the magnitude z(.) is not correlated in the given direction. When a random field is non-stationary (average value in each field is not constant) it is possible to construct so called a centred sample semivariogram (Militký et al., 2000), which has been used in this work:
( )
2
1
1( ) ( ( ) ( ))
2 ( )
N lag
c i c ii
G lag z x z x lagN lag =
= − +∑ (5)
Where: zc(xi) is the centred average greyness degree defined as:
www.intechopen.com
Woven Fabric Engineering
202
( )
1
( )
( ) ( )( )
in x
ii
c i i
i
z x
z x z xn x== − ∑ (6)
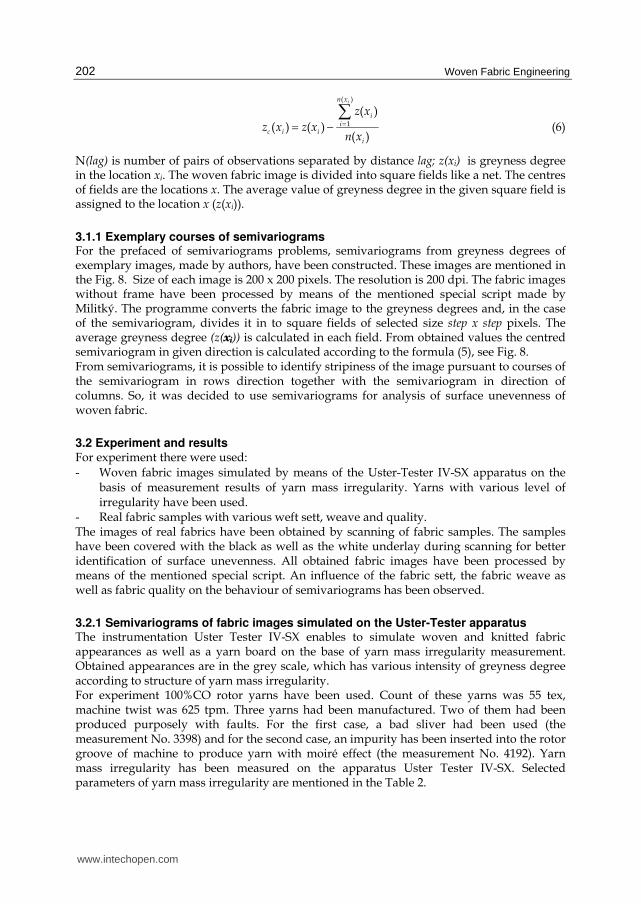
N(lag) is number of pairs of observations separated by distance lag; z(xi) is greyness degree in the location xi. The woven fabric image is divided into square fields like a net. The centres of fields are the locations x. The average value of greyness degree in the given square field is assigned to the location x (z(xi)).
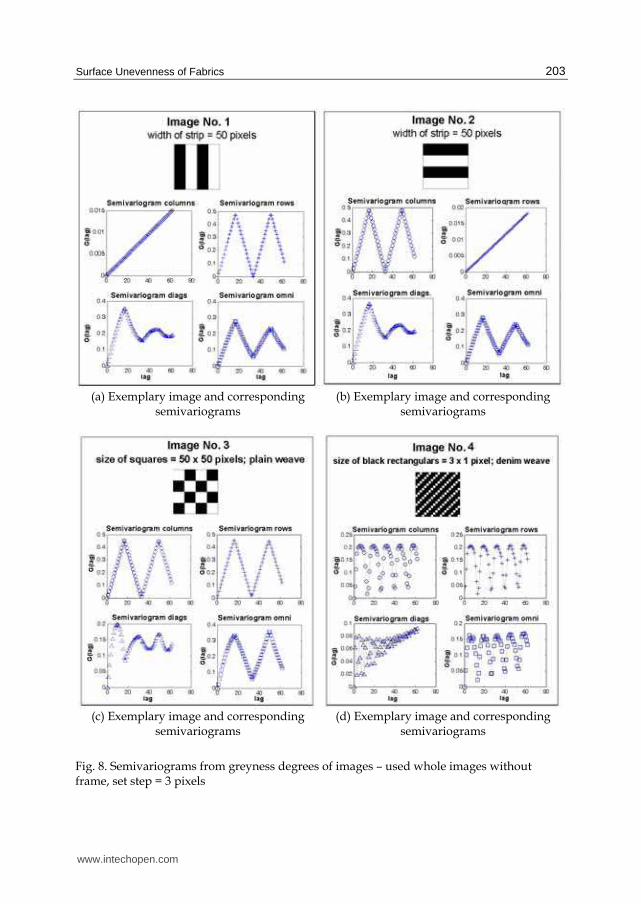
3.1.1 Exemplary courses of semivariograms For the prefaced of semivariograms problems, semivariograms from greyness degrees of exemplary images, made by authors, have been constructed. These images are mentioned in the Fig. 8. Size of each image is 200 x 200 pixels. The resolution is 200 dpi. The fabric images without frame have been processed by means of the mentioned special script made by Militký. The programme converts the fabric image to the greyness degrees and, in the case of the semivariogram, divides it in to square fields of selected size step x step pixels. The average greyness degree (z(xi)) is calculated in each field. From obtained values the centred semivariogram in given direction is calculated according to the formula (5), see Fig. 8. From semivariograms, it is possible to identify stripiness of the image pursuant to courses of the semivariogram in rows direction together with the semivariogram in direction of columns. So, it was decided to use semivariograms for analysis of surface unevenness of woven fabric.
3.2 Experiment and results For experiment there were used:
- Woven fabric images simulated by means of the Uster-Tester IV-SX apparatus on the basis of measurement results of yarn mass irregularity. Yarns with various level of irregularity have been used.
- Real fabric samples with various weft sett, weave and quality. The images of real fabrics have been obtained by scanning of fabric samples. The samples have been covered with the black as well as the white underlay during scanning for better identification of surface unevenness. All obtained fabric images have been processed by means of the mentioned special script. An influence of the fabric sett, the fabric weave as well as fabric quality on the behaviour of semivariograms has been observed.
3.2.1 Semivariograms of fabric images simulated on the Uster-Tester apparatus The instrumentation Uster Tester IV-SX enables to simulate woven and knitted fabric appearances as well as a yarn board on the base of yarn mass irregularity measurement. Obtained appearances are in the grey scale, which has various intensity of greyness degree according to structure of yarn mass irregularity. For experiment 100%CO rotor yarns have been used. Count of these yarns was 55 tex, machine twist was 625 tpm. Three yarns had been manufactured. Two of them had been produced purposely with faults. For the first case, a bad sliver had been used (the measurement No. 3398) and for the second case, an impurity has been inserted into the rotor groove of machine to produce yarn with moiré effect (the measurement No. 4192). Yarn mass irregularity has been measured on the apparatus Uster Tester IV-SX. Selected parameters of yarn mass irregularity are mentioned in the Table 2.
www.intechopen.com
Surface Unevenness of Fabrics
203
(a) Exemplary image and corresponding
semivariograms (b) Exemplary image and corresponding
semivariograms
(c) Exemplary image and corresponding
semivariograms (d) Exemplary image and corresponding
semivariograms
Fig. 8. Semivariograms from greyness degrees of images – used whole images without frame, set step = 3 pixels
www.intechopen.com
Woven Fabric Engineering
204
Measurement
No.
U
[%]
CV
[%]
CV(1m)
[%]
CV(3m)
[%]
CV(10m)
[%]
Thin
places
–50%
[1/km]
Thick
places
+50%
[1/km]
Neps
+280%
[1/km]
3396 10,86 13,71 4,29 3,93 3,70 2,5 57,5 42,5
3398 11,13 14,17 7,98 6,79 5,18 2,5 77,5 57,5
4192 25,30 38,02 3,43 2,75 2,48 2373 6368 5738
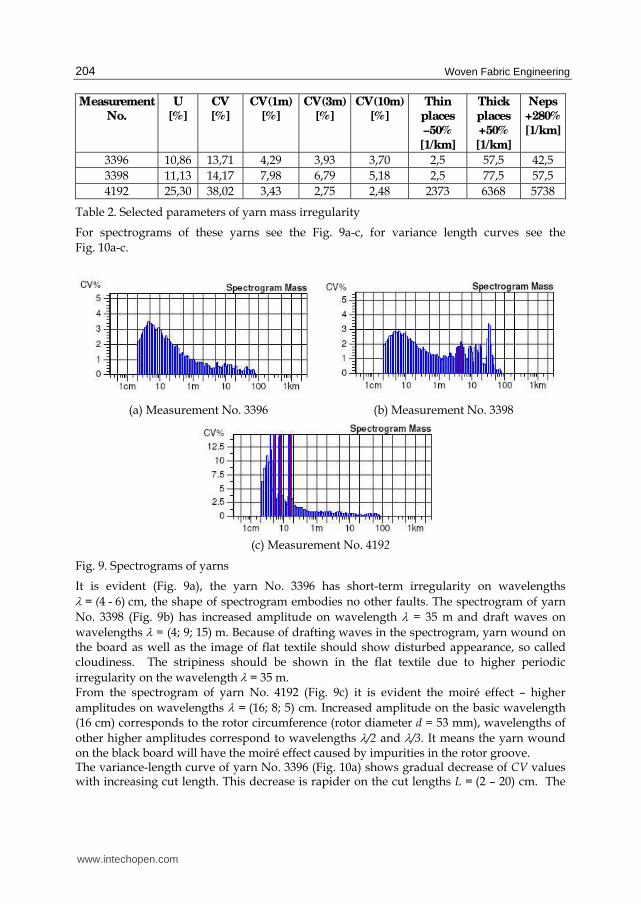
Table 2. Selected parameters of yarn mass irregularity
For spectrograms of these yarns see the Fig. 9a-c, for variance length curves see the
Fig. 10a-c.
(a) Measurement No. 3396 (b) Measurement No. 3398
(c) Measurement No. 4192
Fig. 9. Spectrograms of yarns
It is evident (Fig. 9a), the yarn No. 3396 has short-term irregularity on wavelengths λ = (4 - 6) cm, the shape of spectrogram embodies no other faults. The spectrogram of yarn
No. 3398 (Fig. 9b) has increased amplitude on wavelength λ = 35 m and draft waves on
wavelengths λ = (4; 9; 15) m. Because of drafting waves in the spectrogram, yarn wound on the board as well as the image of flat textile should show disturbed appearance, so called cloudiness. The stripiness should be shown in the flat textile due to higher periodic
irregularity on the wavelength λ = 35 m. From the spectrogram of yarn No. 4192 (Fig. 9c) it is evident the moiré effect – higher
amplitudes on wavelengths λ = (16; 8; 5) cm. Increased amplitude on the basic wavelength (16 cm) corresponds to the rotor circumference (rotor diameter d = 53 mm), wavelengths of
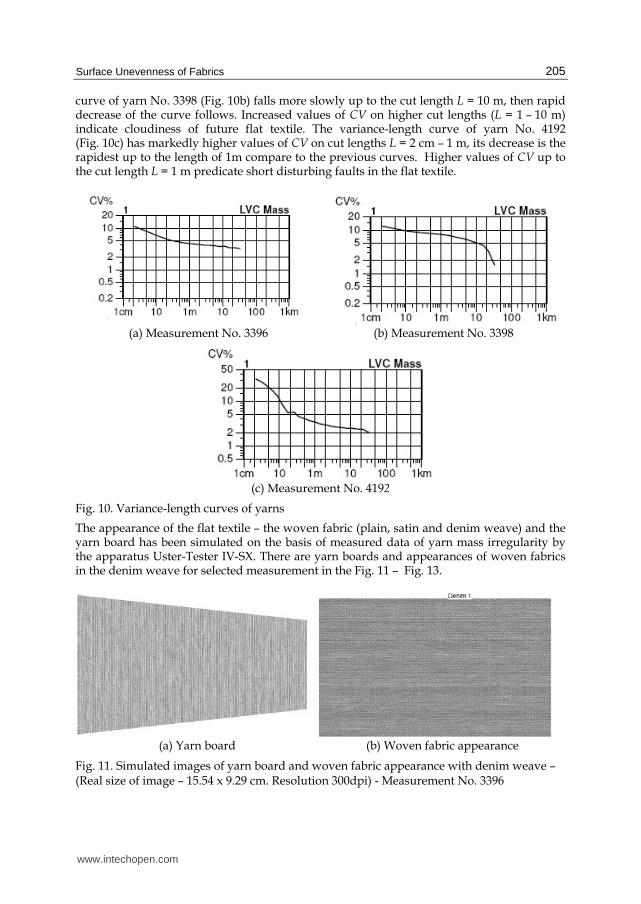
other higher amplitudes correspond to wavelengths λ/2 and λ/3. It means the yarn wound on the black board will have the moiré effect caused by impurities in the rotor groove. The variance-length curve of yarn No. 3396 (Fig. 10a) shows gradual decrease of CV values with increasing cut length. This decrease is rapider on the cut lengths L = (2 – 20) cm. The
www.intechopen.com
Surface Unevenness of Fabrics
205
curve of yarn No. 3398 (Fig. 10b) falls more slowly up to the cut length L = 10 m, then rapid decrease of the curve follows. Increased values of CV on higher cut lengths (L = 1 – 10 m) indicate cloudiness of future flat textile. The variance-length curve of yarn No. 4192 (Fig. 10c) has markedly higher values of CV on cut lengths L = 2 cm – 1 m, its decrease is the rapidest up to the length of 1m compare to the previous curves. Higher values of CV up to the cut length L = 1 m predicate short disturbing faults in the flat textile.
(a) Measurement No. 3396 (b) Measurement No. 3398
(c) Measurement No. 4192
Fig. 10. Variance-length curves of yarns
The appearance of the flat textile – the woven fabric (plain, satin and denim weave) and the yarn board has been simulated on the basis of measured data of yarn mass irregularity by the apparatus Uster-Tester IV-SX. There are yarn boards and appearances of woven fabrics in the denim weave for selected measurement in the Fig. 11 – Fig. 13.
(a) Yarn board (b) Woven fabric appearance
Fig. 11. Simulated images of yarn board and woven fabric appearance with denim weave – (Real size of image – 15.54 x 9.29 cm. Resolution 300dpi) - Measurement No. 3396
www.intechopen.com
Woven Fabric Engineering
206
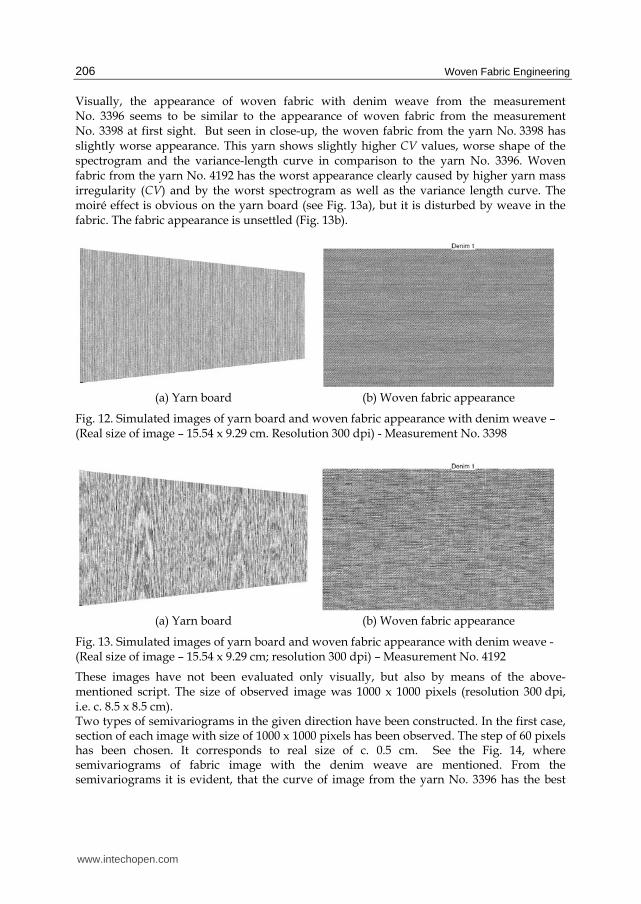
Visually, the appearance of woven fabric with denim weave from the measurement No. 3396 seems to be similar to the appearance of woven fabric from the measurement No. 3398 at first sight. But seen in close-up, the woven fabric from the yarn No. 3398 has slightly worse appearance. This yarn shows slightly higher CV values, worse shape of the spectrogram and the variance-length curve in comparison to the yarn No. 3396. Woven fabric from the yarn No. 4192 has the worst appearance clearly caused by higher yarn mass irregularity (CV) and by the worst spectrogram as well as the variance length curve. The moiré effect is obvious on the yarn board (see Fig. 13a), but it is disturbed by weave in the fabric. The fabric appearance is unsettled (Fig. 13b).
(a) Yarn board (b) Woven fabric appearance
Fig. 12. Simulated images of yarn board and woven fabric appearance with denim weave – (Real size of image – 15.54 x 9.29 cm. Resolution 300 dpi) - Measurement No. 3398
(a) Yarn board (b) Woven fabric appearance
Fig. 13. Simulated images of yarn board and woven fabric appearance with denim weave -(Real size of image – 15.54 x 9.29 cm; resolution 300 dpi) – Measurement No. 4192
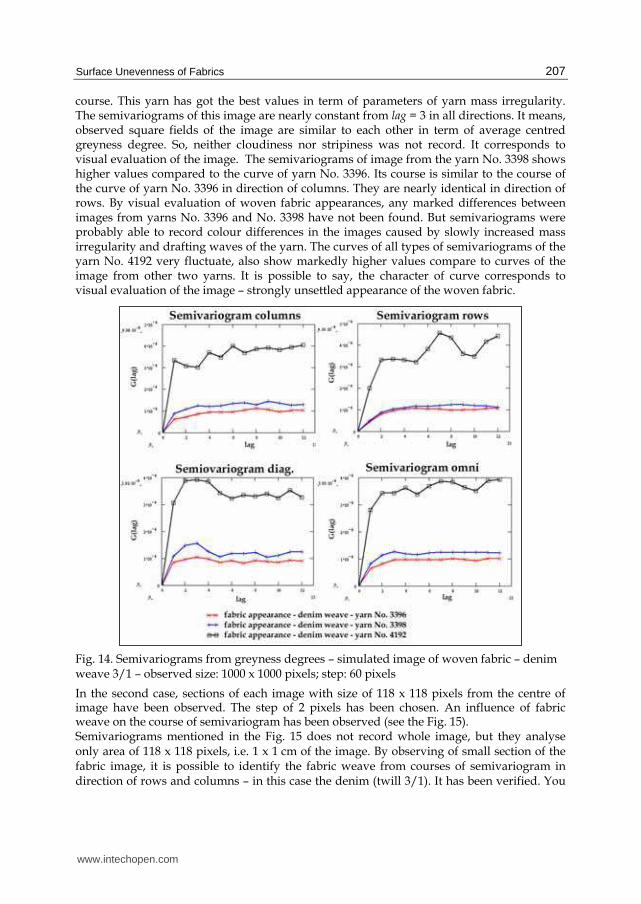
These images have not been evaluated only visually, but also by means of the above-mentioned script. The size of observed image was 1000 x 1000 pixels (resolution 300 dpi, i.e. c. 8.5 x 8.5 cm). Two types of semivariograms in the given direction have been constructed. In the first case, section of each image with size of 1000 x 1000 pixels has been observed. The step of 60 pixels has been chosen. It corresponds to real size of c. 0.5 cm. See the Fig. 14, where semivariograms of fabric image with the denim weave are mentioned. From the semivariograms it is evident, that the curve of image from the yarn No. 3396 has the best
www.intechopen.com
Surface Unevenness of Fabrics
207
course. This yarn has got the best values in term of parameters of yarn mass irregularity. The semivariograms of this image are nearly constant from lag = 3 in all directions. It means, observed square fields of the image are similar to each other in term of average centred greyness degree. So, neither cloudiness nor stripiness was not record. It corresponds to visual evaluation of the image. The semivariograms of image from the yarn No. 3398 shows higher values compared to the curve of yarn No. 3396. Its course is similar to the course of the curve of yarn No. 3396 in direction of columns. They are nearly identical in direction of rows. By visual evaluation of woven fabric appearances, any marked differences between images from yarns No. 3396 and No. 3398 have not been found. But semivariograms were probably able to record colour differences in the images caused by slowly increased mass irregularity and drafting waves of the yarn. The curves of all types of semivariograms of the yarn No. 4192 very fluctuate, also show markedly higher values compare to curves of the image from other two yarns. It is possible to say, the character of curve corresponds to visual evaluation of the image – strongly unsettled appearance of the woven fabric.
Fig. 14. Semivariograms from greyness degrees – simulated image of woven fabric – denim weave 3/1 – observed size: 1000 x 1000 pixels; step: 60 pixels
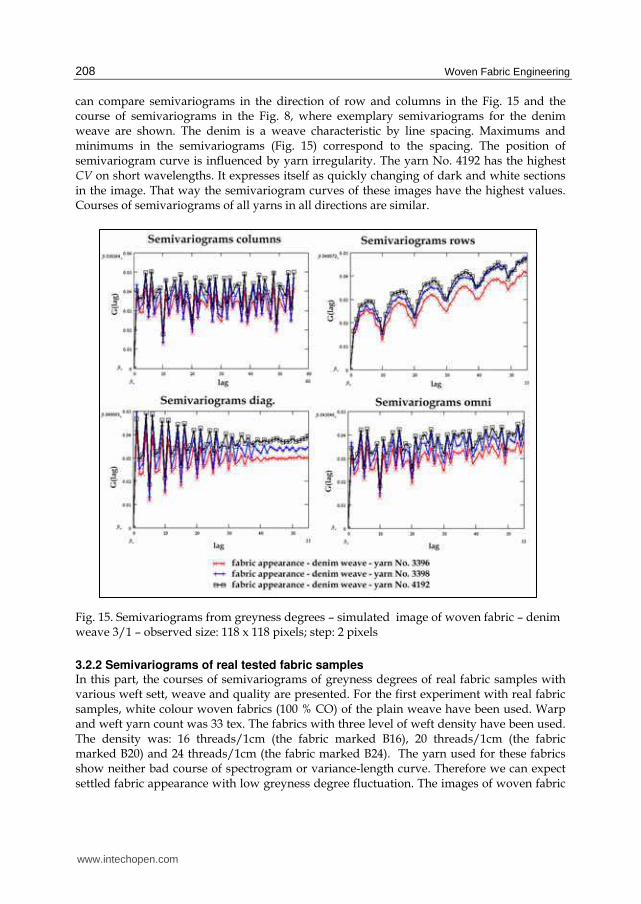
In the second case, sections of each image with size of 118 x 118 pixels from the centre of image have been observed. The step of 2 pixels has been chosen. An influence of fabric weave on the course of semivariogram has been observed (see the Fig. 15). Semivariograms mentioned in the Fig. 15 does not record whole image, but they analyse only area of 118 x 118 pixels, i.e. 1 x 1 cm of the image. By observing of small section of the fabric image, it is possible to identify the fabric weave from courses of semivariogram in direction of rows and columns – in this case the denim (twill 3/1). It has been verified. You
www.intechopen.com
Woven Fabric Engineering
208
can compare semivariograms in the direction of row and columns in the Fig. 15 and the course of semivariograms in the Fig. 8, where exemplary semivariograms for the denim weave are shown. The denim is a weave characteristic by line spacing. Maximums and minimums in the semivariograms (Fig. 15) correspond to the spacing. The position of semivariogram curve is influenced by yarn irregularity. The yarn No. 4192 has the highest CV on short wavelengths. It expresses itself as quickly changing of dark and white sections in the image. That way the semivariogram curves of these images have the highest values. Courses of semivariograms of all yarns in all directions are similar.
Fig. 15. Semivariograms from greyness degrees – simulated image of woven fabric – denim weave 3/1 – observed size: 118 x 118 pixels; step: 2 pixels
3.2.2 Semivariograms of real tested fabric samples In this part, the courses of semivariograms of greyness degrees of real fabric samples with various weft sett, weave and quality are presented. For the first experiment with real fabric samples, white colour woven fabrics (100 % CO) of the plain weave have been used. Warp and weft yarn count was 33 tex. The fabrics with three level of weft density have been used. The density was: 16 threads/1cm (the fabric marked B16), 20 threads/1cm (the fabric marked B20) and 24 threads/1cm (the fabric marked B24). The yarn used for these fabrics show neither bad course of spectrogram or variance-length curve. Therefore we can expect settled fabric appearance with low greyness degree fluctuation. The images of woven fabric
www.intechopen.com
Surface Unevenness of Fabrics
209
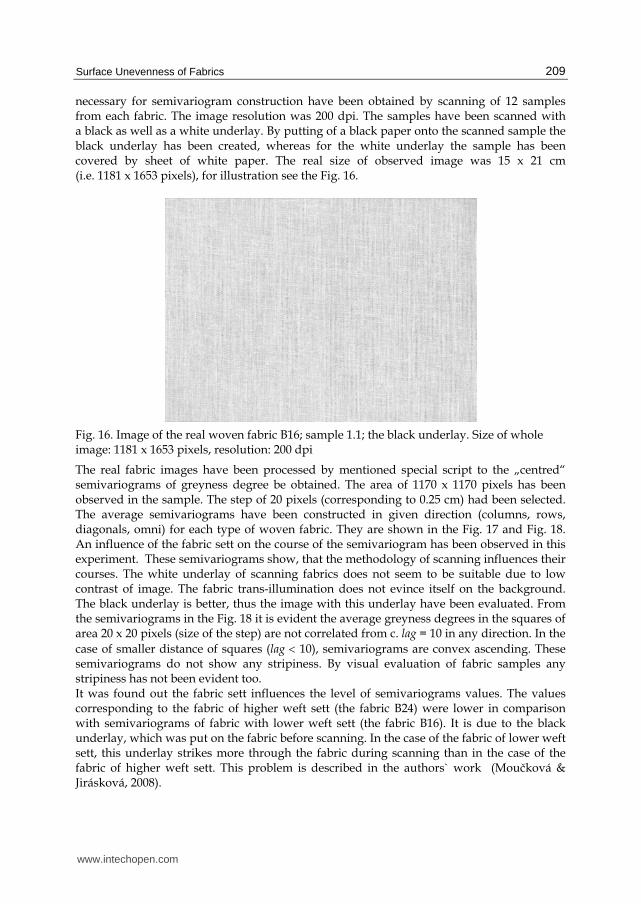
necessary for semivariogram construction have been obtained by scanning of 12 samples from each fabric. The image resolution was 200 dpi. The samples have been scanned with a black as well as a white underlay. By putting of a black paper onto the scanned sample the black underlay has been created, whereas for the white underlay the sample has been covered by sheet of white paper. The real size of observed image was 15 x 21 cm (i.e. 1181 x 1653 pixels), for illustration see the Fig. 16.
Fig. 16. Image of the real woven fabric B16; sample 1.1; the black underlay. Size of whole image: 1181 x 1653 pixels, resolution: 200 dpi
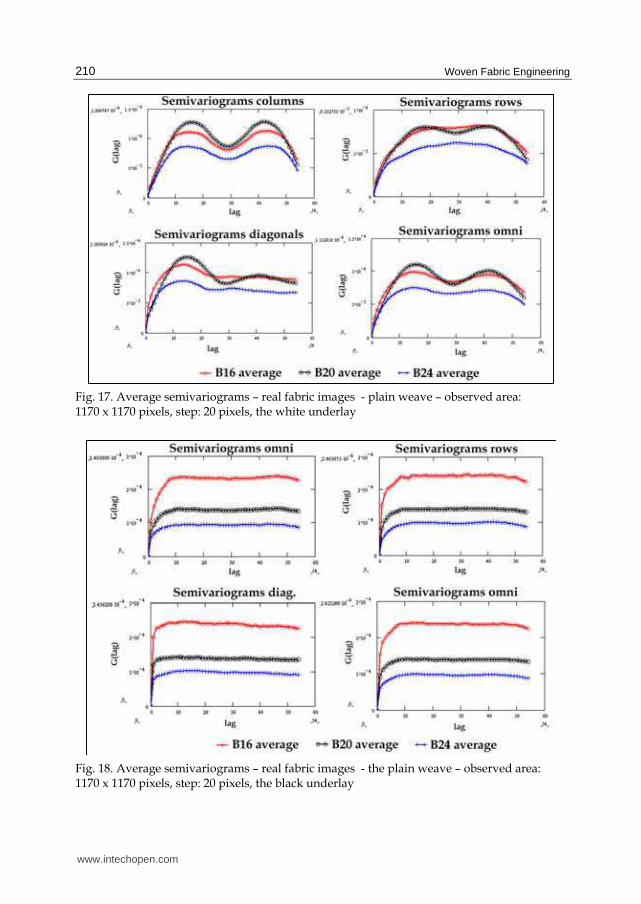
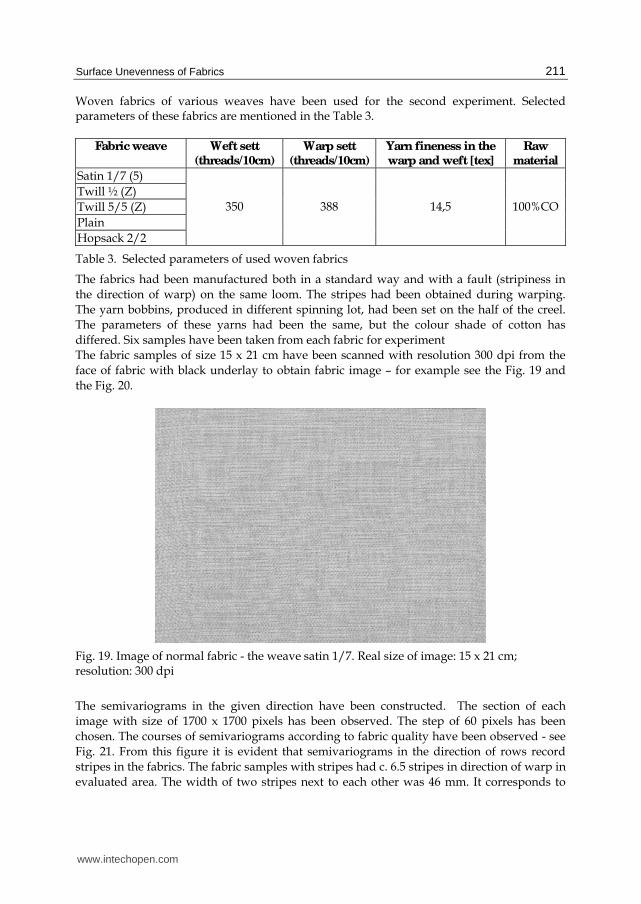
The real fabric images have been processed by mentioned special script to the „centred“ semivariograms of greyness degree be obtained. The area of 1170 x 1170 pixels has been observed in the sample. The step of 20 pixels (corresponding to 0.25 cm) had been selected. The average semivariograms have been constructed in given direction (columns, rows, diagonals, omni) for each type of woven fabric. They are shown in the Fig. 17 and Fig. 18. An influence of the fabric sett on the course of the semivariogram has been observed in this experiment. These semivariograms show, that the methodology of scanning influences their courses. The white underlay of scanning fabrics does not seem to be suitable due to low contrast of image. The fabric trans-illumination does not evince itself on the background. The black underlay is better, thus the image with this underlay have been evaluated. From the semivariograms in the Fig. 18 it is evident the average greyness degrees in the squares of area 20 x 20 pixels (size of the step) are not correlated from c. lag = 10 in any direction. In the
case of smaller distance of squares (lag < 10), semivariograms are convex ascending. These semivariograms do not show any stripiness. By visual evaluation of fabric samples any stripiness has not been evident too. It was found out the fabric sett influences the level of semivariograms values. The values corresponding to the fabric of higher weft sett (the fabric B24) were lower in comparison with semivariograms of fabric with lower weft sett (the fabric B16). It is due to the black underlay, which was put on the fabric before scanning. In the case of the fabric of lower weft sett, this underlay strikes more through the fabric during scanning than in the case of the fabric of higher weft sett. This problem is described in the authors` work (Moučková & Jirásková, 2008).
www.intechopen.com
Woven Fabric Engineering
210
Fig. 17. Average semivariograms – real fabric images - plain weave – observed area: 1170 x 1170 pixels, step: 20 pixels, the white underlay
Fig. 18. Average semivariograms – real fabric images - the plain weave – observed area: 1170 x 1170 pixels, step: 20 pixels, the black underlay
www.intechopen.com
Surface Unevenness of Fabrics
211
Woven fabrics of various weaves have been used for the second experiment. Selected parameters of these fabrics are mentioned in the Table 3.
Fabric weave Weft sett
(threads/10cm)
Warp sett
(threads/10cm)
Yarn fineness in the
warp and weft [tex]
Raw
material
Satin 1/7 (5)
Twill ½ (Z)
Twill 5/5 (Z)
Plain
Hopsack 2/2
350 388 14,5 100%CO
Table 3. Selected parameters of used woven fabrics
The fabrics had been manufactured both in a standard way and with a fault (stripiness in
the direction of warp) on the same loom. The stripes had been obtained during warping.
The yarn bobbins, produced in different spinning lot, had been set on the half of the creel.
The parameters of these yarns had been the same, but the colour shade of cotton has
differed. Six samples have been taken from each fabric for experiment
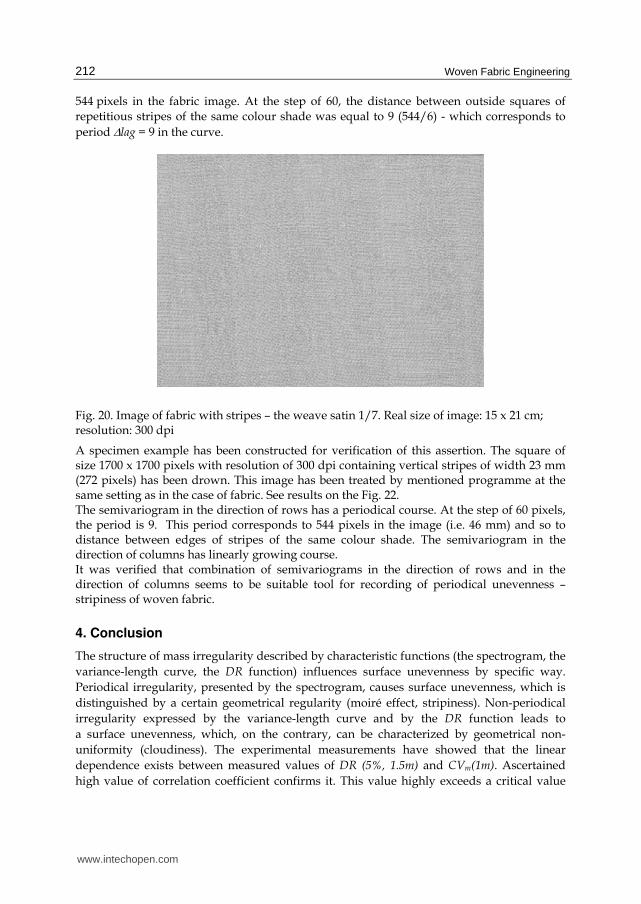
The fabric samples of size 15 x 21 cm have been scanned with resolution 300 dpi from the
face of fabric with black underlay to obtain fabric image – for example see the Fig. 19 and
the Fig. 20.
Fig. 19. Image of normal fabric - the weave satin 1/7. Real size of image: 15 x 21 cm; resolution: 300 dpi
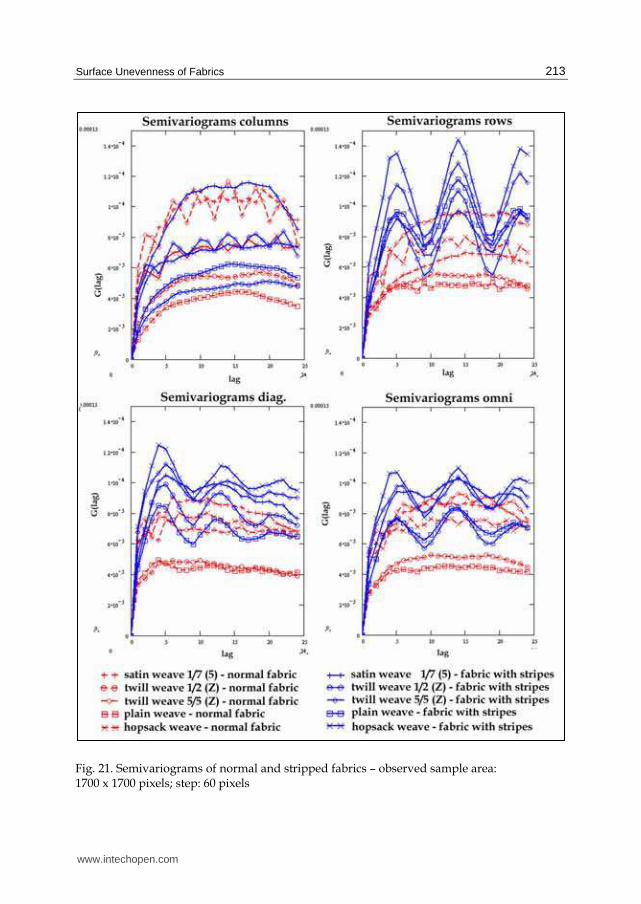
The semivariograms in the given direction have been constructed. The section of each
image with size of 1700 x 1700 pixels has been observed. The step of 60 pixels has been
chosen. The courses of semivariograms according to fabric quality have been observed - see
Fig. 21. From this figure it is evident that semivariograms in the direction of rows record
stripes in the fabrics. The fabric samples with stripes had c. 6.5 stripes in direction of warp in
evaluated area. The width of two stripes next to each other was 46 mm. It corresponds to
www.intechopen.com
Woven Fabric Engineering
212
544 pixels in the fabric image. At the step of 60, the distance between outside squares of
repetitious stripes of the same colour shade was equal to 9 (544/6) - which corresponds to
period Δlag = 9 in the curve.
Fig. 20. Image of fabric with stripes – the weave satin 1/7. Real size of image: 15 x 21 cm; resolution: 300 dpi
A specimen example has been constructed for verification of this assertion. The square of size 1700 x 1700 pixels with resolution of 300 dpi containing vertical stripes of width 23 mm (272 pixels) has been drown. This image has been treated by mentioned programme at the same setting as in the case of fabric. See results on the Fig. 22. The semivariogram in the direction of rows has a periodical course. At the step of 60 pixels, the period is 9. This period corresponds to 544 pixels in the image (i.e. 46 mm) and so to distance between edges of stripes of the same colour shade. The semivariogram in the direction of columns has linearly growing course. It was verified that combination of semivariograms in the direction of rows and in the direction of columns seems to be suitable tool for recording of periodical unevenness – stripiness of woven fabric.
4. Conclusion
The structure of mass irregularity described by characteristic functions (the spectrogram, the
variance-length curve, the DR function) influences surface unevenness by specific way.
Periodical irregularity, presented by the spectrogram, causes surface unevenness, which is
distinguished by a certain geometrical regularity (moiré effect, stripiness). Non-periodical
irregularity expressed by the variance-length curve and by the DR function leads to
a surface unevenness, which, on the contrary, can be characterized by geometrical non-
uniformity (cloudiness). The experimental measurements have showed that the linear
dependence exists between measured values of DR (5%, 1.5m) and CVm(1m). Ascertained
high value of correlation coefficient confirms it. This value highly exceeds a critical value
www.intechopen.com
Surface Unevenness of Fabrics
213
Fig. 21. Semivariograms of normal and stripped fabrics – observed sample area: 1700 x 1700 pixels; step: 60 pixels
www.intechopen.com

Woven Fabric Engineering
214
also in the case of the confidence limit of 99%. Hitherto knowledge about relation between the variance-length curve and surface unevenness (cloudiness) will be possible to amplify on relation between the DR function and surface unevenness. On the basis of course of individual curves, the level and the character of surface unevenness can be judged.
Fig. 22. Semivariograms from greyness degree of image – used whole image (1700 x 1700 pixels) without frame, step: 60 pixels
The surface unevenness of woven fabric can be evaluated by means of area variation curves and semivariograms of greyness degrees of fabric image. The area variation curve has been mentioned theoretically also in previous works (Wegener & Hoth, 1958); (Suh, 2005). From our experiment it has been found out that both the spectrogram and the variance-length curve of yarn used in fabric are basic indicators determining conceivable negative fabric appearance and this corresponding adverse course of area variation curve. Next indicator, which can be used in given context, is the DR function. The application of semivariograms has not been used by the other authors for the evaluation of surface unevenness of woven fabric yet. Semivariograms in the direction of both rows and columns seems to be a suitable tool for fabric stripiness evaluation.
www.intechopen.com
Surface Unevenness of Fabrics
215
Most of experiments have been done with fabrics (real or simulated images of fabric appearance) till this time. Thus, it would be interesting to verify obtained piece of knowledge on knitted fabrics. Next, it would be possible to find other functions suitable for the expression of unevenness of woven or knitted fabrics.
5. Acknowledgement
This work was supported by the project Textile Research Centre II No. 1M0553.
6. References
Březina, M.; Militký, J. (2002). Complex characterization of textile surface, Robust’2002 –
proceeding of twelfth winter school JČMF, pp.50 –58, Hejnice, January 2002, Jednota
českých matematiků a fyziků, Prague.
Cressie, N.A.C. (1993) Statistics for spatial data, J. Wiley, ISBN 0-473-00255-0, New York.
Militký, J.; Bajzik.V. (2000) : Description of thickness variation by fractal dimension,
Proceeding of 7th national conference Strutex, pp. 165-170, ISBN 80-7083-668-7, Liberec,
December 2000, Technical university of Liberec, Liberec.
Militký, J.; Rubnerová, J. & Klička, V. (2000). Spatial statistics and unevenness of surface
mass of non-woven textiles, Proceeding of 7th national conference Strutex, pp. 199-203,
ISBN 80-7083-668-7, Liberec, December 2000, Technical university of Liberec,
Liberec.
Militký, J.; Klička, V. (2005). Characterization of textile mass variation in plane, Proceeding of
5th world textile conference Autex 2005, pp.750–755, ISBN 86-435-0709-1, Portorož,
June 2005, University of Maribor, Faculty of Mechanical Engineering, Department
of Textile, Maribor.
Moučková, E.; Jirásková, P. (2006): Area-variation curve of real woven fabric, Proceedings of
13th international conference STRUTEX, pp. 87-92, ISBN 80-7372-135-X, Liberec,
November 2006, Technical University of Liberec, Liberec.
Moučková, E.; Jirásková, P. (2007): Influence of weft sett on course of area variation curve on
woven fabric, Proceedings of 6th international conference TEXSCI 2007, CD-rom edition,
ISBN 978-80-7372-207-4, Liberec, June 2007, Technical University of Liberec,
Liberec.
Moučková, E.; Jirásková, P. (2008). Utilization of semivariogram for evaluation of surface
unevenness, Book of proceedings of 4th International Textile, Clothing & Design
Conference – Magic World of Textiles, pp. 848 – 853, 978-953-7105-26-6, Dubrovnik,
October 2008, University of Zagreb, Faculty of Textile Technology, Zagreb.
Pinčáková, Z. (2006): Classification selected parameters and characteristic functions of mass
irregularity, Diploma Work (Supervisor: Ursíny, P.), Technical University of Liberec,
Liberec.
Slater, K. (1986). Yarn evenness, The Textile Institute, ISBN 0 900739 85 1, Manchester.
Suh, M., W. (2005). An electronic Imagining of Fabric Qualities by on-line yarn data,
Available from www.ntcresearch.org/pdf-rtps/AnRp01/I01-A1.pdf Accessed:
2005-02-01.
www.intechopen.com
Woven Fabric Engineering
216
Ursíny, P.; Moučková, E. & Jirásková, P. (2008). New knowledge about relation between
yarn mass irregularity and surface unevenness. Book of Proceedings of the 4th
International Textile, Clothing & Design Conference - Magic World of Textiles, pp. 915-
920, ISBN 953-7105-92-, Dubrovnik, October 2008, University of Zagreb, Faculty of
Textile Technology, Zagreb.
Wegener, W. & Hoth, E. G. (1958). Die CD(F)–Flächenvariation, Textil–Praxis, Vol. 1958,
No. 13, (1958), 485- 488.
Zellweger Uster (1971). Zusammenhänge zwischen den Ergebnissen der
Gleichmässigkeitsprüfung und den Aussehen der fertigen Gewebe und Gewirke.
Uster News Bulletin, No. 15. (January 1971), 3 – 36.
Zellweger Uster (1988). Neue Möglichkeiten der Analyse von Masseschwankungen an
Garnen, Vorgarnen und Bändern, Uster News Bulletin, No. 35. (August 1988), 6 - 18.
Zellweger Uster (2001). Uster Tester IV Application Handbook, V1.0/400 106-04010, Uster.
www.intechopen.com
Woven Fabric EngineeringEdited by Polona Dobnik Dubrovski
ISBN 978-953-307-194-7Hard cover, 414 pagesPublisher SciyoPublished online 18, August, 2010Published in print edition August, 2010
InTech EuropeUniversity Campus STeP Ri Slavka Krautzeka 83/A 51000 Rijeka, Croatia Phone: +385 (51) 770 447 Fax: +385 (51) 686 166www.intechopen.com
InTech ChinaUnit 405, Office Block, Hotel Equatorial Shanghai No.65, Yan An Road (West), Shanghai, 200040, China
Phone: +86-21-62489820 Fax: +86-21-62489821
The main goal in preparing this book was to publish contemporary concepts, new discoveries and innovativeideas in the field of woven fabric engineering, predominantly for the technical applications, as well as in thefield of production engineering and to stress some problems connected with the use of woven fabrics incomposites. The advantage of the book Woven Fabric Engineering is its open access fully searchable byanyone anywhere, and in this way it provides the forum for dissemination and exchange of the latest scientificinformation on theoretical as well as applied areas of knowledge in the field of woven fabric engineering. It isstrongly recommended for all those who are connected with woven fabrics, for industrial engineers,researchers and graduate students.
How to referenceIn order to correctly reference this scholarly work, feel free to copy and paste the following:
Eva Mouckova, Petr Ursiny and Petra Jiraskova (2010). Surface Unevenness of Fabrics, Woven FabricEngineering, Polona Dobnik Dubrovski (Ed.), ISBN: 978-953-307-194-7, InTech, Available from:http://www.intechopen.com/books/woven-fabric-engineering/surface-unevenness-of-fabrics