1 William D. Nordhaus Yale University Lecture for the Yale Climate Institute January 15, 2010 Slides...
37
1 William D. Nordhaus Yale University Lecture for the Yale Climate Institute January 15, 2010 Slides are available nordhaus.econ.yale.edu . Economic Perspectives on Climate Change
-
Upload
bryce-austin -
Category
Documents
-
view
236 -
download
0
Transcript of 1 William D. Nordhaus Yale University Lecture for the Yale Climate Institute January 15, 2010 Slides...

1
William D. NordhausYale University
Lecture for the Yale Climate InstituteJanuary 15, 2010
Slides are available nordhaus.econ.yale.edu .
Economic Perspectives on Climate Change

2
Outline of lecture
1. Some historical background 2. What are economic integrated assessment
models (IAM)?3. What are some insights from IAM?4. What are the issues in implementing international
climate agreements?

3
CO2 concentrations at Mauna Loa
310
320
330
340
350
360
370
380
390
60 65 70 75 80 85 90 95 00 05

4
2,000
1,600
1,200
800
400
1930 1940 1950 1960 1970 1980 1990 2000 2010
CO2 emissions US (millions tC/yr)

5
.6
.5
.4
.3
.2
.11930 1940 1950 1960 1970 1980 1990 2000 2010
CO2-GDP ratioTrend (-1.7 percent per year)
Trend in CO2 emissions relative to GDP, US

6
Instrumental record: global mean temperature index (°C)
-0.4
-0.2
0.0
0.2
0.4
0.6
0.8
1.0
1850 1875 1900 1925 1950 1975 2000
GISSHadleyUS NCDC
Tem
per
ature
anom
aly
(189
5-19
05 =
0)

IPCC AR4 Model Results: History and Projections
7

8
Projections and the paleoclimatic record
-12
-8
-4
0
4
8
-400,000 -300,000 -200,000 -100,000 0
Tem
per
ature
(20
00 =
0)
Years before present
Temperature record and projections to 2200, Vostok core, Antarctica

9
The Contribution of Economics:Integrated Assessment (IA) Models
What are IA models?These are models that include the full range of cause and effect in climate change (“end to end” modeling).
Major goals of IA models:Project trends in consistent manner Assess costs and benefits of climate policies Estimate the carbon price and efficient emissions
reductions for different goals

10
Fossil fuel usegenerates CO2
emissions
Carbon cycle: redistributes around
atmosphere, oceans, etc.
Climate system: change in radiative warming, precip,
ocean currents, sea level rise,…
Impacts on ecosystems,agriculture, diseases,
skiing, golfing, …
Measures to controlemissions (limits, taxes,
subsidies, …)
The emissions-climate-impacts-policy nexus:
The RICE-2009model

Fossil fuel usegenerates CO2
emissions
Now focus for a moment on the
details of:

Some detail on how output and emissions are generated
j j jt tt-1
j j jt tt-1
j j jt t t
Twelve regions (j = US, China, India, EU, Africa, ...)
1. Population exogenous: ΔL =L G
2. Total factor productivity exogenous: ΔA =A H
3. Production is Cobb-Douglas in A, L, K : Y =A K
jt
j j j jt t t t
2
α 1-αL
4. CO emissions are function of output, intensity, and carbon price (p)
λE =σ Y p
5. Carbon price is determined by Hotelling rents and carbon-pricing policy
6. National invest
jt
12
c j=1 t=1
j j jt t t
ment rate is endogenous and optimized per the Ramsey model,
over per capita consumption (c), and countries are combined using the "Negishi algorithm."
maxW = φ U(c ,L )R(t)
7. Curr
∞
ent version is solved on Excel -Solver, with approximately 155 lines per country.

The Impacts of Climate Change
The Copenhagen Accord, which recognized “the scientific view that the increase in global temperature should be below 2 degrees Celsius.”
Is this firmly based in “scientific” estimates of the impacts of climate change?
Facts on the ground:– Estimating impacts has been the most difficult part
of all climate science: house-to-house combat for analysts.
– Very scant empirical support for the 2 degree target
13

What will be the impacts by sector?
14
Impact ofIndusty
Climate policiesAdaptation
policiesClimate-change
impacts
Energy-intensive Large near termModerate
medium termModerate long
term
"Nature-intensive"
SmallModerate
medium termLarge long term
Other Small Small Small
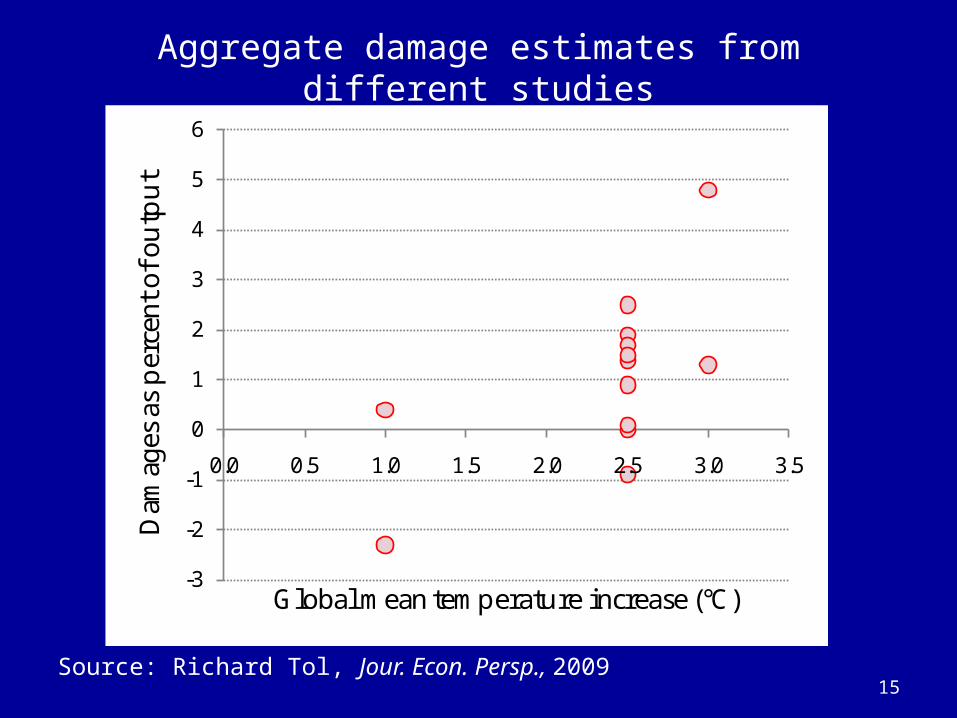
Aggregate damage estimates from different studies
Source: Richard Tol, Jour. Econ. Persp., 200915
-3
-2
-1
0
1
2
3
4
5
6
0.0 0.5 1.0 1.5 2.0 2.5 3.0 3.5
Dam
ages
as
per
cent
of o
utp
ut
Global mean temperature increase (°C)
16
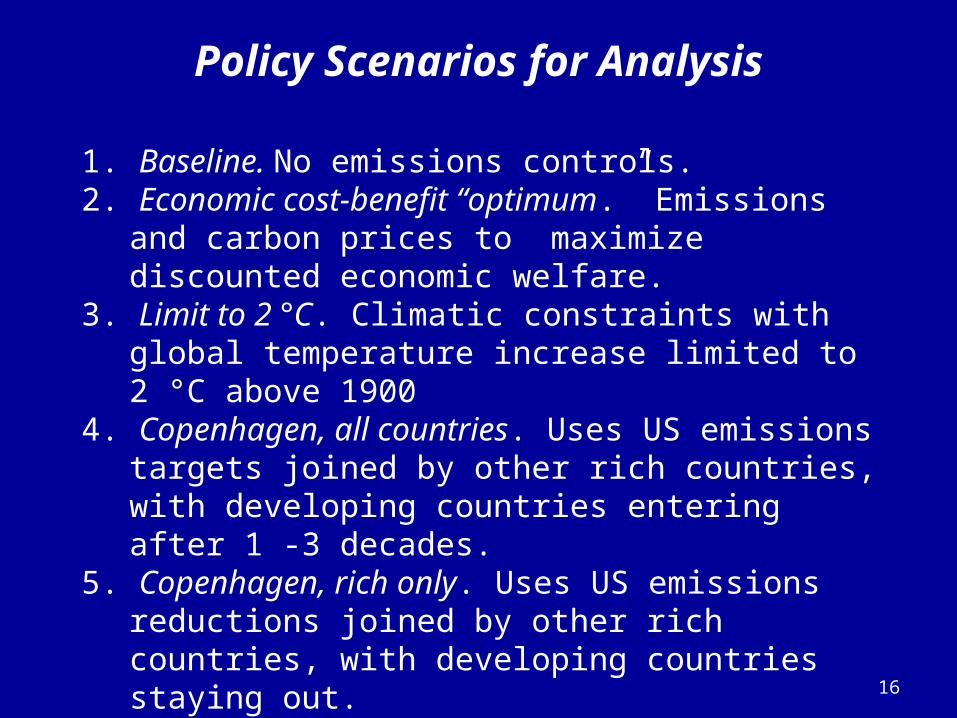
1. Baseline. No emissions controls.2. Economic cost-benefit “optimum.” Emissions
and carbon prices to maximize discounted economic welfare.
3. Limit to 2 °C. Climatic constraints with global temperature increase limited to 2 °C above 1900
4. Copenhagen, all countries. Uses US emissions targets joined by other rich countries, with developing countries entering after 1 -3 decades.
5. Copenhagen, rich only. Uses US emissions reductions joined by other rich countries, with developing countries staying out.
Policy Scenarios for Analysis
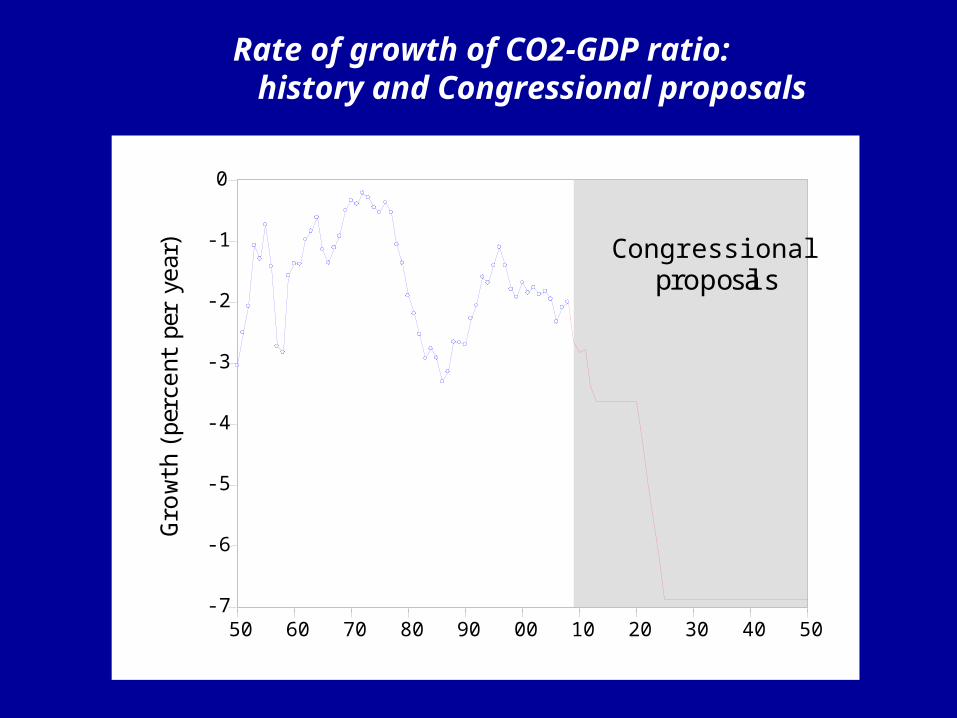
Rate of growth of CO2-GDP ratio: history and Congressional proposals
-7
-6
-5
-4
-3
-2
-1
0
50 60 70 80 90 00 10 20 30 40 50
Congressionalproposals
Gro
wth
(pe
rcen
t p e
r ye
ar)

Baseline projections: IPCC Scenarios and RICE-2009
18
RICE-2009Model with no policy measures

Temperature profiles: RICE -2009
19
0.0
1.0
2.0
3.0
4.0
5.0
6.0
2005 2025 2045 2065 2085 2105 2125 2145 2165 2185 2205
Glo
bal m
ean
tem
pera
ture
(deg
rees
C)
Optimal
Baseline
Lim T<2
Copen trade
Copen rich
Temperature
Available at http://www.econ.yale.edu/~nordhaus/homepage/RICEModelDiscussionasofSeptember30.htm

What do carbon prices mean in practice?
20
Carbon tax, 2010 Increase, price of energy, US
[$/tC] GasolineAll energy
expenditures
Minimal $10 1.0% 1.5%
“Optimal” 35 3.3% 5.4%
Climate constrained (ΔT < 2 °C)
50 4.8% 7.7%

Carbon prices for major scenarios
21
0
50
100
150
200
250
300
350
400
450
500
2005 2025 2045 2065 2085 2105
Car
bon
pric
e (2
005
$ pe
r ton
C)
Optimal
Lim T<2
Copen All Trade
Copen rich only
Global carbon price

Carbon prices for major scenarios
22
0
10
20
30
40
50
60
70
80
90
100
2005 2015 2025 2035
Car
bon p
rice
(200
5 $
per
ton C
)
Optimal
Lim T<2
Copen all
Copen rich only Actual equivalent global carbon price = $4 / tC

Carbon prices for major scenarios
23
0
10
20
30
40
50
60
70
80
90
100
2005 2015 2025 2035
Car
bon p
rice
(200
5 $
per
ton C
)
Optimal
Lim T<2
Copen all
Copen rich only
Actual equivalentglobal carbon price = $4/tC

24
Net impacts by region to 2050 of Copenhagen proposal
-350
-300
-250
-200
-150
-100
-50
0
50
100
US
EU
Japa
n
Russ
ia
Eura
sia
Chin
a
Indi
a
Mid
dle
East
Afric
a
Latin
Am
eric
a
OH
I
Oth
er
Net
ben
efit t
hrou
gh 2
050
(bill
ions
)

Final Question: How Should Policies Be Implemented
25

Major Policy Approaches for Global Warming
• Internationally harmonized carbon tax – economist’s ideal.
• Universal cap and trade – close second if well designed, but Kyoto Protocol is not doing well.
____________________________________________
• Regulatory substitutes (CAFE standards, ban on light bulbs, …) – very inefficient approaches
• Voluntary measures (carbon offsets) are difficult to calculate and verify and probably a useless diversion.
26

27
Harmonized Carbon Taxes
What are “harmonized carbon taxes”?• Raise prices of GHGs proportional to carbon
content• All countries would levy a comparable tax• Countries would retain all revenues (this is not an
international transfer program)
Hybrid plans:• Auction permits• Floor and cap on auction prices

Cap and trade v. Carbon taxes
The problems with cap-and-trade systems for climate change, particularly in the international arena, are insufficiently appreciated. Some concerns:
Quantity limits are troublesome in a world of differential economic growth and uncertain technological change because of the difficulty of resetting country limits.
28
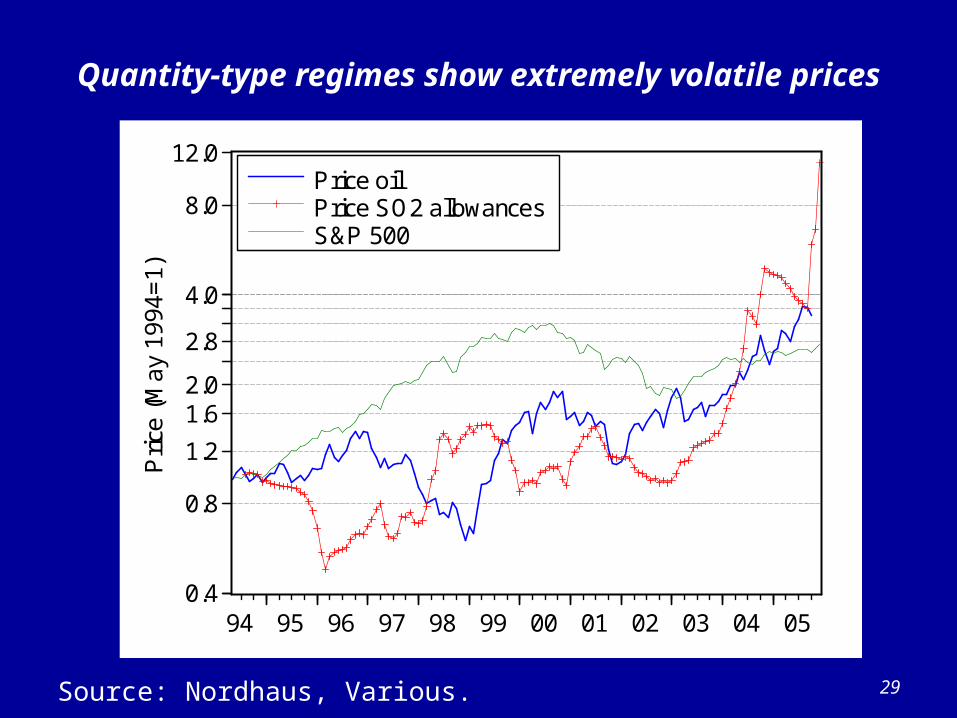
Quantity-type regimes show extremely volatile prices
0.4
0.8
1.2
1.62.0
2.8
4.0
8.0
12.0
94 95 96 97 98 99 00 01 02 03 04 05
Price oilPrice SO2 allowancesS&P 500
Pric
e (M
ay 1
994=
1)
29Source: Nordhaus, Various.

30
0
4
8
12
16
20
80 81 82 00 01 02 03 04 05 06 07 08
Federal funds rateThree-month Treasury bill rate
Period ofquantitativemonetarypolicy
Period of price-typemonetary policy
Financial volatility under quantity-and price-type monetary regimes
31
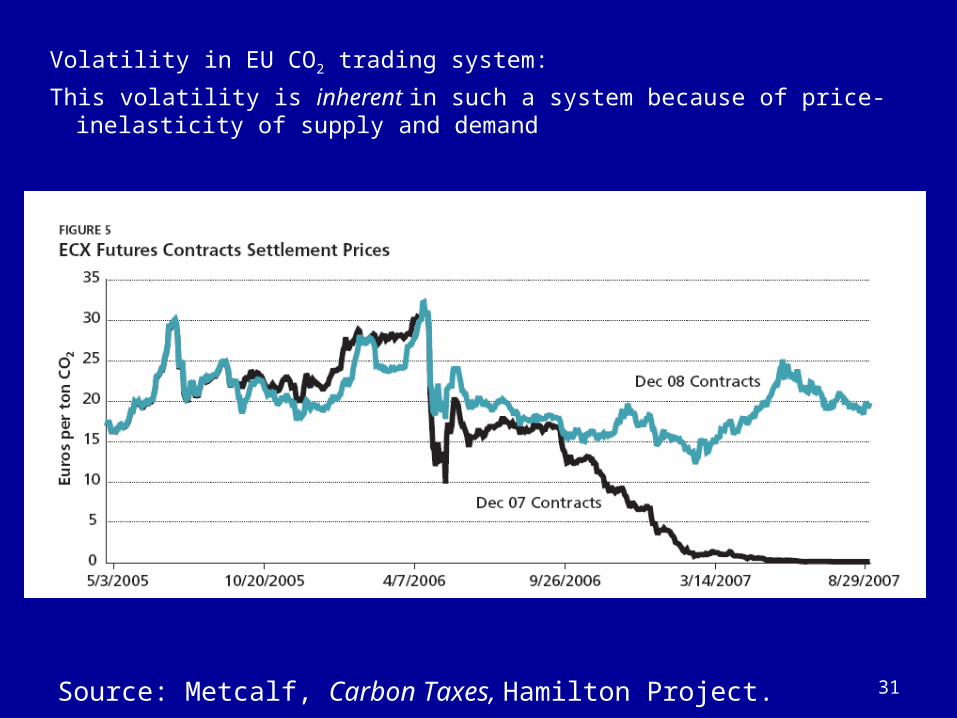
Volatility in EU CO2 trading system:
This volatility is inherent in such a system because of price-inelasticity of supply and demand
Source: Metcalf, Carbon Taxes, Hamilton Project.

It is important for governments to capture the revenues (either through 100% auctions or taxes): – raise revenues for distributional policies – reduce the efficiency losses from taxation.
32

33
Cap and trade systems are not attractive regimes for countries to join.
Fraction of Global Emissions Covered by KP
0%
20%
40%
60%
80%
100%
1990 2002
With US
Without US
Enthusiasts
Corruption
Quantity-type systems with international trading are much more susceptible to corruption than price-type regimes.
International cap-and-trade plans are a three-sided game. There are strong incentives for a corrupt domestic government to collude with corrupt polluting firms to underestimate domestic emissions and hide from international monitors.
34

The problem of offsets
Offsets have been part of all plans.Clean Development Mechanism (CDM) in the Kyoto
Protocol has been major source of “accounting emissions” and has very questionable additionality.
For example, in EU-ETS, there have been virtually no internal emissions reductions. The Clean Development Mechanism in EU has 280 million tons of offsets compared to 130 million tons of emissions reductions for current phase.
Another set of defective financial instruments like credit default swaps?
35

The Perils of the Current Regime
• The international cap-and-trade program is a radical and unproven approach, whereas taxes are well understood and have been used in every country of the world.
• To bet the world’s climate system and global environment on this untested approach which such clear structural flaws would appear a reckless gamble.
36

37
Final thoughts
“Mankind in spite of itself is conducting a great geophysical experiment, unprecedented in human history.” Roger Ravelle (1957)