1 Why NOW? Why This Could Be an Opportunity of a Lifetime! For Internal Broker/Dealer Use Only.
30
1 Why NOW? Why This Could Be an Opportunity of a Lifetime! For Internal Broker/Dealer Use Only
-
Upload
blaze-stewart -
Category
Documents
-
view
219 -
download
3
Transcript of 1 Why NOW? Why This Could Be an Opportunity of a Lifetime! For Internal Broker/Dealer Use Only.

1
Why NOW?
Why This Could Be anOpportunity of a Lifetime!
For Internal Broker/Dealer Use Only

2
Why NOW? It’s a Great Time for Clients to Invest and for You to Gather Assets!
• Opportunity & Historical Perspective– Record cash on the sidelines– Excellent market values– What happens after bear markets
• Our Fundamentals Are Right– Dollar cost averaging– Discipline– Diversification
• Resources for Confident Solutions
For Internal Broker/Dealer Use Only

3
• Legendary investor and mutual fund pioneer• Money magazine in 1999 called him "arguably the
greatest global stock picker of the century”
“Bull markets are born on pessimism, grow on skepticism, mature on
optimism, and die on euphoria.”
Sir John Templeton
For Internal Broker/Dealer Use Only

4
The Cycle of Market Emotions
OptimismOptimism
Excitement
Thrill
Euphoria
Anxiety
Denial
Fear
Desperation
Panic
Skepticism
Hope
Relief
Capitulation
“Temporary set back — I’m a long-term
investor.”“Wow,
am I smart!”
Point of Maximum Financial Opportunity
Point of Maximum Financial Risk
“How could I have been so wrong?”
Pessimism
“Bull markets are born on pessimism, grow on skepticism, mature on optimism, and die on euphoria.”— Sir John Templeton
For Internal Broker/Dealer Use Only

5
Result: Good Timing?
Van Kampen Investments Source: Strategic Insight as of 12/31/08 and Morningstar Advisor Workstation. Growth of $10,000 in S&P 500 assumes no withdrawals. The S&P 500, which is an unmanaged group of securities, is considered to be representative of the stock market in general. Because these indices are not managed portfolios, there are no advisory fees, taxes or internal management expenses reflected in their performance. If these were included, results would be lower. An investor cannot invest directly in an index.An investment in the money market fund is not insured or guaranteed by the Federal Deposit Insurance Corporation or any other government agency. Although a money market fund seeks to preserve the value of your investment at $1.00 per share, it is possible to lose money by investing in one. Stocks are more volatile than money market funds.
0
5,000
10,000
15,000
Dec-98 Dec-00 Dec-02 Dec-04 Dec-06 Dec-08
MM Assets as % of total mutual fund assets Average MM Assets as % of total mutual fund assets over time S&P 500 Index
Growth of $10,000 in S&P 500 Index vs. Money Market Assets
S&P 500 Bottom and Start of Bull Market
20
25
30
35
40 MM Asset PeaksMoving to cash may mean missing out when the market eventually rebounds.
(%)
For Internal Broker/Dealer Use Only
6
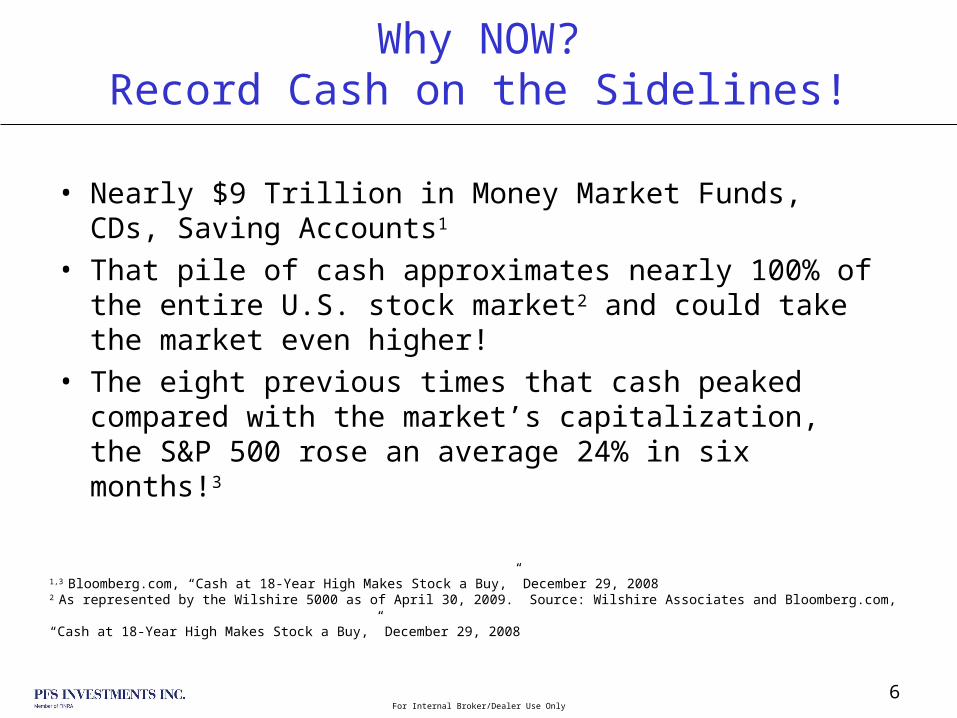
Why NOW?Record Cash on the Sidelines!
• Nearly $9 Trillion in Money Market Funds, CDs, Saving Accounts1
• That pile of cash approximates nearly 100% of the entire U.S. stock market2 and could take the market even higher!
• The eight previous times that cash peaked compared with the market’s capitalization, the S&P 500 rose an average 24% in six months!3
1,3 Bloomberg.com, “Cash at 18-Year High Makes Stock a Buy,” December 29, 20082 As represented by the Wilshire 5000 as of April 30, 2009. Source: Wilshire Associates and Bloomberg.com, “Cash at 18-Year High Makes Stock a Buy,” December 29, 2008
For Internal Broker/Dealer Use Only

7
Why NOW?It’s a Buying Opportunity of a Lifetime!
“Bad news is an investor’s best friend. It lets you buy a slice of America’s future at a marked-down price.” – Warren Buffett
• Stocks haven’t been this cheap in six years. As of June 1, 2009, the S&P is down nearly 40% from it’s all time high!4
• Record Cash + Great Market Value = Market Explosion to the Upside
4 S&P reached its current high at 1565.15 on 10/09/07. As of 06/1/09, the S&P 500 was at 942.87.
For Internal Broker/Dealer Use Only

8
• One of the world’s most successful investors and largest shareholder and CEO of Berkshire Hathaway.
• Estimated net worth: $40 Billion
“I’m fearful when others are greedy, and greedy
when others are fearful.”
Warren Buffett
For Internal Broker/Dealer Use Only
9
• Legendary Wall Street investor
• Financial advisor to governors and U.S. Presidents
• Compounded an initial investment of $100,000 in the late 1940s into more than $900 million by the early 1990s.
“You make most of your money in a bear market, you just
don’t realize it at the time.”
Shelby Cullom Davis
For Internal Broker/Dealer Use Only
10
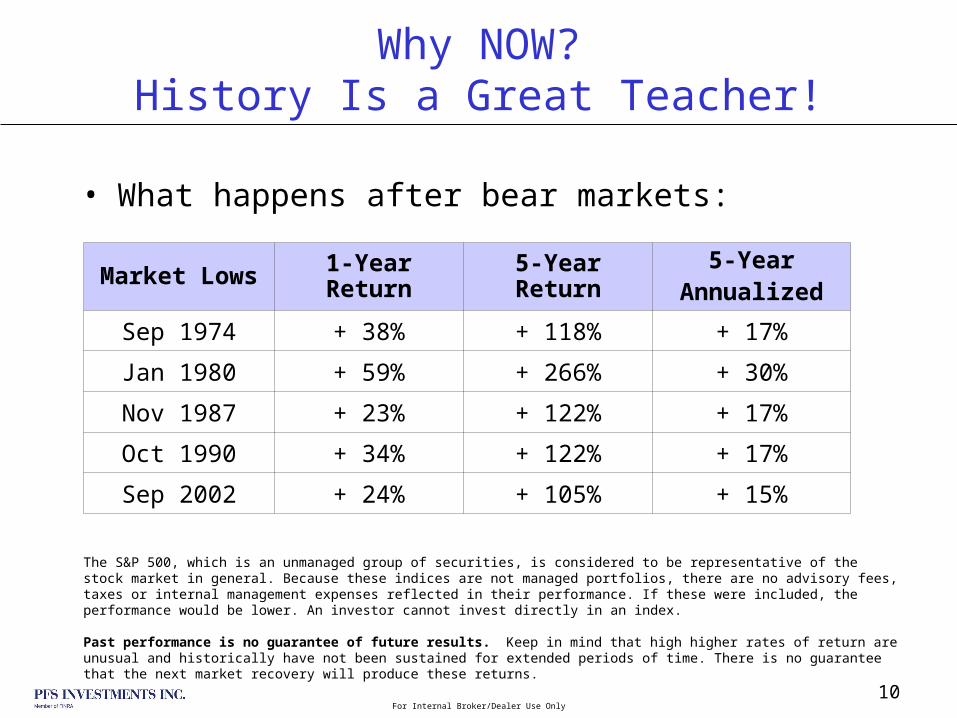
Why NOW?History Is a Great Teacher!
• What happens after bear markets:
Market Lows
1-Year Return
5-Year Return
5-YearAnnualized
Sep 1974 + 38% + 118% + 17%
Jan 1980 + 59% + 266% + 30%
Nov 1987 + 23% + 122% + 17%
Oct 1990 + 34% + 122% + 17%
Sep 2002 + 24% + 105% + 15%
The S&P 500, which is an unmanaged group of securities, is considered to be representative of the stock market in general. Because these indices are not managed portfolios, there are no advisory fees, taxes or internal management expenses reflected in their performance. If these were included, the performance would be lower. An investor cannot invest directly in an index.
Past performance is no guarantee of future results. Keep in mind that high higher rates of return are unusual and historically have not been sustained for extended periods of time. There is no guarantee that the next market recovery will produce these returns.
For Internal Broker/Dealer Use Only

11
“Let me be clear on one point, I can’t predict the short-term movements of the stock market. I haven’t the faintest idea as to whether stocks will be higher or lower a month – or a year – from now.
“What is likely, however, is that the market will move higher, perhaps substantially so, well before either sentiment or the economy turns up.”
Warren Buffett:
For Internal Broker/Dealer Use Only
12
“If you wait for the robins, spring will be over.”
— Warren Buffett
Why NOW?You Don’t Want to Miss It!
For Internal Broker/Dealer Use Only

13
We’ve Been Here Before…
“History provides a crucial insight regarding market crises:
They are inevitable, painful, and ultimately surmountable.”
- Shelby Cullom Davis
For Internal Broker/Dealer Use Only

14
Invest with your head, not the headlines
There have been plenty of reasons not to invest in the stock market over the years, but for the long-term investors, the results have generally been positive over time.
This chart illustrates an investment in the S&P 500 total return index. An investor cannot invest directly in an index. See endnote 1 for further details.
For Internal Broker/Dealer Use Only

15
Source: Morningstar. Past performance is no guarantee of future results. This chart is for illustrative purposes and does not represent an actual investment. The returns do not reflect the past or future performance of any specific investment. All investments involve risk including loss of principal. The figures in the chart above assume reinvestments of dividends and do not reflect any fees, expenses or tax consequences. See endnote 3 for further details.
Average Annual Total Return: 10.99%
Do you see how, over time, you can achieve your investing goals regardless of the headlines? ??
Invest with your head, not the headlines
1978 1979 1980 1981 1982 1983 1984 1985 1986 1987
$Market Value 10,657 12,640 16,749 15,924 19,355 23,721 25,209 33,208 39,406 41,475
Total %Return 6.57 18.61 32.50 -4.92 21.55 22.56 6.27 31.73 18.67 5.25
Events Cambodia Three Mile Inflation Reagan Recession Unemploy- Iran/Iraq Deficit Libya BlackMassacres Island Shot ment Monday
1988 1989 1990 1991 1992 1993 1994 1995 1996 1997
$Market Value 48,363 63,687 61,710 80,511 86,645 95,378 96,638 132,952 163,478 218,020
Total %Return 16.61 31.69 -3.10 30.47 7.62 10.08 1.32 37.58 22.96 33.36
Events Insider Market Airline Gulf Bosnian WTC Rate Oklahoma Budget TalibanTrading Crash Bankruptcy War War Bombing Hikes City Crisis Take Kabul
1998 1999 2000 2001 2002 2003 2004 2005 2006 2007 2008
$Market Value 280,327 339,312 308,419 271,761 211,701 272,426 302,071 316,909 366,962 387,123 228,858
Total %Return 28.58 21.04 -9.10 -11.89 -22.10 28.68 10.88 4.91 15.79 5.49 -37.00
Events Asian Market Y2K Tech Terrorism Accounting Iraq Tsunami Katrina Gas Mortgage FinancialCrash Fears Stocks Fall Scandals Prices Crisis Crisis
For Internal Broker/Dealer Use Only
16
Why NOW?Our Fundamentals Are Right!
• Dollar cost averaging
• Discipline
• Diversification
For Internal Broker/Dealer Use Only

17
Dollar Cost Averaging: A Proven Method Systematic Investing allows you to use dollar-cost averaging to build wealth over the long term.
Dollar-cost averaging is a technique for lowering the average cost per share over time. While a continuous program of dollar-cost averaging can reduce cost per share over time, it cannot assure a profit or protect against loss in declining markets. Since dollar-cost averaging involves continuous investments over time, the investor should consider his or her financial ability to continue purchases through low price levels. The values shown are hypothetical, not intended to reflect any specific market period but to demonstrate the effect of a fluctuating market.
Do you see the benefit of dollar-cost averaging???
Investor A: Rising Market
#Shares Accumulated ...................... 99.60
Average Cost Per Share ............ $12.00
Amount Invested .................. $1,200
Average Cost Per Share ............ $12.0025.00 Shares
20.00 Shares
16.68 Shares
14.28 Shares
12.52 Shares
11.12 Shares
$18
$0
$2
$4
$6
$8
$10
$12
$14
$16
$18
$20
Month 1$200
Month 2$200
Month 3$200
Month 4$200
Month 5$200
Month 6$200
A
25.00 Shares
20.00 Shares
16.68 Shares
14.28 Shares
12.52 Shares
11.12 Shares
$18
$0
$2
$4
$6
$8
$10
$12
$14
$16
$18
$20
Month 1$200
Month 2$200
Month 3$200
Month 4$200
Month 5$200
Month 6$200
25.00 Shares
20.00 Shares
16.68 Shares
14.28 Shares
12.52 Shares
11.12 Shares
$18
$0
$2
$4
$6
$8
$10
$12
$14
$16
$18
$20
Month 1$200
Month 2$200
Month 3$200
Month 4$200
Month 5$200
Month 6$200
A
25.00 Shares
40.00Shares
66.68Shares
100.00Shares
50.00Shares
25.00Shares
$8
$0
$2
$4
$6
$8
$10
$12
$14
$16
$18
$20
Month 1$200
Month 2$200
Month 3$200
Month 4$200
Month 5$200
Month 6$200
B
25.00 Shares
40.00Shares
66.68Shares
100.00Shares
50.00Shares
25.00Shares
$8
$0
$2
$4
$6
$8
$10
$12
$14
$16
$18
$20
Month 1$200
Month 2$200
Month 3$200
Month 4$200
Month 5$200
Month 6$200
25.00 Shares
40.00Shares
66.68Shares
100.00Shares
50.00Shares
25.00Shares
$8
$0
$2
$4
$6
$8
$10
$12
$14
$16
$18
$20
Month 1$200
Month 2$200
Month 3$200
Month 4$200
Month 5$200
Month 6$200
BInvestor B: Fluctuating Market
#Shares Accumulated ..................... 306.68
Average Cost Per Share ............. $4.00
Amount Invested .................. $1,200
Average Cost Per Share .............. $4.00
For Internal Broker/Dealer Use Only
18
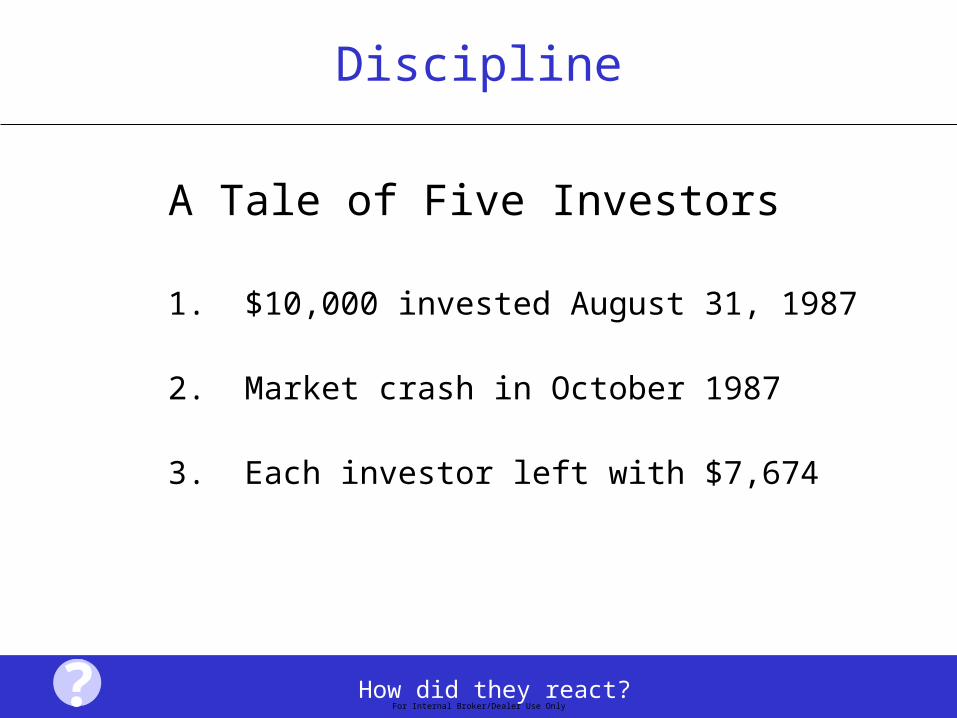
A Tale of Five Investors
1. $10,000 invested August 31, 1987
2. Market crash in October 1987
3. Each investor left with $7,674
How did they react???
Discipline
For Internal Broker/Dealer Use Only

19
A Tale of Five Investors
This chart illustrates a hypothetical investment of $10,000 in the S&P 500 total return index. An investor cannot invest directly in an index. See endnote 2 for more details. Ending amounts as of December 31, 2008, based on five different actions taken on October 31, 1987.
Past performance is no guarantee of future results. This chart is for illustrative purposes, does not represent an actual investment, and the returns do not reflect the past or future performance of any specific investment. Investments in mutual funds involve risk including loss of principal. The figures in the chart above assume reinvestments of dividends and do not reflect any fees, expenses or tax consequences.
Outcomes for each of the five investors as of the end of 2008:
$7,674Investor 1sold the investment and putthe money under a mattress.
$18,915Investor 2sold the investment and put themoney into a money market fund.
$44,561Investor 3held on to the investment,but did not begin theirmonthly investment program.
$176,801Investor 4sold the investment, reinvested the amount in a money market fund and began to invest $416 each month.
$246,646Investor 5held tight and started toinvest $416 each month.
How did they react??? For Internal Broker/Dealer Use Only

20
Diversification is a time-tested principle.
Spread out your investment dollars to protect against market risk.
What is the ideal asset mix???
Source: Morningstar. Past performance is no guarantee of future results. This chart is for illustrative purposes only and does not represent an actual investment or the performance of any specific investment. All investments involve risk including loss of principal. See endnote 3 for specifics regarding asset classes.
For Internal Broker/Dealer Use Only

21
Put Time on Your SideTap the Power of Stocks
Long-term, stocks have historically provided the best chance to achieve growth.Growth of $10,000 invested in stocks versus fixed income and cash over two decades, 1989-2008Based on average annual returns, December 31, 1988 – December 31, 2008
• Stocks, though more volatile, generated the highest level of return.
• Fixed Income delivered relatively steady returns — but with far lower growth overall.
• Cash may offer security, but at a price: the lowest level of growth.
• Inflation, which reduces the real value of investments, is always a concern. $10,000
$20,000
$30,000
$40,000
$50,000
$60,000
$70,000
$80,000
$90,000
1988
1989
1990
1991
1992
1993
1994
1995
1996
1997
1998
1999
2000
2001
2002
2003
2004
2005
2006
2007
2008
$50,420
$41,923
$22,559$17,629
Legg Mason Source: Lipper LANA. Past performance is no guarantee of future results. This chart is for illustrative purposes only and does not represent an actual investment or the performance of any specific investment. The chart represents growth of three hypothetical investments, including unmanaged indices in which investors cannot directly invest. See endnote 4 for more details.
For Internal Broker/Dealer Use Only
22
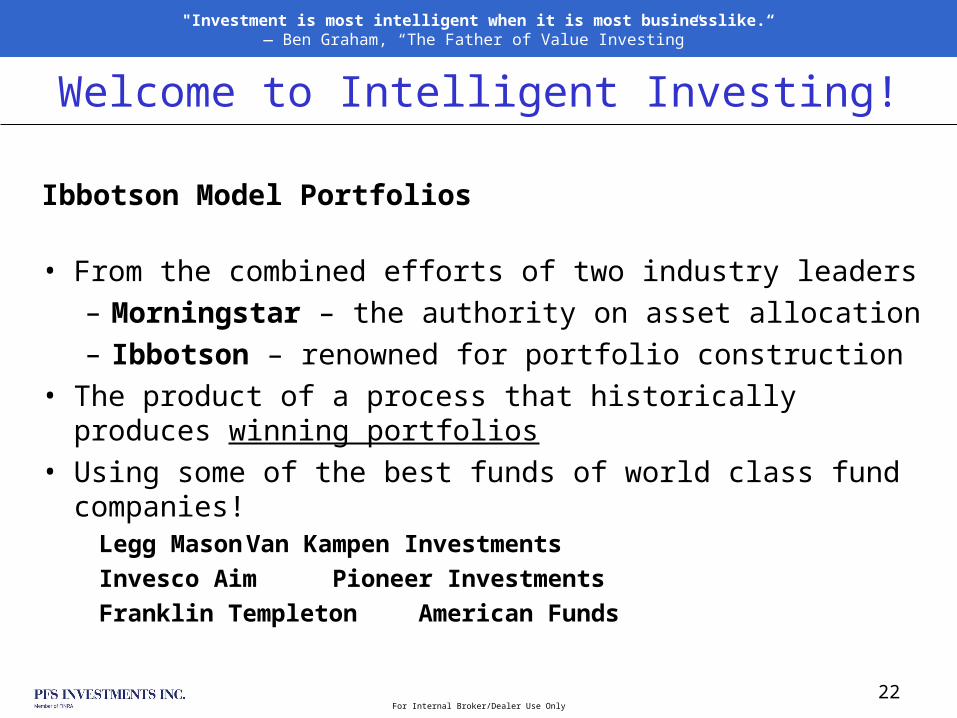
Welcome to Intelligent Investing!
"Investment is most intelligent when it is most businesslike.“— Ben Graham, “The Father of Value Investing”
Ibbotson Model Portfolios
• From the combined efforts of two industry leaders– Morningstar – the authority on asset allocation– Ibbotson – renowned for portfolio construction
• The product of a process that historically produces winning portfolios
• Using some of the best funds of world class fund companies!
Legg Mason Van Kampen Investments Invesco Aim Pioneer Investments Franklin Templeton American Funds
For Internal Broker/Dealer Use Only

23
When compared to the S&P 500’s 1, 3, 5 & 10 year averages:
• Ibbotson Model Portfolios provided higher performance 98% of the time!
• Ibbotson Model Portfolios provided less volatility 79% of the time!
Sell With Confidence!
“Risk comes from not knowing what you're doing.” — Warren Buffett
Source – PFS Investments / Morningstar / Ibbotson - comparison included Moderate Growth, Growth & Aggressive Growth Model Portfolios as of May 31, 2009
For Internal Broker/Dealer Use Only

24
Now Is the Time to Lead the Charge!Have Confidence Across the KT!
• For our Clients in the accumulation phase– Asset Management brochure/presentation
• Gets them comfortable, confident and motivated to invest!
• For our clients nearing retirement– Investing at Retirement brochure/presentation
• Gets the client thinking realistically about retirement
– Retirement Income Calculator• Answers the most important question of our
time, “Will your savings last a lifetime?”
For Internal Broker/Dealer Use Only
25
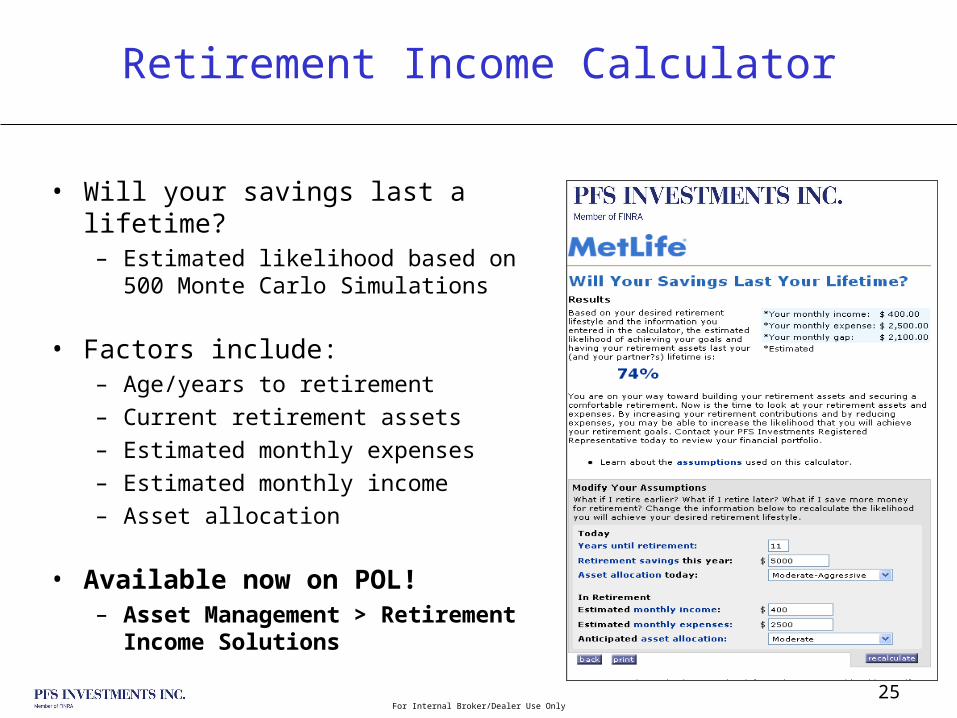
Retirement Income Calculator
• Will your savings last a lifetime?– Estimated likelihood based on 500
Monte Carlo Simulations
• Factors include:– Age/years to retirement– Current retirement assets– Estimated monthly expenses– Estimated monthly income– Asset allocation
• Available now on POL!– Asset Management >
Retirement Income Solutions
For Internal Broker/Dealer Use Only

26
Most of the Time There Will Be a Shortfall
• What are their options?
– Save more
– Spend less
– Work longer
– Work part-time with Primerica
• An excellent recruiting tool for this market segment
For Internal Broker/Dealer Use Only

27
Confidence in Our Solutions
• Mutual Funds – World Class Partners
• Variable Annuities– MetLife
• PrimElite IV• Cutting edge annuity with Living Benefits*
• Long Term Care– Genworth Financial
• Privileged Choice & Classic Select
*Guarantees are backed by the claims paying ability and the financial strength of the issuing insurance company.
For Internal Broker/Dealer Use Only

28
Why NOW?It’s the ULTIMATE Asset Gathering Time!
Record Cash on the Sidelines
+ Buying Opportunity of a Lifetime
+ Confidence in Our Solutions
= Primerica Leading the Charge!
For Internal Broker/Dealer Use Only

29
You want to be on the train on the way UP!!! Don’t miss it!
For Internal Broker/Dealer Use Only

30
Endnotes1. The Standard & Poor ’s 500 ®, which is an unmanaged group of securities, is considered to be representative of the stock market in general. The data assumes reinvestment of all income and does not account for taxes or transaction costs. Because these indices are not managed portfolios, there are no advisory fees or internal management expenses reflected in their performance and investors cannot invest directly in any index.
2. Source: PFS Investments Inc. and Morningstar. The chart above illustrates a hypothetical investment of $10,000 invested in the S&P 500 TR Index on August 31,1987,near the market high, and then the subsequent financial impact of various investment strategies on a portfolio implemented on October 31,1987, after the market crash on October 19,1987 through December 31, 2008. Investors 4 & 5’s monthly contributions began November 30,1987. The Standard & Poor ’s 500 ®, which is an unmanaged group of securities, is considered to be representative of the stock market in general. An investor cannot invest directly in an index. Systematic investing cannot assure a profit or protect against loss in declining markets. Since systematic investing involves continuous investments over time regardless of fluctuating price levels, the investor should consider his or her ability to continue to invest in periods of low price levels. A money market fund is an investment company that invests in commercial paper, banker’s acceptances, repurchase agreements, government securities, certificates of deposit and other highly liquid securities, and pays money market rates of interest. Money markets are not FDIC-insured, may lose money, and are not guaranteed by a bank or other financial institution. Although the money market seeks to preserve a stable per share value (i.e., $1.00 per share), it is possible to lose money by investment in the fund. Principal value and investment returns will fluctuate and, when redeemed, may be worth more or less than the original investment amount.
3. Small Company Stocks — Dimensional Fund Advisors, Inc. (DFA) U.S. Micro Cap Portfolio; Large Company Stocks — Standard & Poor ’s 500 ®, which is an unmanaged group of securities, is considered to be representative of the stock market in general; Long-Term Government Bonds — 20-year U.S. Government Bond; Treasury Bills — 30-day U.S. Treasury Bill; International Stocks — Morgan Stanley Capital International Europe, Australasia, and Far East (EAFE) Index. Government bonds and Treasury bills are guaranteed by the full faith and credit of the United States government as to the timely payment of principal and interest, while stocks are not guaranteed and have been more volatile than the other asset classes. Furthermore, small company stocks are more volatile than large company stocks and are subject to significant price fluctuations, business risks and are thinly traded. International investments involve special risks such as fluctuations in currency, foreign taxation, economic and political risks, liquidity risks and differences in accounting and financial standards. The data assumes reinvestment of all income and does not account for taxes or transaction costs. Because these indices are not managed portfolios, there are no advisory fees or internal management expenses reflected in their performance and investors cannot invest directly in any index.
4. Source: Lipper LANA. Past performance is no guarantee of future results. This chart is for illustrative purposes only and does not represent an actual investment or the performance of any specific investment. The chart represents growth of three hypothetical investments, including unmanaged indices in which investors cannot directly invest. Figures do not reflect any fees, expenses or tax consequences, and assume no withdrawals. Stocks are measured by the S&P 500, an unmanaged index of 500 stocks that is generally representative of the performance of larger companies in the U.S. Fixed Income is measured by the Barclays Capital U.S. Aggregate Index, a broad-based bond index comprised of government, corporate, mortgage and asset-backed issues, rated investment grade or higher, and having at least one year to maturity. Prior to November 2008, the Barclays Capital Aggregate Index operated under the name Lehman Brothers U.S. Aggregate Index. Cash is represented by the U.S. Domestic 91-day T-Bill Index. Inflation is represented by the Consumer Price Index, which measures the average change in U.S. consumer prices over time in a fixed market basket of goods and services determined by the U.S. Bureau of Labor Statistics.
WN/39230/09SEC122-2/6.09/v1.0For Internal Broker/Dealer Use Only