1 When we free ourselves of desire, we will know serenity and freedom.
32
1 When we free ourselves of desire, we will know serenity and freedom.
-
Upload
jason-green -
Category
Documents
-
view
213 -
download
0
Transcript of 1 When we free ourselves of desire, we will know serenity and freedom.

1
When we free ourselves of desire, we will know serenity and freedom.

2
Inferences about One Population Mean
Estimation: z interval and t intervalStatistical tests: z test and t test

3
Estimation
To estimate a numerical summary in population (parameter):
Point estimator — A (same) numerical summary in sample; a statistic
Interval estimator — a “random” interval which includes the parameter most of time

Example: Serum Cholesterol Level
Population: all 20- to 74-year-old male smokers in the U.S.
X: serum cholesterol level Distribution: normal with unknown mean Sample: 12 randomly selected male smokers
with mean Question: what is the mean serum cholesterol
level of adults U.S. male smokers?
4
mlmgx 100/217

5
Confidence Interval
),...,(ˆˆ1 nLL YY ),...,(ˆˆ
1 nLL YY
),...,(ˆˆ1 nLL XX
),...,(ˆˆ1 nUU XX
Ideally, a short interval with high confidence interval is preferred.

6

7
Estimation for
Point estimator: Confidence interval
– Normality with known or large sample (n > 30) : interval
– Normality with unknown t interval
n
stx 2/
nzx
2/
x

The t distribution
The distribution of t, the standardized sample mean with estimated standard deviation for a normal population
8
ns
xt
/

9

10
One Population

11
Sample Size for Estimating
2
222/ )(
E
zn
Where E is the largest tolerable error.
if is unknown, use s from prior data or the upper bound of

Hypothesis Test
The null hypothesis:
The alternative hypothesis:
Question: Should we reject or not reject Ho?
12
mlmgH 100/211: 00
mlmgH a 100/211:

13
The Logic of Hypothesis Test
“Assume the null hypothesis Ho is a (possible) truth until proven false”
Analogical to
“Presumed innocent until proven guilty”
The logic of the US judicial system

Rejection Region
When the observed test statistic is too “extreme” under Ho (i.e. in the opposite direction of Ho), the Ho should be rejected
Rejection Region is the region when the observed test statistic falls in, we will reject Ho
A test result is determined by its rejection region, while rejection region is determined by the significance level
14

15
Good!Good!(Correct!)(Correct!)
H0 true H0 false
Type II Type II Error, or Error, or ““ Error” Error”
Type I Type I Error, or Error, or ““ Error” Error”
Good!Good!(Correct)(Correct)
we accept H0
we reject H0
Types of Errors

Terms
Type I error rate = probability of incorrectly rejecting Ho
Type II error rate = probability of incorrectly accepting Ho
Significance level is the pre-set largest tolerable level
Power = probability of correctly rejecting Ho = 1-
16

17
Z Test Statistic
For normal populations or large samples (n > 30):
And the computed value of Z is denoted by Z*.
n
xxZ
x /00

18
Types of Tests

19
Types of Tests

20
Types of Tests

21
Example: Serum Cholesterol Level
Assuming the population S.D. is 46 mg/100ml, conduct the test at 5 % level
What is the power of the test at the true 221 mg/100ml?

22

23
Steps in Hypothesis Test
1. Set up the null (Ho) and alternative (Ha) hypotheses
2. Find an appropriate test statistic (T.S.)
3. Find the rejection region (R.R.)
4. Reject Ho if the observed test statistic falls in R.R.
5. Report the result in the context of the situation

24
t Test Statistic
For normal populations with unknown
the same formula for Z but replacing by s
ns
xt
/0

25
One Population
26
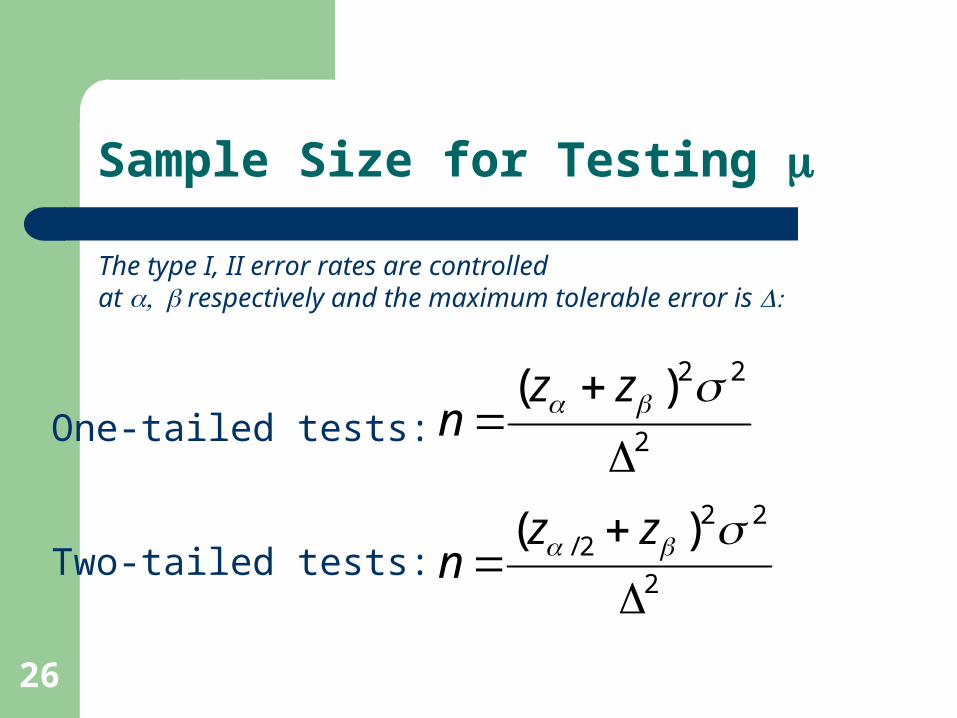
Sample Size for Testing
2
22)(
zz
n
The type I, II error rates are controlled at respectively and the maximum tolerable error is
2
222/ )(
zz
n
One-tailed tests:
Two-tailed tests:

27
P-value
p-value is the probability of seeing what we observe as far as (or further) from Ho (in the direction of Ha) given Ho is true; the smallest level to reject Ho
p-value is computed by assuming Ho is true and then determining the probability of a result as extreme (or more extreme) as the observed test statistic in the direction of the Ha.
The smaller p-value is, the less likely that what we observe will occur given Ho is true.
Smaller p-value means stronger evidence against Ho.

28
Computing the p-Value for the Z-Test

29
Computing the p-Value for the Z-Test

30
Computing the p-Value for the Z-Test
P-value = P(|Z| > |z*| )= 2 x P(Z > |z*|)

31
Hypothesis Test using p-Value
1. Set up the null (Ho) and alternative (Ha) hypotheses
2. Find an appropriate test statistic (T.S.)
3. Find the p-value
4. Reject Ho if the p-value < 5. Report the result in the context of the
situation

32
Example: Serum Cholesterol Level
Assuming the population S.D. is 46 mg/100ml, conduct the test at 5 % level