
1 Wayne Leahy Outline Cognitive Load Theory (CLT) brief summary Research examples Current research...
35
1 Wayne Leahy Outline • Cognitive Load Theory (CLT) brief summary • Research examples • Current research experiment and directions
-
date post
18-Dec-2015 -
Category
Documents
-
view
213 -
download
0
Transcript of 1 Wayne Leahy Outline Cognitive Load Theory (CLT) brief summary Research examples Current research...

1
Wayne Leahy
Outline
• Cognitive Load Theory (CLT) brief summary • Research examples• Current research experiment and directions

2
CLT
Limited cognitive capacity in working memory (our consciousness) for new or novel information (Cowan, 2001; Miller, 1956)
Less if the information is complex

3
No element interaction
3 8 1
4 7 3 5 8 9
5 2 5 3 1 7 5 2 9 5 6

4
element interaction
24 X 5

5
24 X 5 = 120

6
432 X 7

7
432 X 7= 3024

8
23415 X 8

9
23415 X 8 = 187320

10
Excessive working memory loads can be generated during performance of complex tasks eg:-
• learning maths/science/language procedures • working within ICT eg visual-spatial displays both static and
animated (reading a timetable/graph) • learning how to use a computer spreadsheet
Redesigning of instructional material

11
Research
Studies in primary schools
Quantitative and some qualitative methods (verbal protocols “think alouds” / secondary task analysis)
Instructing/testing on a one to one basis
Moving on to more authentic? environments - whole class

12
Conducted published research in:-
Modality effect
Expertise reversal effect
Imagination effect (type of mental rehearsal-self explanation effect)
Split attention and redundancy effects
Instructional diagrams

13
Element interactivity
A B C D E F G H
1 2 3 4 5 6 7
Byron
St Albans
Stanton
Dandlee

14
Kent Street to Brown Street Timetable
Route Number 98 100 102 103 104 105 106 107 am am am am pm pm pm pm Bus Stop Kent St.
12.55
3.10
7.50
11.15 e
12.55
3.10 sco
7.50
11.15 e
Casey St. 1.20
3.35
8.15
1.20
3.35
8.15
Bell St. 1.45
4.00
8.45
1.45
4.00
8.45
Alt St. 2.15
4.30
9.10
pm 12.25
2.15
4.30
9.10
am 12.25
Main St. 2.35
4.50 sd
9.25
2.35
4.50 t
9.30
Beach St. 3.00
5.15
9.45
12.55
3.00 sc
9.55
12.55
White St.
3.15 5.30 10.00 1.10 3.15 10.10 1.10
Smith St.
3.20 5.35 10.05 1.15 3.20 10.15 1.15
Brown St.
4.00 6.05 10.45 1.55 sc
4.00 10.55 1.55

15
60
120 140
160
180
220
180
160
120 140
200
0 1 2 3 4 1cm = 1000cm
60 140
200
A B
E
2. The formula for finding the GRADIENT ratio is: H2 – H1
d where H2 – H1 = highest height less lowest height (of 2 points) and
d = horizontal distance between the two points The resultant fraction is then inverted and expressed as a ratio 1 : X
5. This means that for every 1m of height, you are travelling 112.5m horizontally. Remember this is only the average gradient but it is useful for surveyors.
3. WORKED EXAMPLE: What is the gradient ratio between points A and B? Gradient ratio = highest height less lowest height horizontal distance between the two points
9cm (9000m)
1. GRADIENTS can be calculated using contour maps. The GRADIENT is a ratio of each metre of land covered horizontally by each metre vertical rise in the land. In the ratio, the 1st number is the vertical rise and the 2nd number is the horizontal distance. For our instructions the numbers are always expressed as a 1 to X ratio (1:X). A gradient ratio is useful if it is known that a gradient of 1m vertical rise in a 40m horizontal distance (1: 40) is too steep for a train but a car could cope with one as steep as 1: 5.
4. = 80m 9000m
then invert = 9000m 80m = 112.5 = ratio of 1:112.5
= A 140m (H1) – 60m B (H2)

16
9am 10am 11am 12pm 1pm 2pm 3pm 4pm
36 35 34 33 32 31 30 29 28 27 26 25
Temperature (°C)
Time of Day
3. FIND FIRST DAY (Monday) AND READ TEMPERATURE: At 11am Monday (black line) it is 34°C.
4. FIND SECOND DAY (Tuesday) AND READ TEMPERATURE: At 11am Tuesday (red line) it is 25°C.
2. FIND TIME: On the time axis find 11am.
1. What are the temperatures on Monday and Tuesday at 11am?
LEGEND
Monday ______ Tuesday ________ Wednesday ______

17
Preliminary experiment extending previous studies on modality effect. Whole class basis.
Is it best to learn by:-
1. visual only (textbox ins.) presented graphs or
2. audio/visual (no textbox) presented graphs
while using a mental rehearsal strategy?

18
9am 10am 11am 12pm 1pm 2pm 3pm 4pm
36 35 34 33 32 31 30 29 28 27 26 25
Temperature (°C)
Time of Day
FIND TIME: On the time axis find 1pm.
LEGEND
Monday ______ Tuesday ________ Wednesday ______

19
9am 10am 11am 12pm 1pm 2pm 3pm 4pm
36 35 34 33 32 31 30 29 28 27 26 25
Temperature (°C)
Time of Day LEGEND
Monday ______ Tuesday ________ Wednesday ______

20
Methodology
Previous small pilot study (content/slide timing)
Participants: Twenty four Yr 6 randomly assigned to 2 groups of twelve
Both groups had a 10 minute presentation by PowerPoint

21
Pre-instructions on how to mentally rehearse
Series of slides including blanks with 4 sequenced worked examples
slide - blank - slide
Mentally rehearse in blank slide time

22
9am 10am 11am 12pm 1pm 2pm 3pm 4pm
36 35 34 33 32 31 30 29 28 27 26 25
Temperature (°C)
Time of Day
FIND TEMPERATURE: Follow across to the temperature axis which shows 30°C.

23
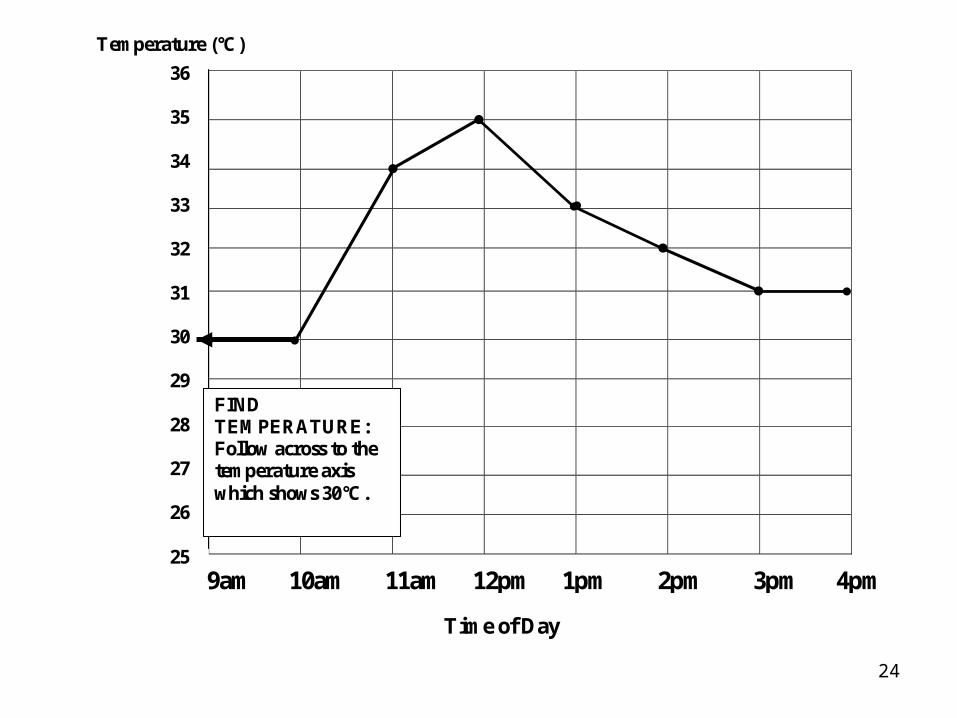
24
9am 10am 11am 12pm 1pm 2pm 3pm 4pm
36 35 34 33 32 31 30 29 28 27 26 25
Temperature (°C)
Time of Day
FIND TEMPERATURE: Follow across to the temperature axis which shows 30°C.

25
9am 10am 11am 12pm 1pm 2pm 3pm 4pm
36 35 34 33 32 31 30 29 28 27 26 25
Temperature (°C)
Time of Day
So at 10am it is 30°C.

26

27
9am 10am 11am 12pm 1pm 2pm 3pm 4pm
36 35 34 33 32 31 30 29 28 27 26 25
Temperature (°C)
Time of Day
So at 10am it is 30°C.

28
Instructions (worked examples) a mixture of higher and lower element interactivity content
Common pen and paper test of 15 questions (equal time)
7 tapping lower interactivity knowledge eg What temperature was it on Monday at 1pm?
8 tapping higher interactivity knowledgeeg At what time and what day was there a temperature of 34C before falling to 29C in 1 hr?

29
9am 10am 11am 12pm 1pm 2pm 3pm 4pm
36 35 34 33 32 31 30 29 28 27 26 25
Temperature (°C)
Time of Day Monday ______ Tuesday ________ Wednesday_______

30
Analysis of test results
(2 group X 2 element int) ANOVA with repeated measures on last factor
N = 24, n = 12
Sig. interaction F(1,22) = 10.60, p < .01
MSe = 223.76

31
A/V
Visual only
010
2030
4050
6070
8090
100
pe
rce
nta
ge
sco
re
Low int
High int
RESULTS
Yr 6 Interpreting a temperature graph using a mental rehearsal strategy
58% Vis H 33% A/v L

32
Visual Overall Mean: 72.9% Mean L 87.5% H 58.3% SD 11.9 25.4
A/V Overall Mean: 61.9% Mean L 90.6% H 33.3% SD 7.7 23.0
(High) F(22)= 6.35, MSE = 589.85, p =.019

33
• Before experiment hypothesis- not sure – a/v superior?
• Visual only better - auditory processing more difficult to mentally rehearse
• Auditory too long?
• Next experiment replicate and fragment sequence with shorter audio (and text) segments
• Difficult in all mental rehearsal experiments to evaluate strategy
• Collect verbal protocols
• A small sample
• Future research in the “testing effect” Mayer (2009)

34
Variation on the test effect from Mayer (2009)
worked examples group
worked examples + problems group
worked examples + imagination group

35
THANK YOU!
Questions or comments?


![Research Activities, Applications Prospects for CLT...SC5.T1_FIN_BGD_EN1995-1-1 34 pages [background.doc] chapter on CLT in a revised version of Eurocode 5: 2023 CLT_standardisation](https://static.fdocuments.net/doc/165x107/604ba4f76a2a9c1cff141915/research-activities-applications-prospects-for-clt-sc5t1finbgden1995-1-1.jpg)


