1 UV PHOTOFRAGMENTATION SPECTROSCOPY OF MODEL LIGNIN-ALKALI ION COMPLEXES: EXTENDING LIGNOMICS INTO...
18
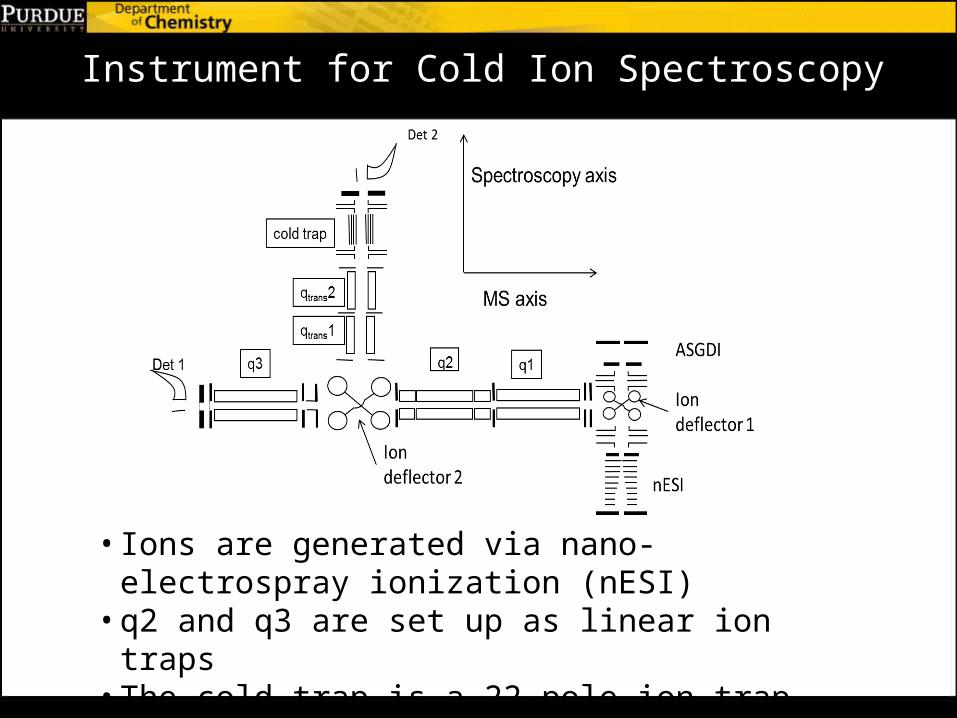
1 UV PHOTOFRAGMENTATION SPECTROSCOPY OF MODEL LIGNIN-ALKALI ION COMPLEXES: EXTENDING LIGNOMICS INTO THE SPECTROSCOPIC REGIME JACOB C. DEAN, NICOLE L. BURKE, JOHN R. HOPKINS, JAMES G. REDWINE, a BIDYUT BISWAS, P. V. RAMACHANDRAN, SCOTT A. MCLUCKEY and TIMOTHY S. ZWIER Department of Chemistry, Purdue University, West Lafayette, IN 47906-2084 U.S.A.; a Present address: Kalsec, Kalamazoo, MI 49006 U.S.A. Intensity(arb. units) 35600 35500 35400 35300 35200 35100 35000 34900 W avenum ber(cm -1 ) *
-
Upload
colin-black -
Category
Documents
-
view
219 -
download
1
Transcript of 1 UV PHOTOFRAGMENTATION SPECTROSCOPY OF MODEL LIGNIN-ALKALI ION COMPLEXES: EXTENDING LIGNOMICS INTO...
1
UV PHOTOFRAGMENTATION SPECTROSCOPY OF MODEL LIGNIN-ALKALI ION COMPLEXES: EXTENDING LIGNOMICS
INTO THE SPECTROSCOPIC REGIME
JACOB C. DEAN, NICOLE L. BURKE, JOHN R. HOPKINS, JAMES G. REDWINE,a BIDYUT BISWAS, P. V. RAMACHANDRAN, SCOTT A. MCLUCKEY and TIMOTHY S. ZWIER
Department of Chemistry, Purdue University, West Lafayette, IN 47906-2084 U.S.A.;
a Present address: Kalsec, Kalamazoo, MI 49006 U.S.A.
Inte
nsity
(arb
. uni
ts)
3560035500354003530035200351003500034900Wavenumber (cm
-1)
*
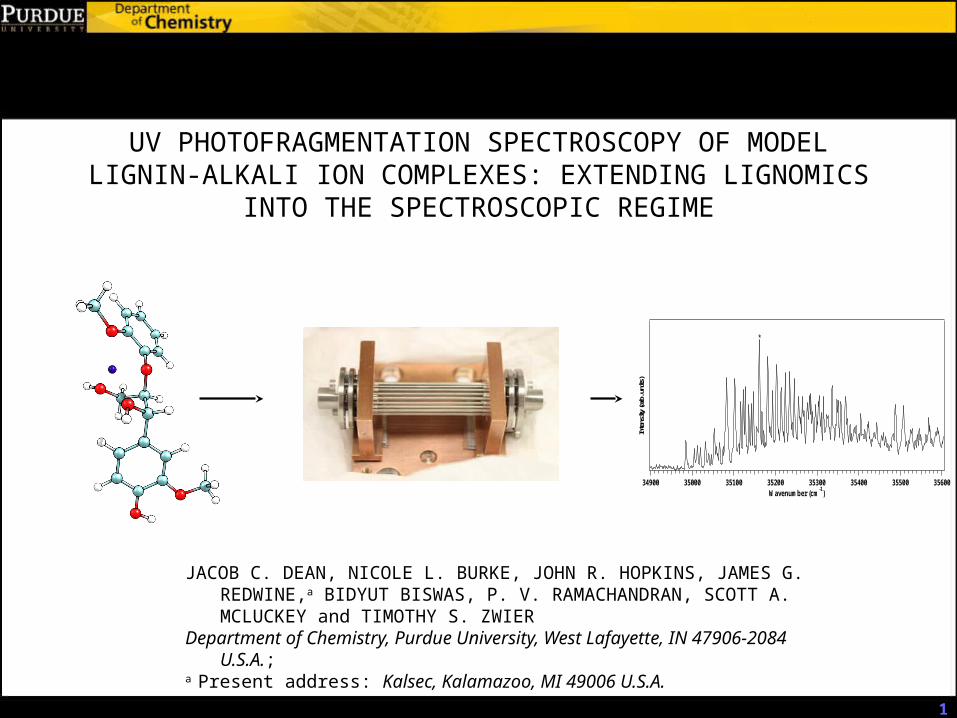
Lignin: Cell Wall Foundation
• Aromatic biopolymer concentrated in cell wall.
• “Lignomics” accomplished with tandem MS. Ionization accomplished with negative ESI or alkali metal complexation.
• Each monolignol is a natural chromophore, providing potential for UV spectroscopy.
p-Hydroxyphenyl
Guaiacyl
Syringyl
β-O-4
β- β
HO
OH
HO
OH
H3CO
HO
OH
H3CO
H3CO
HO
H3CO
OH
OH
O
H3CO
H3CO
HO
O
O
OH
OCH3
O
HO
OCH3
OCH3
OH
Vanholme, R, et. al. Plant Physiol. 2010, 153, 895-905
β-5
HO
OCH3
OH OH
O
H3CO
OH
OH
O
OCH3
O
O
OCH3
O
HO
OH
O
HO
OCH3
HO
Monolignols Dilignols Oligolignols
Dean,J, et al. Chem. Sci., 2014, 5, 1940-1955 Dean,J, et al. J. Chem. Phys, 2013, 139 , 144313.
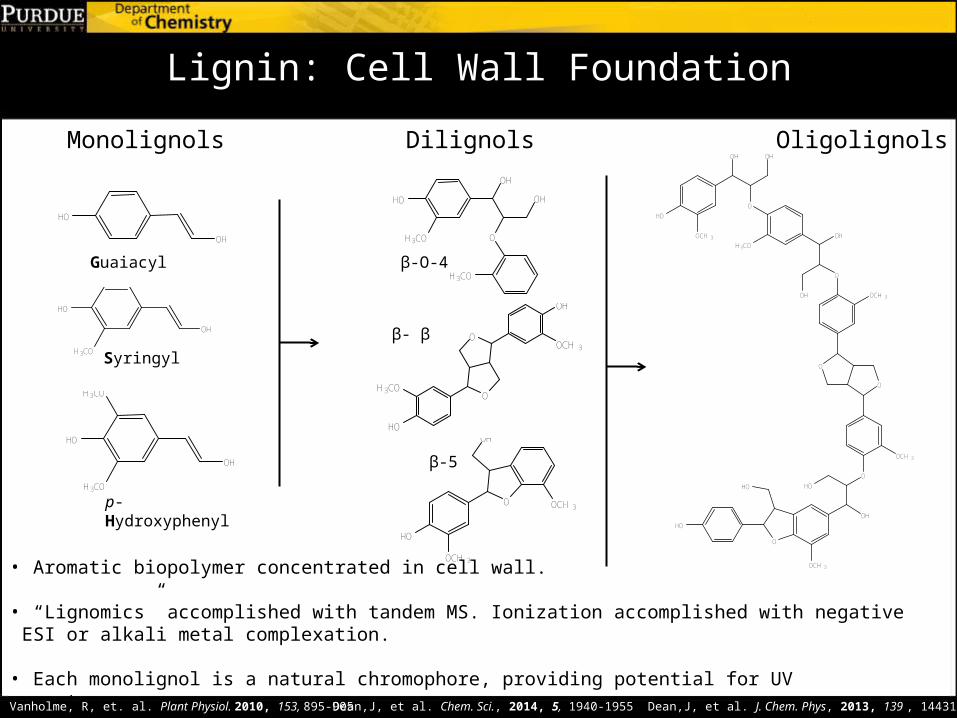
Instrument for Cold Ion Spectroscopy
• Ions are generated via nano-electrospray ionization (nESI)
• q2 and q3 are set up as linear ion traps• The cold trap is a 22-pole ion trap held at ~5K
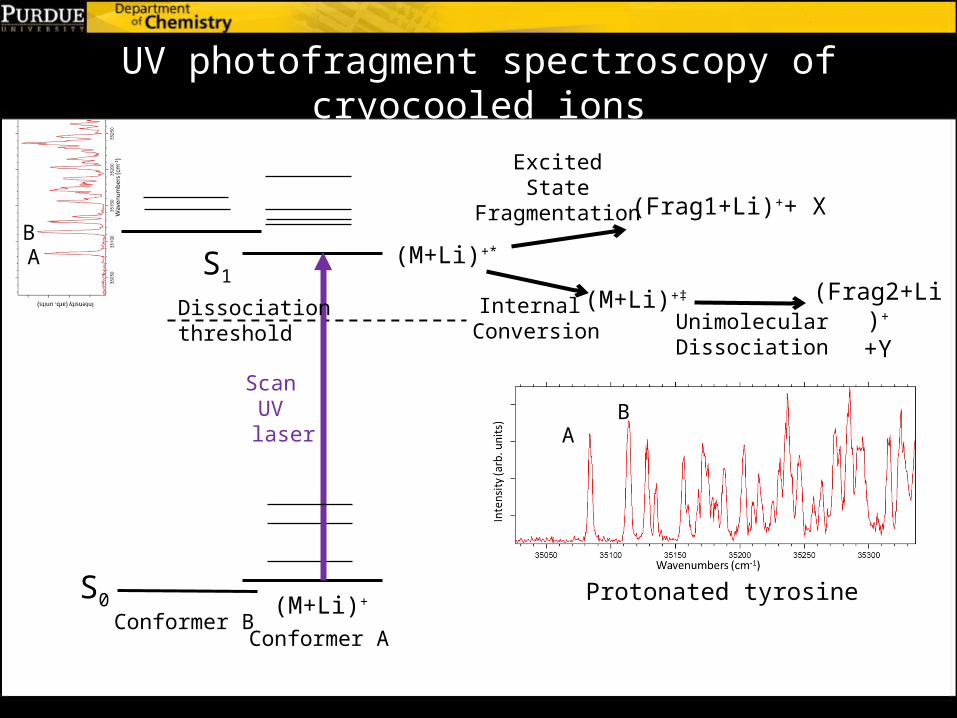
UV photofragment spectroscopy of cryocooled ions
(M+Li)+*
(M+Li)+S0
S1
Dissociation threshold
Scan UV
laser
UnimolecularDissociation
(Frag2+Li)+
+YInternal
Conversion
(M+Li)+‡
(Frag1+Li)++ X
ExcitedState
Fragmentation
Conformer AConformer B
AB
Protonated tyrosine
AB

IR-induced Fragment Ion Gain Spectroscopy(IRFIG)
UnimolecularDissociation
(M+Li)+
(M+Li)+*
(Frag2+Li)++Y
S0
S1
Internal Conversion
(M+Li)+‡Dissociation threshold
Fix UV dissociation laser to thered of cold transitions
Scan IR Laser
(Frag1+Li)++ X
Dt=100 ns
ExcitedState
Fragmentation
UV wavelength fixed
35900357003550035300
IR produces “warm”ion gain signal

(erythro) β-O-4+Li+ UV Spectroscopy In
ten
sit
y (
arb
. un
its
)
36500360003550035000Wavenumber (cm
-1)
*In
ten
sit
y (
arb
. un
its
)
3560035500354003530035200351003500034900Wavenumber (cm
-1)
*
OH
OCH3
HO
HO
O
OCH3
Li
• Three conformer “terraces” at 34985, 35083, and 35161 cm-1 present.

(erythro) β-O-4+Li+ IR
375037003650360035503500Wavenumber (cm
-1)
• IRFIG spectrum shows only three bands, indicating single dominant linkage conformation for all three conformers.
• Cation solvated by four oxygen atoms, making binding at this linkage most likely in an oligomer with multiple linkage types.
1
2
3
1 2 3

β-O-4 Na+ UV
OH
OCH3
HO
HO
O
OCH3Na+
• Two or three conformers present, as with lithiated species, albeit at lower frequencies with more congestion.
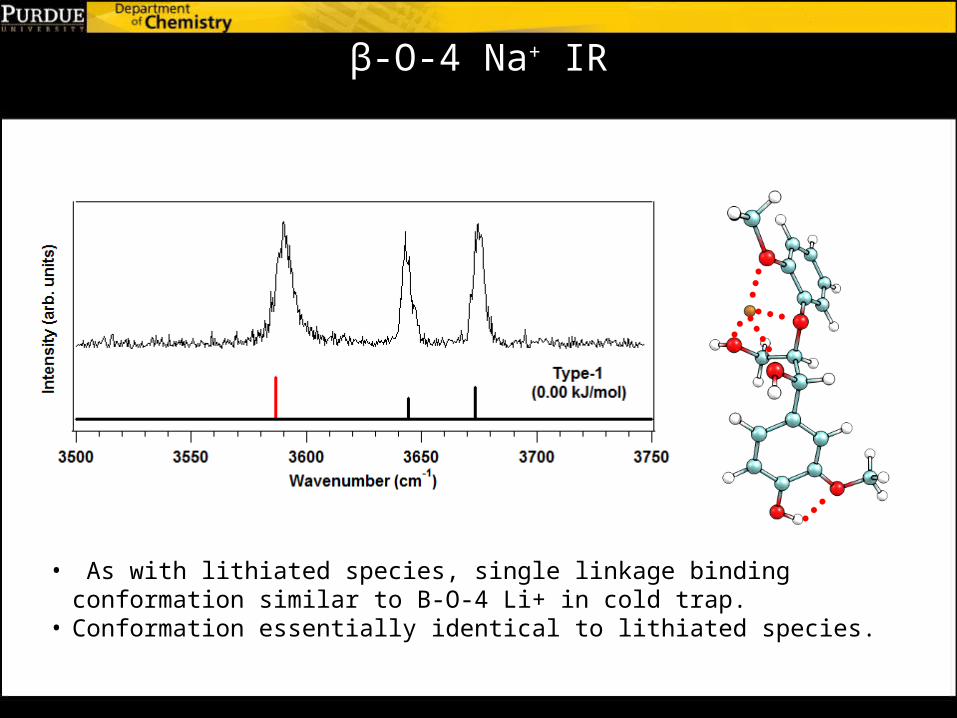
β-O-4 Na+ IR
• As with lithiated species, single linkage binding conformation similar to B-O-4 Li+ in cold trap.
• Conformation essentially identical to lithiated species.
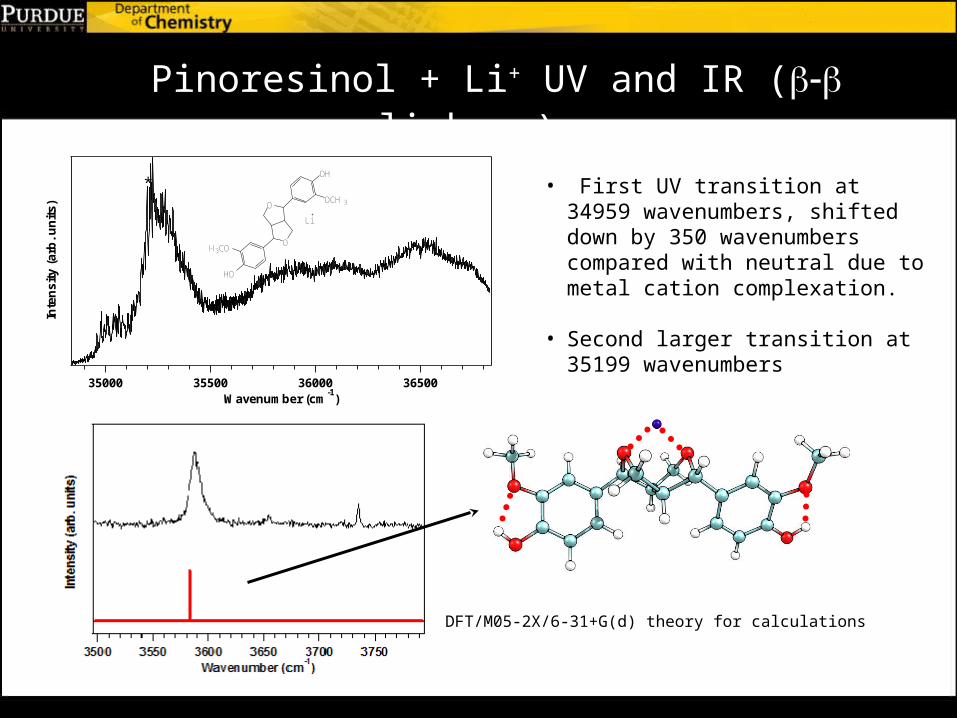
Pinoresinol + Li+ UV and IR ( -b b linkage) In
ten
sit
y (
arb
. un
its
)
36500360003550035000Wavenumber (cm
-1)
* • First UV transition at 34959 wavenumbers, shifted down by 350 wavenumbers compared with neutral due to metal cation complexation.
• Second larger transition at 35199 wavenumbers
HO
O
O
OH
H3CO
OCH3
Li
DFT/M05-2X/6-31+G(d) theory for calculations
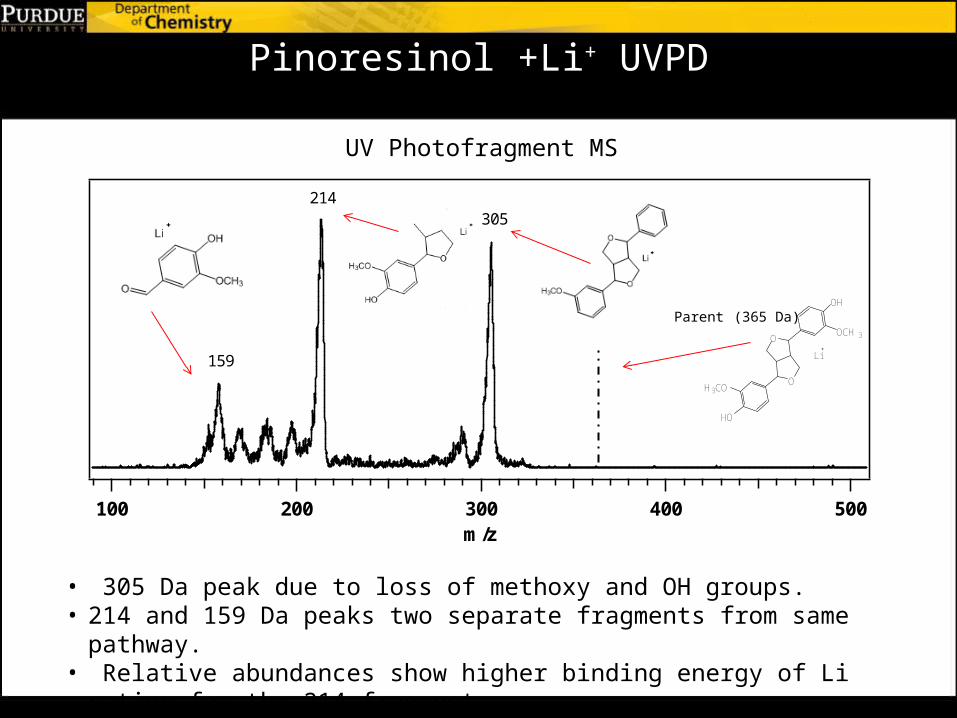
Pinoresinol +Li+ UVPD
500400300200100m/z
305214
159
UV Photofragment MS
• 305 Da peak due to loss of methoxy and OH groups. • 214 and 159 Da peaks two separate fragments from same pathway.• Relative abundances show higher binding energy of Li cation for the 214
fragment.
HO
O
O
OH
H3CO
OCH3
Li
Parent (365 Da)
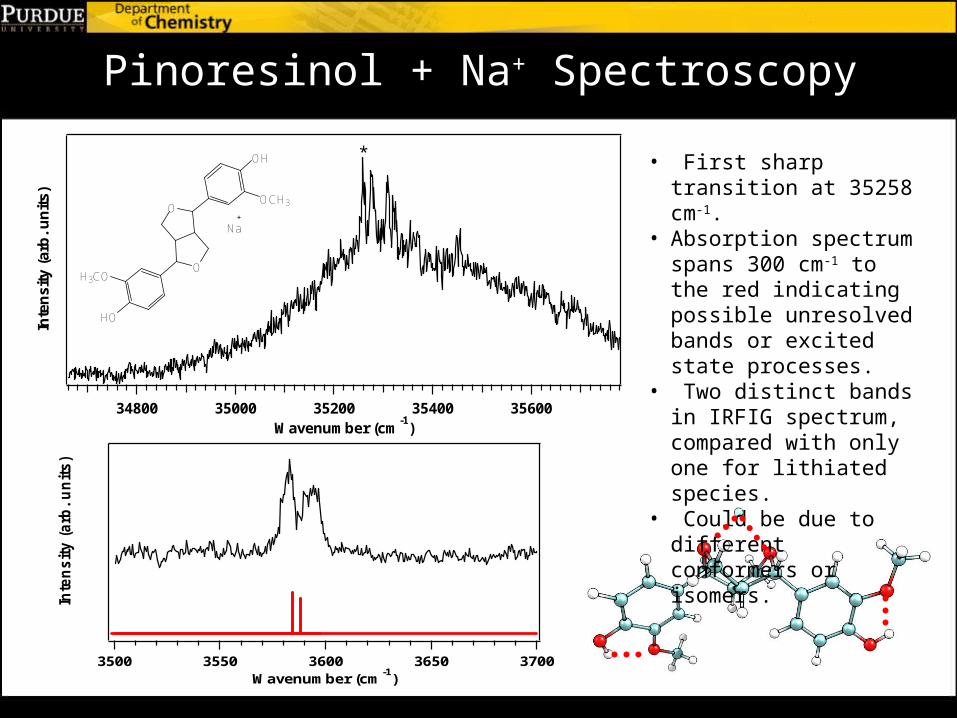
Pinoresinol + Na+ SpectroscopyIn
ten
sit
y (
arb
. u
nit
s)
3560035400352003500034800Wavenumber (cm
-1)
*
HO
O
O
OH
H3CO
OCH3
Na
Inte
ns
ity
(a
rb.
un
its
)
37003650360035503500Wavenumber (cm
-1)
• First sharp transition at 35258 cm-1.
• Absorption spectrum spans 300 cm-1 to the red indicating possible unresolved bands or excited state processes.
• Two distinct bands in IRFIG spectrum, compared with only one for lithiated species.
• Could be due to different conformers or isomers.

Pinoresinol+Na+ UVPD MS
HO
O
O
OH
H3CO
OCH3
Na
HO
O
O
OH
H3CO
OCH3
Molecular Weight: 358.39
S1 Charge Transfer Na
OH
OCH3
Na • Excited state surfaces steering fragmentation pathways
• Even slightly different metal ions results in different fragmentation500400300200100
m/z
147 [G+Na+]
359 [M+]
202 [M+Na+
2]

Structural Perturbation by Alkali Metal Complexation
Li+
Li+
• Loss of all linkage H-bonds
• Complete charge solvation by linkage
• β-O-4 ideal binding site in oligomers
β-O-4•Li+ β-O-4•Na+ Pino.•Li+ Pino.•Na+
Binding E. (eV)
3.69 2.68 2.66 1.88
RO-M (Å) 1.97 2.30 1.89 2.26

β-O-4 Li+ CID vs. UVPD
OH
OCH3
O
OCH3Li+
m/z = 279
• 279 Da peak most prominent fragment in both CID and UVPD of lithiated β-O-4 dilignol.
• UVPD yields 294 and 312 Da fragments not seen in CID.
UVPD
CID taken with AB SCIEX QTRAP 4000
Parent (327 Da)

β-O-4 Na+ CID vs. UVPD
OHNa+
m/z =143
• UVPD of β-O-4 Na+ results in substantially different fragments vs. lithiated species.
• UVPD fragments different
from CID fragments: 143, 156, and 172 Da peaks not seen in CID spectrum.
CID
UVPD
HO
OCH3
Na+
343 [M+Na+ ]
m/z 173
Conclusions
Ion spectroscopy adds another dimension to lignomics.
Dilignol transitions resolvable with ion spectroscopy.
Photofragmentation mass spectrometric signatures differ compared to CID.
UVPD of lithiated and sodiated β-O-4 dilignol markedly different. In both cases UVPD provides complementary fragmentation to CID.
Different features found with different linkages.
Future work includes studies of negative ion dilignols.

Acknowledgements
NSF CRIF CHE-0820766 NSF CHE-1213289 DOE FG02-00ER15105 All group members of the McLuckey and Zwier groups.
McLuckey Group Zwier Group