
1. Using the balanced scorecard to manage intellectual ... · Using the balanced scorecard to...
74
Schedule for this session Schedule for this session 1. Book outline 2. Challenges facing foreign firms in China 1. Using the balanced scorecard to manage intellectual capital in China 2. Structuring compensation systems in China – 1. Challenges faced by CTI Ltd in designing its incentive plan to fit its strategy 2. Incorporating subjective measures into the incentive plan © Neale O’Connor 2005
Transcript of 1. Using the balanced scorecard to manage intellectual ... · Using the balanced scorecard to...

Schedule for this sessionSchedule for this session1. Book outline2. Challenges facing foreign firms in China
1. Using the balanced scorecard to manage intellectual capital in China
2. Structuring compensation systems in China –1. Challenges faced by CTI Ltd in designing its incentive plan to fit its
strategy2. Incorporating subjective measures into the incentive plan
© Neale O’Connor 2005
22
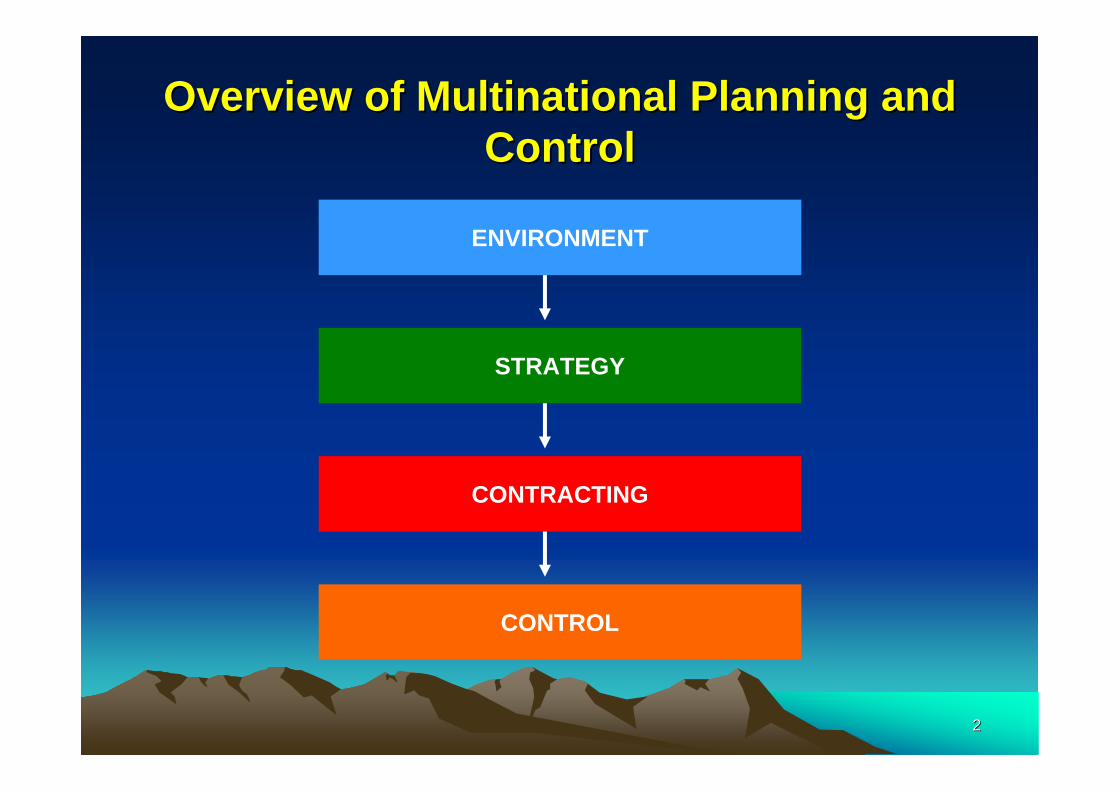
Overview of Multinational Planning and Overview of Multinational Planning and ControlControl
ENVIRONMENT
STRATEGY
CONTRACTING
CONTROL

33
Chapter FrameworkChapter FrameworkPart One: Planning and Investment Function of ManagementPart One: Planning and Investment Function of Management
Chapter 1 – The international business environment and information needs
Information is required to a) formulate global strategy, b) source international finance, and c) assess the risk and returns that are
associated with each investment opportunity.
Global environment Strategic motivation to go international
Product/service nature
Chapter 2 – The international expansion and external contracting
Information is required to structure and monitor contracts.
Franchising Licensing Joint venture SubsidiaryMarket exchange

44
4. Adams Corporation 4. Adams Corporation -- Best mode of Best mode of entry for further expansion into Chinaentry for further expansion into China
Theories implicated
Transaction cost theory
Dependent variables
Contracting mode:Joint venture versus wholly owned subsidiary
Location:Guangzhou versus Shanghai
Independent variables
Coordination of globalStrategyMinimise transaction costs of locating a new production plant
Stakeholder and focal decision
What is the best mode of entry for further expansion of production in China?Which location is most appropriate for such expansion?

55
5. Ace Style 5. Ace Style -- Best mode of Entry for Best mode of Entry for Expanding Its Production in ChinaExpanding Its Production in China
Theories implicated
Transactioncost theory
Dependent variables
Management accounting Information for mode of entry
Joint ventureWholly-owned subsidiary
Independent variables
Transaction frequencyEnvironmental uncertainty
Relationship with government officialsCultural differencesEconomic policy
Knowledge dependence Asset specificityTangible assetsIntangible assets
Stakeholder and focal decision
What is the best mode of entry for further expansion of production operations in China?
66
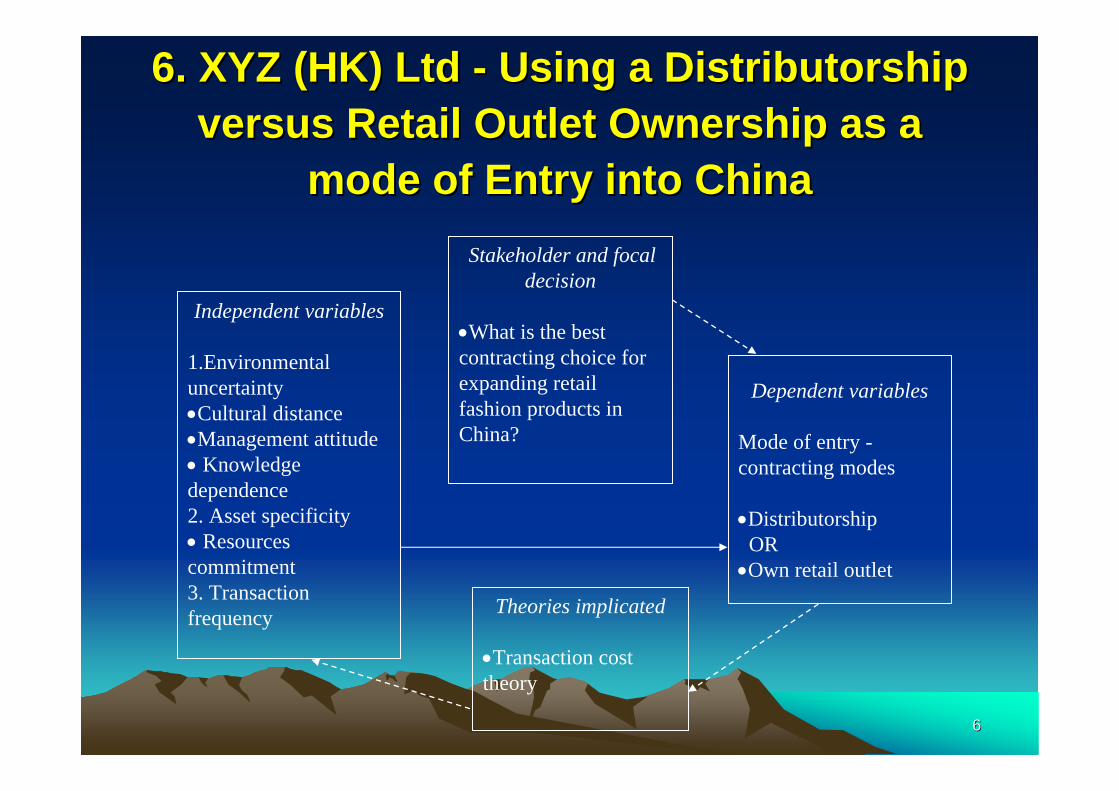
6. XYZ (HK) Ltd 6. XYZ (HK) Ltd -- Using a Distributorship Using a Distributorship versus Retail Outlet Ownership as a versus Retail Outlet Ownership as a
mode of Entry into Chinamode of Entry into China
Theories implicated
Transaction cost theory
Dependent variables
Mode of entry -contracting modes
Distributorship OROwn retail outlet
Independent variables
1.Environmental uncertaintyCultural distanceManagement attitude Knowledge dependence2. Asset specificity Resources commitment3. Transaction frequency
Stakeholder and focal decision
What is the best contracting choice for expanding retail fashion products in China?

77
Chapter FrameworkChapter FrameworkPart Two: Management Control Function of ManagementPart Two: Management Control Function of Management
Chapter 3 – Management control of wholly owned subsidiaries
Information is required to organise resources, and to monitor and evaluate the performance of the wholly owned subsidiary.
Decision control Performance measurement
Performance rewards
Human resource selection
Chapter 4 – Management control of joint ventures
Information is required to organise resources, and to monitor and evaluate the performance of the joint venture.
Joint venture agreement controls
Joint venture management
controls
Joint venture performance
Partner contributions
Chapter 5 – International transfer pricing
Information is required to set transfer prices within and between non-market-based contracts.
Regulatory environment
Organisationefficiency
Competitive environment

88
9. 9. SanyungSanyung Ltd Ltd –– Can ActivityCan Activity-- based Costing Improve based Costing Improve SanyungSanyung’’ss Management DecisionManagement Decision Making?Making?
Theories implicated
Value chain analysis
Dependent variables
Scope and extent of the activity-based costing system
Independent variables
Production volumeSet-up and
complexity
Stakeholder and focal decision
How can ABC information help in customer product decisions?

99
9. 9. SanyungSanyung Ltd Ltd –– Can ActivityCan Activity--based Costing Improve based Costing Improve SanyungSanyung’’ss Management Decision Making?Management Decision Making?
Figure 3 Customer Profitability for Selected CustomersFigure 3 Customer Profitability for Selected Customers
-400
-300
-200
-100
0
100
200
300
400
500
1 2 3 4 5 6 7 8 9 10 11 12 13 14 15 16 17 18 19 20
Selected Customers
Cu
sto
me
r P
rofit
'0
0

1010
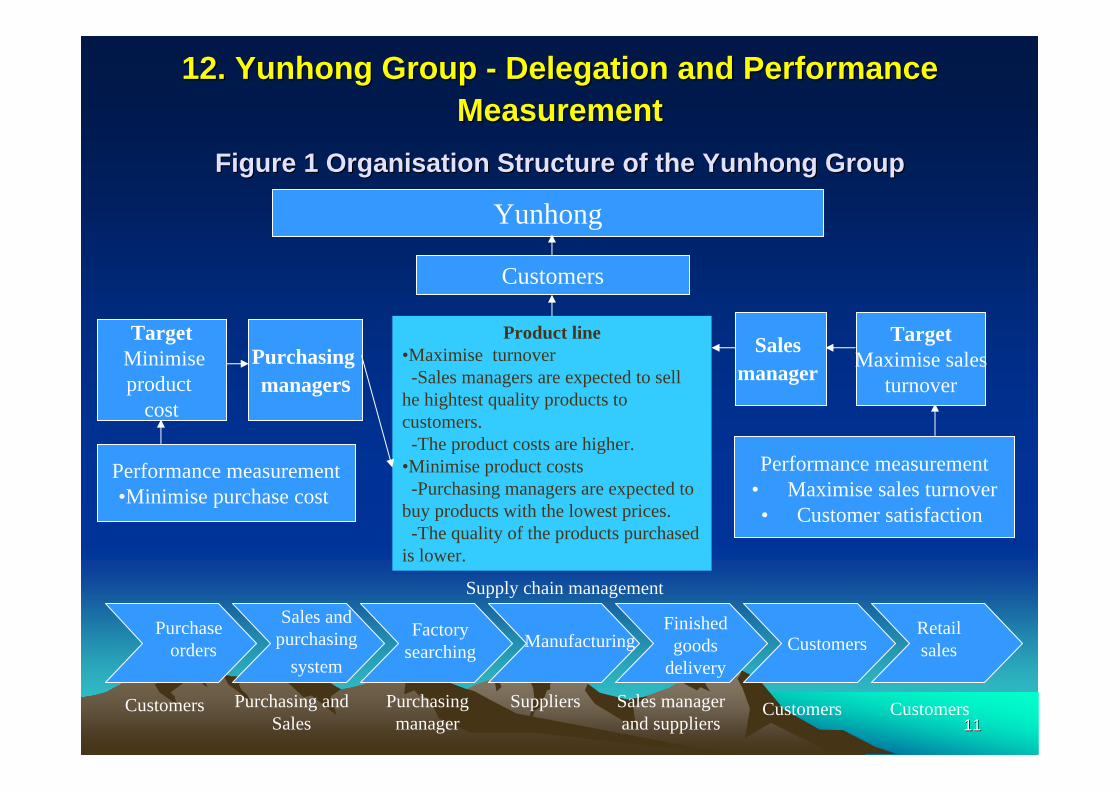
12. 12. YunhongYunhong Group Group -- Delegation and Performance Delegation and Performance MeasurementMeasurement
Theories implicated
Agency theoryOrganisational architecture
Dependent variables
Performance Measurement
Profit sharingCustomer
satisfactionMix of both
measures
Independent variables
Contextual variables Environmental
Level of dependence onhost country’s operations
OrganisationalSales and purchasing
manager atttiudesExtent of goal
divergence betweenpurchasing and salesmanagers
Stakeholder and focal decision
Decision-making role ofmanagementConflicts of decision
responsibilities of sales andpurchase function (lack of goal congruence)
1111
12. 12. YunhongYunhong Group Group -- Delegation and Performance Delegation and Performance MeasurementMeasurement
Figure 1 Figure 1 OrganisationOrganisation Structure of the Structure of the YunhongYunhong GroupGroup
Product line•Maximise turnover-Sales managers are expected to sell
he hightest quality products to customers.-The product costs are higher.
•Minimise product costs-Purchasing managers are expected to
buy products with the lowest prices.-The quality of the products purchased
is lower.
Yunhong
Customers
TargetMinimiseproduct
cost
Purchasing managers
Sales manager
TargetMaximise sales
turnover
Performance measurement•Minimise purchase cost
Performance measurement• Maximise sales turnover• Customer satisfaction
Customers Purchasing andSales
Purchasingmanager
Suppliers Sales managerand suppliers
Customers Customers
Supply chain managementSales and
purchasingsystem
Purchase orders
Factorysearching Manufacturing
Finished goods
deliveryCustomers
Retail sales

1212
12. 12. YunhongYunhong Group Group -- Delegation and Performance Delegation and Performance MeasurementMeasurement
Figure 2 Goal Congruence ProblemFigure 2 Goal Congruence Problem
Customer
Product
Supplier
SalesPurchasing
Conflict withsales
functions?
Direct relationship and responsibilities
Indirect or no relationship and responsibilities
Delivery
Purchaseorder
Conflict with purchase function?

1313
14. AB Holding Ltd 14. AB Holding Ltd -- A New Incentive SchemeA New Incentive Scheme
Theories implicated
Agency theory
Dependent variables
Incentive system for agents, marketing staff and distributors
Independent variables
Monopolistic environment (few suppliers)Agent bargaining power over distributorsBureaucratic management style in the JV
Stakeholder and focal decision
Control of sales staff and agents

1414
14. AB Holding Ltd 14. AB Holding Ltd -- A New Incentive SchemeA New Incentive SchemeFigure 2 Telecom Services Distribution ModelFigure 2 Telecom Services Distribution Model
Distributors
InternetService
Providers
1) China Telecom2) Unicom
Agent
Agent
Agent
Equity JointVenture
(EJV)
Distributors
R
R
R
R
R
R
RR
Sale of traffic Share of profit
Receipt of cash R = Retailer
Key:

1515
15. ECG Ltd 15. ECG Ltd -- Fraud and the Liquidation of a Fraud and the Liquidation of a Joint Venture in ChinaJoint Venture in China
Theories implicated
Agency theoryNegotiation and cross-culture theories
Dependent variables
Contracting and management control mechanisms
Independent variables
Succession plans forsenior managementStrategic change in a
foreign countryContractual
uncertainties andcultural differences innegotiation
Stakeholder and focal decision
Strategic change and crisis management in a developing country
1616
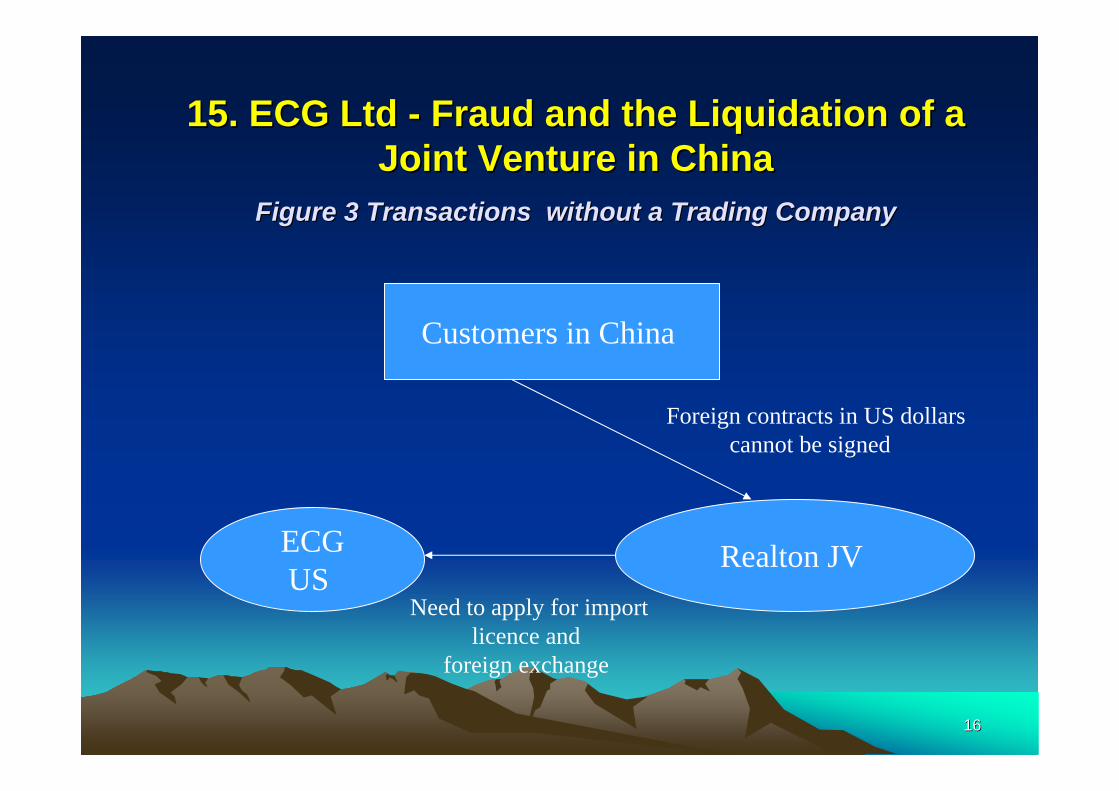
15. ECG Ltd 15. ECG Ltd -- Fraud and the Liquidation of a Fraud and the Liquidation of a Joint Venture in ChinaJoint Venture in China
Figure 3 Transactions without a Trading CompanyFigure 3 Transactions without a Trading Company
Customers in China
Realton JV ECGUS
Foreign contracts in US dollarscannot be signed
Need to apply for importlicence and
foreign exchange

1717
15. ECG Ltd 15. ECG Ltd -- Fraud and the Liquidation of a Fraud and the Liquidation of a Joint Venture in ChinaJoint Venture in China
Figure B Contracts Handled through a Trading CompanyFigure B Contracts Handled through a Trading Company
CIG/YEFA
Customers
RealtonJV
ECG US
Foreign contracts US$10
RMB contract(RMB5)
Invoices RMB15.5¹
¹ Invoicing for commissionUS$(10-8)-US$0.125 service fee = US$1.875 x 8.3 = RMB15.56
CIG charged for service fee
US$10 x 1.25 % = US$0.125Purchase orders
US$8
Payment of purchase order
by US$8

18
Alpha IncAlpha Inc
© Neale O’Connor 2005

Alpha Inc.Alpha Inc.Alpha Inc. is a growing specialty pharmaceutical company Alpha Inc. is a growing specialty pharmaceutical company
and is presently active in > 60 countries.and is presently active in > 60 countries.
© Neale O’Connor 2005

2020
Fortune LtdFortune Ltd-- BackgroundBackground
1. Xinan Pharmaceuticals Co., Ltd. (Xinan JV) is a joint venture that is located in Xinan in Guangdong province. It was founded in 1994 by an Australian pharmaceutical group (90% equity) and the XinanIndustrial Investment Company (a governmental authority, 10% equity). The total investment was US$2,450 million, which was the largest foreign pharmaceutical investment in China at that time. Much of the equipment was imported from foreign countries, and Xinan JVs core production technique was the manufacturing of soft gel and hard gel capsules. XinanJV has 460 staff, including 200 middle and high-level technicians and 30 certified pharmacists.
© Neale O’Connor 2005
2121
Fortune LtdFortune LtdChallengesChallenges
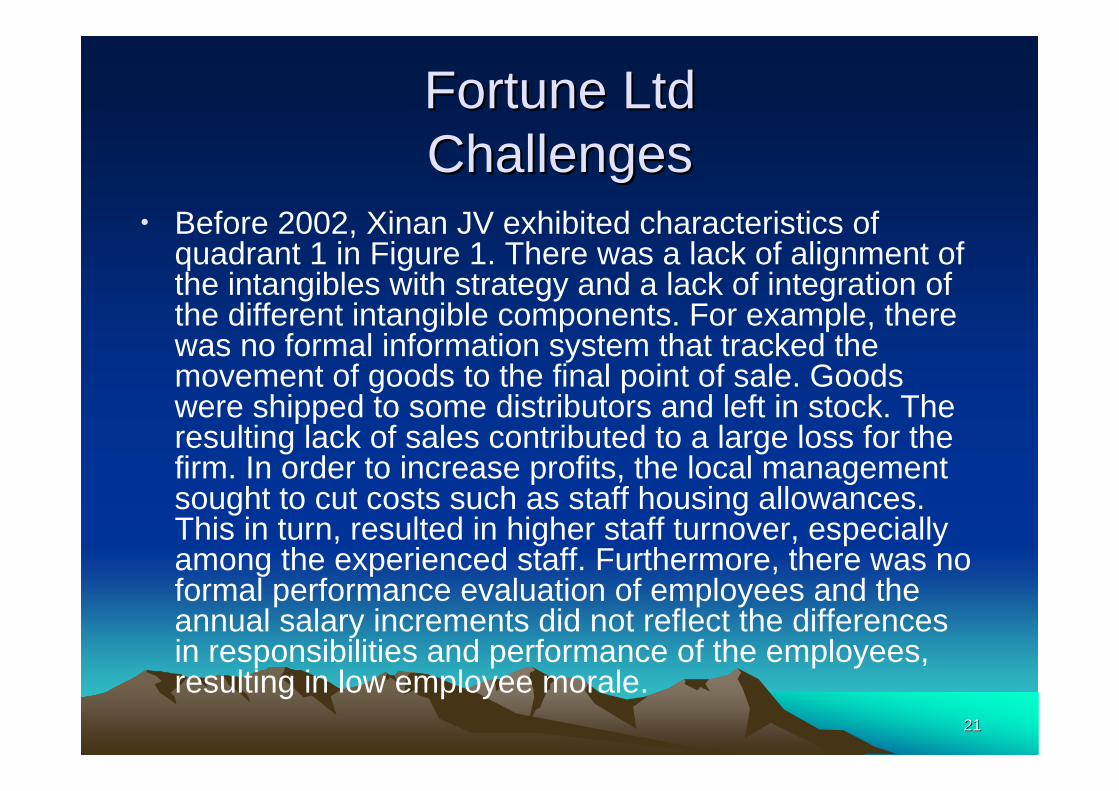
• Before 2002, Xinan JV exhibited characteristics of quadrant 1 in Figure 1. There was a lack of alignment of the intangibles with strategy and a lack of integration of the different intangible components. For example, there was no formal information system that tracked the movement of goods to the final point of sale. Goods were shipped to some distributors and left in stock. The resulting lack of sales contributed to a large loss for the firm. In order to increase profits, the local management sought to cut costs such as staff housing allowances. This in turn, resulted in higher staff turnover, especially among the experienced staff. Furthermore, there was no formal performance evaluation of employees and the annual salary increments did not reflect the differences in responsibilities and performance of the employees, resulting in low employee morale.

2222
Fortune LtdFortune Ltd-- Two significant challengesTwo significant challenges
1. The Chinese government, through the State Drug Product Council, implemented various reforms in the Chinese pharmaceutical market, such as the reduction of drug prices of between 30% to 50% across the board, and the introduction of tendering in hospitals, which increased the competition for the supply of drugs. For example, local generic product manufacturers were bidding between 30% and 50% below Xinan JV’s price. This served as a wake-up call for Xinan JV, which had an aging portfolio of products that were largely protected from competition, and the challenge for the company was to speed up the development of new products.
2323
Fortune LtdFortune Ltd-- Two significant challengesTwo significant challenges
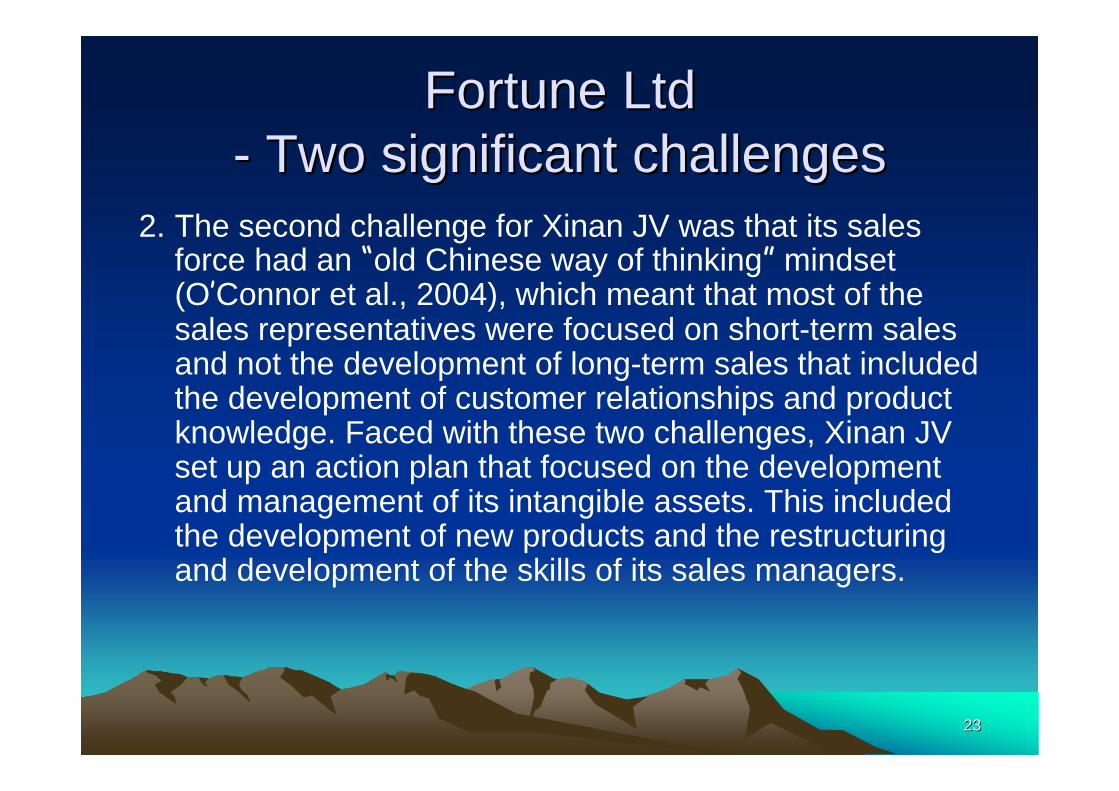
2. The second challenge for Xinan JV was that its sales force had an “old Chinese way of thinking” mindset (O’Connor et al., 2004), which meant that most of the sales representatives were focused on short-term sales and not the development of long-term sales that included the development of customer relationships and product knowledge. Faced with these two challenges, Xinan JV set up an action plan that focused on the development and management of its intangible assets. This included the development of new products and the restructuring and development of the skills of its sales managers.

2424
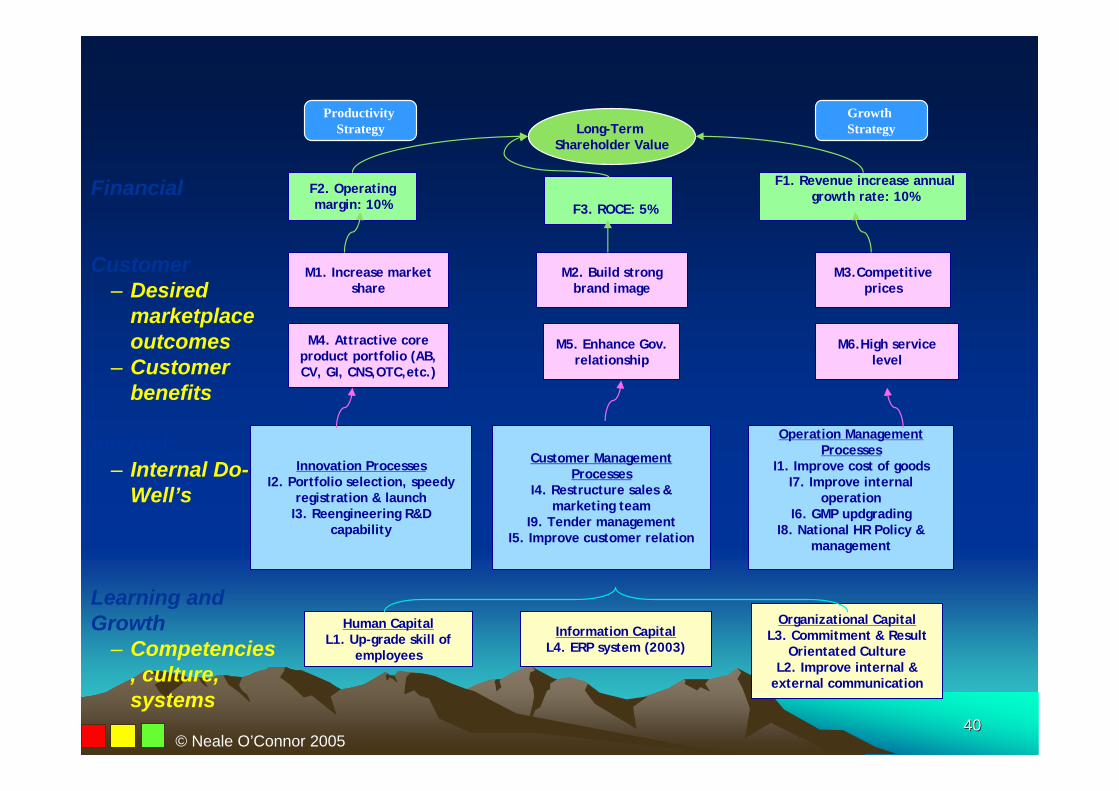
Fortune LtdFortune Ltd-- Balanced scorecard implementation (2002)Balanced scorecard implementation (2002)
• Objective– Improve communication and control over
strategy and the associated objectives and initiatives
– Strategy - Making medicine accessible – To be a leader in China branded generic business in 5 years time.
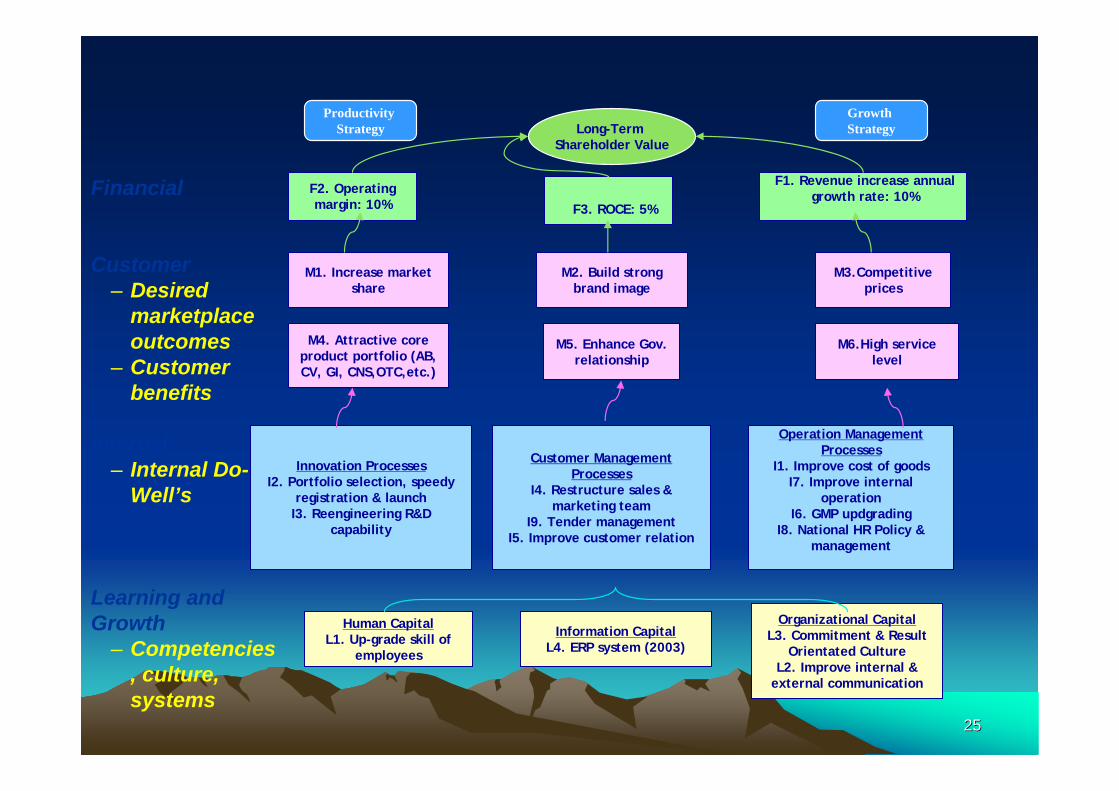
2525
Information CapitalL4. ERP system (2003)
Financial
Customer– Desired
marketplace outcomes
– Customer benefits
Internal – Internal Do-
Well’s
Learning and Growth
– Competencies, culture, systems
M2. Build strong brand image
M1. Increase market share
M4. Attractive core product portfolio (AB, CV, GI, CNS,OTC,etc.)
M5. Enhance Gov. relationship
M6.High service level
Operation Management Processes
I1. Improve cost of goodsI7. Improve internal
operationI6. GMP updgrading
I8. National HR Policy & management
Human CapitalL1. Up-grade skill of
employees
M3.Competitive prices
Organizational CapitalL3. Commitment & Result
Orientated Culture L2. Improve internal &
external communication
F3. ROCE: 5%
Customer Management Processes
I4. Restructure sales & marketing team
I9. Tender managementI5. Improve customer relation
Innovation ProcessesI2. Portfolio selection, speedy
registration & launchI3. Reengineering R&D
capability
F2. Operating margin: 10%
F1. Revenue increase annual growth rate: 10%
Long-Term Shareholder Value
Productivity Strategy
Growth Strategy

2626
Balance ScorecardBalance Scorecard
Financial Objectives:Financial Objectives:
XX%
XX%
XX%Target
All DirCEOReturn on Capital Employed
3.
All DirCEOOperating Margin2.
All DirCEOAnnual Rev Growth1.AccountableResponsibleObjectivesNo.
© Neale O’Connor 2005
2727
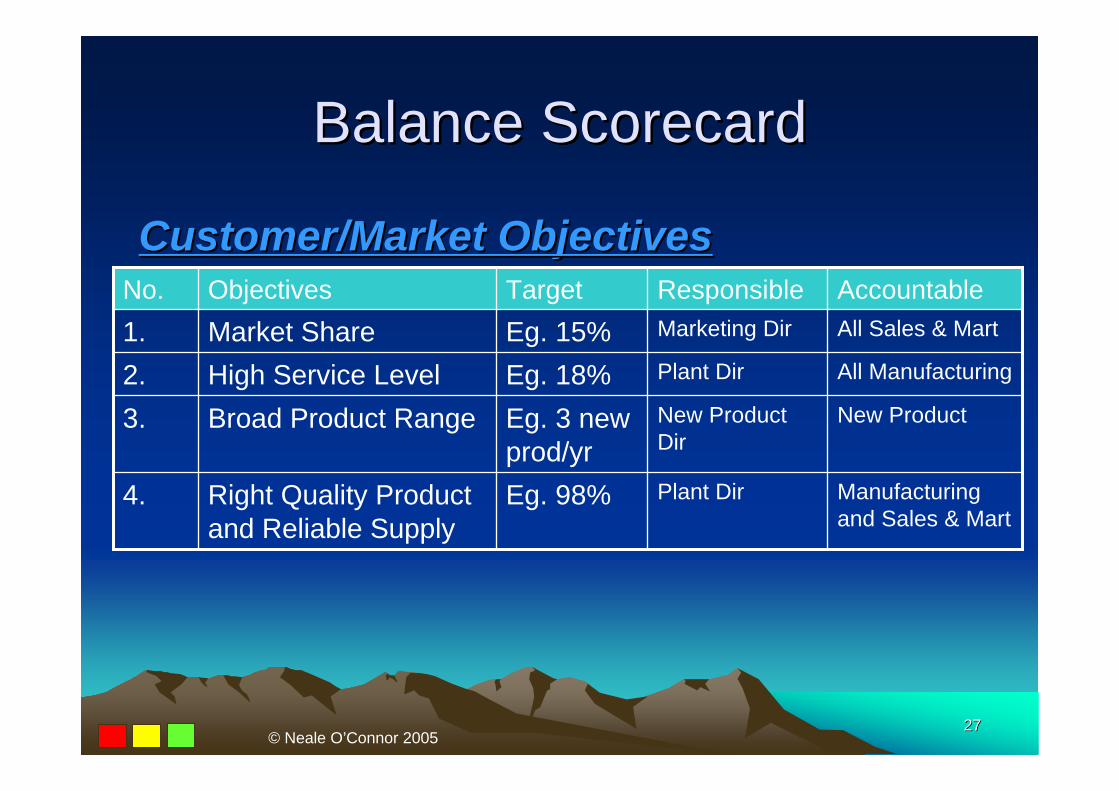
Balance ScorecardBalance Scorecard
Customer/Market ObjectivesCustomer/Market Objectives
New ProductNew Product Dir
Eg. 3 new prod/yr
Broad Product Range3.
Eg. 98%
Eg. 18%Eg. 15%Target
Manufacturing and Sales & Mart
Plant DirRight Quality Product and Reliable Supply
4.
All ManufacturingPlant Dir High Service Level2.
All Sales & Mart Marketing DirMarket Share1.AccountableResponsibleObjectivesNo.
© Neale O’Connor 2005

2828
Balance ScorecardBalance Scorecard
Internal Process ObjectivesInternal Process Objectives
All Sales & MartMarketing DirEg. 75%Forecast Accuracy3.
All Manufacturing
Plant DirMaterial Consumption4.
Eg. 95% on time
KPI FFTarget
All Manufacturing
Plant Dir Timely New Product Launch
2.
All Sales & Mart Marketing DirHigh Productivity Field Force
1.AccountableResponsibleObjectivesNo.
© Neale O’Connor 2005
2929
Balance ScorecardBalance Scorecard
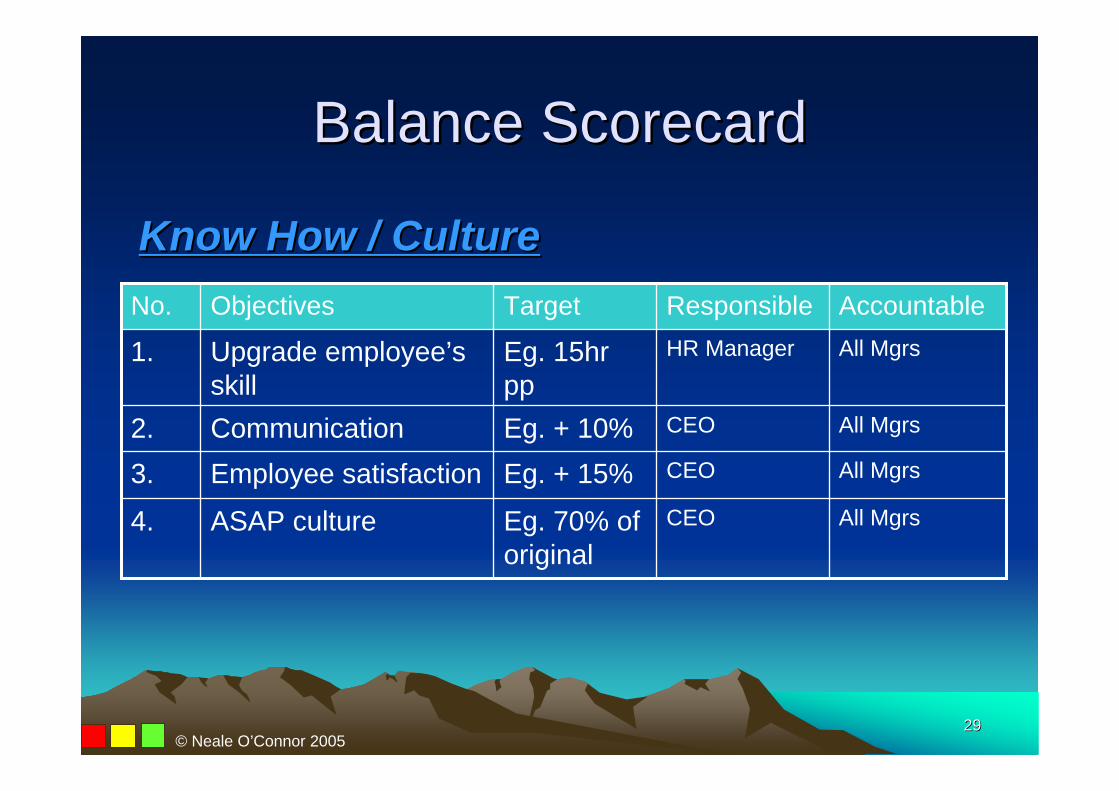
Know How / CultureKnow How / Culture
All MgrsCEOEg. 70% of original
ASAP culture4.
Eg. + 15%Eg. + 10%
Eg. 15hr pp
Target
All MgrsCEO Employee satisfaction3.
All MgrsCEOCommunication2.
All Mgrs HR ManagerUpgrade employee’s skill
1.AccountableResponsibleObjectivesNo.
© Neale O’Connor 2005
3030
Using the balanced Using the balanced scorecard to drive scorecard to drive
key initiativeskey initiatives
© Neale O’Connor 2005
3131
Using the scorecard to manage Using the scorecard to manage the innovation processthe innovation process
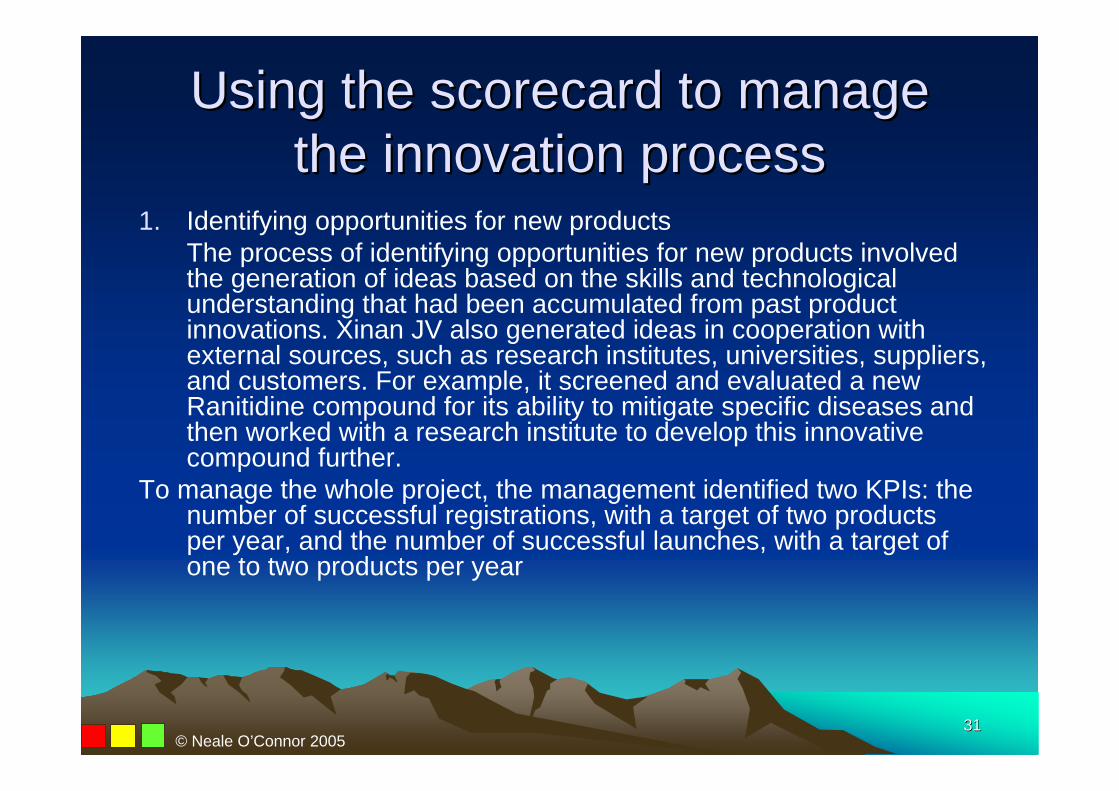
1. Identifying opportunities for new products The process of identifying opportunities for new products involved the generation of ideas based on the skills and technological understanding that had been accumulated from past product innovations. Xinan JV also generated ideas in cooperation with external sources, such as research institutes, universities, suppliers, and customers. For example, it screened and evaluated a new Ranitidine compound for its ability to mitigate specific diseases and then worked with a research institute to develop this innovativecompound further.
To manage the whole project, the management identified two KPIs: the number of successful registrations, with a target of two products per year, and the number of successful launches, with a target of one to two products per year
© Neale O’Connor 2005
3232
Using the scorecard to manage Using the scorecard to manage the innovation processthe innovation process
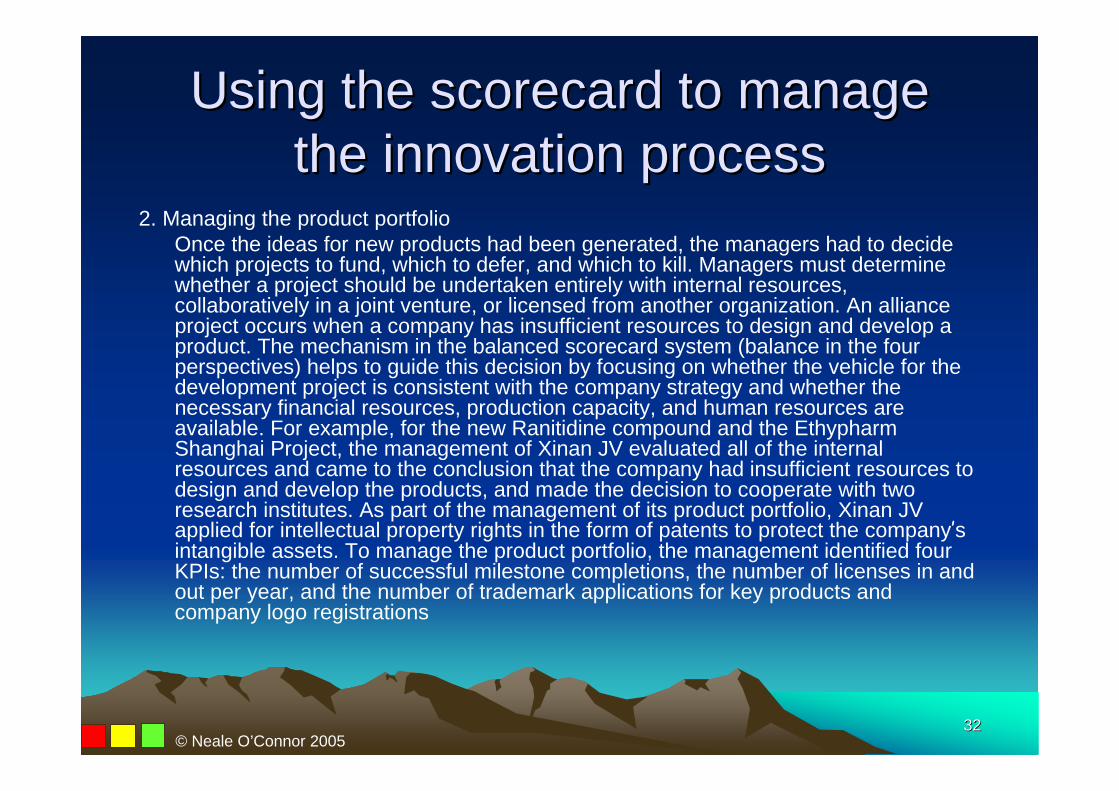
2. Managing the product portfolioOnce the ideas for new products had been generated, the managers had to decide which projects to fund, which to defer, and which to kill. Managers must determine whether a project should be undertaken entirely with internal resources, collaboratively in a joint venture, or licensed from another organization. An alliance project occurs when a company has insufficient resources to design and develop a product. The mechanism in the balanced scorecard system (balance in the four perspectives) helps to guide this decision by focusing on whether the vehicle for the development project is consistent with the company strategy and whether the necessary financial resources, production capacity, and human resources are available. For example, for the new Ranitidine compound and the EthypharmShanghai Project, the management of Xinan JV evaluated all of the internal resources and came to the conclusion that the company had insufficient resources to design and develop the products, and made the decision to cooperate with two research institutes. As part of the management of its product portfolio, Xinan JV applied for intellectual property rights in the form of patents to protect the company’s intangible assets. To manage the product portfolio, the management identified four KPIs: the number of successful milestone completions, the number of licenses in and out per year, and the number of trademark applications for key products and company logo registrations
© Neale O’Connor 2005
3333
Using the scorecard to manage Using the scorecard to manage the innovation processthe innovation process
3. Designing and developing new products The design and development process, which is the core of productdevelopment, brings new concepts to the market. Xinan JV introduced a formal stage-gate process that specifically identified a series of development stages through which a new product had to pass as it moved from an initial concept to a fully defined product that was ready for release to large-scale production (see Figure 4). With considerable diversity in the project management process, the company developed their own customized objectives and measures, such as pipeline management and portfolio selection, to manage the whole process. To manage the whole project, the management identified two KPIs: the number of new products and the number of potential new products identified (see Figure 3).
© Neale O’Connor 2005
3434
Using the scorecard to manage Using the scorecard to manage the innovation processthe innovation process
4. Bringing new products to market In the final phase, a company starts commercial production at a low volume and the sales and marketing department begins to sell the new product to customers. As customer orders increase and the supply and production process stabilize, the volume of production increases. Ultimately, the development project concludes when the company achieves its targeted levels of sales and production at specified levels of product functionality, quality, and cost. Specific measures for this objective were set by Xinan JV to determine whether the new product launch met the sales targets
© Neale O’Connor 2005

3535
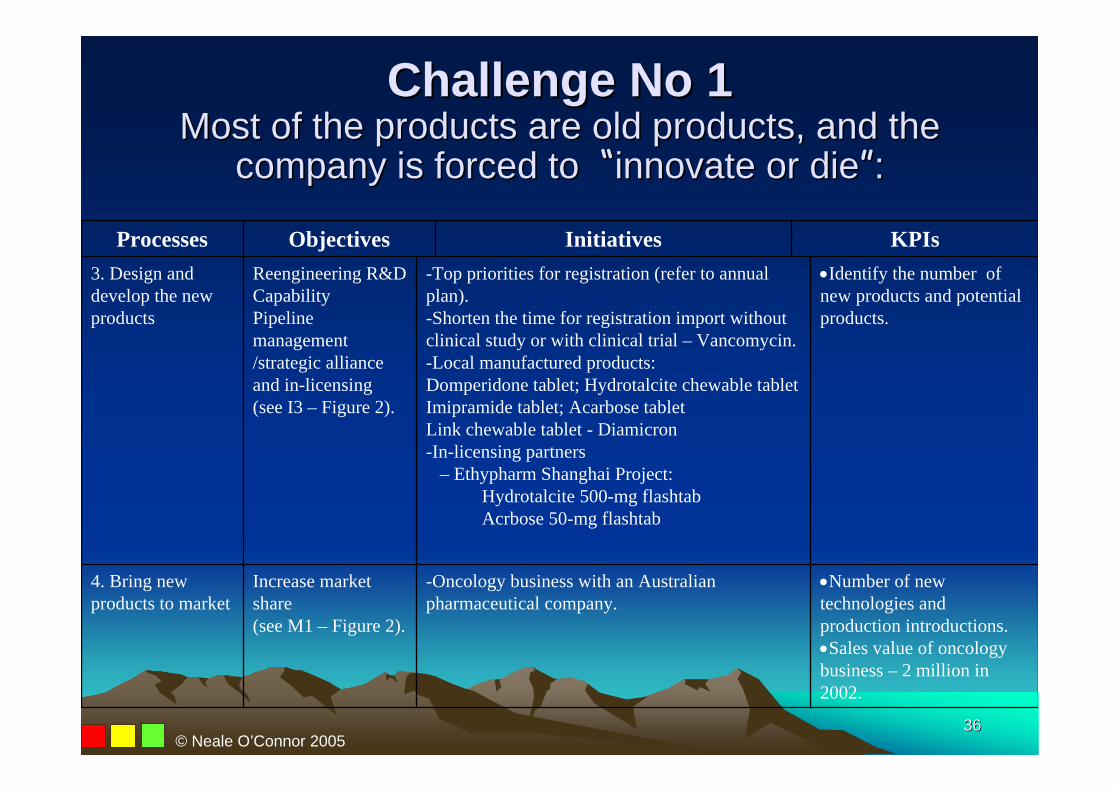
Challenge No 1Challenge No 1Most of the products are old products, and the Most of the products are old products, and the
company is forced to company is forced to ““innovate or dieinnovate or die””::
Successful completion of milestones.
Number of licenses in and out.
Trademark applications for key products (Ranitidine, Omeprazole, Enalapril and Amoxillion).
Company logo registration.
- Milestone management – monthly review.- Focus on local production – antiulcerant
category, over the counter and traditional Chinese medicine.
- Rantidine line extension: Ranitidine FDT or Ranitidine compound.
- Patent protection for the formulas of key products, the manufactory processes, trademark, logo, and packaging design.
- License-holder change.
Portfolio selection, speedy registration, and launch.
Intellectual property application and maintenance.
(see I2 – Figure 2).
2. Manage the product portfolio
Number of successful registration – 2 products per year from 2003 onwards.
Number of successful launches – 1~2 products per year from 2003 onwards.
- Focus on antiulcerant category, over the counter and hospital platforms (eg. Domperidone, Immodium, and traditional Chinese medicines).
- Work with research institutes to develop innovative compounds (e.g., Ranitidine compound).
- Speed up Vancomycin registration.
Attractive core product portfolio (eg. Antibacterial,
Cardiovascular, Antiulcerant, and over the counter drugs)
(see M4 – Figure 2)
1. Identify opportunities for new products
KPIsInitiativesObjectivesProcesses
© Neale O’Connor 2005
3636
Challenge No 1Challenge No 1Most of the products are old products, and the Most of the products are old products, and the
company is forced to company is forced to ““innovate or dieinnovate or die””::
Number of new technologies and production introductions.Sales value of oncology business – 2 million in 2002.
-Oncology business with an Australian pharmaceutical company.
Increase market share (see M1 – Figure 2).
4. Bring new products to market
Identify the number of new products and potential products.
-Top priorities for registration (refer to annual plan).-Shorten the time for registration import without clinical study or with clinical trial – Vancomycin.-Local manufactured products:Domperidone tablet; Hydrotalcite chewable tabletImipramide tablet; Acarbose tabletLink chewable tablet - Diamicron-In-licensing partners
– Ethypharm Shanghai Project: Hydrotalcite 500-mg flashtabAcrbose 50-mg flashtab
Reengineering R&D CapabilityPipeline management /strategic alliance and in-licensing (see I3 – Figure 2).
3. Design and develop the new products
KPIsInitiativesObjectivesProcesses
© Neale O’Connor 2005

3737
Information CapitalL4. ERP system (2003)
Financial
Customer– Desired
marketplace outcomes
– Customer benefits
Internal – Internal Do-
Well’s
Learning and Growth
– Competencies, culture, systems
M2. Build strong brand image
M1. Increase market share
M4. Attractive core product portfolio (AB, CV, GI, CNS,OTC,etc.)
M5. Enhance Gov. relationship
M6.High service level
Operation Management Processes
I1. Improve cost of goodsI7. Improve internal
operationI6. GMP updgrading
I8. National HR Policy & management
Human CapitalL1. Up-grade skill of
employees
M3.Competitive prices
Organizational CapitalL3. Commitment & Result
Orientated Culture L2. Improve internal &
external communication
F3. ROCE: 5%
Customer Management Processes
I4. Restructure sales & marketing team
I9. Tender managementI5. Improve customer relation
Innovation ProcessesI2. Portfolio selection, speedy
registration & launchI3. Reengineering R&D
capability
F2. Operating margin: 10%
F1. Revenue increase annual growth rate: 10%
Long-Term Shareholder Value
Productivity Strategy
Growth Strategy
© Neale O’Connor 2005

3838
Challenge No 2Challenge No 2Using the scorecard to manage the human Using the scorecard to manage the human
resources and org capitalresources and org capital
Publish internal newsletter. Number of employee
communication meetings. Number of customer
communication meetings. Number of users of the BSC.
- Implement internal newsletter.- Team building workshop.- Further promote efforts to open communication
barriers between divisions and business partners.- Corporate communication: public relationship
activities and over the counter brand building.
Improve internal and external communication
(see L2 – Figure 2)
Master training plan. Training courses and number of
hours training.
- Professional training:management training for managers;customer relationship management training for
salesmen.- Responsible and committed employees – change
mindset.- Master training plan ready.- Leadership seminar.- English courses for managers.
Upgrade skill of employees
(see L1 – Figure 2)
KPIsInitiativesObjectives
© Neale O’Connor 2005

3939
Challenge No 2Challenge No 2Using the scorecard to manage the human Using the scorecard to manage the human
resources and org capitalresources and org capital
ERP system implemented2003 - Implementation of an ERP system
Information capital(see L4 – Figure 2)
Number of implemented job descriptions for all levels.
KPI performance evaluation and incentive plan.
Number of improving projects. Number of standard operating
procedures reviews Number of new ideas
implemented. Selection of top five employees.
- Implement job descriptions for all levels. - KPI performance evaluation.- Open-minded and trustworthy approach.- Willingness to change behavior.- Can-do (agile) culture.- Positive thinking culture.- Proactive “spotting opportunities”.- Forward thinking and innovation.- Ability to copy good ideas.- Conceptual thinking.- Solution orientated/solution provider.- Introduce the company way ASAP.- English courses for managers.- Diamond club program: reward key individuals
who have constantly outperformed their KPIs, have always been role models, and have provided leadership in their areas.
Commitment and result-oriented culture
(see L3 – Figure 2)
KPIsInitiativesObjectives
© Neale O’Connor 2005
4040
Information CapitalL4. ERP system (2003)
Financial
Customer– Desired
marketplace outcomes
– Customer benefits
Internal – Internal Do-
Well’s
Learning and Growth
– Competencies, culture, systems
M2. Build strong brand image
M1. Increase market share
M4. Attractive core product portfolio (AB, CV, GI, CNS,OTC,etc.)
M5. Enhance Gov. relationship
M6.High service level
Operation Management Processes
I1. Improve cost of goodsI7. Improve internal
operationI6. GMP updgrading
I8. National HR Policy & management
Human CapitalL1. Up-grade skill of
employees
M3.Competitive prices
Organizational CapitalL3. Commitment & Result
Orientated Culture L2. Improve internal &
external communication
F3. ROCE: 5%
Customer Management Processes
I4. Restructure sales & marketing team
I9. Tender managementI5. Improve customer relation
Innovation ProcessesI2. Portfolio selection, speedy
registration & launchI3. Reengineering R&D
capability
F2. Operating margin: 10%
F1. Revenue increase annual growth rate: 10%
Long-Term Shareholder Value
Productivity Strategy
Growth Strategy
© Neale O’Connor 2005

4141
Outcomes of using Outcomes of using the scorecardthe scorecard
© Neale O’Connor 2005
4242
Outcomes of the scorecard Outcomes of the scorecard intangible asset initiativesintangible asset initiatives
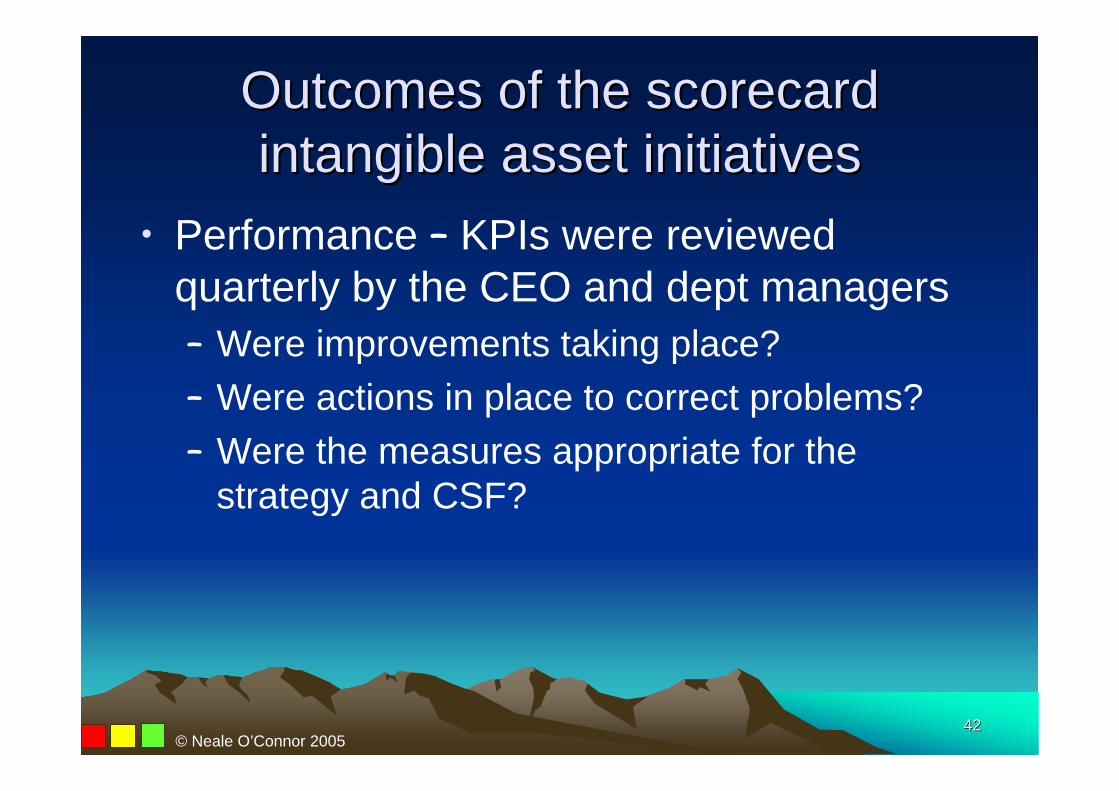
• Performance – KPIs were reviewed quarterly by the CEO and dept managers– Were improvements taking place?– Were actions in place to correct problems?– Were the measures appropriate for the
strategy and CSF?
© Neale O’Connor 2005
4343
Outcomes of the scorecard Outcomes of the scorecard intangible asset initiativesintangible asset initiatives
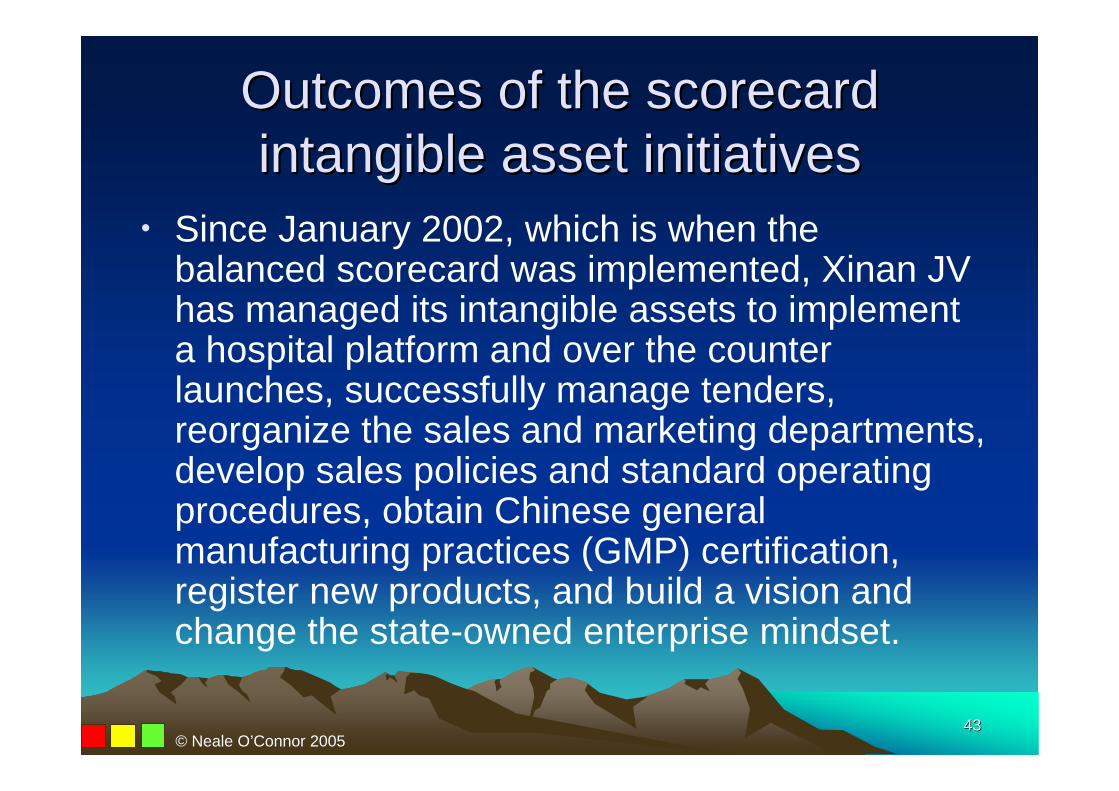
• Since January 2002, which is when the balanced scorecard was implemented, Xinan JV has managed its intangible assets to implement a hospital platform and over the counter launches, successfully manage tenders, reorganize the sales and marketing departments, develop sales policies and standard operating procedures, obtain Chinese general manufacturing practices (GMP) certification, register new products, and build a vision and change the state-owned enterprise mindset.
© Neale O’Connor 2005

4444
Outcomes of the scorecard Outcomes of the scorecard intangible asset initiativesintangible asset initiatives
• Improvements were reported in 10 out of the 11 KPIs (all except the number of new ideas implemented) in the learning and growth perspective over the period. Similarly, six of the KPIs that are associated with the product innovation processes showed improvement over the same period.
© Neale O’Connor 2005
4545
Outcomes of the scorecard Outcomes of the scorecard intangible asset initiativesintangible asset initiatives
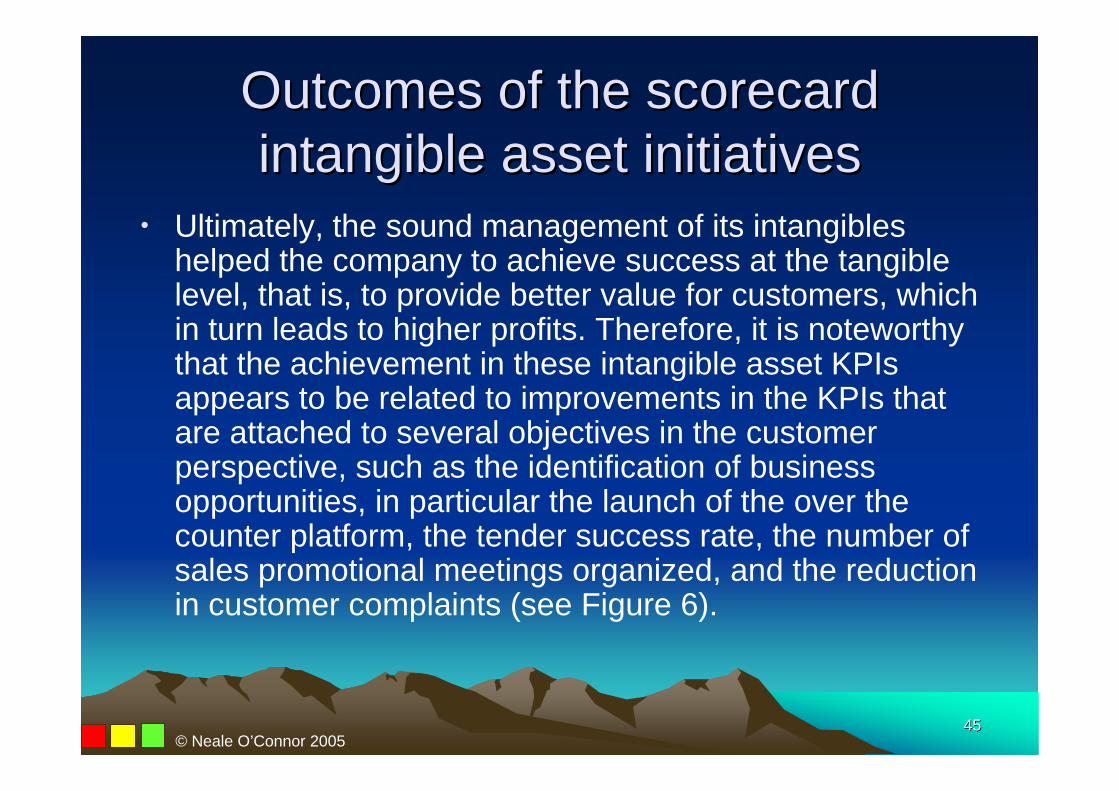
• Ultimately, the sound management of its intangibles helped the company to achieve success at the tangible level, that is, to provide better value for customers, which in turn leads to higher profits. Therefore, it is noteworthy that the achievement in these intangible asset KPIsappears to be related to improvements in the KPIs that are attached to several objectives in the customer perspective, such as the identification of business opportunities, in particular the launch of the over the counter platform, the tender success rate, the number of sales promotional meetings organized, and the reduction in customer complaints (see Figure 6).
© Neale O’Connor 2005
4646
Outcomes of the scorecard Outcomes of the scorecard intangible asset initiativesintangible asset initiatives
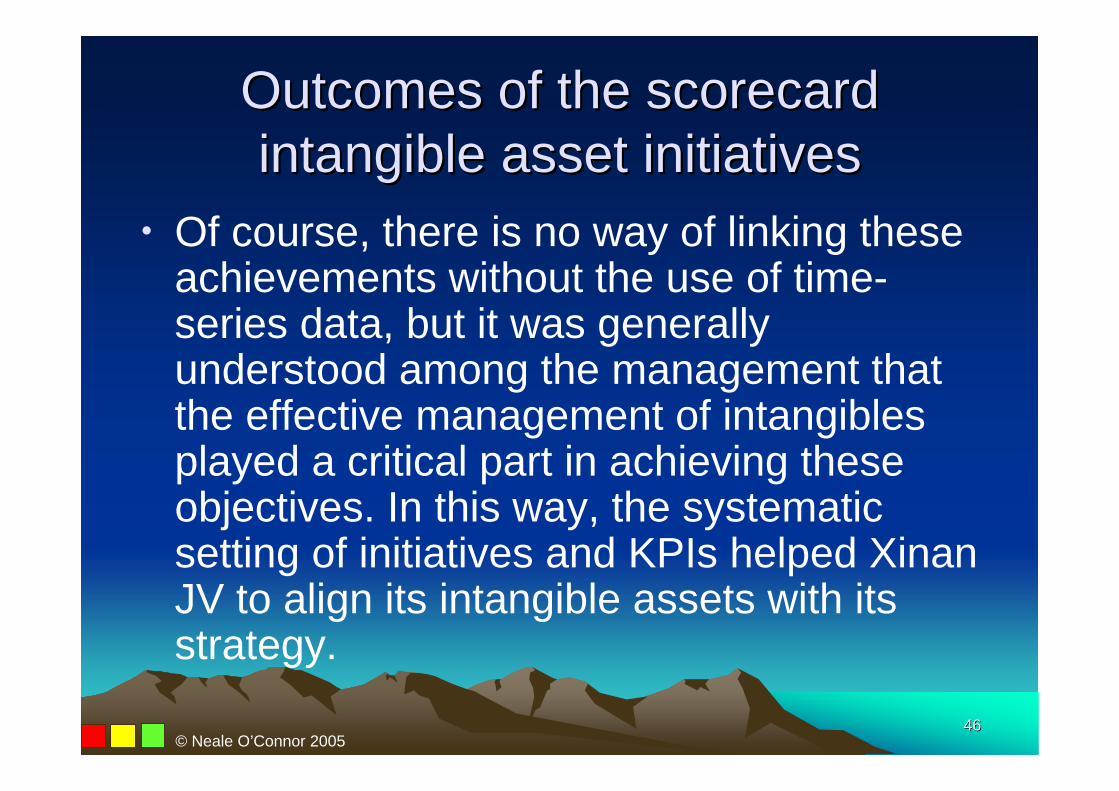
• Of course, there is no way of linking these achievements without the use of time-series data, but it was generally understood among the management that the effective management of intangibles played a critical part in achieving these objectives. In this way, the systematic setting of initiatives and KPIs helped XinanJV to align its intangible assets with its strategy.
© Neale O’Connor 2005
4747
Outcomes of the scorecard Outcomes of the scorecard intangible asset initiativesintangible asset initiatives
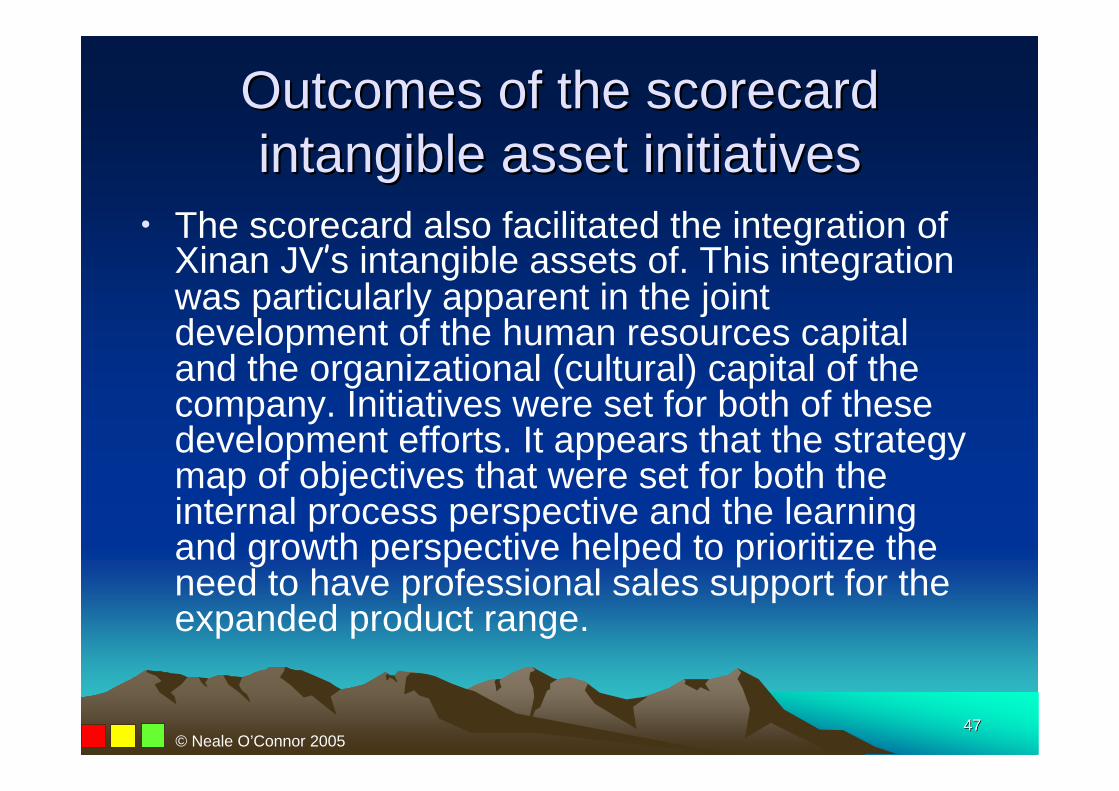
• The scorecard also facilitated the integration of Xinan JV’s intangible assets of. This integration was particularly apparent in the joint development of the human resources capital and the organizational (cultural) capital of the company. Initiatives were set for both of these development efforts. It appears that the strategy map of objectives that were set for both the internal process perspective and the learning and growth perspective helped to prioritize the need to have professional sales support for the expanded product range.
© Neale O’Connor 2005
4848
Outcomes of the scorecard Outcomes of the scorecard intangible asset initiativesintangible asset initiatives
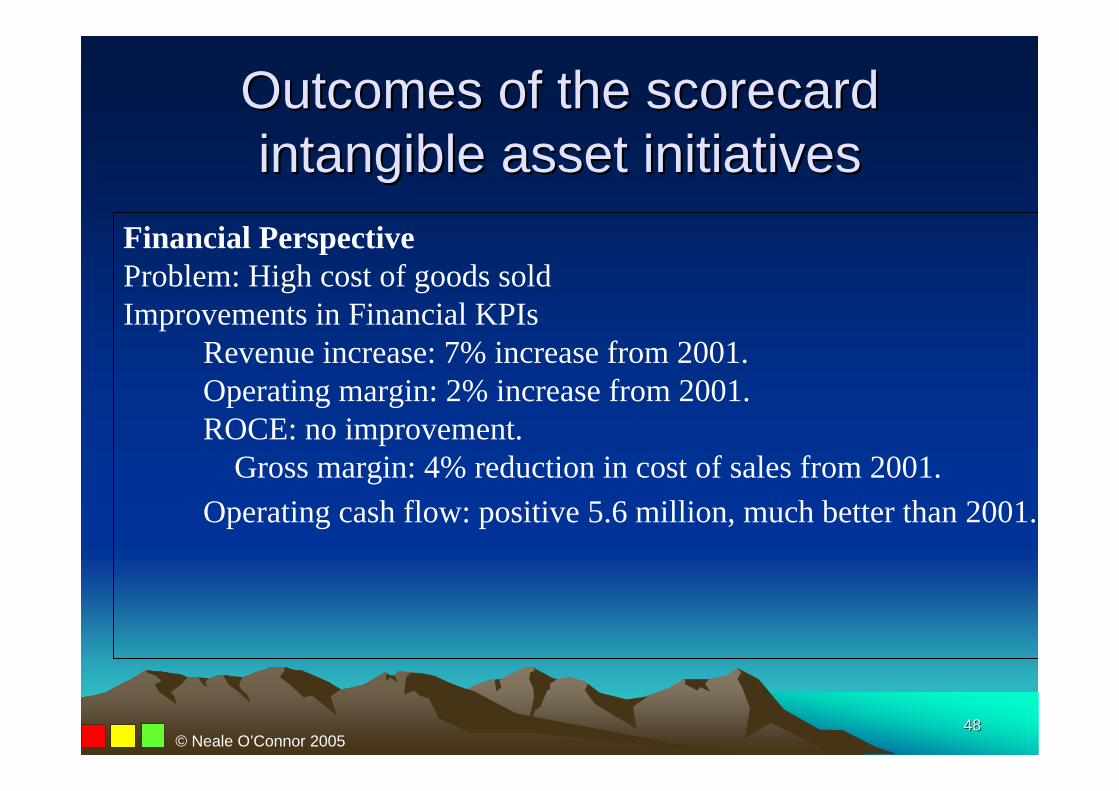
Financial PerspectiveProblem: High cost of goods soldImprovements in Financial KPIs
Revenue increase: 7% increase from 2001. Operating margin: 2% increase from 2001. ROCE: no improvement.
Gross margin: 4% reduction in cost of sales from 2001. Operating cash flow: positive 5.6 million, much better than 2001.
© Neale O’Connor 2005
4949
Outcomes of the scorecard intangible asset initiativesOutcomes of the scorecard intangible asset initiatives
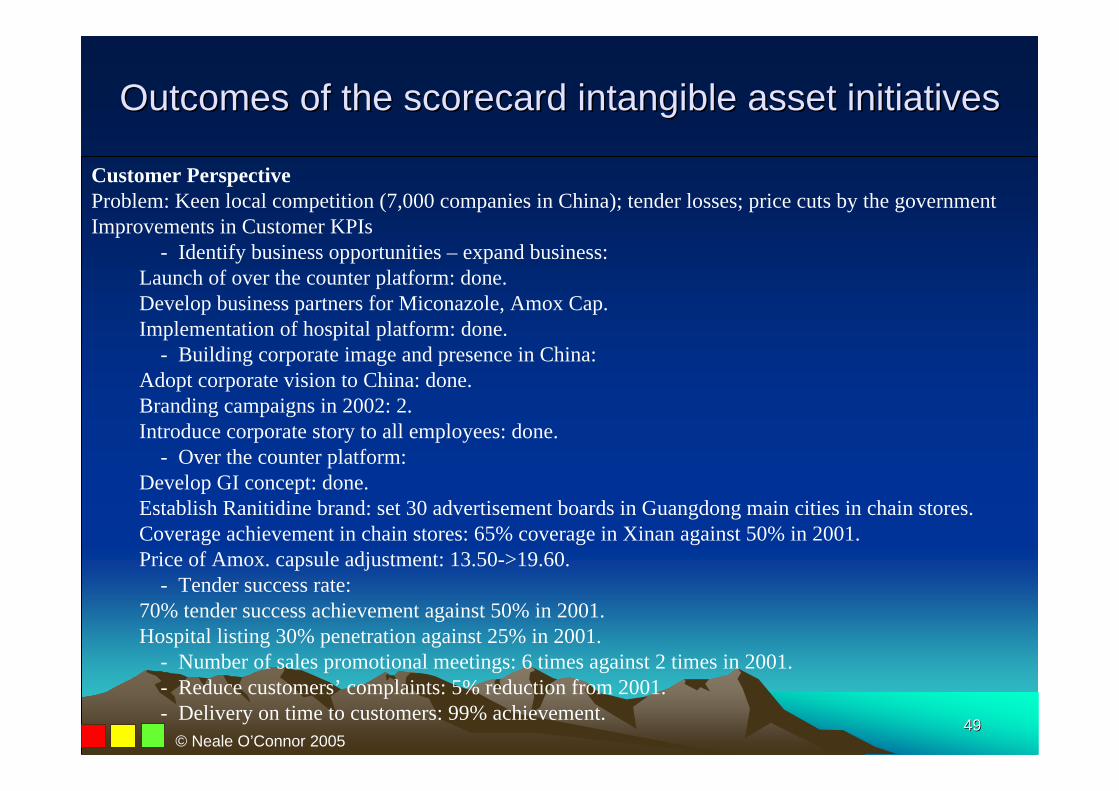
Customer PerspectiveProblem: Keen local competition (7,000 companies in China); tender losses; price cuts by the governmentImprovements in Customer KPIs
- Identify business opportunities – expand business: Launch of over the counter platform: done.Develop business partners for Miconazole, Amox Cap.Implementation of hospital platform: done. - Building corporate image and presence in China:Adopt corporate vision to China: done.Branding campaigns in 2002: 2.Introduce corporate story to all employees: done. - Over the counter platform:Develop GI concept: done.Establish Ranitidine brand: set 30 advertisement boards in Guangdong main cities in chain stores.Coverage achievement in chain stores: 65% coverage in Xinan against 50% in 2001.Price of Amox. capsule adjustment: 13.50->19.60. - Tender success rate:70% tender success achievement against 50% in 2001.Hospital listing 30% penetration against 25% in 2001. - Number of sales promotional meetings: 6 times against 2 times in 2001. - Reduce customers’ complaints: 5% reduction from 2001. - Delivery on time to customers: 99% achievement.
© Neale O’Connor 2005

5050
Outcomes of the scorecard intangible asset initiativesOutcomes of the scorecard intangible asset initiatives
Internal Process PerspectiveProblem: Old product portfolioImprovements in internal process KPIs
- Improve internal operation systems: improvements have been made in the sales management system, distribution system, planning and inventory control system, and tender management system.
- Organizational restructuring: reorganizations in the sales/marketing department, production department, regulation affairs/clinical department, and human resources department.
- Annual product review: Create SOPs for annual product review: Ranitidine, Cephardine, Enalapril, Cephalexin, Omeprazole,
Maren, Norfloxacin, Compound Cefalexin• Chinese general manufacturing practicies certification program: 6 dosages passed inspection in
December 2002• Formula and batch record improvement: top ten products were finished by December 2002• Supplier selection and audit program:
Create SOP for supplier selection: done.Master audit plan: done.Renew supplier list with QA and finance departments together: done.New purchasing policy: implemented from October 2002.Bidding process: implemented from October 2002.
• Number of successful registrations: 1 in 2002.• Number of successful new product launches: nil in 2002.• Successful milestones completion by December 2002: done.• Number of licenses – in and out: 2.© Neale O’Connor 2005
5151
Outcomes of the scorecard intangible asset initiativesOutcomes of the scorecard intangible asset initiatives
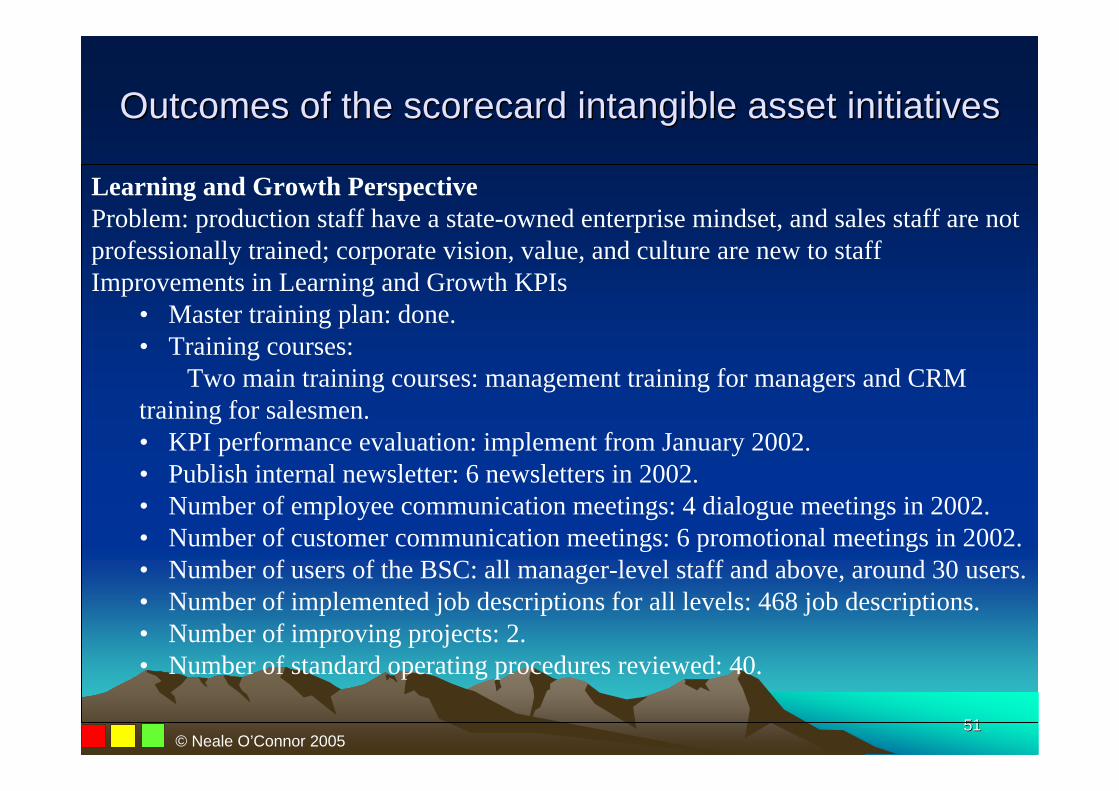
Learning and Growth PerspectiveProblem: production staff have a state-owned enterprise mindset, and sales staff are not professionally trained; corporate vision, value, and culture are new to staffImprovements in Learning and Growth KPIs
• Master training plan: done.• Training courses:
Two main training courses: management training for managers and CRM training for salesmen.• KPI performance evaluation: implement from January 2002.• Publish internal newsletter: 6 newsletters in 2002.• Number of employee communication meetings: 4 dialogue meetings in 2002.• Number of customer communication meetings: 6 promotional meetings in 2002.• Number of users of the BSC: all manager-level staff and above, around 30 users.• Number of implemented job descriptions for all levels: 468 job descriptions.• Number of improving projects: 2.• Number of standard operating procedures reviewed: 40.
© Neale O’Connor 2005
5252
Problems in Problems in implementing the implementing the
balanced scorecardbalanced scorecard
© Neale O’Connor 2005

5353
Problems in implementing the Problems in implementing the balanced scorecardbalanced scorecard
• the initiatives that had been set through the balanced scorecardprocess were useful in helping to communicate strategy and to measure the effectiveness of various intangible asset initiatives. The initiatives helped to narrow the focus and provide guidance on day-to-day operations. The managers thought that it was critical that the initiatives were aligned with strategy, and that they had to be mutually agreed upon and reviewed frequently. Training was necessary to teach employees how to set initiatives and manage them. The KPIs helped in the management of intangibles, because they set a benchmark which, if set properly, fosters a culture of continuous improvement. The key was for the KPIs to be implemented through team building training exercises so that themanagement was able to overcome the previous problem of “passing the buck.”

5454
Problems in implementing the Problems in implementing the balanced scorecardbalanced scorecard
• difficulty of the scorecard in showing contingency plans that reflected factors that were outside of their control (eg. such as changes in the environment). One example was particularly relevant in describing both the strengths and weaknesses of the KPIs that were used as part of the scorecard. In 2002, price reductions ondozens of pharmaceutical products by the China Government caused several of the KPI sales targets to be overly optimistic and were subsequently not achieved. This in turn, caused the sales and marketing managers to complain routinely to the finance directorand the CEO. As one marketing manager reflected, his extent of influence on achieving the sales KPIs was only 30%. In response to this problem, new KPIs were developed that helped to focus the marketing effort on submitting applications for special prices on a few key well established products (eg. Amox. Capsule, see the customer perspective in Figure 6).

5555
Problems in implementing the Problems in implementing the balanced scorecardbalanced scorecard
• The scorecard also facilitated the integration of XinanJV’s intangible assets of. This integration was particularly apparent in the joint development of the human resources capital and the organizational (cultural) capital of the company. Initiatives were set for both of these development efforts. It appears that the strategy map of objectives that were set for both the internal process perspective and the learning and growth perspective helped to prioritize the need to have professional sales support for the expanded product range. However, the integration of these efforts with the development of information capital was less of a priority. For example, the planned investment in a new ERP system was delayed until 2003. This integrating decision appears to have been made at the strategy level.
56
© Neale O’Connor 2005

57
About CTI Ltd
© Neale O’Connor 2005

58
2003 : Sales revenue brokethrough 400million yuan. The Information Payphones were sold out for 28 thousand sets, and our Smart Card Payphones were pushed into Africa market successfully. The Guannan Garden started construction on schedule and the main building was top-out at the end of year.
2002 : Our company issued in Shanghai Stock Exchange on 13th of June.
2001 : Launched Multi-Services-Public-Information solutions to build New Generation Payphone Network. Shanghai Jinglun Communication Technology Inc. was founded. Wuhan Jinglun was approved to have the ISO9001:2000 certification. Wuhan Jinglun was approved to be an IPO enterprise in the main stock market in China.
2000 : Cooperated with Huazhong University of Science and Technology, Huagongda Jinglun Software Institute was established. ERP Project was put into practice in our company. Wuhan Jinglun Science and Technolgy Ltd. was founded.
1999 : Spent over one year developing Model HIC166T IC phone and wan trial net ting certificate issued by China Telecommunication Bureau. The equipment was used in more than 100 regions all over China. The output value of variouspublic communication terminal products was210 million RMB yuan.
1998 : The JJF-24 Auto-phone Bill Calculator and the centralized management system were put into production and exported to 24 countries in Mid-East such as Yemen. The production this year was 300,000; the output value amounted to 180 million RMB yuan.
put into market. The production of equipment was 270,000; the output value amounted to 180 million RMB yuan.
1997 : JJF-24 Auto-phone Bill Calculator and the centralized management system were
1996 : Model JJF-24 Phone Bill Calculator won the inspection certificate of quality of theMinistry of Post and Telecommunications, and also won the official document to go intonetwork issued by the National China Telecommunication Bureau of the Ministry of Posts and Telecommunications.The production of equipment was 100,000; the output value was more than 60 million RMB.
1995 : The production of equipment this year was 20,000; the output value was more than 19 million RMB yuan.
1994 : Our company was founded in Dec, 1994.
About CTI Ltd
© Neale O’Connor 2005

59
China Case study of a business strategy map application
Major producer and supplier of telecom equipment in China.
30 Branches throughout China The functional branch managers expend
considerable effort in:managing customer service personnel, promoting and obtaining sales and account
management. Growth industry with 1,000 different manufacturers
and suppliers of components to firms throughout China.
© Neale O’Connor 2005
60
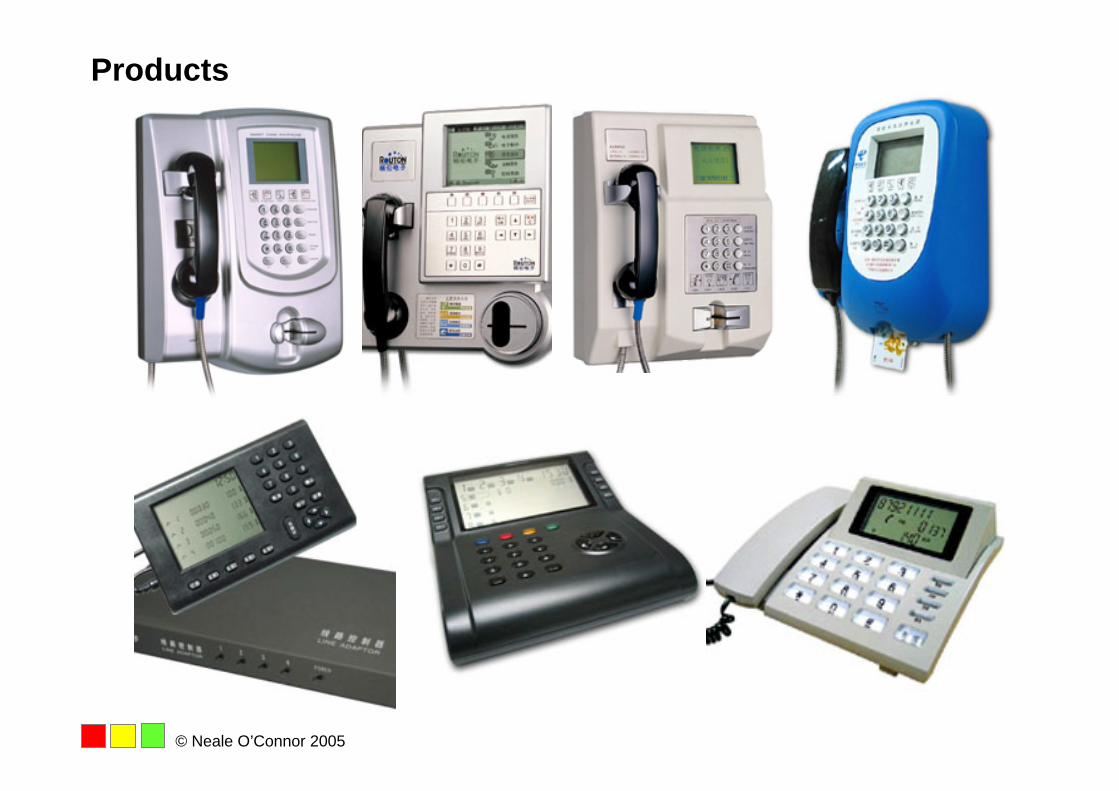
Products
© Neale O’Connor 2005
61
Critical factors of Critical factors of CTIsCTIs strategystrategy
© Neale O’Connor 2005
62
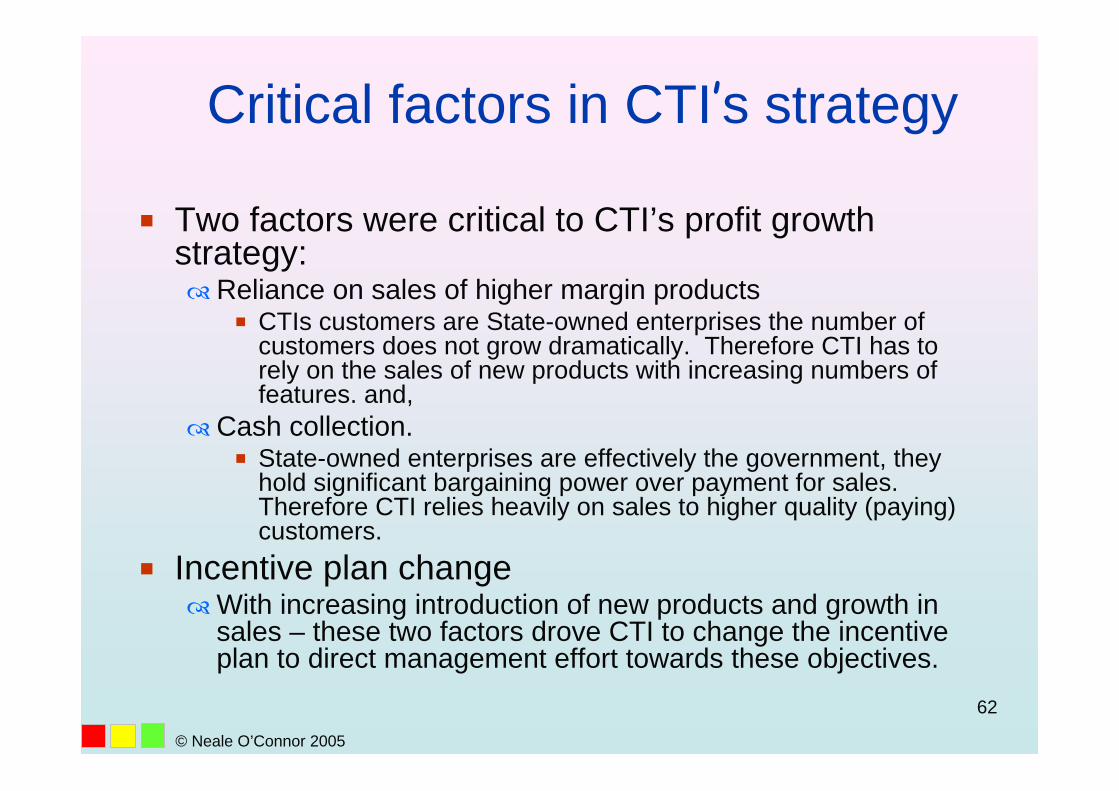
Critical factors in CTI’s strategy
Two factors were critical to CTI’s profit growth strategy: Reliance on sales of higher margin products
CTIs customers are State-owned enterprises the number of customers does not grow dramatically. Therefore CTI has to rely on the sales of new products with increasing numbers of features. and,
Cash collection. State-owned enterprises are effectively the government, they
hold significant bargaining power over payment for sales. Therefore CTI relies heavily on sales to higher quality (paying)customers.
Incentive plan changeWith increasing introduction of new products and growth in
sales – these two factors drove CTI to change the incentive plan to direct management effort towards these objectives.
© Neale O’Connor 2005
6363
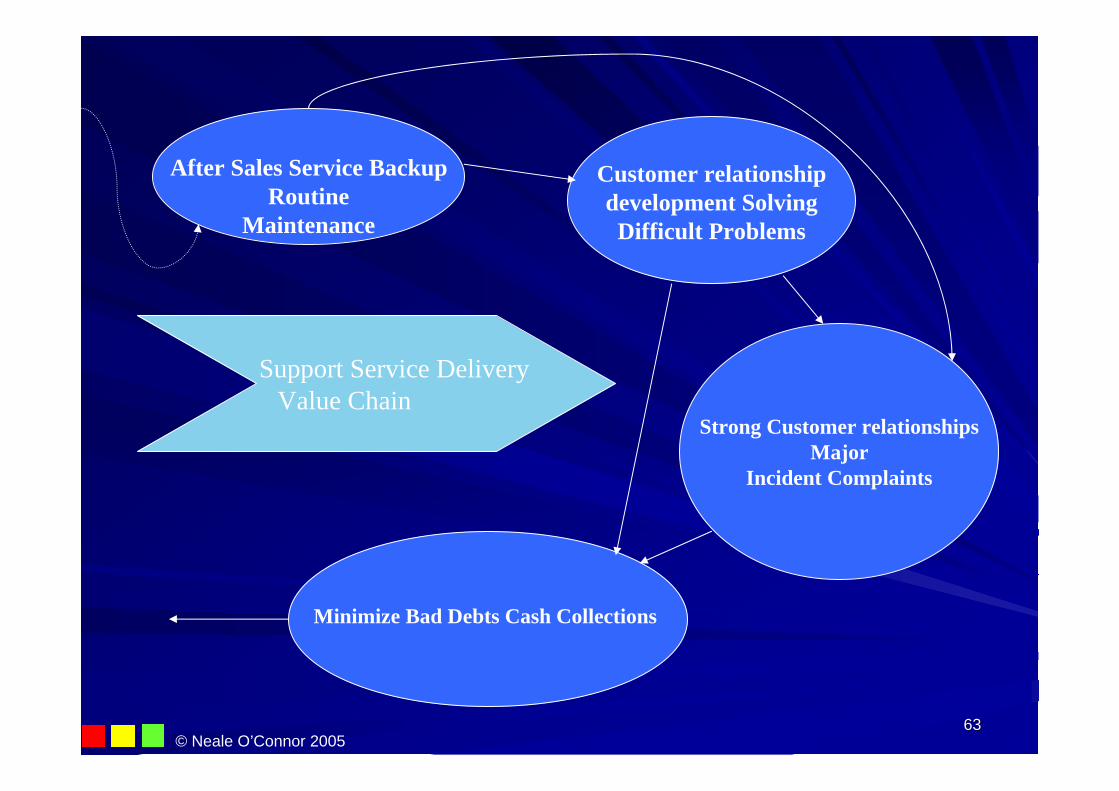
After Sales Service BackupRoutine
Maintenance
Customer relationshipdevelopment SolvingDifficult Problems
Strong Customer relationshipsMajor
Incident Complaints
Minimize Bad Debts Cash Collections
Support Service Delivery Value Chain
© Neale O’Connor 2005
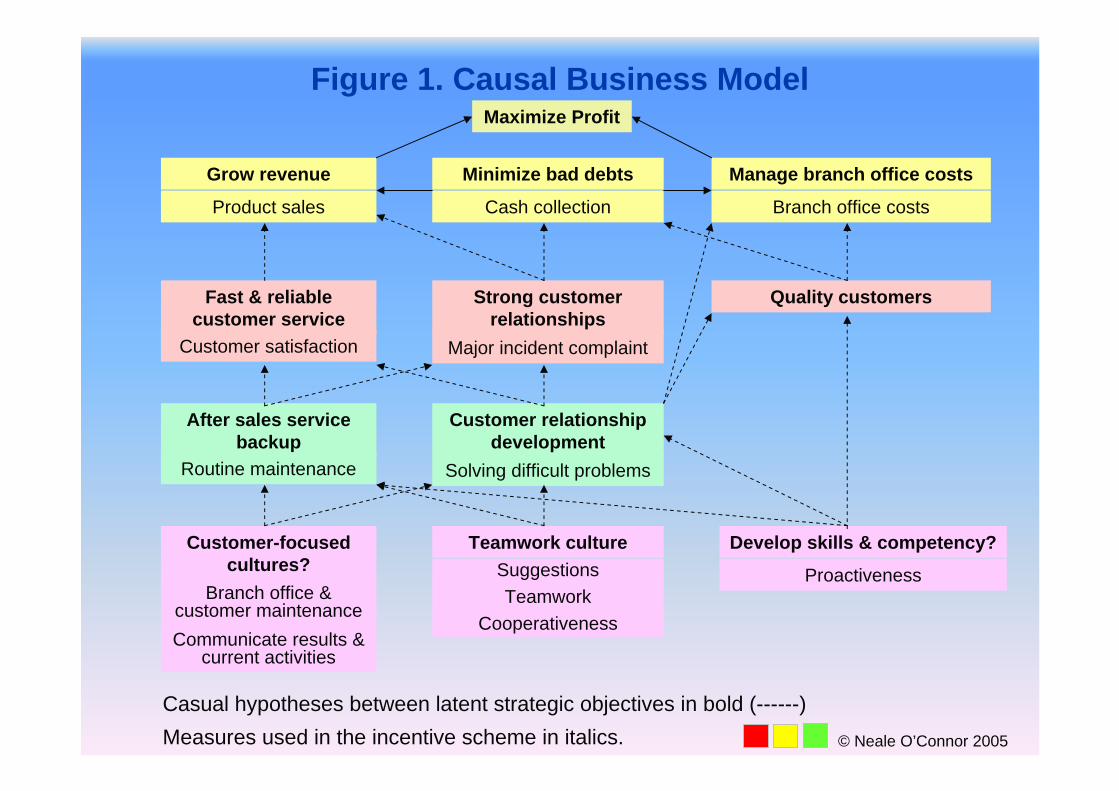
Figure 1. Causal Business ModelMaximize Profit
Grow revenue
Product sales
Minimize bad debts
Cash collection
Manage branch office costs
Branch office costs
Fast & reliable customer service
Customer satisfaction
Strong customer relationships
Major incident complaint
Quality customers
After sales service backup
Routine maintenance
Customer relationship development
Solving difficult problems
Teamwork cultureSuggestions Teamwork
Cooperativeness
Customer-focused cultures?
Branch office & customer maintenanceCommunicate results &
current activities
Develop skills & competency?
Proactiveness
Casual hypotheses between latent strategic objectives in bold (------)Measures used in the incentive scheme in italics. © Neale O’Connor 2005

Figure 2. Relationships between Incentive Plan components
Direct Impact of the Incentive Plan (------)
++
-
Non-financial Performance Financial Performance
Incentive Plan Profit
Product Sales (of specific product types)
Cash Collected (with specified targets)
Branch office costs (relative to other branches)
-Rent, electricity, telephone, office, supplies, entertainment and travel
Each branch is ranked according to the costs incurred and the middle ranking and lower receive greater weights towards bonus
Customer satisfaction
Major incident complaint
Execution of routine maintenance
Branch office and customer maintenance
Subjective evaluation by Vice President
-Teamwork- Misc work
Subjective evaluation by President and VP sales- Proactive & Innovative
(e.g. Making suggestions, doing things beyond
responsibilities & solving difficult problems
+-
+
+
+
+
+ -
+
++
--
+
© Neale O’Connor 2005

66
CTIsCTIs incentive planincentive plan
© Neale O’Connor 2005

67
Critical points in the ongoing development of the incentive system
1998 – initial incentive system 2000 – increased weight on new product (more
growth) – targets introduced to motivate sales staff 2000 – September – announcement that all cash
collected before January 2001 will be *4 times 2001 – new manager, greater emphasis on
subjective measures – to internally develop sales staff
2002 – Stock exchange listing - sell sell sell!
© Neale O’Connor 2005
68
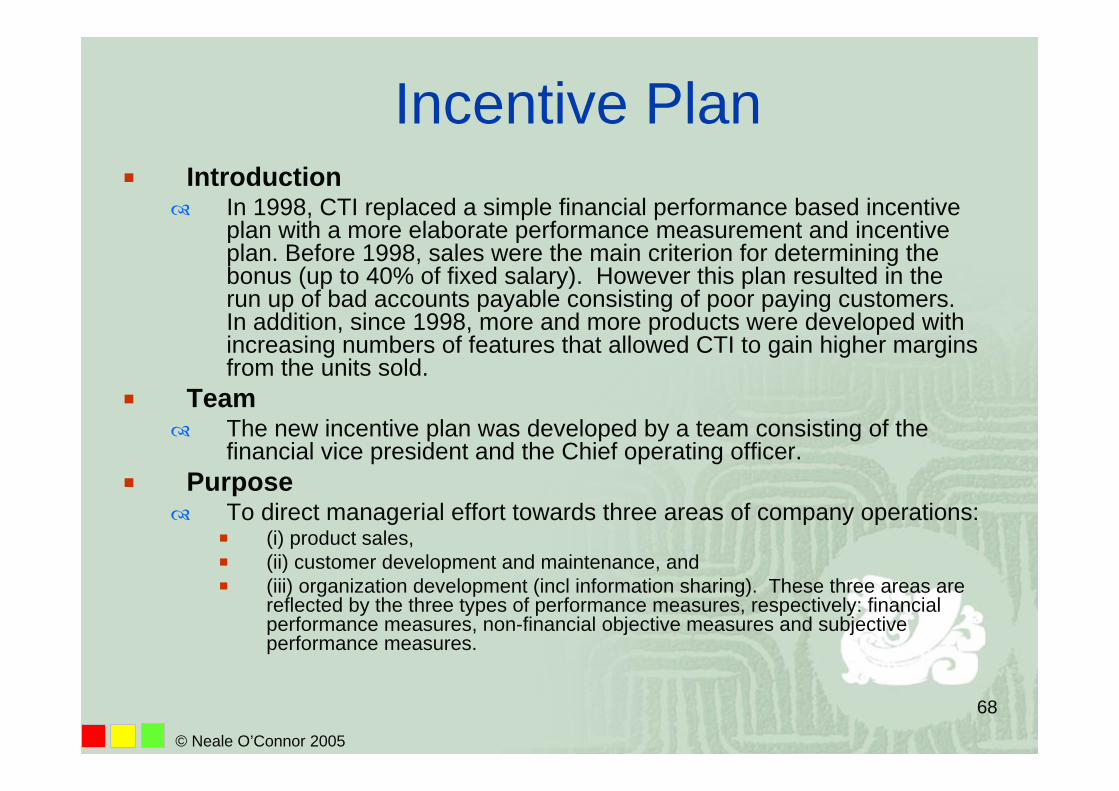
Introduction In 1998, CTI replaced a simple financial performance based incentive
plan with a more elaborate performance measurement and incentiveplan. Before 1998, sales were the main criterion for determining the bonus (up to 40% of fixed salary). However this plan resulted in the run up of bad accounts payable consisting of poor paying customers. In addition, since 1998, more and more products were developed with increasing numbers of features that allowed CTI to gain higher margins from the units sold.
Team The new incentive plan was developed by a team consisting of the
financial vice president and the Chief operating officer. Purpose
To direct managerial effort towards three areas of company operations: (i) product sales, (ii) customer development and maintenance, and (iii) organization development (incl information sharing). These three areas are
reflected by the three types of performance measures, respectively: financial performance measures, non-financial objective measures and subjective performance measures.
Incentive Plan
© Neale O’Connor 2005
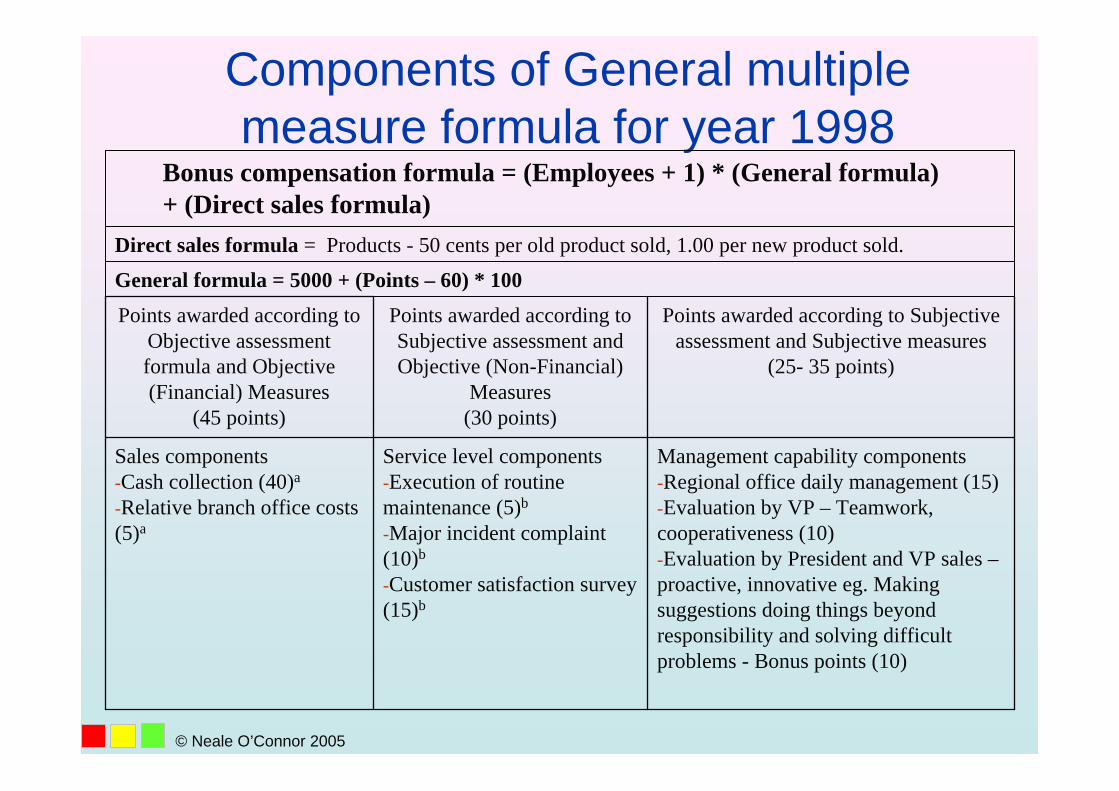
Components of General multiple measure formula for year 1998
Management capability components-Regional office daily management (15)-Evaluation by VP – Teamwork, cooperativeness (10)-Evaluation by President and VP sales –proactive, innovative eg. Making suggestions doing things beyond responsibility and solving difficult problems - Bonus points (10)
Service level components-Execution of routine maintenance (5)b
-Major incident complaint (10)b
-Customer satisfaction survey (15)b
Sales components-Cash collection (40)a
-Relative branch office costs (5)a
Points awarded according to Subjective assessment and Subjective measures
(25- 35 points)
Points awarded according to Subjective assessment and Objective (Non-Financial)
Measures(30 points)
Points awarded according to Objective assessment formula and Objective (Financial) Measures
(45 points)
General formula = 5000 + (Points – 60) * 100
Direct sales formula = Products - 50 cents per old product sold, 1.00 per new product sold.
Bonus compensation formula = (Employees + 1) * (General formula)+ (Direct sales formula)
© Neale O’Connor 2005

The general formula consists of: Bonus of (yuan) 5000 plus a bonus of up to (yuan)
5000 that is determined by the awarding of up to 110 points. 45 points are determined by the financial performance measures, 30 points award based on subjective measures of service level
components up to 35 points are awarded based on subjective measures of
management capability components.
The financial performance measures Sales Cash collections is computed as the amount of cash collected as
a percentage of total accounts receivable for the period, branch office costs involved a competitive ranking across
branches with only half the branches being eligible for points towards the bonus formula on a decreasing scale (from middle to the least costs incurred).
© Neale O’Connor 2005
71
The general formula consists of:
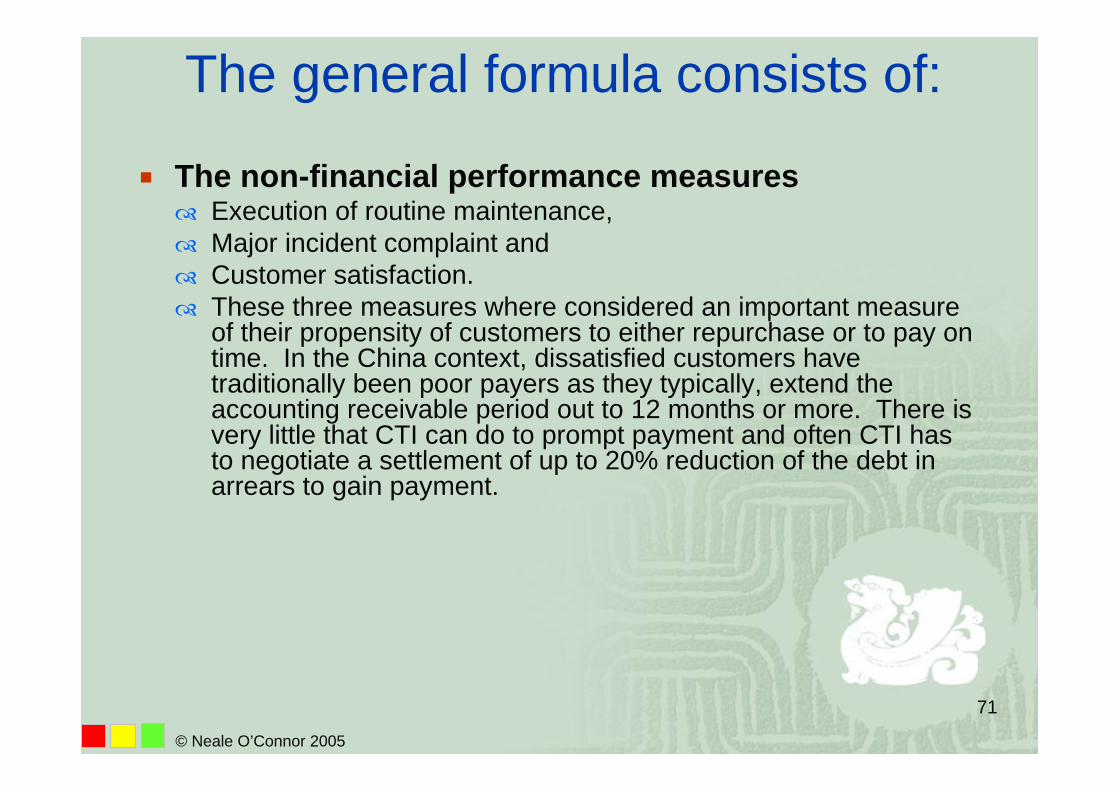
The non-financial performance measures Execution of routine maintenance, Major incident complaint and Customer satisfaction. These three measures where considered an important measure
of their propensity of customers to either repurchase or to pay on time. In the China context, dissatisfied customers have traditionally been poor payers as they typically, extend the accounting receivable period out to 12 months or more. There isvery little that CTI can do to prompt payment and often CTI has to negotiate a settlement of up to 20% reduction of the debt in arrears to gain payment.
© Neale O’Connor 2005

Inclusion of subjective measures Need to balance sales managers’ attention
between sales and service and the development of the firm as a whole such as branch development initiatives and information sharing with the head office.
In addition to having a mix of objective and subjective non-financial performance measures, top level management (The President and Vice President of sales) engaged in once yearly subjective performance evaluation in which up to 35 points (out of 100) were awarded to each branch as part of the bonus determination. This evaluation could result in an increase or decrease of the bonus by as much as 20%. © Neale O’Connor 2005

73
Evaluation of the Evaluation of the subjective subjective componentcomponent
© Neale O’Connor 2005

74
INDUSTRYGWTH
EMPLOYEEGWTH
ACCRECC
CUSTOMER
SUBJECTIVE
DISTANCE
SALES t-1
SALES
-
+
+
-
+
+
-
What influences the rating of the subjectivity component?
© Neale O’Connor 2005
+
+