1 Understanding the Patient Journey - Process Mapping Why ...
16
1 Understanding the Patient Journey - Process Mapping Why Process Map? It is important to understand how patients proceed through the care delivery system. The best way to achieve this is through process mapping. Process maps are an effective way to identify constraints and bottlenecks, rework (activity required to correct situations that could have been avoided) and unnecessary process steps (duplication, waste and error). It is unlikely that any one member of staff will fully understand the whole service until the process has been mapped. Process mapping is the single most useful diagnostic tool for determining where problems lie. Understanding the process from the patient perspective is essential if patient focussed service improvements are to be made. The process map must always depict the total number of steps taken, as well as the total number of people involved, the total time taken to perform the process step, and all documents used. What are the Stages? There are two stages to process mapping. First, understand what happens to the patient, where it happens and who is involved. Secondly, examine the process map to determine where there are problems - such as multiple hand-offs, parts of the process that are unnecessary or do not add value. These include waste, error and duplication or parts of the process which would flow better if undertaken in a different order. How to Process Map The first step is to get the staff together and map the process at a high level. Choose clearly defined start and end points; for example for minors patients in A&E, when the patient enters the A&E until they are discharged. When mapping the patient journey, it is important to identify and concentrate on the high volume runner groups – please see appendix 1. At this stage a quick mapping exercise by a few staff may be useful to determine who will be involved in a more detailed mapping exercise. It is essential to have representatives of all staffing groups involved in the process at the main mapping exercise, and a quick high level map will help ensure no staff group is forgotten. Do not forget to involve patients in the mapping process. Top Tip Remember to map the process as it usually happens, not the ideal
Transcript of 1 Understanding the Patient Journey - Process Mapping Why ...
1
Understanding the Patient Journey - Process Mapping Why Process Map? It is important to understand how patients proceed through the care delivery system. The best way to achieve this is through process mapping. Process maps are an effective way to identify constraints and bottlenecks, rework (activity required to correct situations that could have been avoided) and unnecessary process steps (duplication, waste and error). It is unlikely that any one member of staff will fully understand the whole service until the process has been mapped. Process mapping is the single most useful diagnostic tool for determining where problems lie. Understanding the process from the patient perspective is essential if patient focussed service improvements are to be made. The process map must always depict the total number of steps taken, as well as the total number of people involved, the total time taken to perform the process step, and all documents used. What are the Stages? There are two stages to process mapping. First, understand what happens to the patient, where it happens and who is involved. Secondly, examine the process map to determine where there are problems - such as multiple hand-offs, parts of the process that are unnecessary or do not add value. These include waste, error and duplication or parts of the process which would flow better if undertaken in a different order. How to Process Map The first step is to get the staff together and map the process at a high level. Choose clearly defined start and end points; for example for minors patients in A&E, when the patient enters the A&E until they are discharged. When mapping the patient journey, it is important to identify and concentrate on the high volume runner groups – please see appendix 1. At this stage a quick mapping exercise by a few staff may be useful to determine who will be involved in a more detailed mapping exercise. It is essential to have representatives of all staffing groups involved in the process at the main mapping exercise, and a quick high level map will help ensure no staff group is forgotten. Do not forget to involve patients in the mapping process.
Top Tip Remember to map the process as it usually happens, not the ideal

2
You might find it useful to use “post-it” notes to capture the information, this way they can be rearranged as the exercise progresses and the patient journey emerges. They need to capture information at the level of one person, one place and one time. Arrange the post-its to ensure they capture the journey as the patient experiences it, including hand-offs, multiple staff, changes in location, loops and parallel processes.
Patient Arrives in A&EDiagnostics
High level
TEST ORDERED TEST COMPLETED REPORT RECEIVED REPORT SEEN
Initial Assessment
Detailed Level
Top Tip Walk the process with a patient to check that all events are included
3
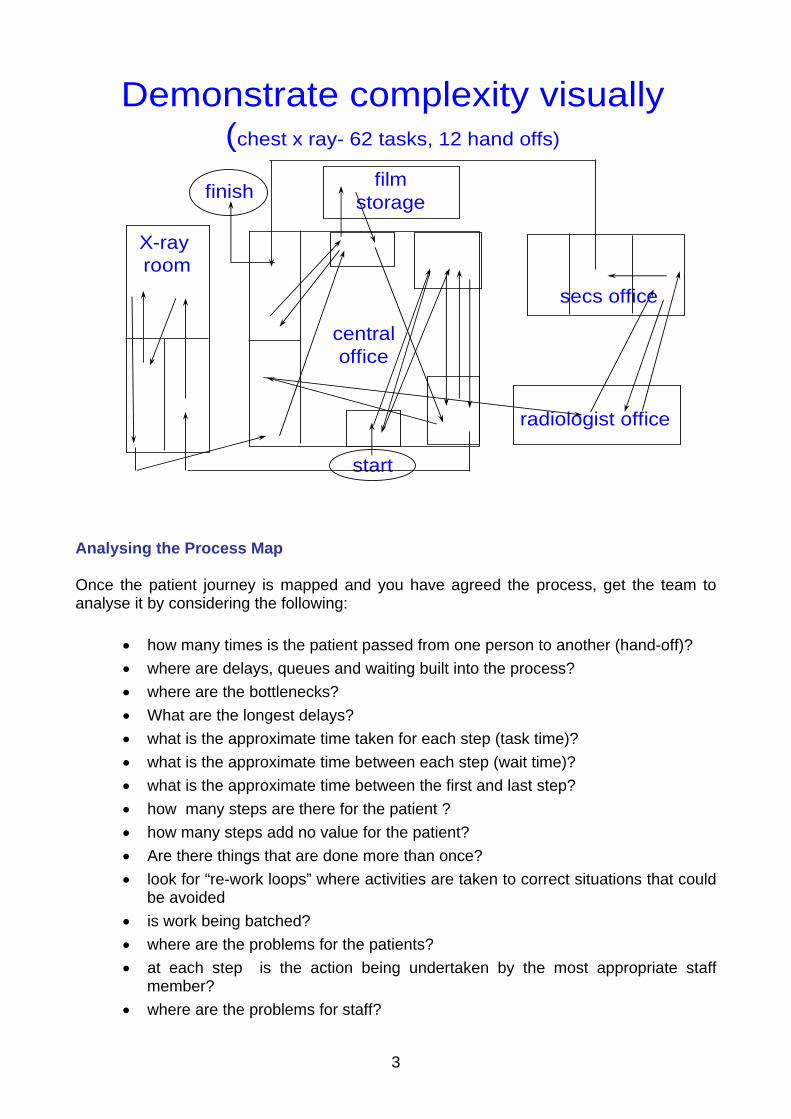
Demonstrate complexity visually(chest x ray- 62 tasks, 12 hand offs)
start
finish
centraloffice
secs office
X-ray room
filmstorage
radiologist office
Analysing the Process Map Once the patient journey is mapped and you have agreed the process, get the team to analyse it by considering the following:
• how many times is the patient passed from one person to another (hand-off)? • where are delays, queues and waiting built into the process? • where are the bottlenecks? • What are the longest delays? • what is the approximate time taken for each step (task time)? • what is the approximate time between each step (wait time)? • what is the approximate time between the first and last step? • how many steps are there for the patient ? • how many steps add no value for the patient? • Are there things that are done more than once? • look for “re-work loops” where activities are taken to correct situations that could
be avoided • is work being batched? • where are the problems for the patients? • at each step is the action being undertaken by the most appropriate staff
member? • where are the problems for staff?

4
Ask yourselves if the patient getting the most efficient care at the most appropriate time in the right place?
Consider the steps which cause the most delays. These steps can then be mapped in more detail. This can be done several times, each time getting a greater level of detail. Key causes of delays: Handoffs This is where patient care or information is handed from one individual to another. For example:
Doctor Triage Nurse
X-Ray
Patient enters A&E reception
Nurse
Plaster Technician
Discharged Home
Top Tip Also consider what patients complain about.

5
Bottlenecks and Constraints A bottleneck is any part of the system where patient flow is obstructed causing waits and delays. It interrupts the natural flow and hinders movement along the care pathway. However there is usually something that is the actual cause of the bottleneck and is the constraint. This is usually a skill or piece of equipment. There are two different types of bottlenecks; process bottlenecks and functional bottlenecks. Process bottlenecks are that stage in a process that takes the longest time to complete. Process bottlenecks are often referred to as the ‘rate limiting step or task’ in a process.
1 2 3 4 Functional bottlenecks are caused by services that have to cope with demand from several sources. Radiology, pathology, radiotherapy, and physiotherapy are often functional bottlenecks in healthcare processes. Functional bottlenecks cause waits and delays for patients because:
• one process, such as ENT surgery, might share a function, such as imaging with other processes, e.g. orthopaedic surgery, and medicine • a surgeon may be called to theatre when he is also needed in A&E • a GP has to go out on an emergency call when they have patients waiting to be seen in surgery • a social worker may be torn between representing an existing client in court or doing an assessment of a patient to allow them to be discharged
In the example to the left, activity 3, is the process bottleneck as it takes the longest time. It could be the time to taken to get an x-ray.

6
This type of bottleneck causes a disruption to the flow of all patient processes. Functional bottlenecks act like a set of traffic lights, stopping the flow of patients in one process while allowing the patients to flow in another.

7
Look for batching
Dr sees patients
individually
Requests sent in batches
Results return in batches
Batching is where ‘tasks’ are queued before processing. Parallel Processes Parallel processes are important and are the cause of delays for patients and frustration for staff. Mapping, analysing and improving parallel processes will often deliver great benefits. Parallel processes include:
• processes involved in generating a referral letter and notifying the patient about referral arrangements
• processes involved in dealing with pathology specimens - from the time the specimen is taken to the point when the requesting clinician receives the test results
• processes involved in the imaging reporting system – from the image and the report being received by the referring clinician
• processes involved in medical records – from getting the notes to returning them to ‘file’
Tracking
Process mapping is basic and simple — the best way to learn it is to do it!
Process mapping is a repetitive process, maps should never be thrown away but reviewed
and updated.
Display the maps so all staff can see them and contribute to ongoing improvements.

8
Exercise Undertake a patient tracking exercise again concentrating on high volume runner groups. The best thing to use is a blank sheet of paper with just the patient’s name or identifier. You will need to track each key event/stage with the time it occurs and the person carrying out the intervention. This will allow you to track the complexity of the patient journey. Track at least 25 patients. You may need to consider doing this on different days of the week or times of the day Analysis of the patient tracking forms will allow you to either validate the process mapping or challenge any assumptions made. What Next? Test and make the changes Start to use the model (Plan, Do, Study Act) to implement changes:
• Identify the improvement areas from your process mapping; simplify them into manageable tasks (Plan)
• Initiate system redesign and carry out the test or change (Do) • Study the data before and after the change (Study) • Plan the next change cycle or plan implementation (Act)

9
Flow Analysis What is Flow Analysis? The Flow Analysis Tool (FAT) builds on the concept of process mapping. It has been adapted from a tool widely used in manufacturing and allows sites to ‘deconstruct’ elements of the process so that it is possible to see in detail what is happening at each stage of the patient process. Understanding patient flow is vital in complex systems to fully identify repetition, queues and delays. The FAT builds upon the detailed process mapping to create the current state flow analysis map. The FAT will allow you to:
• analyse patient flow across more complex processes • identify whether the systems are managed and in control • see what adds value and where waste occurs • understand roles and responsibilities related to managing patient flows
The value of showing several sets of information related to the flow together on the same map is that patient, communication and information flows can be clearly seen, and the value of each step analysed in terms of the time taken and the value of that step in the journey. Identifying clearly who ‘owns’ (or is responsible for) each stage of the process is important, and will see where there are gaps where no-one appears to own what is happening. The first stage is to identify the main high volume runner groups, as with process mapping you can use Pareto analysis (80/20 rule) to focus efforts on the problems offering the greatest potential for improvement without being side-tracked by events that rarely happen. See appendix 1. Flow Analysis and Process Mapping- Differences Process mapping looks at the care process and understands how patients flow through the system. Flow analysis builds on the work of process mapping and looks at the care process from a unit/department perspective bringing a number of patient process maps together to look at work flow.
10
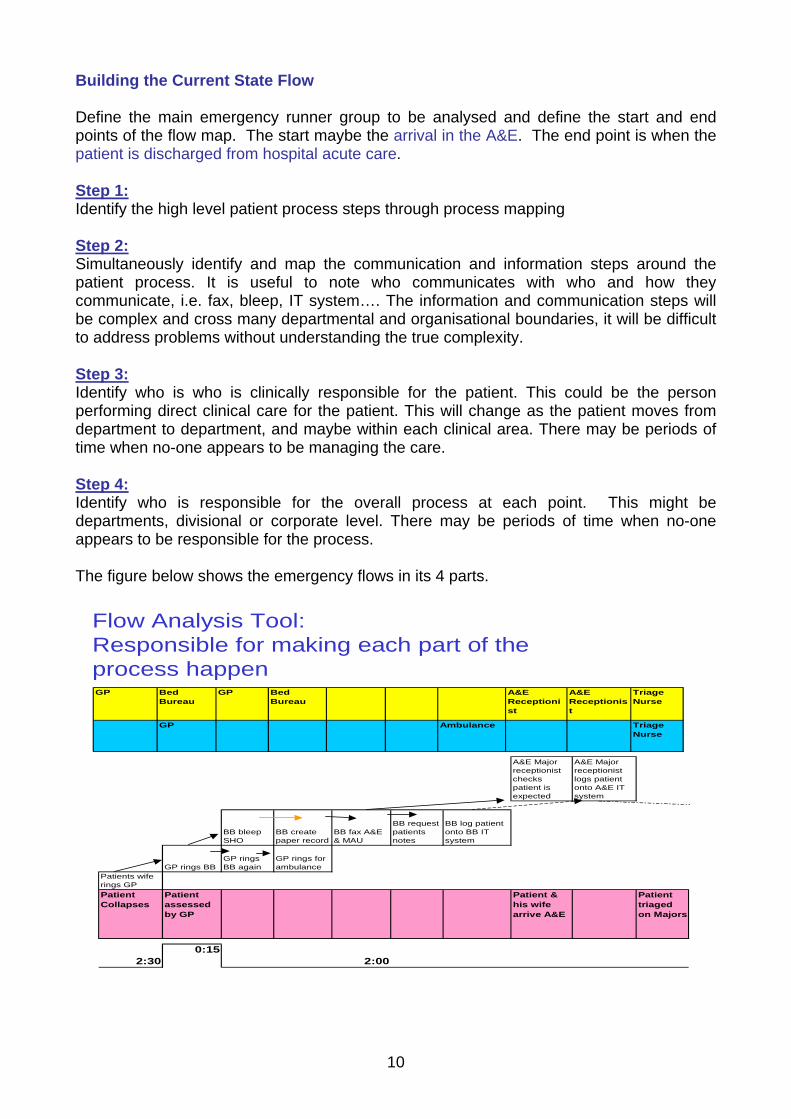
Building the Current State Flow Define the main emergency runner group to be analysed and define the start and end points of the flow map. The start maybe the arrival in the A&E. The end point is when the patient is discharged from hospital acute care. Step 1: Identify the high level patient process steps through process mapping Step 2: Simultaneously identify and map the communication and information steps around the patient process. It is useful to note who communicates with who and how they communicate, i.e. fax, bleep, IT system…. The information and communication steps will be complex and cross many departmental and organisational boundaries, it will be difficult to address problems without understanding the true complexity. Step 3: Identify who is who is clinically responsible for the patient. This could be the person performing direct clinical care for the patient. This will change as the patient moves from department to department, and maybe within each clinical area. There may be periods of time when no-one appears to be managing the care. Step 4: Identify who is responsible for the overall process at each point. This might be departments, divisional or corporate level. There may be periods of time when no-one appears to be responsible for the process. The figure below shows the emergency flows in its 4 parts.
Flow Analysis Tool:Responsible for making each part of the process happen
A&E Major receptionist checks patient is expected
A&E Major receptionist logs patient onto A&E IT system
BB bleep SHO
BB create paper record
BB fax A&E & MAU
BB request patients notes
BB log patient onto BB IT system
GP rings BBGP rings BB again
GP rings for ambulance
Patients wife rings GPPatient Collapses
Patient assessed by GP
Patient & his wife arrive A&E
Patient triaged on Majors
0:152:30 2:00
GP Bed Bureau
GP Bed Bureau
A&E Receptionist
A&E Receptionist
Triage Nurse
GP Ambulance Triage Nurse

11
Step 1 – patient process steps (pink) Step 2 – communication/information steps (white) Step 3 –clinical responsibility (blue) Step 4 – process responsibility (yellow) Work out the time the whole process takes by identifying how long each stage in the process takes with a line across the bottom of the map. Use a common unit to record time, i.e. hours or minutes. Look at what adds value to the patient process from the patients’ point of view and what is clinically necessary. Analyse the current state map:
• Identify hand-offs, bottlenecks and batching
• Define and collect any data that will help understand the flow, and see where waste occurs, and the relationship between different factors
• Use the waste spotters guide, clearly indicating where waste occurs,
• Identify which are the value steps for the patient and the value clinical steps
Waste Analysis Identifying waste as a part of the analysis of the current state map is important to help you assess which steps add value to the patient process, and where waste occurs. On the current state map identify where waste occurs, what type of waste it is and consider waste related to the longest stages of the process. There are several types of waste that exist in patient journeys. See the waste spotters guide in appendix 2 Value and Non Value Added Activity By identifying those activities that do not add value to the patient or have no clinical value, and by seeking to reduce or eliminate them from the patient journey, it is possible to provide a service that is more responsive to the patient and reduces waits and delays. Value adding activities are those activities that in the eyes of the patient make the service they are receiving valuable. e.g. the taking of an x-ray to enable diagnosis, closure of a wound in A&E. Consider value adding ideas as those you would consider paying for. Waste is anything that does not add value for the patient. What Next?
• Use the flow analysis tool for each flow to map the main emergency runner group • Analyse it using the waste spotters guide, clearly indicating where waste occurs,
which are the value steps for the patient and the value clinical steps • Define and collect any data that will help understand the flow, and see where waste
occurs, and the relationship between different factors

12
Improving your Value Flow Establishing the logical flow of patients through a hospital is key to reducing the length of the patient journey. The value steps must be in the right order and can be re-ordered if necessary. Re-ordering is important as it is inappropriate to do more work on a flow that has value steps in the wrong order, or has too many steps. The are four key principles to making the flow more effective: Small batch sizes
– patients move in groups of as near to one as possible Linked processes
– Each stage of the process linked to the previous one Setting the pace
– each part of the process able to deal with the same level of demand – patients move from one part of the process to the next at the same rate
Overall co-ordination
– Whole process co-ordinated by one individual – High level of visibility of how the flow is working
Linked Processes Linked processes means that each stage of the process is linked to the previous one and no part of the process functions in isolation. The importance of linking one step to the next is that they always have the capacity to deal with what they are receiving and know what to expect in advance. For example, if the Medical Assessment Unit know who is arriving in A&E they can manage their own work taking this into consideration
Patient and Information Flow
Clinical assessment Investigations Clinical
decision Admission Treatment Discharge
Patient and Information Flow

13
Setting the Pace This means that each part of the process must be able to deal with the same level of demand at the same time, so patients can move from one part of the flow to the next at the same rate.
Setting the Pace
Clinical assessment
Investigations Clinical decision Admission Treatment Discharge
If 5 patients arrive an hour, 5 patients need to move between each step each hour
If 10 patients arrive an hour, 10 patients need to move between each step each hour
Overall Coordination Flows should have a single person, team, or area responsible for the whole flow. This will work best if they are responsible for the flow from start to finish. If there is no overall co-ordination, several departments are responsible, this will result in more communication ‘hand-offs’ and there is the potential for poor overall co-ordination. What Next? Further material will be introduced as part of the bed management improvement programme in Autumn 2005.
Example The pace of your emergency flow should be determined by the arrival rate of patients who require admission. This can be done by analysing historical data by hour of the day and setting the pace over the 24 hours.
Remember use PDSAs to test and implement change

14
Appendix 1 Pareto Analysis Pareto analysis is a simple tool that helps to focus efforts on the problems offering the greatest potential for improvement. Pareto Law is also known as the ‘80/20 rule’: ‘80% of the benefits will be found in the simplest 20% of the system, and the final 20% of
the benefits will come from the most complex 80% of the system’.
Applying the 80/20 rule will help you focus on high volume runner groups (the most common presenting conditions) and avoid you being side-tracked by events that rarely happen. The characteristics of runners, specials and strangers the 3 groups of patients based on principles outlined below:
Runners
•high volume
• share common characteristics
• “standardised” patient routes
•up to 90% pre-scheduled
•fast throughput
Specials
•customized
•lower volume
•predictable
• share some steps but require extra steps
•standardised patient routes
•can be pre-scheduled Strangers
•low volume, unique requirements
•unpredictable demand patterns
•route unpredictable and complex
•throughput time tends to be longer
Runners
Specials
Strangers
Group of patients
No.
in e
ach
cate
gory
wit
hin
the
grou
p

Appendix 2 - Waste Spotters Guide Waste Symptom Example
Waiting
• Information stored on a computer awaiting action.
• Imbalance between capacity and demand.
• Large Waiting Rooms.
• Long length of hospital stay.
• Surgeon awaiting arrival of patient in the operating theatre.
• Patient queuing for diagnostic test.
• Medically fit patient waiting to go home.
Mistakes • Clinical Incident.
• Complaints.
• Multiple Checking Systems.
• Patient with more than one PAS number.
• Post operative wound infection.
• Drug error.
• Equipment failure.
• Patient outlying on the ‘wrong’ ward.
Uncoordinated activity
• Tests undertaken before they are needed and when they are not necessary. • Bed requested ‘just in case’.
Stock • Poor ability to respond to problems.
• Increased need for storage space. • High volume stock in wards and departments.
Transportation • Movement of documents, materials and patients.
• Ambulance conveys patient within minor injury to A&E Department.
• Patient outlying in ‘wrong’ ward.
• Specimens transported to centralised laboratory for processing
Unnecessary motion Excessive walking. • Poor layout of working environment
Inappropriate processing
• High variation.
• Duplication.
• Batching.
• Patients seen by many healthcare professionals when one would do.
• Multiple data entry on information systems which do not communicate.
• Patient details recorded on A&E ‘white board’ in addition to A&E card and information system.
• ‘Bed State’ updated twice daily.
• Twice weekly consultant ward rounds.