1 UIUC ATMOS 397G Biogeochemical Cycles and Global Change Lecture 14: Methane and CO Don Wuebbles...
24
1 UIUC UIUC ATMOS 397G ATMOS 397G Biogeochemical Cycles and Biogeochemical Cycles and Global Change Global Change Lecture 14: Methane and CO Lecture 14: Methane and CO Don Wuebbles Don Wuebbles Department of Atmospheric Sciences Department of Atmospheric Sciences University of Illinois, Urbana, IL University of Illinois, Urbana, IL March 6, 2003 March 6, 2003
-
Upload
clemence-ryan -
Category
Documents
-
view
219 -
download
0
Transcript of 1 UIUC ATMOS 397G Biogeochemical Cycles and Global Change Lecture 14: Methane and CO Don Wuebbles...

1
UIUCUIUC
ATMOS 397GATMOS 397GBiogeochemical Cycles and Global ChangeBiogeochemical Cycles and Global Change
Lecture 14: Methane and COLecture 14: Methane and CO
Don WuebblesDon Wuebbles
Department of Atmospheric SciencesDepartment of Atmospheric Sciences
University of Illinois, Urbana, ILUniversity of Illinois, Urbana, IL
March 6, 2003March 6, 2003
2
UIUCUIUC

3
UIUCUIUC
Tropospheric OH July -- MOZART IITropospheric OH July -- MOZART II
4
UIUCUIUC
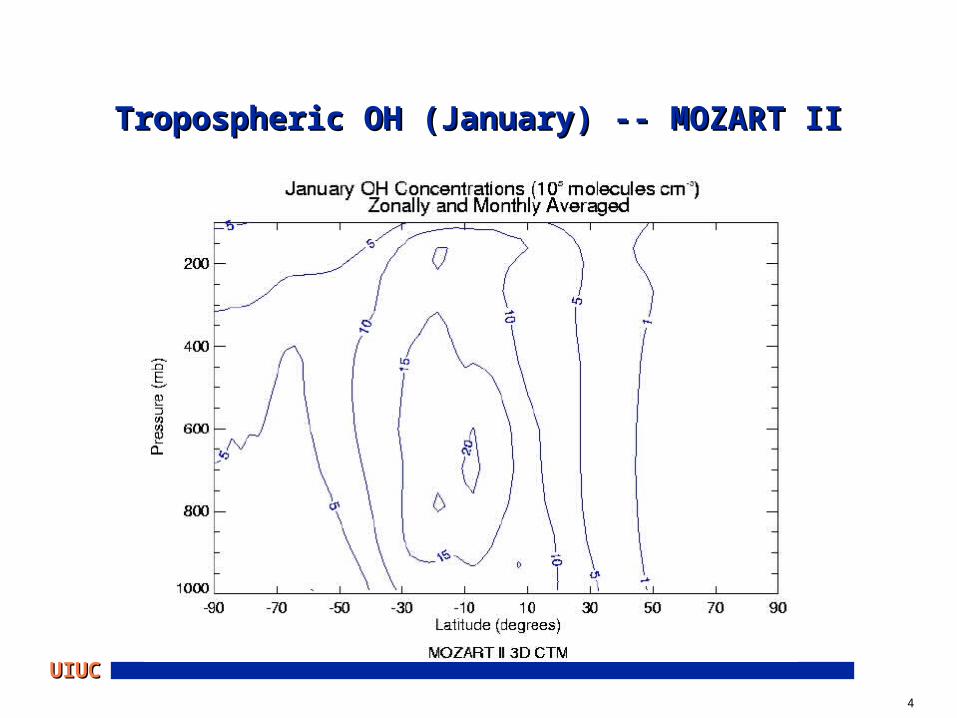
Tropospheric OH (January) -- MOZART IITropospheric OH (January) -- MOZART II

5
UIUCUIUC
OH concentrationsOH concentrations
OH depends non-linearly on atmospheric concentrations of many tropospheric gases
most important gases: CH4, CO, NOx, tropospheric O3, NMHCs
other factors: tropospheric water vapor, uv radiation flux which depends on stratospheric ozone

6
UIUCUIUC
Simplified CHSimplified CH44/OH/CO Chemistry/OH/CO Chemistry
CH4
oxidizes to CO OH + CH4
CO OH + CO OH
NMHCs
UV O3 H2O NOx
7
UIUCUIUC
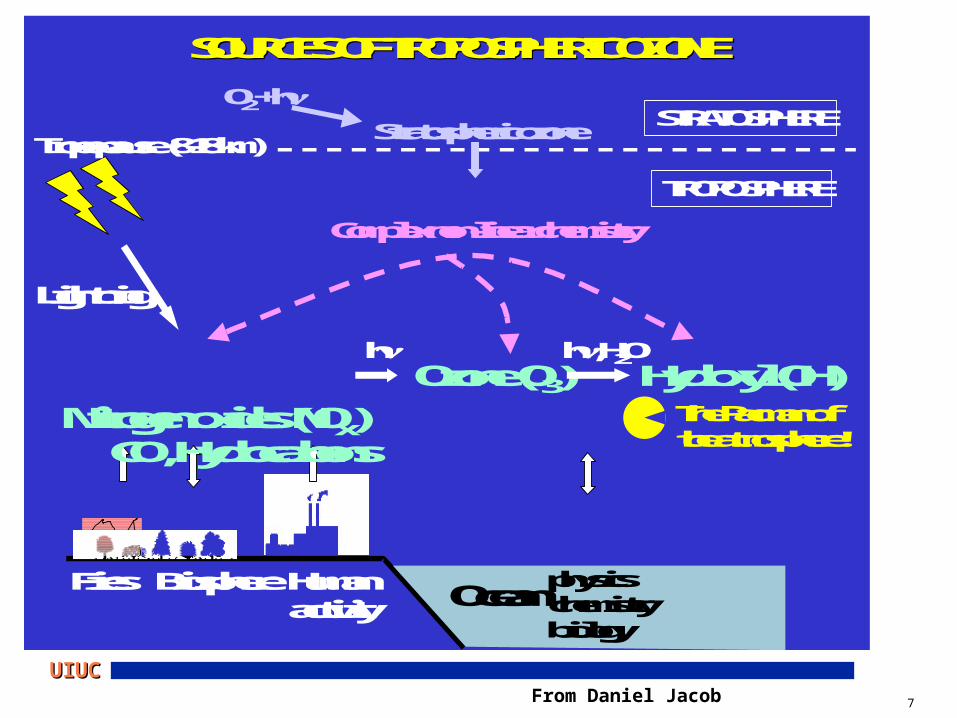
SOURCES OF TROPOSPHERIC OZONESOURCES OF TROPOSPHERIC OZONE
?
?
?
Fires BiosphereHumanactivity
Lightning
Oceanphysicschemistrybiology
Nitrogen oxides (NOx)CO, Hydrocarbons
hOzone (O3)
h, H2OHydroxyl (OH)
The Pacman of the atmosphere!
Complex non-linear chemistry
Tropopause(8-18 km)Stratospheric ozone
STRATOSPHERE
TROPOSPHERE
O2 + h
From Daniel Jacob

8
UIUCUIUC
Decay of an Impulse EmissionDecay of an Impulse Emission
0
0.2
0.4
0.6
0.8
1
0 50 100 150 200 250 300 350 400 450 500Year
Impulse Response Curves
C2F6
CH4
CO2

9
UIUCUIUC
Methane: Lifetime vs. Response TimeMethane: Lifetime vs. Response Time
Atmospheric lifetime of CH4m
= Burden / flux ~ 9 years
— 9.6 years in IPCC (2001)
Response time is the e-folding time after a
perturbation
Response time ~ 1.4 x ~ 13 years
10
UIUCUIUC
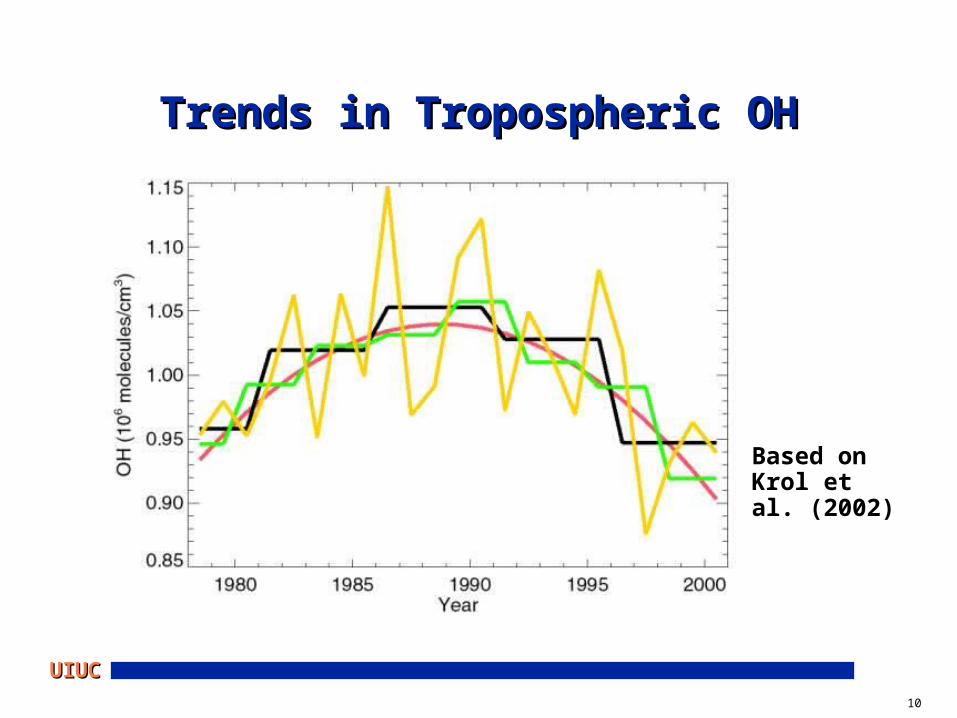
Trends in Tropospheric OHTrends in Tropospheric OH
Based on Krol et al. (2002)

11
UIUCUIUC

12
UIUCUIUC
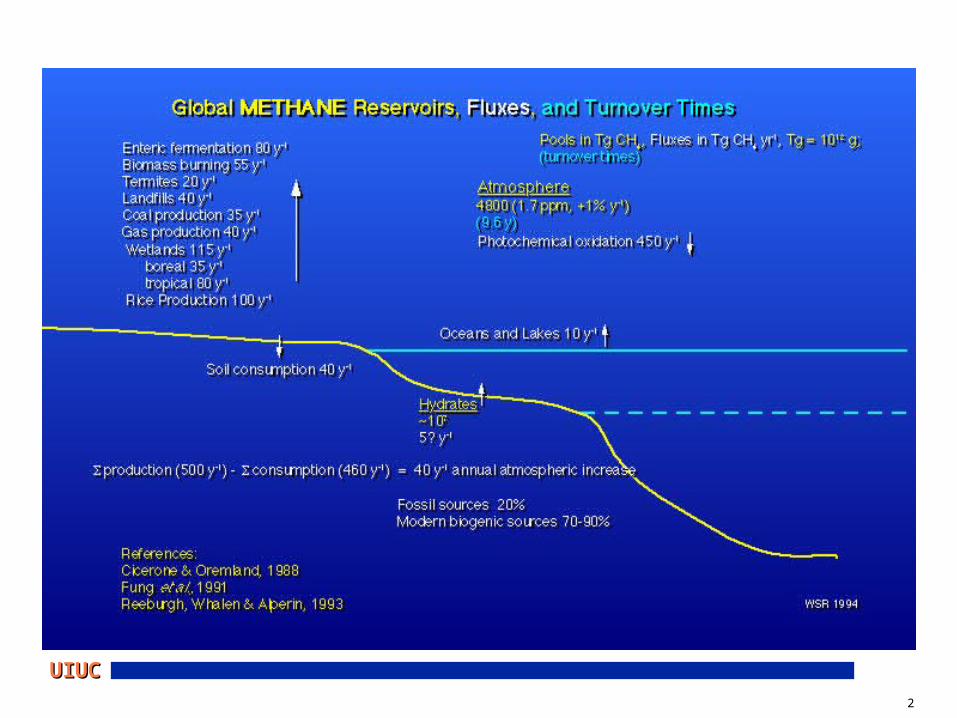
Estimated Changes in CH4 Source and Sink
From NOAA CMDL, E. DlugokenckyAssumes fixed lifetime of CH4 = 8.9 years
Mean emission rate of period of observations is 550 Tg CH4 yr-1.
13
UIUCUIUC
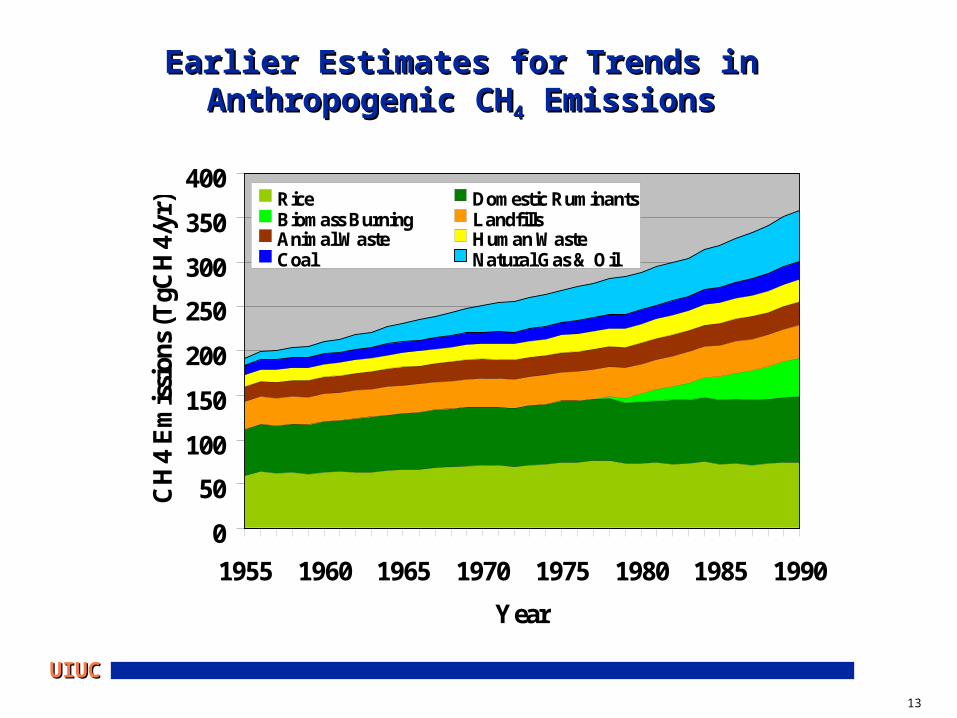
Earlier Estimates for Trends in Anthropogenic CHEarlier Estimates for Trends in Anthropogenic CH44 EmissionsEmissions
0
50
100
150
200
250
300
350
400
1955 1960 1965 1970 1975 1980 1985 1990
Year
CH
4 E
mis
sion
s (T
gCH
4/yr
) Rice Domestic RuminantsBiomass Burning LandfillsAnimal Waste Human WasteCoal Natural Gas & Oil
14
UIUCUIUC
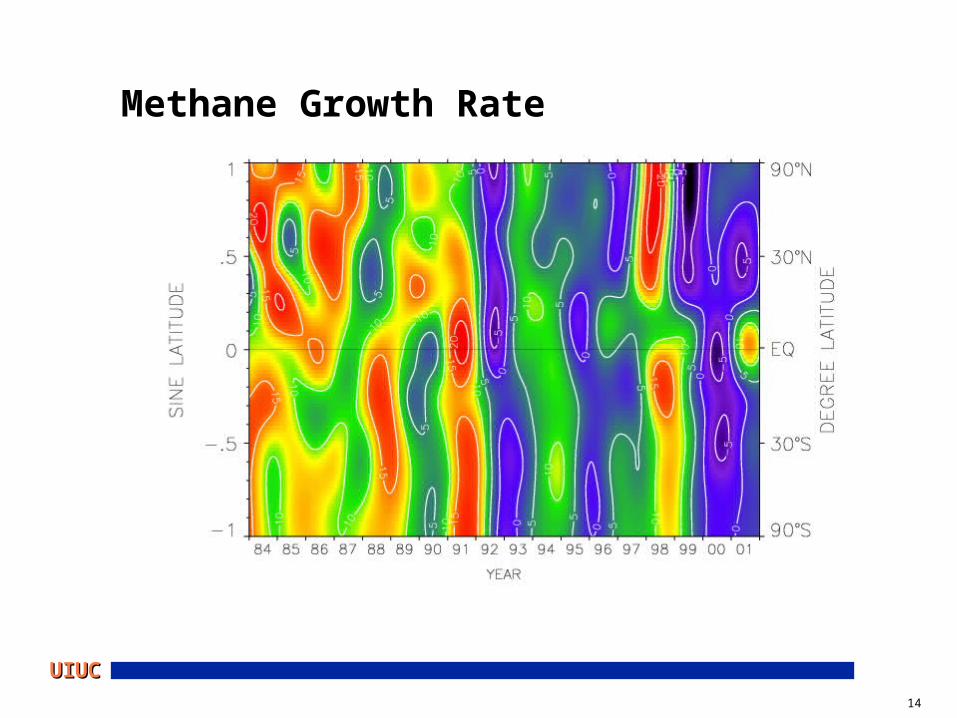
Methane Growth Rate

15
UIUCUIUC
Methane: Changes in Growth RateMethane: Changes in Growth Rate
1991-1992 After the eruption of Mt. Pinatubo, a large positive anomaly in
growth rate was observed at tropical latitudes. It has been attributed to short-term decreases in solar UV in the tropics immediately following the eruption that decreased OH formation rates in the troposphere (Dlugokencky et al., 1996).
A large decrease in growth was observed, particularly in high northern latitudes, in 1992. This feature has been attributed in part to decreased northern wetland emission rates resulting from anomalously low surface temperatures (Hogan and Harriss, 1994) and in part to stratospheric ozone depletion that increased tropospheric OH (Bekki et al., 1994; Fuglestvedt et al., 1994).
Records of changes in the 13C/12C ratios in atmospheric CH4 during this period suggest the existence of an anomaly in the sources or sinks involving more than one causal factor (Lowe et al., 1997; Mak et al., 2000).

16
UIUCUIUC
Methane: Changes in Growth RateMethane: Changes in Growth Rate
1998
High northern and southern tropical latitudes have been
linked to interannual variations in temperature and soil
moisture content in wetland regions, thereby affecting CH4
emissions, and emphasizing the strong link between wetland
CH4 emissions and climate.
Observations suggest that global emissions were greater
than average by 24 Tg CH4
A process based model, which included soil-temperature
and precipitation anomalies, was used to calculate CH4
emission anomalies from wetlands of +24.6 Tg CH4, split
nearly equally between high-northern latitudes and the
southern tropics [Dlugokencky et al., 2001].

17
UIUCUIUC
Modeling sources of CHModeling sources of CH44
Prediction of methane emissions from scenarios of basic variables including:
temperature changes population growth evolution of land use patterns future energy demand and sources technological improvements

18
UIUCUIUC
2001 IPCC SRES Projected CH2001 IPCC SRES Projected CH44 Emissions Emissions

19
UIUCUIUC
Derived Concentrations for MethaneDerived Concentrations for Methane

20
UIUCUIUC
Observed
2-D Model
1992
Pre-ind.

21
UIUCUIUC
CH4 only
All GHGs
Ratio

22
UIUCUIUC
Reductions in CHReductions in CH44, CO and NOx
1
1.5
2
2.5
3
Me
tha
ne
Co
nc
en
tra
tio
n,
pp
m
20
00
20
20
20
40
20
60
20
80
21
00
YEAR
MSA750MSA650MSA550MSA450
IS92A
0.5
1
1.5
2
2.5
Me
tha
ne
Co
nc
en
tra
tio
n,
pp
m
20
00
20
20
20
40
20
60
20
80
21
00
YEAR
MSA750MSA650MSA550MSA450
IS92A
Reduce CO and NOxReduce CO and NOx
Reduce CO but not NOxReduce CO but not NOx

23
UIUCUIUC
Change in Total Ozone (%) for 2 x [CHChange in Total Ozone (%) for 2 x [CH44]
Δ OΔ O33= +3.4%= +3.4%
University of University of Illinois 2-D Illinois 2-D ModelModel
Month
Latitude

24
UIUCUIUC
Change in Local Ozone (%) for 2 x [CHChange in Local Ozone (%) for 2 x [CH44]
University of University of Illinois 2-D Illinois 2-D ModelModel