1 Topic 4.5.1 Regions Defined by Inequalities Regions Defined by Inequalities.
23
1 Topic 4.5.1 Regions Defined by Inequalities
-
Upload
karen-roberts -
Category
Documents
-
view
221 -
download
0
Transcript of 1 Topic 4.5.1 Regions Defined by Inequalities Regions Defined by Inequalities.

1
Topic 4.5.1Topic 4.5.1
Regions Defined by Inequalities
Regions Defined by Inequalities

2
Regions Defined by InequalitiesRegions Defined by Inequalities
California Standard: 6.0 Students graph a linear equation and compute the x- and y-intercepts (e.g., graph 2x + 6y = 4). They are also able to sketch the region defined by linear inequality (e.g., they sketch the region defined by 2x + 6y < 4).
What it means for you:You’ll learn to sketch the region defined by a linear inequality.
Key Words:• inequality• plane• region
Topic4.5.1

3
Regions Defined by InequalitiesRegions Defined by Inequalities
Just like with equations, you can graph inequalities on the coordinate plane.
The only tricky bit is showing whether the solution set is above or below the line.
Topic4.5.1
This Topic will show you how.

4
2
4
6y
–2
–4
–6
–6 –40
–2 0 2 4 6x • The set of points that lie above the line.
Regions Defined by InequalitiesRegions Defined by Inequalities
A Line Divides the Plane into Three Regions
The graph of a linear equation divides the plane into three regions:
Topic4.5.1
The regions above and below the line of a linear equation are each represented by a linear inequality.
• The set of points that lie below the line.
• The set of points that lie on the line.

5
–6 –4 –2 0 2 4 60
2
4
6y
x
–2
–4
–6
Regions Defined by InequalitiesRegions Defined by Inequalities
Example 1
Graph y = –x + 3 and show that it divides the plane into three regions.
Solution follows…
Solution
Topic4.5.1
Set of points below the line — all these points satisfy the
inequality y < –x + 3.
Set of points above the line — all these points satisfy the inequality
y > –x + 3.
Set of points on the line— all these points satisfy the equation y = –x + 3.The line forms a border
between the other regions.
The points on the line don’t satisfy either of the inequalities — that’s why the line is dashed.
6
Regions Defined by InequalitiesRegions Defined by Inequalities
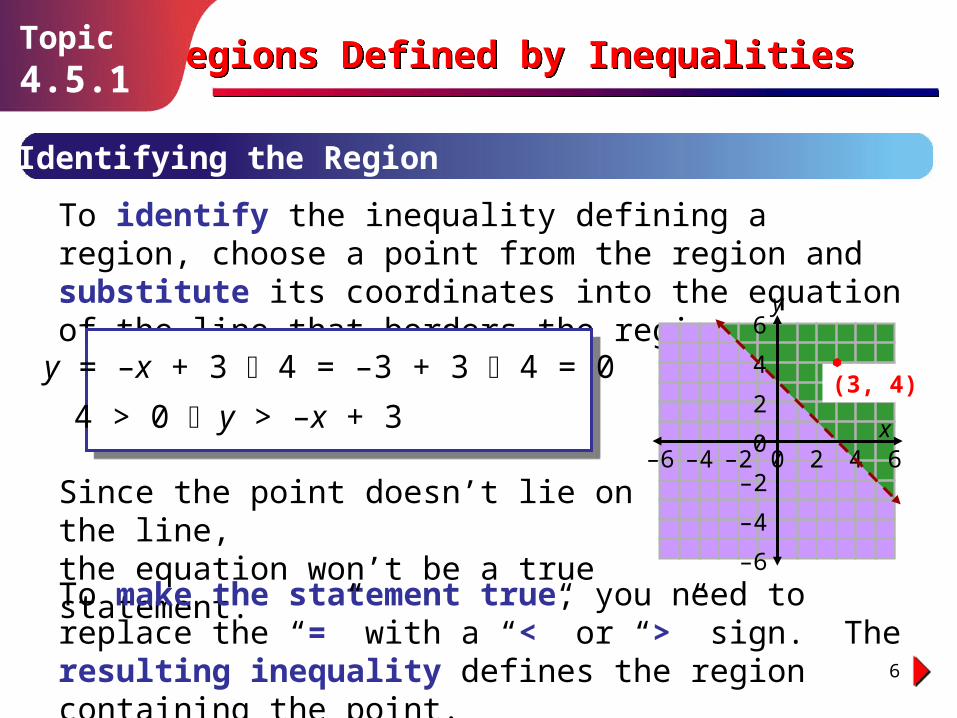
Identifying the Region
To identify the inequality defining a region, choose a point from the region and substitute its coordinates into the equation of the line that borders the region.
Topic4.5.1
Since the point doesn’t lie on the line, the equation won’t be a true statement.
To make the statement true, you need to replace the “=” with a “<” or “>” sign. The resulting inequality defines the region containing the point.
2
4
6y
–2
–4
–6
–6 –40
–2 0 2 4 6x
(3, 4)y = –x + 3 4 = –3 + 3 4 = 0
4 > 0 y > –x + 3

7
Regions Defined by InequalitiesRegions Defined by Inequalities
Example 2
State the inequality that defines the shaded region.
Solution follows…
Solution
Topic4.5.1
Choose a point in the shaded region, for example, (0, 2). Test this point in the equation of the line: y = 2x + 1
So at (0, 2), you get 2 = 2(0) + 1 2 = 1, which is false.
Since 2 > 1, a “>” sign is needed to make it a true statement. So (0, 2) satisfies the inequality y > 2x + 1.
The inequality that defines the shaded region is y > 2x + 1.
y
–6 –4 –2 0 2 4 60
2
4
6
x
–2
–4
–6
y =
2x +
1
8
Regions Defined by InequalitiesRegions Defined by Inequalities
Guided Practice
Solution follows…
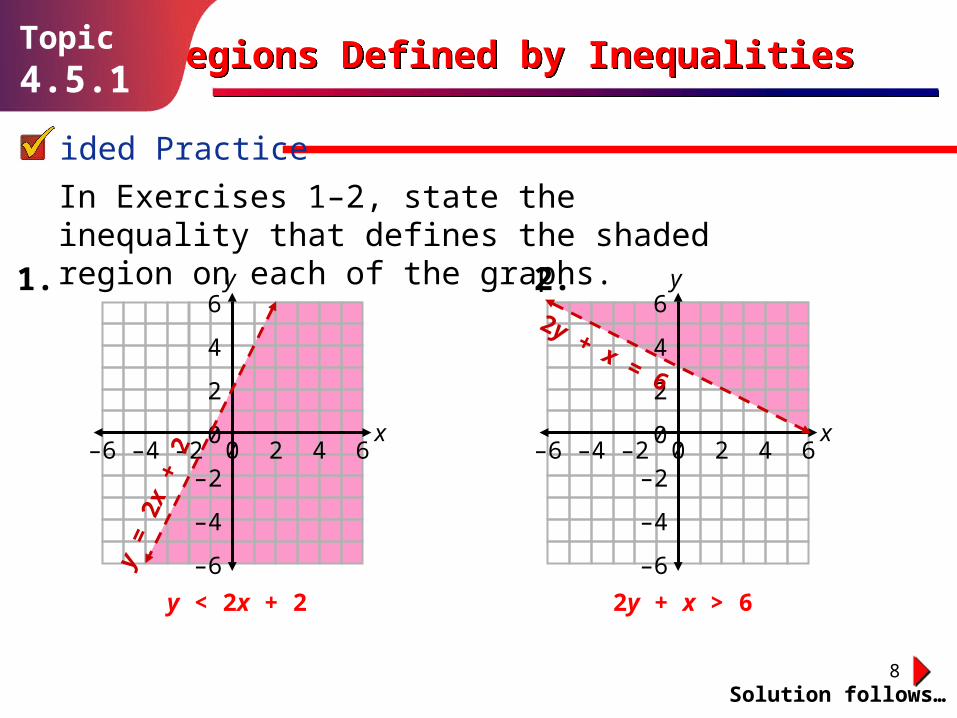
In Exercises 1–2, state the inequality that defines the shaded region on each of the graphs.
Topic4.5.1
1. 2.
y < 2x + 2 2y + x > 6
y
–6 –4 –2 0 2 4 60
2
4
6
x
–2
–4
–6
y =
2x +
2
y
–6 –4 –2 0 2 4 60
2
4
6
x
–2
–4
–6
2y + x = 6

9
For example, (–5, 4) is a solution of the inequality y > 2x + 1 because substituting x = –5 and y = 4 gives a true statement: 4 > 2(–5) + 1 4 > –9, which is true.
Regions Defined by InequalitiesRegions Defined by Inequalities
Sketching the Region Defined by a Linear Inequality
An ordered pair (x, y) is a solution of a linear inequality if its x and y values satisfy the inequality.
Topic4.5.1
The graph of a linear inequality is the region consisting of all the solutions of the inequality (the solution set).
y
–6 –4 –2 0 2 4 60
2
4
6
x
–2
–4
–6
y =
2x +
1
(–5, 4)
The shaded region consists of all the solutions of y > 2x + 1
— including (–5, 4).

10
Regions Defined by InequalitiesRegions Defined by Inequalities
To sketch the region defined by a linear inequality, you need to plot the graph of the corresponding equation (the border line), then shade the correct region.
Topic4.5.1
y
–6 –4 –2 0 2 4 60
2
4
6
x
–2
–4
–6
y =
2x +
1
To decide which is the correct region, just test a point.
• To plot y > 2x + 1, first plot y = 2x + 1
• Then shade the correct region
• Test (–5, 4): 4 > 2(–5) + 1 4 > –9, a true statement. So shade the region containing (–5, 4).
(–5, 4)
11
Regions Defined by InequalitiesRegions Defined by Inequalities
Example 3
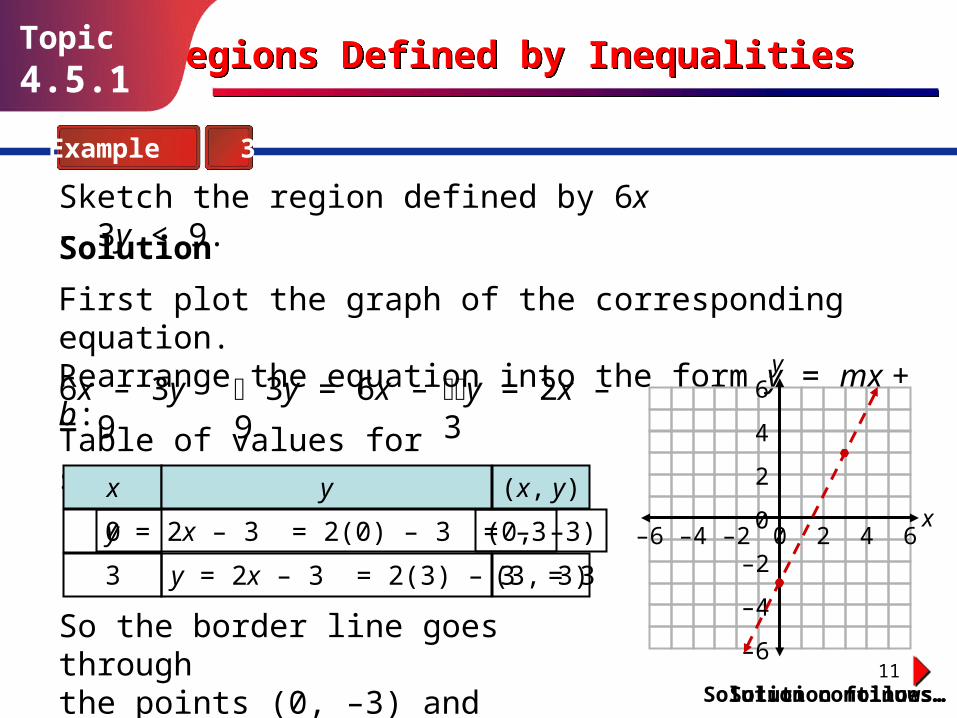
Sketch the region defined by 6x – 3y < 9.
Solution follows…
Solution
Topic4.5.1
First plot the graph of the corresponding equation. Rearrange the equation into the form y = mx + b:
Table of values for sketching the line:
6x – 3y = 9
x y (x, y)
0 y = 2x – 3 = 2(0) – 3 = –3 (0, –3)
3 y = 2x – 3 = 2(3) – 3 = 3 (3, 3)
3y = 6x – 9 y = 2x – 3
So the border line goes through the points (0, –3) and (3, 3).
y
–6 –4 –2 0 2 4 60
2
4
6
x
–2
–4
–6
Solution continues…

12
Regions Defined by InequalitiesRegions Defined by Inequalities
Example 3
Sketch the region defined by 6x – 3y < 9.
Solution (continued)
Topic4.5.1
Now test whether the point (0, 0) satisfies the inequality. Substitute x = 0 and y = 0 into the inequality.
y
–6 –4 –2 0 2 4 60
2
4
6
x
–2
–4
–6
6x – 3y < 9 0 – 0 < 9 0 < 9 — This is a true statement.
Therefore (0, 0) lies in the region 6x – 3y < 9 — so shade the region containing (0, 0).
(0, 0)
6x + 3y < 9
13
Regions Defined by InequalitiesRegions Defined by Inequalities
Example 4
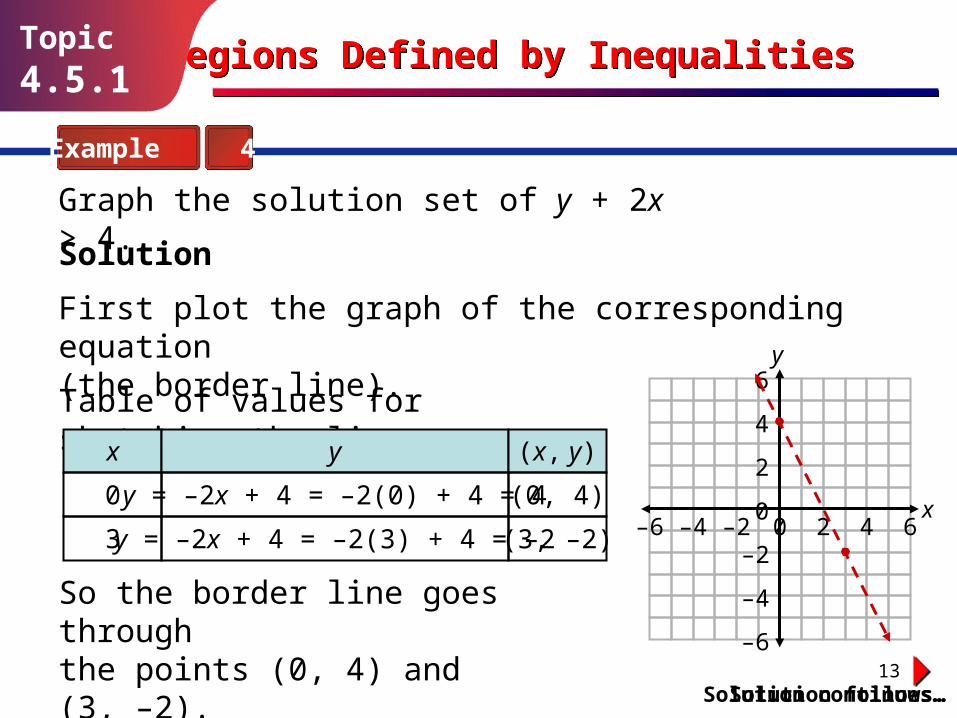
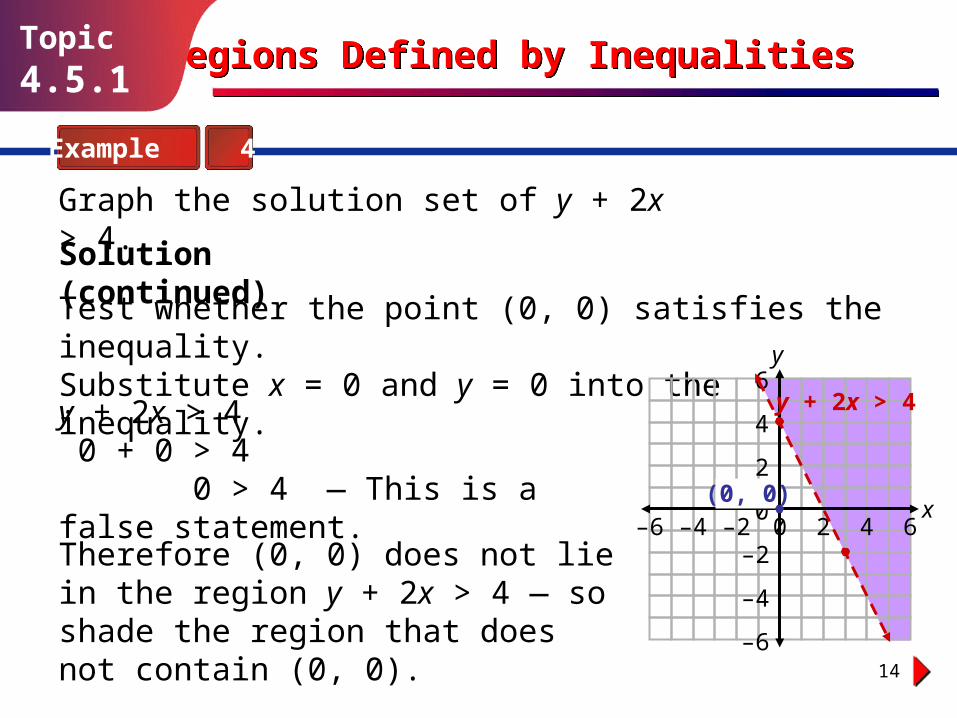
Graph the solution set of y + 2x > 4.
Solution follows…
Solution
Topic4.5.1
First plot the graph of the corresponding equation (the border line).
Table of values for sketching the line:
x y (x, y)
0 y = –2x + 4 = –2(0) + 4 = 4 (0, 4)
3 y = –2x + 4 = –2(3) + 4 = –2 (3, –2)
So the border line goes through the points (0, 4) and (3, –2).
Solution continues…
y
–6 –4 –2 0 2 4 60
2
4
6
x
–2
–4
–6
14
Regions Defined by InequalitiesRegions Defined by Inequalities
Example 4
Graph the solution set of y + 2x > 4.
Solution (continued)
Topic4.5.1
Test whether the point (0, 0) satisfies the inequality.Substitute x = 0 and y = 0 into the inequality. y
–6 –4 –2 0 2 4 60
2
4
6
x
–2
–4
–6
y + 2x > 4 0 + 0 > 4 0 > 4 — This is a false statement.
Therefore (0, 0) does not lie in the region y + 2x > 4 — so shade the region that does not contain (0, 0).
(0, 0)
y + 2x > 4

15
Regions Defined by InequalitiesRegions Defined by Inequalities
Guided Practice
In each of Exercises 3–8, use a set of axes spanning from –6 to 6 on the x- and y-axes. For each Exercise, shade the region defined by the inequality.
3. y > 0.5x + 2
4. y + 2x < 0
5. y + x > –2
6. 4x + 3y < 12
7. –2y + 3x > 6
8. y < –x + 3
Topic4.5.1
3
Solution follows…
64578
–6 –4 –2 0 2 4 60
2
4
6y
x
–2
–4
–6
y > 0.5x + 2
y + 2x < 0
y + x > –24x + 3y < 12
–2y + 3x > 6y < –x + 3

16
Regions Defined by InequalitiesRegions Defined by Inequalities
Guided Practice
Solution follows…
In Exercises 9–14, show whether the given point is a solution of –5x + 2y > –8.
9. (0, 0)
10. (6, –3)
11. (–3, 9)
12. (2, 1)
13. (39, –36)
14. (–15, 13)
Topic4.5.1
–5(0) + 2(0) > –8 0 > –8.This is a true statement, so (0, 0) is a solution.
–5(6) + 2(–3) > –8 –36 > –8.This is a false statement, so (6, –3) is not a solution.
–5(2) + 2(1) > –8 –8 > –8.This is a false statement, so (2, 1) is not a solution.
–5(39) + 2(–36) > –8 –267 > –8.This is a false statement, so (39, –36) is not a solution.
–5(–3) + 2(9) > –8 33 > –8.This is a true statement, so (–3, 9) is a solution.
–5(–15) + 2(13) > –8 101 > –8.This is a true statement, so (–15, 13) is a solution.

17
In Exercises 1–4, use the graph below to determine if the given point is in the solution set.
1. (0, 0)
2. (1, 2)
3. (3, –2)
4. (–2, –2)
Independent Practice
Solution follows…
yes
yes
Regions Defined by InequalitiesRegions Defined by InequalitiesTopic4.5.1
yes
no–6 –4 –2 0 2 4 6
0
2
4
6y
x
–2
–4
–6
(0, 0)
(1, 2)
(3, –2)(–2, –2)

18
Independent Practice
Solution follows…
2x + y < 4
Regions Defined by InequalitiesRegions Defined by InequalitiesTopic4.5.1
In Exercises 5–6, state the inequality that defines the shaded region on each of the graphs.
5. 6.
y < x + 221
–6 –4 –2 0 2 4 60
2
4
6y
x
–2
–4
–6
–6 –4 –2 0 2 4 60
2
4
6y
x
–2
–4
–6
2x + y = 4 y = x + 221

19
Independent Practice
Solution follows…
Regions Defined by InequalitiesRegions Defined by InequalitiesTopic4.5.1
In Exercises 7–8, state the inequality that defines the shaded region on each of the graphs.
7. 8.
–6 –4 –2 0 2 4 60
2
4
6y
x
–2
–4
–6
–6 –4 –2 0 2 4 60
2
4
6y
x
–2
–4
–6
y > 1 y > –2
y = 1
y = –2

20
Independent Practice
Solution follows…
Regions Defined by InequalitiesRegions Defined by InequalitiesTopic4.5.1
9. Show whether (–2, –1) is a solution of 2x – 5y 10.
10. Show whether (–3, 5) is a solution of 4x + y < 5.
11. Show whether (2, 4) is a solution of x + 6y < 0.
12. Show whether (0, –3) is a solution of y –6x + 5.
2(–2) – 5(–1) 10 1 10.This is a true statement, so (–2, –1) is a solution.
2 + 6(4) < 0 26 < 0.This is a false statement, so (2, 4) is not a solution.
4(–3) + 5 < 5 –7 < 5.This is a true statement, so (–3, 5) is a solution.
–3 –6(0) + 5 –3 5.This is a false statement, so (0, –3) is not a solution.

21
Independent Practice
Regions Defined by InequalitiesRegions Defined by InequalitiesTopic4.5.1
Graph the solution set in Exercises 13–16.
13. y < x + 6
14. y < x + 4
15. y < – x – 2
16. y < 1
52
43
54
Solution follows…
13141516
–6 –4 –2 0 2 4 60
2
4
6y
x
–2
–4
–6
y < x + 643
y < x + 454
y < x – 252
y < 1

22
Independent Practice
Regions Defined by InequalitiesRegions Defined by InequalitiesTopic4.5.1
Graph the solution set in Exercises 17–22.
17. x > 0
18. x – 4y > 8
19. x + 2y > 8
20. 4x + 3y < –12
21. 4x – 6y > 24
22. 5x + 8y < 24
Solution follows…
17181920
–6 –4 –2 0 2 4 60
2
4
6y
x
–2
–4
–6
2122
x > 0
x – 4y > 8
x + 2y > 8
4x + 3y < –12 4x – 6y > 24
5x + 8y < 24

23
Round UpRound Up
Well, that was quite a long Topic, with lots of graphs.
Inequality graphs aren’t easy, so it’s always a good idea to check whether you’ve shaded the correct part by seeing whether a test point satisfies the original inequality.
Regions Defined by InequalitiesRegions Defined by InequalitiesTopic4.5.1