1 Topic 10: Integration Jacques Indefinate Integration 6.1 Definate Integration 6.2.
33
1 Topic 10: Topic 10: Integration Integration Jacques Jacques Indefinate Integration 6.1 Indefinate Integration 6.1 Definate Integration 6.2 Definate Integration 6.2
-
date post
19-Dec-2015 -
Category
Documents
-
view
225 -
download
1
Transcript of 1 Topic 10: Integration Jacques Indefinate Integration 6.1 Definate Integration 6.2.

1
Topic 10: Topic 10: IntegrationIntegration
Jacques Jacques
Indefinate Integration 6.1Indefinate Integration 6.1
Definate Integration 6.2Definate Integration 6.2

2
IntuitionIntuition
y = F (x) = xn + c
dy/dx = F`(x) = f(x) = n xn-1 Given the derivative f(x), what is F(x) ? (Integral, Anti-derivative or the Primitive function). The process of finding F(x) is integration.

3
DefinitionDefinitionJust as f(x) = derivative of F(x)
dxxfxF )()(
Example
cxdxxxF 323)(
c=constant of integration (since derivative of c=0)of course, c may be =0….., but it may not check: if y = x3 + c then dy/dx = 3x2
or if c=0, so y = x3 then dy/dx = 3x2

4
Rule 1 of Integration:
cxn
dxxxF nn
1
1
1)(
cxdxxxF 32
3
1)(
check: if y = 1/3 x
3 + c then dy/dx = x2
cxdxxdx.dx)x(F 01
check: if y = x + c then dy/dx = 1

5
Rule 2 of Integration:
dxxfadxxafxF )()()(
Examples
cxcx..dxxdxx)x(F
3322
3
1333
check…..
caxdxadx.a)x(F
check…
cxdxdx)x(F 444 check

6
• Rule 3 of Integration:
• Example
dxxgdxxfdxxgxfxF )()()()()(
cxxdxxdxxdxxxxF 2322 2323)(

7
Calculating Marginal Functions
•Given MR and MC use integration to find TR and TC
dQ
TRdMR
dQ
TCdMC
dQQMRQTR .
dQQMCQTC .

8
Marginal Cost FunctionMarginal Cost Function Given the Marginal Cost Function, derive an expression for Total Cost?
MC = f (Q) = a + bQ + cQ2
dQcQbQa)Q(TC 2
dQQcdQQbdQa)Q(TC 2
FQc
Qb
aQ)Q(TC 32
32 F = the constant of integration If Q=0, then TC=F F= Fixed Cost….. (or TC when Q=0)
9
Another ExampleAnother Example MC = f (Q) = Q + 5 Find an expression for Total Cost in terms of Q, if TC = 20 when production is zero.
dQQ)Q(TC 5 dQdQQ)Q(TC 5
FQQ)Q(TC 52
1 2
F = the constant of integration
If Q=0, then TC = F = Fixed Cost So if TC = 20 when Q=0, then F=20
So, 2052
1 2 QQ)Q(TC

10
Another ExampleAnother Example
Given Marginal Revenue, MR = f (Q) = 20 – 2Q Find the Total Revenue function?
MR = f (Q) = 20 – 2Q
dQQ)Q(TR 220
QdQdQ)Q(TR 220
cQQ)Q(TR 220 c = the constant of integration

11
Example: Given MC=2Q2 – 6Q + 6; MR = 22 – 2Q; and Fixed Cost =0. Find total profit for profit maximising firm when MR=MC?
1) Find profit max output Q where MR = MC MR=MC so 22 – 2Q = 2Q2 – 6Q + 6 gives Q2 – 2Q – 8 = 0 (Q - 4)(Q + 8) = 0 so Q = +4 or Q =-2 Q = +4

12
2) Find TR and TC
dQQ)Q(TR 222
QdQdQ)Q(TR 222
cQQ)Q(TR 222 so TR = 22Q – Q2
MC = f (Q) = 2Q2 – 6Q + 6
dQQQ)Q(TC 662 2
dQQdQdQQ)Q(TC 662 2
FQQQ)Q(TC 633
2 23
F = Fixed Cost = 0 (from question)
so….QQQ)Q(TC 63
3
2 23

13
3. Find profit = TR-TC, by substituting in value of q* when MR = MC Profit = TR – TC TR if q*=4: 22(4) - 42 = 88-16 = 72 TC if q* =4: 2/3 (4)3 – 3(4)2 + 6(4) = 2/3(64) – 48 + 24 = 182/3
Total profit when producing at MR=MC so q*=4 is TR – TC = 72 - 182/3 = 53 1/3

14
Some general points for answering Some general points for answering these types of questionsthese types of questions
Given a MR and MC curves - can find profit maximising output q* where
MR = MC - can find TR and TC by integrating MR
and MC - substitute in value q* into TR and TC to
find a value for TR and TC. then….. - since profit = TR – TC can find (i) profit if given value for F or (ii) F if given value for profit

15
T h e d e f i n i t e i n t e g r a l o f f ( x ) b e t w e e n v a l u e s a a n d b i s :
)()()()( aFbFdxxfxFb
a
ba
Definite Integration
16
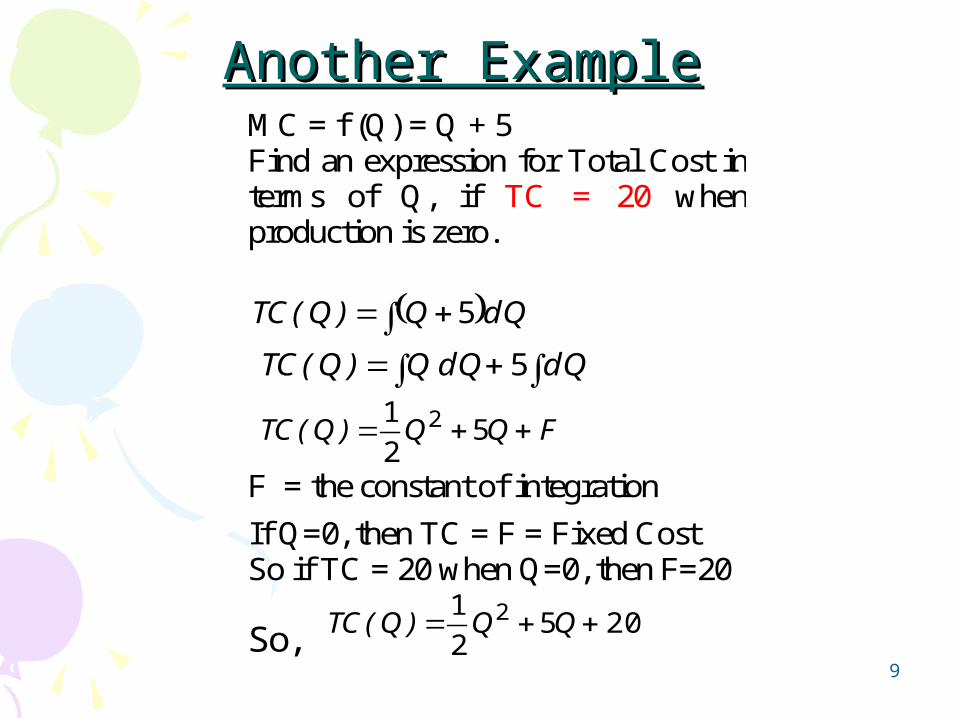
1 ) 3
7)1(
3
1)2(
3
1
3
1 332
1
32
1
2
xdxx
2 ) 12)2(3)6(333 6
2
6
2
xdx
Example

17
DefinitionDefinition
The definite integral b
a
dx)x(f can be
interpreted as the area bounded by the graph of f(x), the x-axis, and vertical lines x=a and x=b
x
f(x)
a b

18
Consumer SurplusConsumer Surplus
Q
Demand Curve: P = f(Q)
Q1
P
P1
0
a
x
Consumer Surplus
Difference between value to consumers and to the market…. Represented by the area under the Demand curve and over the Price line…..

19
Or more formally….Or more formally….
C S ( Q ) = o Q 1 a x - o Q 1 a P 1 W h e r e o Q 1 a x r e p r e s e n t s t h e e n t i r e a r e a u n d e r t h e d e m a n d c u r v e u p t o Q 1 a n d o Q 1 a P 1 r e p r e s e n t s t h e a r e a i n t h e r e c t a n g l e , u n d e r t h e p r i c e l i n e u p t o Q 1 H e n c e ,
11
0
)()(1
QPdQQDQCSQ

20
Producer SurplusProducer Surplus
Q
Supply Curve: P = g(Q)
Q1
P
P1
0
a
y
Producer Surplus
Difference between market value and total cost to producers…. Represented by the area over the Supply curve and under the Price line…..

21
Or more formally….Or more formally….
P S ( Q ) = o Q 1 a P 1 - o Q 1 a y W h e r e o Q 1 a P 1 r e p r e s e n t s t h e a r e a o f t h e e n t i r e r e c t a n g l e u n d e r t h e p r i c e l i n e u p t o Q 1 a n d o Q 1 a y r e p r e s e n t s t h e a r e a u n d e r t h e S u p p l y c u r v e u p t o Q 1 H e n c e
dQ)Q(SQP)Q(PSQ
1
011

22
Example 1…..Example 1…..
Find a measure of consumer surplus at Q = 5, for the demand function P = 30 – 4Q Solution
1) solve for P at Q = 5 If Q = 5, then P = 30 – 4(5) = 10

23
Q
Demand Curve: P = f(Q) = 30 – 4Q
Q1 = 5
P
P1=10
0
30
Consumer Surplus
7.5
The picture….2) ‘sketch’ diagram
P = 30 – 4Q intercepts: (0, 30) and (7.5, 0)
At Q = 5, we have P = 10 ….. Draw in price line….

24
Calculation… Calculation…
3 ) E v a l u a t e C o n s u m e r S u r p l u s i ) E n t i r e a r e a u n d e r d e m a n d c u r v e b e t w e e n 0 a n d Q 1 = 5 :
1000)25(2)5(30
230)430(5
02
5
0
QQdQQ
i i ) t o t a l r e v e n u e = a r e a u n d e r p r i c e l i n e a t P 1 = 1 0 , b e t w e e n Q = 0 a n d Q 1 = 5 i s P 1 Q 1 = 5 0
i i i ) S o C S = 1 0 0 – p 1 Q 1 = 1 0 0 – ( 1 0 * 5 ) = 5 0
11
0
)()(1
QPdQQDQCSQ

25
Example 2Example 2
If p = 3 + Q2 is the supply curve, find a measure of producer surplus at Q = 4 Solution 1) evaluate P at Q = 4 If Q = 4, then p = 3 + 16 = 19

26
The picture….The picture….
Q
Supply Curve: P = g(Q) = 3 + Q2
Q1 = 4
P
P1 = 19
0
3
Producer Surplus
2) ‘Sketch’ the diagramP = 3 + Q2 intercept: (0, 3) Price line at Q = 4, P = 19

27
Calculation…Calculation…
3 ) E v a lu a te P r o d u c er s S u r p lu s i) E n tire a rea u n d e r su p p ly cu rv e b e tw e en Q = 0 an d Q 1 = 4 … ..
313
4
0
34
0
2
330)4(3
1)4(3
3
13)3(
QQdQQ
ii) to ta l rev en u e = a rea u n d e r p rice lin e (p 1 = 1 9 ), b e tw e en Q = 0 an d Q 1 = 4 , an d th is = p 1Q 1 = 7 6
iii) S o P S = p 1Q 1 – 3 3 1 /3 =
7 6 – 3 3 1 /3 = 4 2 2 /3
dQ)Q(SQP)Q(PSQ
1
011

28
Example 3Example 3• The inverse demand and supply functions
for a good are, respectively:• and
• Find the market equilibrium values of P and Q.
• Find the Total surplus (CS + PS) when the market is in equilibrium.
142 QP 2QP

29
Find market equilibrium….Find market equilibrium….
A t e q u i l i b r i u m 2142 QQ 123 Q S o e q u i l i b r i u m 4* Q T h u s e q u i l i b r i u m 624* P

30
‘‘sketch’ the diagramsketch’ the diagram
Q Q* = 4
P
P*=6
0 Consumer Surplus
14 CS 14
7
PS D
S
2

31
Consumer surplus…Consumer surplus…
***
0QPdQQDCS
Q
i ) a r e a u n d e r e n t i r e d e m a n d c u r v e b e t w e e n Q = 0 a n d Q *
405616
01404144
14
142
22
4
02
4
0
dQQ
i i ) t o t a l r e v e n u e = a r e a u n d e r p r i c e l i n e a t P * = 6 , b e t w e e n Q = 0 a n d Q * = 4 i s P * Q * = 2 4
i i i ) S o C S = 4 0 – 2 4 = 1 6

32
Producer Surplus…Producer Surplus…
*
0
** .Q
dQQSQPPS
i) area under Supply curve between Q = 0 and Q *
1688
0202
1424
2
1
22
1
2
22
4
0
2
4
0
dQQ
ii) total revenue = area under price line at P * = 6, between Q = 0 and Q * = 4 is P *Q * = 24
iii) So PS = 24 – 16 = 8

33
Total SurplusTotal Surplus
• Total surplus = CS + PS = 16 + 8 = 24