1 Statewide Retirement Systems Funding Updates Presentation to the Legislative Commission on...
26
1 Statewide Retirement Systems Funding Updates Presentation to the Legislative Commission on Pensions & Retirement Dave Bergstrom, MSRS Executive Director Mary Most Vanek, PERA Executive Director Laurie Fiori Hacking, TRA Executive Director January 13, 2010
-
Upload
linette-warner -
Category
Documents
-
view
215 -
download
0
Transcript of 1 Statewide Retirement Systems Funding Updates Presentation to the Legislative Commission on...

11
Statewide Retirement Systems
Funding Updates
Presentation to theLegislative Commission on Pensions &
Retirement
Dave Bergstrom, MSRS Executive DirectorMary Most Vanek, PERA Executive Director
Laurie Fiori Hacking, TRA Executive Director
January 13, 2010

22
Why Are We Having These Discussions?Comparison of SBI Average Returns – for periods ending
6/30/2008 and 6/30/2009
Return for FY 2010 through 12/31/10: 17%
8.5% Actuarial Return
-25.0%
-20.0%
-15.0%
-10.0%
-5.0%
0.0%
5.0%
10.0%
15.0%
1 Yr 3 Yr 5 Yr 10 Yr 15 Yr 25 Yr Since 1980
FY2008 FY2009
- 5%
- 18.8%
8.1%
- 3%
10.3%
2.8%
5.7%
2.4%
8.9%
7.2%
10.1% 9.4%
10.7%
9.5%
33
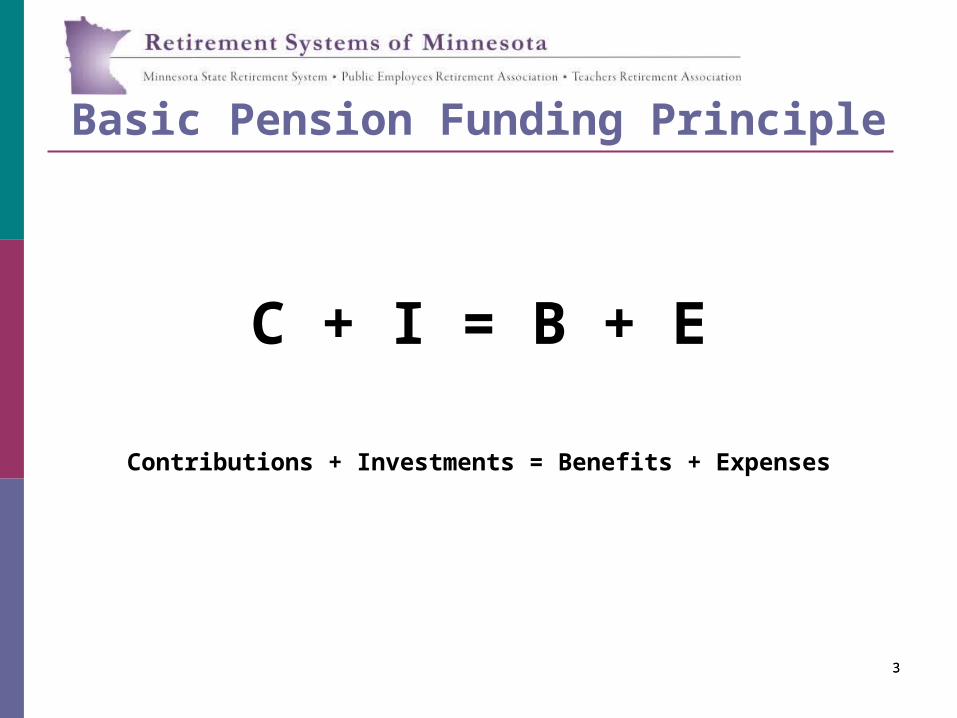
Basic Pension Funding Principle
C + I = B + E
Contributions + Investments = Benefits + Expenses

44
Common Modifications to Address Funding
Elements of funding principle the Boards and Legislature could modify to address recent investment losses
C – Contribution rates
Proposed employee and employer contribution rate adjustments
B – Benefits
annual retiree increases
prospective deferred augmentation interest rate
interest on future lump sum refunds
interest on re-employed retiree accounts

55
Financial Status of PERA General Fund
Fiscal Year 2009
July 1, 2009
Actuarial Value
(5 yr smoothing of investment losses)
July 1, 2009
Market Value
(no smoothing of investment losses)
Funding Ratio
(Assets as % of Liabilities)69.99 % 53.81 %
Current Contributions* 12.88 % of pay 12.88 % of pay
Contributions Needed 15.55 % of pay 19.61 % of pay
Contribution Deficiency (2.67) % of pay (6.73) % of pay
* Employee rate = 6%; Employer rate = 7% (effective 01/01/10)
Source: Mercer Consulting, FY 09 annual actuarial valuation
66
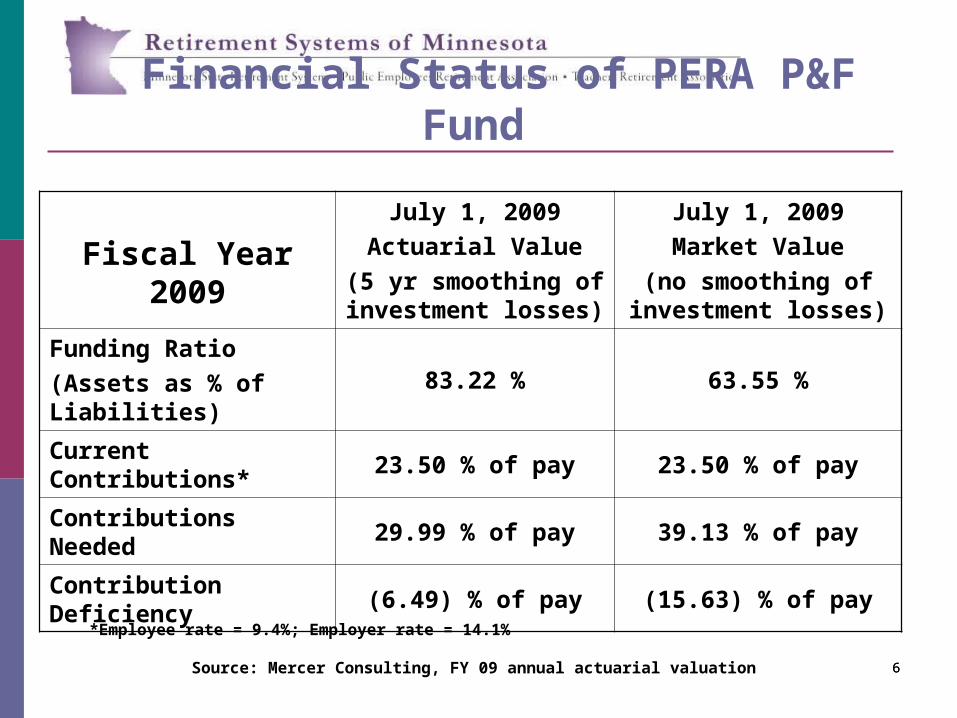
Financial Status of PERA P&F Fund
Fiscal Year 2009
July 1, 2009
Actuarial Value
(5 yr smoothing of investment losses)
July 1, 2009
Market Value
(no smoothing of investment losses)
Funding Ratio
(Assets as % of Liabilities)83.22 % 63.55 %
Current Contributions* 23.50 % of pay 23.50 % of pay
Contributions Needed 29.99 % of pay 39.13 % of pay
Contribution Deficiency (6.49) % of pay (15.63) % of pay
*Employee rate = 9.4%; Employer rate = 14.1%
Source: Mercer Consulting, FY 09 annual actuarial valuation

77
Financial Status of PERA Correctional Fund
Fiscal Year 2009
July 1, 2009
Actuarial Value
(5 yr smoothing of investment losses)
July 1, 2009
Market Value
(no smoothing of investment losses)
Funding Ratio
(Assets as % of Liabilities)94.85 % 72.93 %
Current Contributions* 14.58 % of pay 14.58 % of pay
Contributions Needed 14.03 % of pay 16.77 % of pay
Contribution Deficiency 0.55 % of pay (2.19) % of pay
*Employee rate = 5.83%; Employer rate = 8.75%
Source: Mercer Consulting, FY 09 annual actuarial valuation

88
Baseline – 8.5% return for years after FY2009. Based on 2039 amortization date.
Public Employees Retirement Association of MinnesotaProjection of Funding Scenarios
0%
5%
10%
15%
20%
25%
2009 2010 2011 2012 2013 2014 2015 2016 2017 2018 2020 2022 2024 2026 2028 2030
Each of first 10 years is presented, every other year after
0%
10%
20%
30%
40%
50%
60%
70%
80%
90%
100%
Contribution Deficiency (% of pay) Funding %
What if we do nothing to PERA General?
53.81% 47%*
*Projected Funding RatioSource: Mercer Consulting Services

99
Path to PERA Long-Term Sustainability
Where do we go from here?
Shared responsibility and sacrifice– active members, employers, deferred members and benefit recipients will need to be part of the solution.
Reduce annual benefit recipient adjustment
Decrease annual adjustment from 2.5 percent to 1 percent until plans are again at least 90 percent funded (market value).
Increase contributions 0.5 percent
Coordinated Plan shared equally between employees & employers
Police & Fire Plan – shared between employees and employers
Reduce certain active and former member benefitso Reduce interest rate on refunds from 6 percent to 4 percento Reduce deferred interest for current deferred members and future terminated vested members to
1 percent --currently 3 percent to age 55 and 5 percent thereafter for those hired prior to July 1, 2006 or 2.5 percent for all years for those hired after July 1, 2006.
o Increase vesting to five years
o Eliminate interest on re-employed retiree accounts .

1010
Path to PERA Long-Term Sustainability
What do we save if Board’s recommendations are adopted?
PERA General PERA P & F
Actuarial Value Contribution Deficiency
(2.67) % (6.49) %
Modify Annual Increase: 1.0 percent for future yrs. *
3.6 % 9.45 %
Reduce deferred interest 0.45 % 0.45 %
Increase contributions 0.50 % 0.50 %
Cost Change/adoption of assumption changes
(0.40) % N/A
Resulting actuarial contribution sufficiency
1.48 % 3.91 %
Projected Market Value contribution deficiency
(6.73)% (15.63)%
Remaining Market Value contribution deficiency
(2.58)% (5.23)%
* Until plans are 90 percent funded. Source: Mercer Consulting Services

11
Path to PERA Long-Term Sustainability
The funding line moves back in the right direction, but contribution requirements continue to rise, so additional considerations will be studied over the next several years for future consideration.
Public Employees Retirement Association of MinnesotaProjection of Funding Scenarios - Proposed Assumptions8.5% Discount Rate, 1.0% COLA, No COLA Suspension,
1.5% Augmentation, 0.5% Contribution Increase
0%
5%
10%
15%
20%
25%
30%
2009 2010 2011 2012 2013 2014 2015 2016 2017 2018 2020 2022 2024 2026 2028 2030
Each of first 10 years is presented, every other year after
0%
10%
20%
30%
40%
50%
60%
70%
80%
90%
100%
Statutory (% of pay) Required (% of pay) Funding %
11% return for 3 years after FY2009, 8.5% return for all years after
86%
Source: Mercer Consulting Services

1212
Financial Status of MSRS General Plan
Fiscal Year 2009July 1, 2009
Actuarial Value30 Year Amortization
(5 yr smoothing of investment losses)
July 1, 2009
Market Value30 Year Amortization
(no smoothing of investment losses)
Funding Ratio
(Assets as % of Liabilities)85.9 % 65.61%
Current Contributions 10 % of pay 10 % of pay
Contributions Needed** 11.5 % of pay 16.25 % of pay
Contribution Deficiency** (1.5) % of pay (6.25) % of pay
•Source: Mercer Consulting, FY 09 annual actuarial valuation – EE rate = 5%; ER rate = 5% (eff. 07/01/10)** 2010 Legislation to propose 30 year amortization; amounts estimated using FY09 valuation results

1313
Financial Status of State Patrol Plan
Fiscal Year 2009
July 1, 2009
Actuarial Value
(5 yr smoothing of investment losses)
July 1, 2009
Market Value
(no smoothing of investment losses)
Funding Ratio
(Assets as % of Liabilities)80.58 % 62.05 %
Current Contributions 26.0 % of pay 26.0 % of pay
Contributions Needed 38.16 % of pay 50.21 % of pay
Contribution Deficiency (12.16) % of pay (24.21) % of pay
* Source: Mercer Consulting, FY 09 annual actuarial valuation - EE rate = 10.4%; ER rate = 15.6%

1414
Financial Status of MSRS Correctional Fund
Fiscal Year 2009
July 1, 2009
Actuarial Value
(5 yr smoothing of investment losses)
July 1, 2009
Market Value
(no smoothing of investment losses)
Funding Ratio
(Assets as % of Liabilities)71.88 % 55.62 %
Current Contributions 20.70 % of pay 20.70 % of pay
Contributions Needed 24.85 % of pay 28.57 % of pay
Contribution Deficiency (4.15) % of pay (7.87) % of pay
* Source: Mercer Consulting, FY 09 annual actuarial valuation – EE rate = 8.60%; ER rate = 12.10% eff. 7/1/2010

1515
State Employees Retirement FundProjection of Funding Scenarios
0%
5%
10%
15%
20%
25%
2009 2010 2011 2012 2013 2014 2015 2016 2017 2018 2020 2022 2024 2026 2028 2030 2032 2034 2036 2038
Each of the first 10 years is represented; every other year after
0%
10%
20%
30%
40%
50%
60%
70%
80%
90%
100%
Contribution Deficiency (% of pay) Funding %
Baseline – 8.5% return for years after FY2009. Based on 2039 amortization date.
65%
18%Projected
funded ratio
What if we do nothing ?
Source: MercerConsulting Services
1616
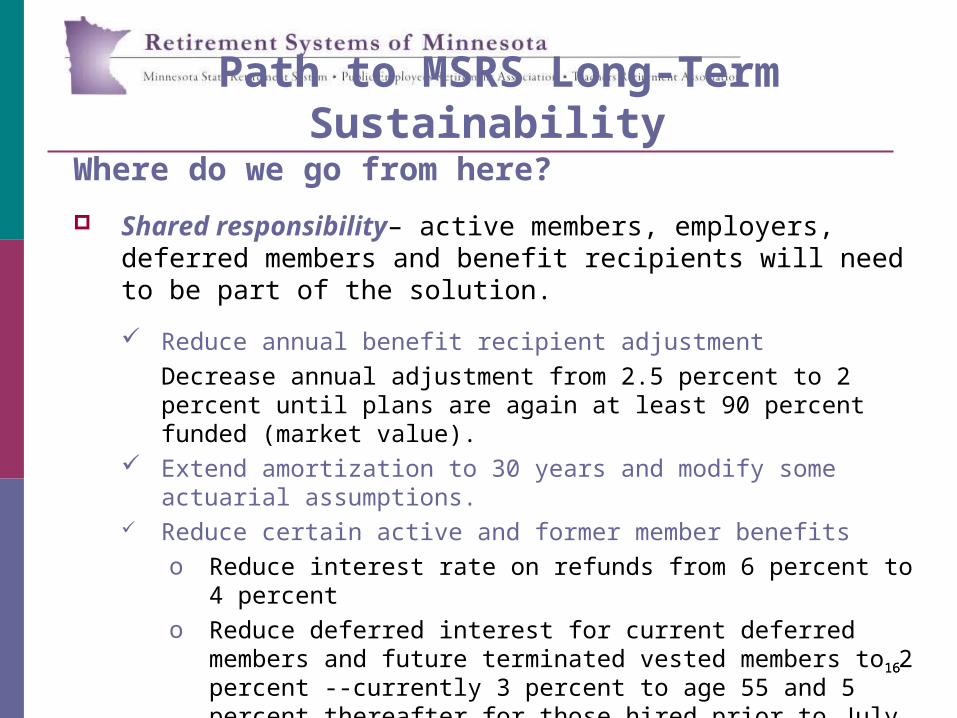
Path to MSRS Long-Term Sustainability
Where do we go from here?
Shared responsibility– active members, employers, deferred members and benefit recipients will need to be part of the solution.
Reduce annual benefit recipient adjustment
Decrease annual adjustment from 2.5 percent to 2 percent until plans are again at least 90 percent funded (market value).
Extend amortization to 30 years and modify some actuarial assumptions. Reduce certain active and former member benefits
o Reduce interest rate on refunds from 6 percent to 4 percento Reduce deferred interest for current deferred members and future
terminated vested members to 2 percent --currently 3 percent to age 55 and 5 percent thereafter for those hired prior to July 1, 2006 or 2.5 percent for all years for those hired after July 1, 2006.
o Increase vesting to five yearso Eliminate interest on re-employed retiree accounts .
17
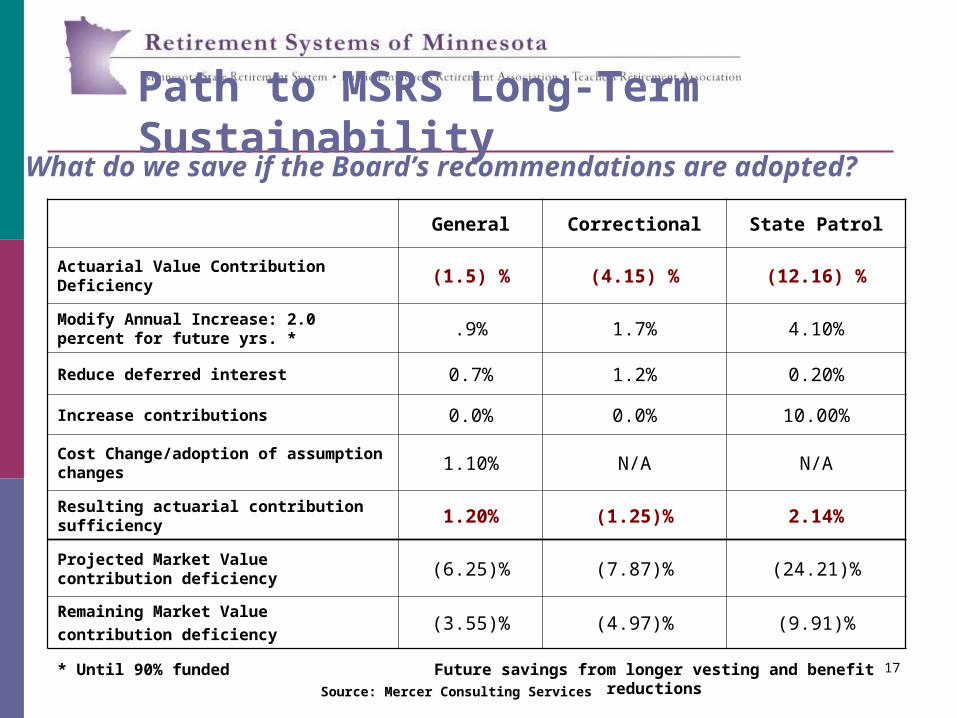
Path to MSRS Long-Term Sustainability
17
What do we save if the Board’s recommendations are adopted?
17
General Correctional State Patrol
Actuarial Value Contribution Deficiency (1.5) % (4.15) % (12.16) %
Modify Annual Increase: 2.0 percent for future yrs. * .9% 1.7% 4.10%
Reduce deferred interest 0.7% 1.2% 0.20%
Increase contributions 0.0% 0.0% 10.00%
Cost Change/adoption of assumption changes 1.10% N/A N/A
Resulting actuarial contribution sufficiency 1.20% (1.25)% 2.14%
Projected Market Value contribution deficiency (6.25)% (7.87)% (24.21)%
Remaining Market Value contribution deficiency
(3.55)% (4.97)% (9.91)%
Future savings from longer vesting and benefit reductions* Until 90% fundedSource: Mercer Consulting Services

18
Path to MSRS Long-Term Sustainability
State Employees Retirement FundProjection of Funding Scenarios with 3.25% Reduction to Deficiency in 2011
0%
5%
10%
15%
20%
25%
2009 2010 2011 2012 2013 2014 2015 2016 2017 2018 2020 2022 2024 2026 2028 2030 2032 2034 2036 2038
Each of the first 10 years is represented; every other year after
0%
10%
20%
30%
40%
50%
60%
70%
80%
90%
100%
Contribution Deficiency (% of pay) Funding %
Baseline with rebound – 11.0% return for 3 years after FYE 2009, 8.5% return after. Based on 2039 amortization date.
Source: Mercer Consulting Services

191919
Financial Status of TRA
Fiscal Year 2009
July 1, 2009
Actuarial Value
(5 yr smoothing of investment losses)
July 1, 2009
Market Value
(no smoothing of investment losses)
Funding Ratio
(Assets as % of Liabilities)77 % 60 %
Current Contributions 11.69 % of pay 11.69 % of pay
Contributions Needed 16.81 % of pay 22.76 % of pay
Contribution Deficiency (5.12) % of pay (11.07) % of pay
* Source: Mercer Consulting, FY 09 valuation – EE rate = 5.5%; ER rate = 5.5%

202020
Purple Funded %: Current Contributions (11.75%), 8.5% investment return in all years
Green Funded %: Current Contributions (11.75%), 11% investment return for 3 years; 9.5% thereafter
What if we do nothing?
20
60% Funded
Ratio FY09
Assumes no changes in contributions or
benefits
0%
Normal Investment Assumptions
Optimistic Investment Assumptions
212121
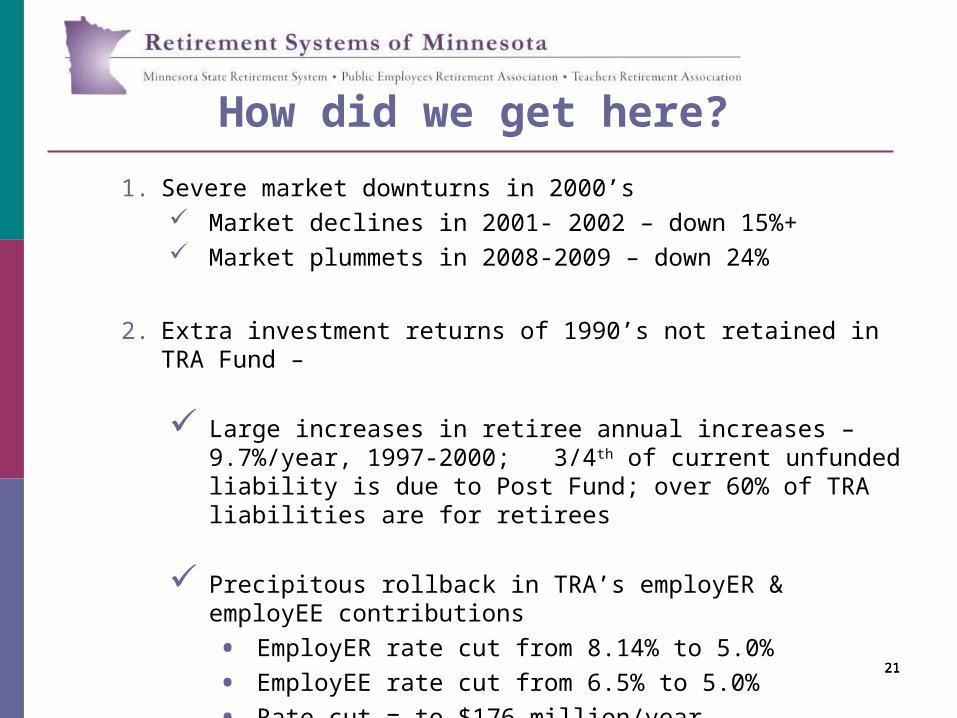
How did we get here?
1. Severe market downturns in 2000’s Market declines in 2001- 2002 – down 15%+ Market plummets in 2008-2009 – down 24%
2. Extra investment returns of 1990’s not retained in TRA Fund –
Large increases in retiree annual increases – 9.7%/year, 1997-2000; 3/4th of current unfunded liability is due to Post Fund; over 60% of TRA liabilities are for retirees
Precipitous rollback in TRA’s employER & employEE contributions
• EmployER rate cut from 8.14% to 5.0%
• EmployEE rate cut from 6.5% to 5.0%
• Rate cut = to $176 million/year

2222
Employer Rate
Employee Rate
Full funding reached
Low funding ratio/deficit
TRA Contributions Higher in PastEmployer /Employee
Contributions in Other States

232323
Path to TRA Long-Term Sustainability
Where do we go from here?
Shared sacrifice – active members, employers, deferred members and benefit recipients will need to be part of the solution. Reduce annual benefit recipient adjustment
Temporary 2-year suspension (Jan. 2011 and Jan. 2012)
2 percent annual increase thereafter until plan is stabilized Increase employee and employer contributions - phased in over 4 years
2 percent for employers – phased in 0.5% per year, July 1, 2011 – July 1, 2014
2 percent for employees – phased in 0.5% per year, July 1, 2011 – July 1, 2014 Reduce certain active and former member benefits
Reduce interest rate on refunds to 4%; reduce deferred interest for current deferred members and future terminated vested members to 2%; eliminate interest on re-employed retiree accounts.
Re-evaluation of all elements in 5 years – Investment returns will have a major impact (unknown).

242424
Path to TRA Long-Term SustainabilityTRA Board Recommendations
DeficiencyMarket value
(11.07%)
Modify Annual Increase: 2 percent for future years until fund stabilized 2.0 %
Suspend Annual Increase for two years (2011-12) 1.0 %
Increase contributions: 2% employers, phased in 0.5%/yr, 2011-2014 2.0 %
Increase contributions: 2% employees; phased in 0.5%/yr, 2011 – 2014 2.0 %
Reduce deferred interest rate to 2%, reduce refund rate to 4% and ELSA rate to 0% 0.55 %
Savings from assumption changes 0.20 %
Expected revenue/savings from changes 7.75 %
Net remaining actuarial contribution (deficiency)/sufficiency (3.42 %)

2525
Path to TRA Long-Term Sustainability
25
60% Funded Ratio FY09
0%
No Change -Normal Assumptions
No Change -Optimistic Assumptions
* Source: Mercer Consulting actuarial projections, 12/16/09
Proposal – Optimistic Assumptions
Proposal – Normal
Assumptions
94%
76%
Purple: Current Contributions (11.69%), no changes in contributions/benefits, 8.5% return in all years
Green: Current Contributions (11.69%), no changes in contributions/benefits, 11% return for 3 yrs; 9.5% thereafter
Blue: Higher Contributions (15.69%), 2 year COLA suspension with 2% thereafter, reset amortization period in 2016, 8.5% return in all yrs
Red: Higher Contributions (15.69%), 2 year COLA suspension with 2% thereafter, reset amortization period in 2016, 11% return for 3 yrs; 9.5% thereafter

2626
MN Public Pensions Important to State
MN’s public pension systems serve nearly one-half million persons, 1 in 10 Minnesotans
More than 90 percent of the systems’ benefit recipients reside in Minnesota
Systems paid out over $2.5 billion in benefits which added $3.3 billion on state economy and led to 22,500 additional jobs statewide
State/local taxes paid by recipients and holders of new jobs exceeded public employer pension contributions to the systems by $80 million annually
Economic impact of pension benefits was larger than the gross state product from mining and 92% of agricultural (crop/animal) production.
26Source: Lubov, Andrea. “Measuring the Impact of Minnesota’s Retirement Systems, March 2008