1-Social Protection Index Technical Workshop - Review of the Methodology_Highlights of Issues and...
20
SOCIAL PROTECTION INDEX Review of the Methodology: Highlight of Issues and Problems Terry McKinley Director, Centre for Development Policy & Research, School of Oriental and African Studies Inception Workshop on the SPI Update ADB Headquarters 3-4 April 2014, Manila
Transcript of 1-Social Protection Index Technical Workshop - Review of the Methodology_Highlights of Issues and...

SOCIAL PROTECTION INDEX Review of the Methodology:Highlight of Issues and Problems
Terry McKinleyDirector, Centre for Development Policy & Research,
School of Oriental and African StudiesInception Workshop on the SPI Update
ADB Headquarters3-4 April 2014, Manila

Initial Comparison to the Original 2005 Social Protection Index
1. The 2005 SPI was a composite index composed of four separate Indicators:
a. Social Protection Expenditures: SP Expenditures as a ratio to GDP
b. Social Protection Coverage: SP Beneficiaries as a ratio to the ‘reference population’ (those eligible to receive benefits)
c. Social Protection Distribution: Proportion of the poor receiving SP benefits
d. Social Protection Impact: per capita SP benefits received by the poor as a ratio to the national poverty line
2

Building on the Original Social Protection Index
We wanted to develop an SPI for 2009 that was simpler and easier to understand while retaining some of the same features
Each of the four separate indicators in the 2005 SPI was converted into a scale 0-1. Then they were added together, based on equal weight, to produce an overall index scaled 0 to 1
But an abstract index might not be ideal for highlighting the concrete realities of social protection
Though the 2009 SPI is still called an ‘index’, it is really one combined indicator, which can be disaggregated along several concrete dimensions
3

Some Essential Features of the 2009 SPI
The 2009 SPI has retained social-protection expenditures (per intended beneficiaries)
But it has compared this ratio to GDP per capita(not compared total expenditures to GDP itself as in the 2005 SPI)
The 2009 SPI has also retained the ratio of actualbeneficiaries to intended beneficiaries (as a disaggregated component of the SPI)
So some of the major features of the 2005 SPI have been recombined into a new more integrated form to produce the 2009 SPI
4

Some Essential Features of the 2009 SPI
The 2009 SPI essentially compares total expenditures on social protection to the total intended beneficiaries of social protection (e.g., the poor, children, the elderly, the disabled)
The ratio of these two dimensions is the central expression of the 2009 SPI
Rationale: are higher expenditures on social protection (compared to GDP) always good? Answer: only if they reach the intended beneficiaries
So the identification of the Intended Beneficiaries (‘the reference population’) is of central concern
5

The Essential Features of the 2009 SPI
Is there a limit to social protection expenditures?Who should be the beneficiaries?The poor, of course, but also the vulnerable. So
who are the vulnerable? How to define them?We have dealt with these two issues by 1)
carefully defining the intended beneficiaries and 2) ‘normalizing’ total expenditures/intended beneficiaries by a ‘regional’ poverty line (set at one-quarter of GDP per capita)
Thus, for the purposes of calculating the SPI, the poverty line is the same for all countries
6

The Essential Features of the 2009 SPI
This regional poverty line was the rough average for all national poverty lines(Other options: use a PPP estimate or just use the variety of national poverty lines)
The SPI can, in effect, be expressed relative to a) the regional poverty line (1/4 of GDP per capita) or b) GDP per capita itself. For the latter, the SPI would end up being ¼ of the standard SPI
Example, Republic Korea has an SPI of 0.200 → this would be equivalent to 0.050 (or 5% of GDP per capita)
7

Some Practical Problems in Estimating the SPI
One of our first practical concerns for the 2009 exercise was to properly identify the intended beneficiaries for each major form of social protection (e.g., health insurance, pensions, social transfers, labour market policies)
This proved to be a recurring practical problem across many countries during the collection of 2009 data
For example, who are the intended beneficiaries of labour market policies? How do you identify the intended beneficiaries of disaster relief? How do you identify the elderly for pensions (e.g., 60 years and older? But some people retire at 55)
8

Some Practical Problems in Estimating the SPI
While the central ratio of the 2009 SPI is total expenditures divided by total intended beneficiaries, we also want to know how many of the intended beneficiaries are actual beneficiaries
The initial SPI ratio (total expenditures/intended beneficiaries) can be sub-divided into two ratios: total expenditures/actual beneficiaries X actual beneficiaries/intended beneficiaries
The first ratio is the basis for the depth measure of social protection: the average benefits per actual beneficiary
9

Some Practical Problems: Breadth of Coverage
The second ratio (actual beneficiaries/intended beneficiaries) is the breadth of coverage of social protection
But what if the breadth of coverage is over 100%? Namely, there seem to be more actual beneficiaries than potential beneficiaries. Is this possible?
Some beneficiaries might be counted more than once for a major form of social protection. Or we might have defined too narrowly the intended beneficiaries.
10

Some Practical Problems:The Depth of Coverage
We also became concerned if the depth of coverage (average benefits per actual beneficiary) was very high
This applied to pensions in a few countries: sizeable pensions were received by a fairly small proportion of the elderly, leading to high depths for social insurance as a whole
Be aware that the Depth measure is determined by comparing total expenditures /total intendedbeneficiaries to the ‘regional’ poverty line (1/4 GDP per capita)
11

Defining Social Protection Programs & Sub-Programs
Some of our problems in defining intended beneficiaries are likely related to our definition of social protection programs (and sub-programs)
The intent has been to have a realistic and workable definition of social protection (i.e., ‘the set of policies and programs designed to reduce poverty and vulnerability’, ADB 2001)
Social Protection is not designed to solve all development problems or even all social problems (such as providing education)
We have divided social protection into three major programs: social insurance, social assistance and labour market policies
12

Defining Social Protection:Social Insurance
1. Social Insurance: Contributory schemes to insure against ill health, lack of income among the elderly, unemployment, worker injury and maternity leave
A. Sub-Programs of Social Insurance: Health Insurance, Pensions and ‘Other Social Insurance’ (mainly Provident Funds and passive labour market programs, such as unemployment insurance)
B. The Intended Beneficiaries: The Employed and the Elderly. Data on maternity benefits were sparse.
C. Why are passive labour market programs not grouped with active labour market programs??
13
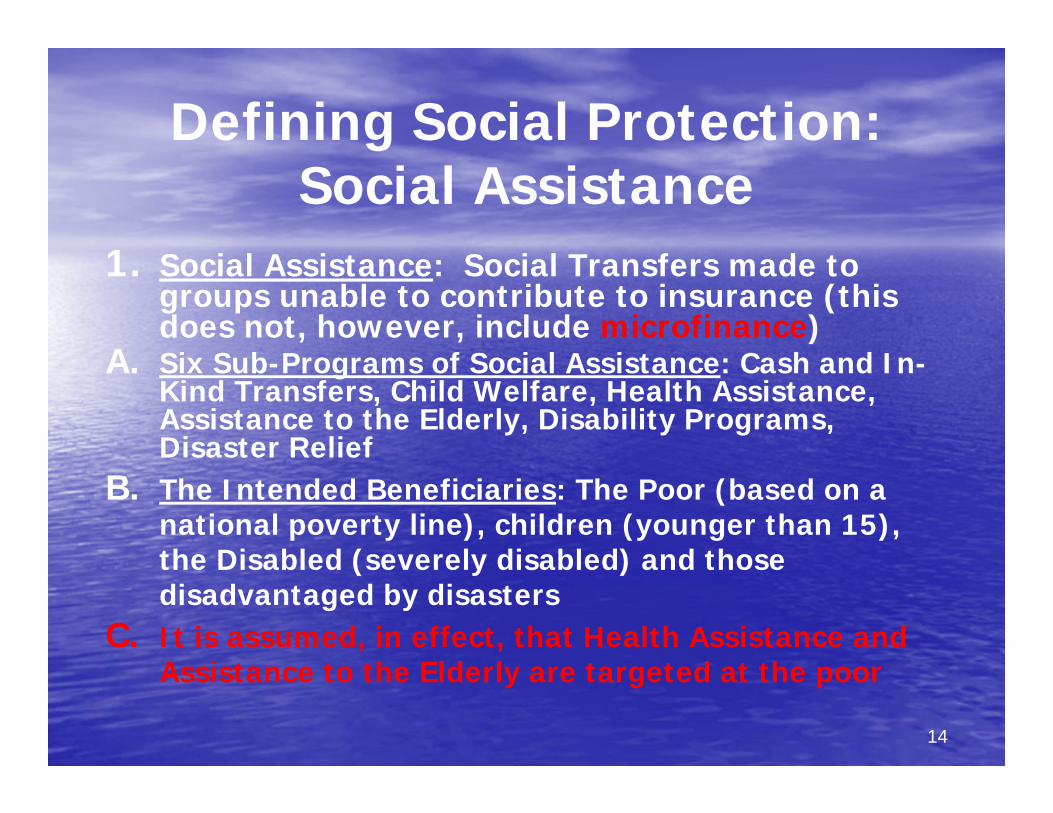
Defining Social Protection:Social Assistance
1. Social Assistance: Social Transfers made to groups unable to contribute to insurance (this does not, however, include microfinance)
A. Six Sub-Programs of Social Assistance: Cash and In-Kind Transfers, Child Welfare, Health Assistance, Assistance to the Elderly, Disability Programs, Disaster Relief
B. The Intended Beneficiaries: The Poor (based on a national poverty line), children (younger than 15), the Disabled (severely disabled) and those disadvantaged by disasters
C. It is assumed, in effect, that Health Assistance and Assistance to the Elderly are targeted at the poor
14

Defining Social Protection:Labour Market Programs
1. Labour Market Programs: Actively help people secure employment
A. Sub-Programs of Labour Market Programs: i. skill development and training and ii. special work programs (such as cash- or food-for-work schemes (India, Bangladesh))
B. The Intended Beneficiaries: Unemployed and ‘Underemployed’ Workers
C. What does ‘underemployed mean’? (working less than 35 hours a week, being a seasonal or unpaid family worker? Having a low income?)
15

Taking Account of Distributional Issues
The 2009 SPI also sought to take account of the distribution of benefits between 1) the poor and the non-poor and between 2) women and men
The lack of reliable data was an immediate practical issue in many countries
Also, the access of the poor to social protection tended to be over-estimated in the initial national reports that were submitted
Social protection intended for the poor often does not really reach them and/or includes many non-poor beneficiaries
16

The Social Protection Indices for the Poor and the Non-PoorThe SPI for the Poor divides the expenditures
received by the Poor by the Poor population (assumed to be intended beneficiaries)
Similarly the SPI for the Non-Poor divides the expenditures received by the Non-Poor by the intended non-poor beneficiaries
Each of these two SPIs is population-weightedBut the unweighted SPI for the Poor is often
higher than the SPI for the Non-Poor. Why???Many of the Non-Poor (those not in formal jobs)
have little or no access to social insurance17

Social Protection Indices for Women and Men
Distributional data were collected for the first time in 2009 for women and men
Data are not widely available across programs (even though it should be easier to collect gender-related data than poverty-related data)
The SPIs for women and men were population-weighted but the weights were assumed, in effect, to be 50% vs. 50%.
But the population shares for women and men might differ (in Bhutan, women account for about 47% of the population, in Armenia for over 53%)
18

Social Protection Indices for Women and Men
There are additional intrinsic problems, especially for social insurance, since many women might not be economically active (thus are not counted as part of the employed population or the unemployed and underemployed)
The biggest absolute gap in social protection between women and men is in social insurance
The biggest relative gap between women and men is in labour market policies
If women are not economically active, do we assume that they cannot be the intended beneficiaries of social insurance or labour market policies?
19

Summing Up the Results for the 2009 SPI
The 2009 SPI has proved to be a useful indicator but it probably needs to be adjusted or refined in some (hopefully limited) ways
We need to pay more attention to how to gauge the distributional impact of social protection (for poor/nonpoor and women/men)
We should review the composition of social insurance vis-à-vis labour market policies (e.g., where to place passive LMPs)
We should review the definitions of some of the ‘intended beneficiaries’ of the sub-programs of social protection (e.g., for social assistance)
20