1 Skills Competency Education for New PI Directors & Coordinators Session FourFebruary 28, 2007...
49
1 Skills Competency Education for New PI Directors & Coordinators Session Four February 28, 2007 Performance Reporting Sponsored by: The MT Rural Healthcare PI Network Co-Sponsored by: Mountain Pacific Quality Health
-
Upload
jasper-mcdaniel -
Category
Documents
-
view
214 -
download
0
Transcript of 1 Skills Competency Education for New PI Directors & Coordinators Session FourFebruary 28, 2007...

1
Skills Competency Education for
New PI Directors & Coordinators
Session Four February 28, 2007
Performance Reporting
Sponsored by: The MT Rural Healthcare PI NetworkCo-Sponsored by: Mountain Pacific Quality Health
2
Today’s Session Recap Session 3:
aggregation/assessment
Session 4 Performance Reporting Value and potential pitfalls 4 R’s of performance reporting Audiences Sample reports and tools
Questions

3
Value: Why Report Performance
Pay for Reporting, Pay for Performance
Basis for objective decision-making
Provides leverage for improvement
Increases team knowledge & understanding Helps focus improvement efforts Encourages proactive response

4
Value: Why Report Performance
Potential to improve organization culture Shared knowledge = shared power Unites individuals around common goals Fosters learning Encourages free exchange of ideas,
creativity Increases ownership of outcomes All celebrate successes and ‘good tries’ Can improve morale
5
Potential Pitfalls
Reporting only for “regulatory compliance”
Introduction of bias into data collection and/or analysis
Rushing to decision-making
6
Potential Pitfalls Different people like to receive
information in different ways
Potential for dysfunctional conflict Blaming with data Increasing resistance to change Triangulation Polarization of the organization

7
Our Reporting Commitment Model the positive approach Report performance objectively Ensure the accuracy of the data Validate assessments &
recommendations Encourage full discussion, persevere Acknowledge, publicize and celebrate
successes Have some fun along the way

8
4 R’s of Performance Reporting
Right InformationRight TimeRight Way
Right Audience
9
The Right Information Is objective
Is relevant to the audience To their role in the organization To their span of control, scope To the decisions they have to make To the questions they have To the questions they have to answer

10
The Right Time
When they can listen and receive it
In time to do something about the data
Length of report

11
The Right Way
Attitude “process not people”; an opportunity
Style Format: the way they prefer to receive
info Language they can understand while
learning the vocabulary

12
Audiences
Quality Management Team (QMT)ManagersMedical StaffGoverning BoardOthers: community

13
Quality Management Team
Role Development and/or
implementation of strategic plan
Deploy operational work plan facility-wide
Monitor progress of PI teams
The Right Info Strategic plan
measures
Operations measures, facility wide
PI team performance

14
Quality Management Team
Role Establish
improvement priorities
Allocate resources
Field questions from all levels of the facility and community
The Right Info Comparative info National, regional
trends, requirements
Costs, benefits
Solid understanding of issues, in-depth information as needed

15
Quality Management Team
Right Way Objective
What’s going well What isn’t Why
Interactive Recommendations
Collaborative We’re all in this
together
Right Time Proactive Frequent reports Most
comprehensive data set reported
Long enough for full discussion of issues and questions; getting to consensus about actions
16
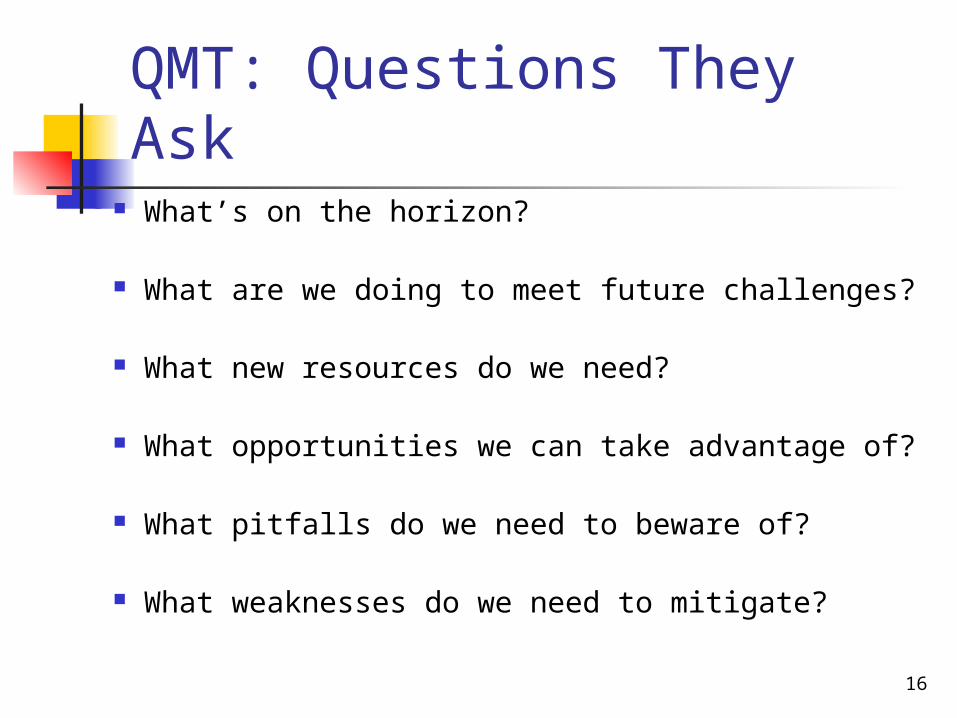
QMT: Questions They Ask What’s on the horizon?
What are we doing to meet future challenges?
What new resources do we need?
What opportunities we can take advantage of?
What pitfalls do we need to beware of?
What weaknesses do we need to mitigate?
17
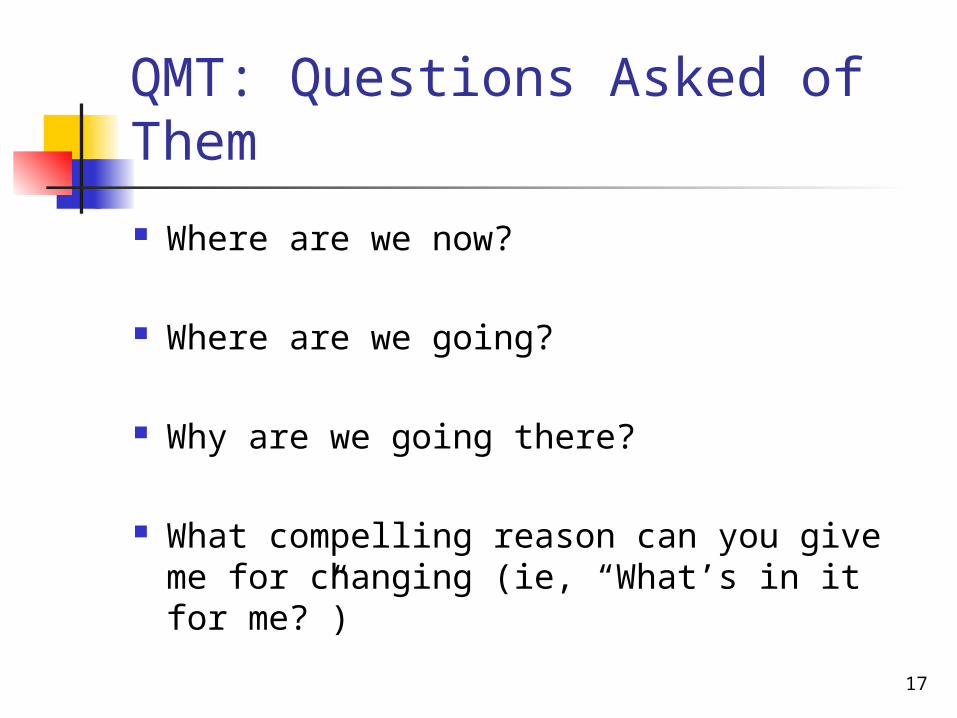
QMT: Questions Asked of Them
Where are we now?
Where are we going?
Why are we going there?
What compelling reason can you give me for changing (ie, “What’s in it for me?”)

18
The QMT Report High-level strategic and operational
measures where no identified problems/ops for improvement exist
Low-level, in-depth performance data where problems are identified or active improvement is underway (“drill down”)
Follow-up reporting each month

19
Managers Role
Leaders Management
functions Decisions are
operational and strategic
Oversee one or more departments/services
Work with med staff Serve on PI teams
Right Information Overall
performance Management
functions Strategic and
operational data Department
specific data Relevant clinical
care data PI team data
20
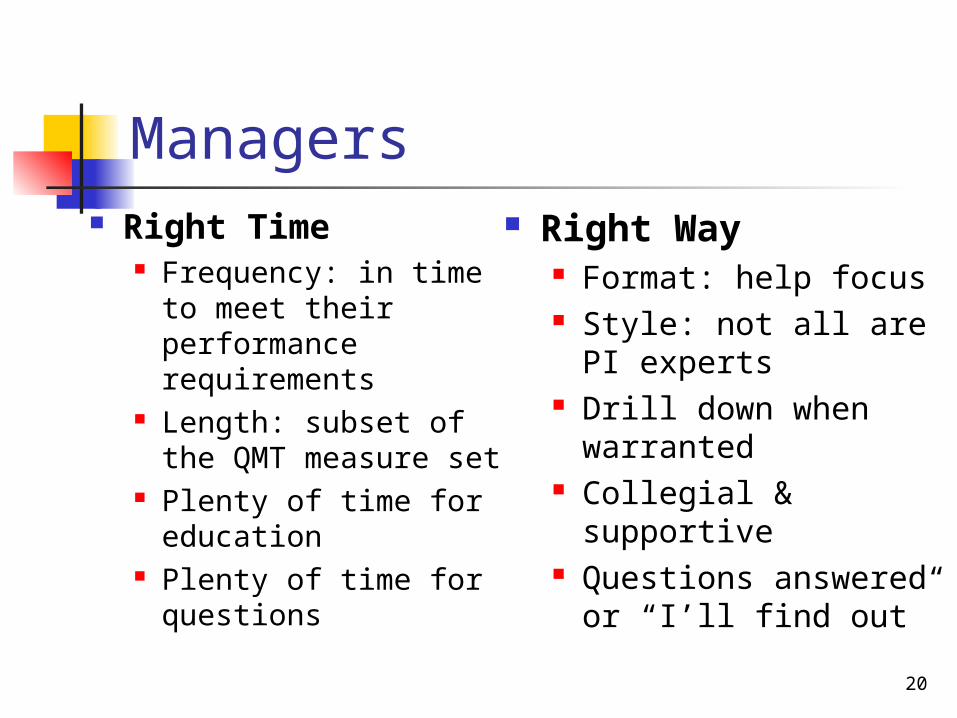
Managers Right Way
Format: help focus Style: not all are PI
experts Drill down when
warranted Collegial &
supportive Questions answered
or “I’ll find out”
Right Time Frequency: in time to
meet their performance requirements
Length: subset of the QMT measure set
Plenty of time for education
Plenty of time for questions

21
Managers: Questions They Ask How is the organization doing?
How are the areas I’m responsible for doing?
Where are we going and why?
What’s coming down the road?
What’s in it for me and my staff to change?

22
Managers: Questions Asked of Them
How is the organization doing?
How is our department doing?
Where are we going?
Why are we going there?
What’s in it for me to change?
23
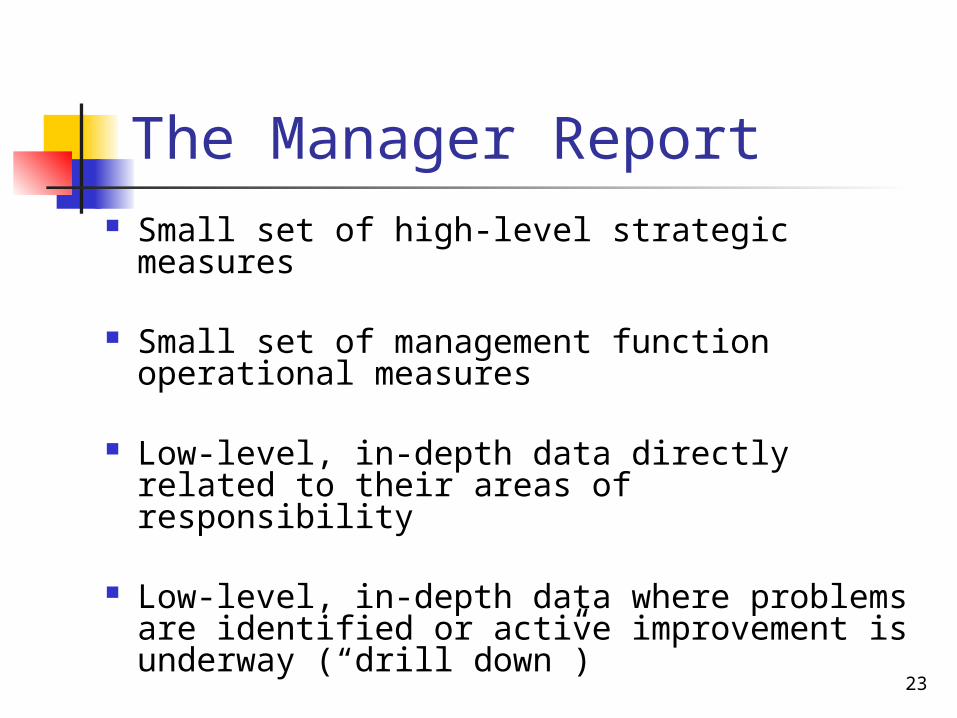
The Manager Report Small set of high-level strategic measures
Small set of management function operational measures
Low-level, in-depth data directly related to their areas of responsibility
Low-level, in-depth data where problems are identified or active improvement is underway (“drill down”)

24
Medical Staff Role
Responsible for quality of diagnosis, treatment
Supervise allied health professionals
Supervise care provided by nursing and ancillary clinical services
The Right Info “Global” clinical data
(mortality, returns, etc) Quality of med records Patient safety Peer review Medication use Nosocomial infections Relevant clinical data
about ancillary services
25
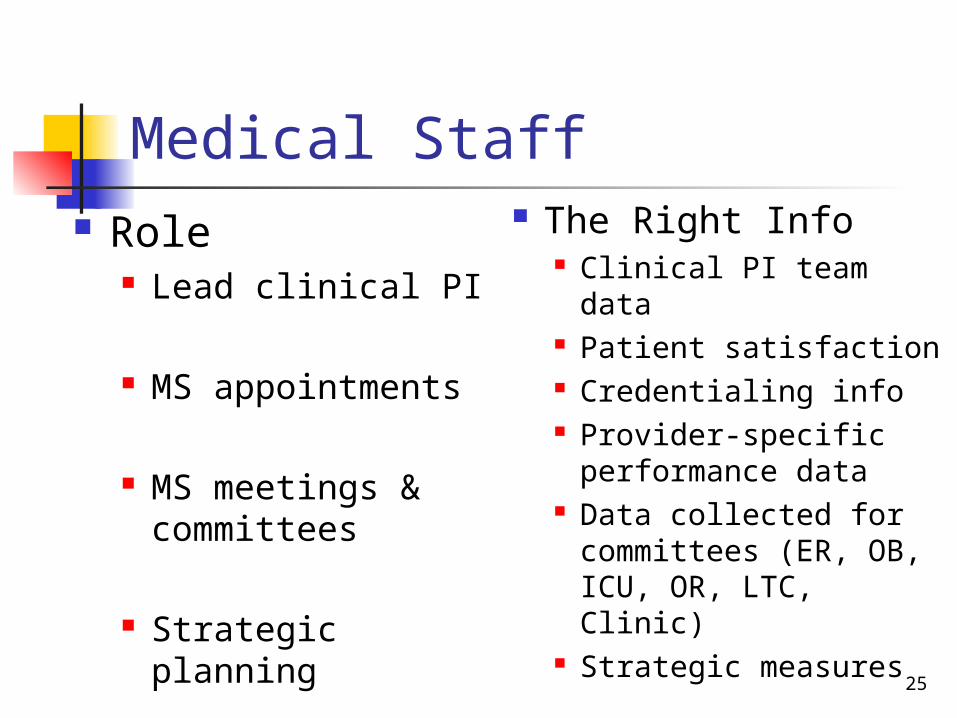
Medical Staff Role
Lead clinical PI
MS appointments
MS meetings & committees
Strategic planning
The Right Info Clinical PI team data Patient satisfaction Credentialing info Provider-specific
performance data Data collected for
committees (ER, OB, ICU, OR, LTC, Clinic)
Strategic measures
26
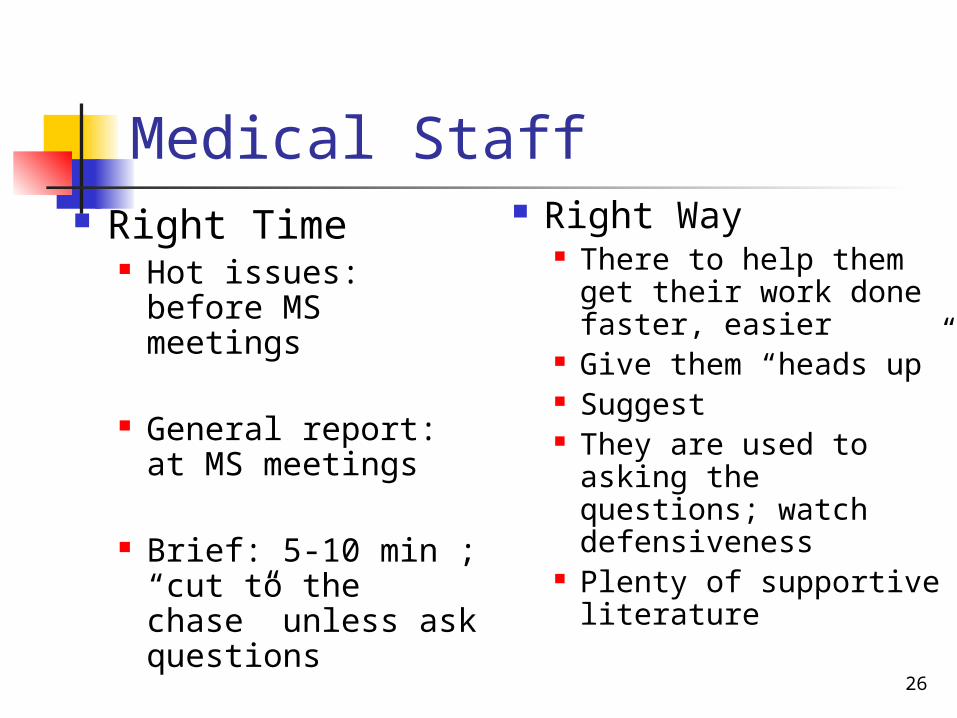
Medical Staff Right Time
Hot issues: before MS meetings
General report: at MS meetings
Brief: 5-10 min ; “cut to the chase” unless ask questions
Right Way There to help them
get their work done faster, easier
Give them “heads up”
Suggest They are used to
asking the questions; watch defensiveness
Plenty of supportive literature
27
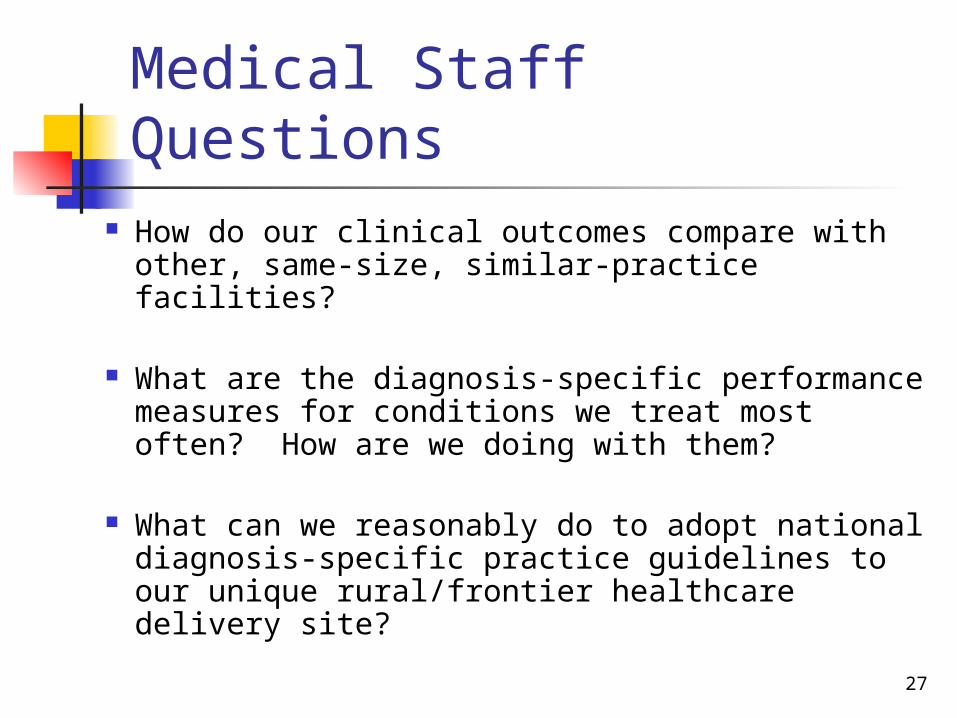
Medical Staff Questions How do our clinical outcomes compare with
other, same-size, similar-practice facilities?
What are the diagnosis-specific performance measures for conditions we treat most often? How are we doing with them?
What can we reasonably do to adopt national diagnosis-specific practice guidelines to our unique rural/frontier healthcare delivery site?
28
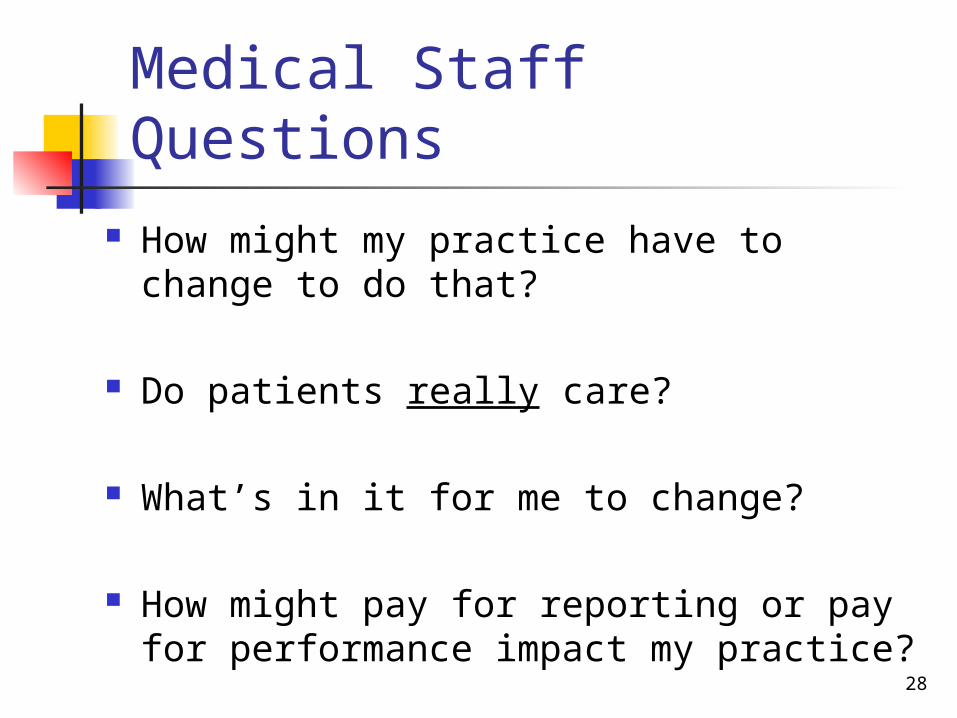
Medical Staff Questions How might my practice have to change to
do that?
Do patients really care?
What’s in it for me to change?
How might pay for reporting or pay for performance impact my practice?

29
The Medical Staff Report Targeted clinical measure set to help them
move in the necessary direction Including publicly reported clinical measures
Small set of high-level, global measures they can use to benchmark with other facilities
Additional data as requested
Encourage them to lead clinical PI

30
Governing Board Role
Full legal responsibility for the quality of care
Fiduciary Risk management
Accountable to community
Implement the strategic plan
The Right Info Highest level clinical
measures Patient safety Financial information Risk management data Publicly-reported
performance measures Patient satisfaction Strategic plan
measures

31
Governing Board Role
Position for the future
Oversee CEO
Oversee medical staff Bylaws, Rules, Regs
Appoint medical staff
The Right Info What’s coming
He/she gives his/her own report
Work with med staff to do this
Credentialing, provider performance data
32
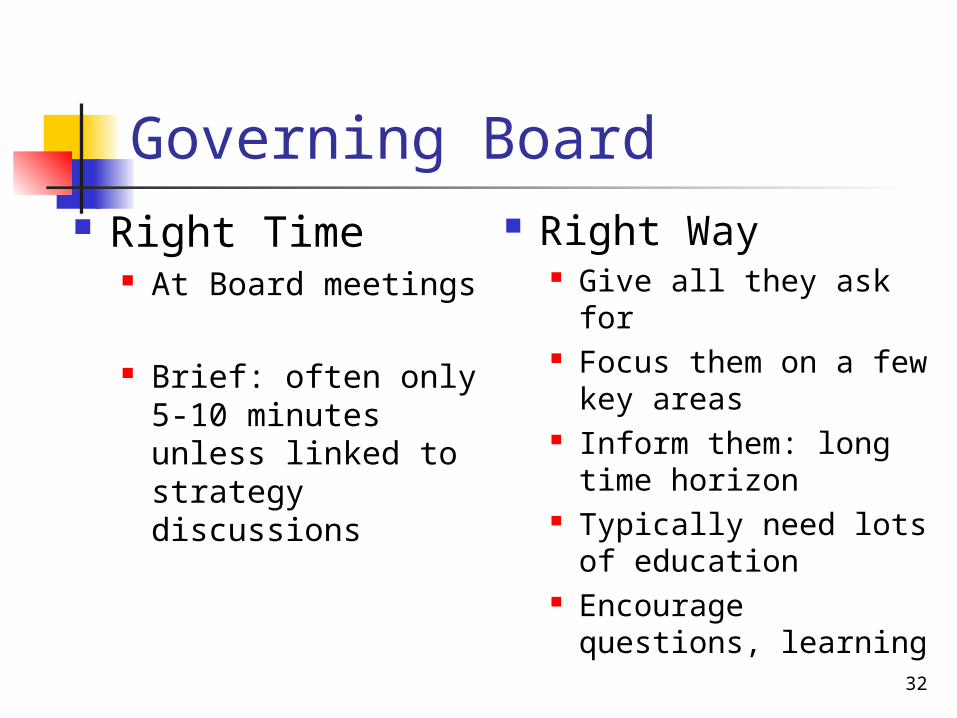
Governing Board Right Time
At Board meetings
Brief: often only 5-10 minutes unless linked to strategy discussions
Right Way Give all they ask for Focus them on a few
key areas Inform them: long
time horizon Typically need lots of
education Encourage questions,
learning
33
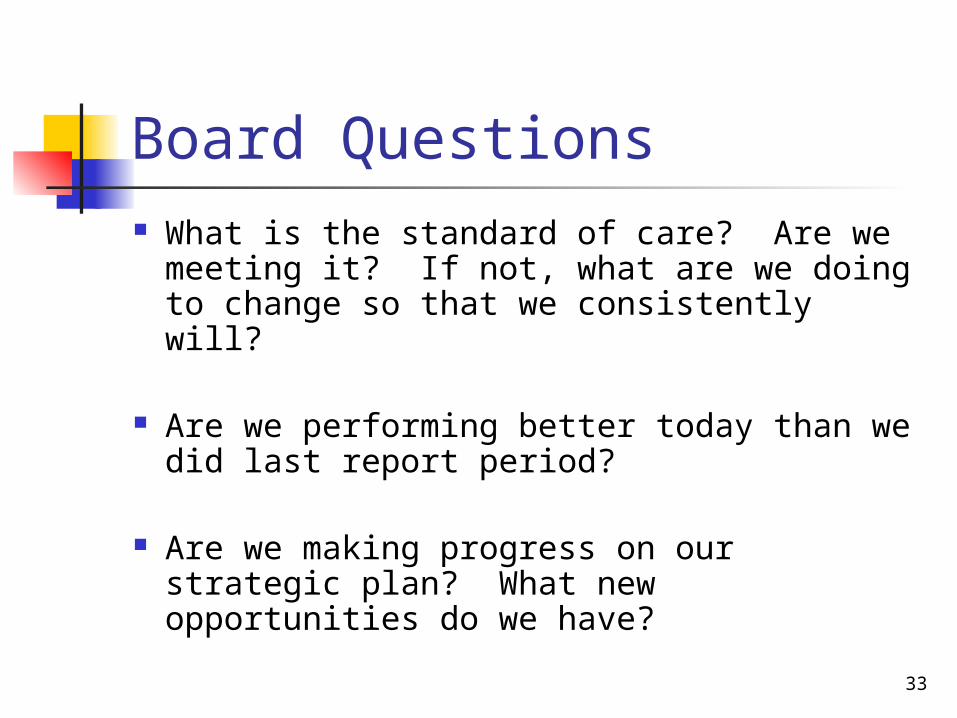
Board Questions What is the standard of care? Are we
meeting it? If not, what are we doing to change so that we consistently will?
Are we performing better today than we did last report period?
Are we making progress on our strategic plan? What new opportunities do we have?
34
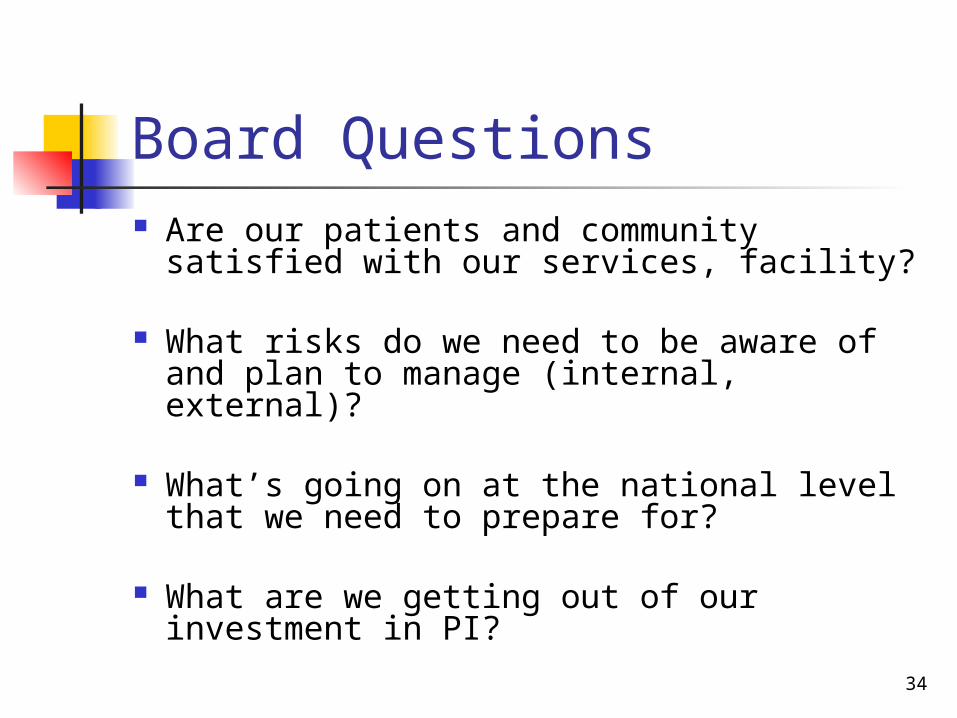
Board Questions Are our patients and community
satisfied with our services, facility?
What risks do we need to be aware of and plan to manage (internal, external)?
What’s going on at the national level that we need to prepare for?
What are we getting out of our investment in PI?

35
The Board Report High level strategic and operational
performance measures: Clinical care Customer/patient/community satisfaction Hospital operations, including risk
management
CAH Annual Program Evaluation
Providing education, receiving direction

36
SampleReports
“A Picture Speaks a Thousand Words”
Focusing your audience

37
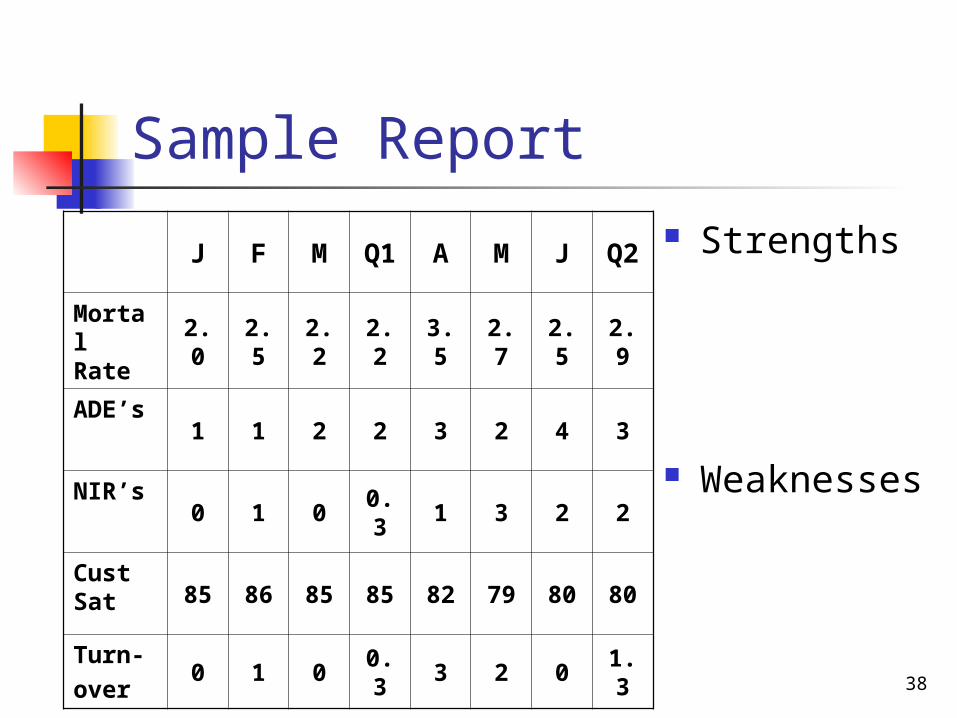
Sample Report “The 2nd quarter
mortality rate was 2.9. There were 9 ADEs, and 6 nosocomial infections. Overall, 80% of our patients were satisfied. 4 staff positions turned over.”
Strengths
Weaknesses
38
Sample Report Strengths
Weaknesses
J F M Q1 A M J Q2
Mortal Rate
2.0
2.5
2.2
2.2
3.5
2.7
2.5
2.9
ADE’s1 1 2 2 3 2 4 3
NIR’s0 1 0
0.3
1 3 2 2
Cust Sat 85 86 85 85 82 79 80 80
Turn-over
0 1 00.3
3 2 01.3

39
Sample Report Strengths
Weaknesses
J F M Q1 A M J Q2
Mortal Rate
2.0
2.5
2.2
2.2
3.5
2.7
2.5
2.9
ADE’s1 1 2 2 3 2 4 3
NIR’s0 1 0
0.3
1 3 2 2
Cust Sat 85 86 85 85 82 79 80 80
Turn-over
0 1 00.3
3 2 01.3

40
Sample Report Strengths
Weaknesses
J F M Q1 A M J Q2
Mortal Rate
2.0
2.5
2.2
2.2
3.5
2.7
2.5
2.9
ADE’s1 3 2 2 3 2 4 3
NIR’s0 1 0
0.3
1 3 2 2
Cust Sat 85 86 85 85 82 79 80 80
Turn-over
0 1 00.3
3 2 01.3

41
Sample Report Strengths
Weaknesses
0
1
2
3
4
J '06 F M A M J
Adverse Drug Events
Nosocomial Infections

42
Sample Report
0
20
40
60
80
100
% C
om
ple
te
2nd Q 2006
HF Discharge Instructions
Activity DietDC Meds Follow up AptWeight Mon Symptoms
Strengths
Weaknesses
43
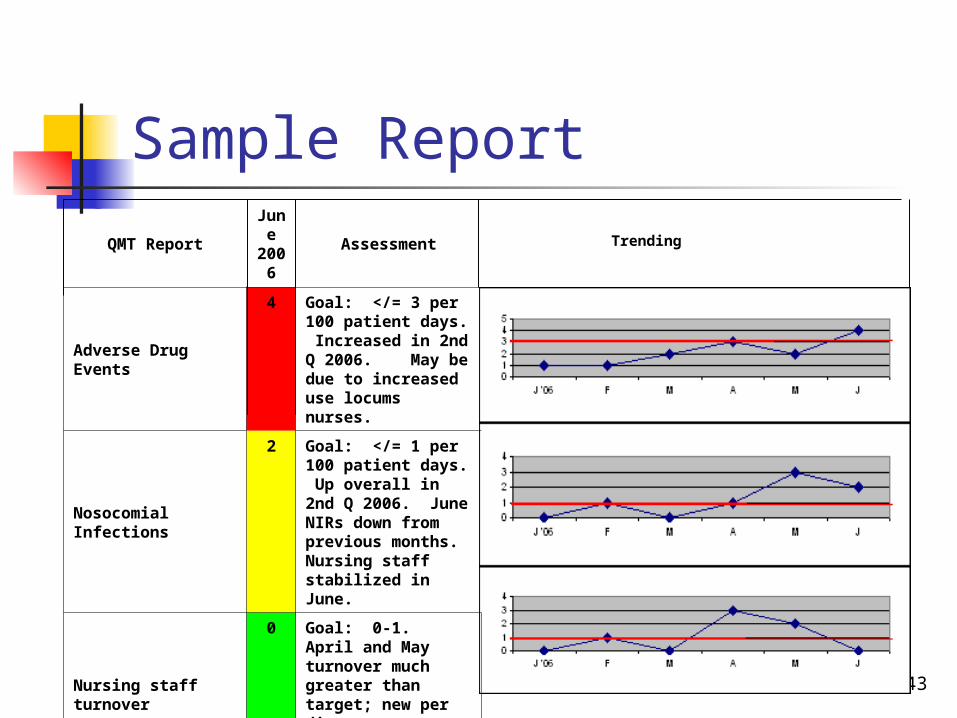
Sample Report
QMT Report
June
2006
Assessment
Adverse Drug Events
4 Goal: </= 3 per 100 patient days. Increased in 2nd Q 2006. May be due to increased use locums nurses.
Nosocomial Infections
2 Goal: </= 1 per 100 patient days. Up overall in 2nd Q 2006. June NIRs down from previous months. Nursing staff stabilized in June.
Nursing staff turnover
0 Goal: 0-1. April and May turnover much greater than target; new per diem nurse staffing business opened locally.
Trending

44
Sample Report (Spidergram)
Medical Records: % Documentation Completed
35%
45%
65%
38%
100%
100%
95%
98%
100%
98%
0%
20%
40%
60%
80%
100%Face sheet
Immunizations
Physician orders
H & P complete
Inf consents
Nursing assessment
Nursing care plan
Pt/family ed
Discharge planning
Discharge summary
45
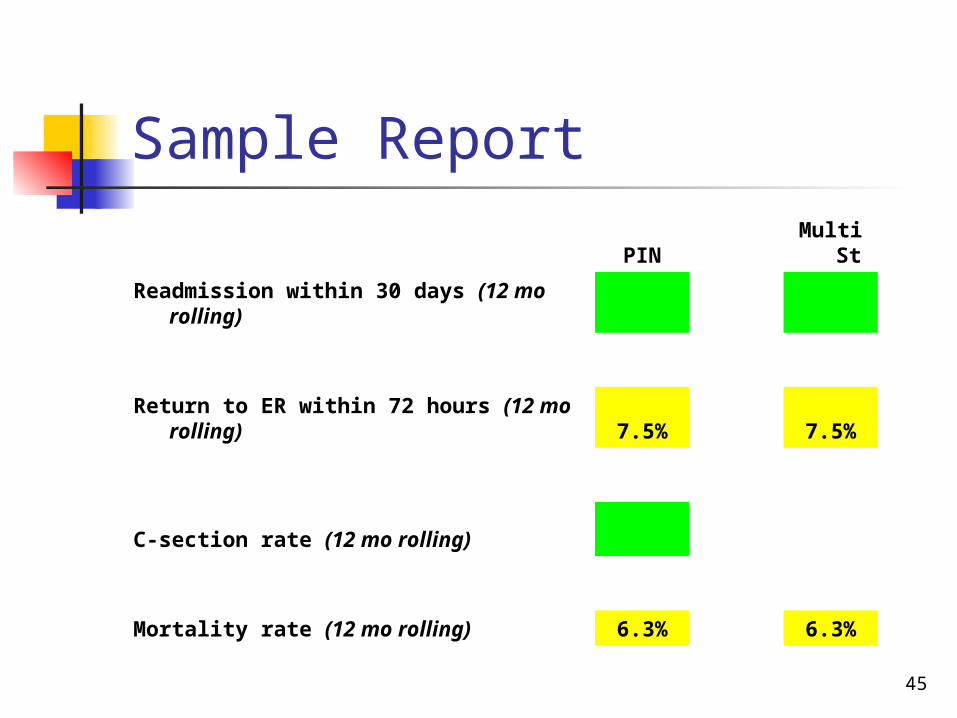
Sample Report
PIN MultiSt
Readmission within 30 days (12 mo rolling)
Return to ER within 72 hours (12 mo rolling) 7.5% 7.5%
C-section rate (12 mo rolling)
Mortality rate (12 mo rolling) 6.3% 6.3%
46
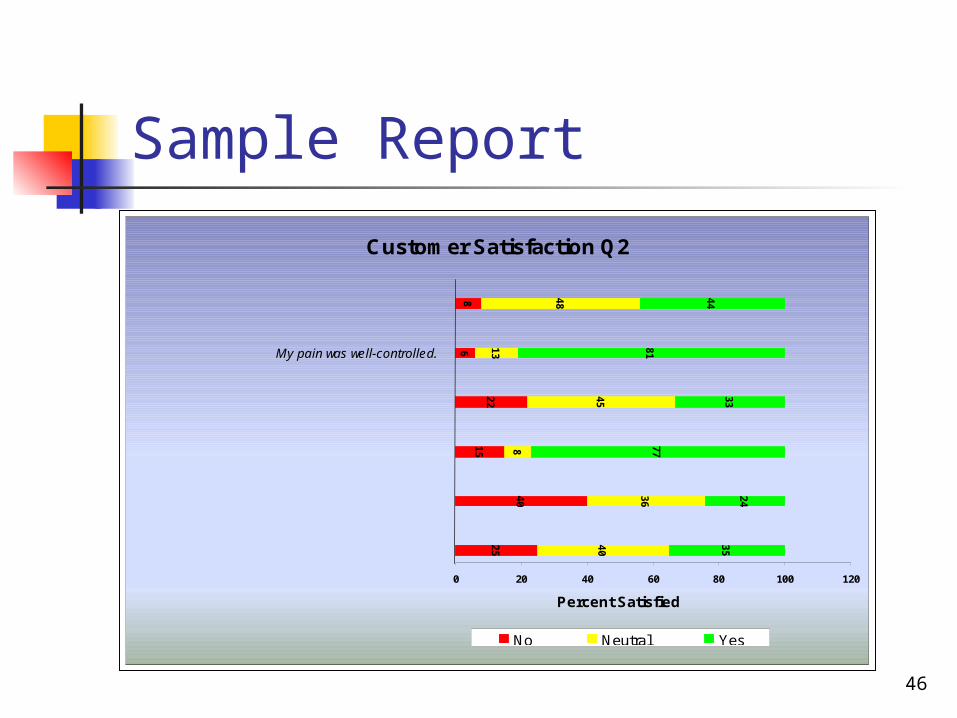
Sample Report
Customer Satisfaction Q2
25
40
1522
6
40
36
8
45
13
48
35
24
77
33
81
448
0 20 40 60 80 100 120
Percent Satisfied
No Neutral Yes
My pain was well-controlled.
I would recommend this facility.
My call light was answered promptly.
I always knew my nurse's name.
My physician answered all of my questions.
Overall, I was satisfied w/ the quality of care I received.

47
Sample Report
PI Prog 2005
2004 events
2005 events
$/eventCost Savings
Hip fx, fall
6 4 23,000 46,000
Nosocom Infects
20 11 8,000 72,000
Staff turnover
48 30 15,000 270,000
Total 388,000

48
Electronic Support Tools Spreadsheet software
EXCEL (www.mtpin.org)
Lotus 1-2-3 Presentation software
Power Point (www.mtpin.org) Publication software
Front Page Page Maker

49
Questions?
Next Time:
Quality Management Team Meetings
Wed, March 14, 1 pm