1 Session 9 Pricing Policies and Practices & Capital Budgeting.
61
1 Session 9 Pricing Policies and Practices & Capital Budgeting
-
Upload
daniel-mcbride -
Category
Documents
-
view
219 -
download
0
Transcript of 1 Session 9 Pricing Policies and Practices & Capital Budgeting.

1
Session 9
Pricing Policies and Practices & Capital Budgeting

PRICING
• Pricing denotes revenue to seller
• Perceived Value to buyer
• Pricing strategy Important for new product, modified product, new market, new market segment, objective of firm
• Basic determinants are supply and demand
2

3
PRICING PRACTICES
General Considerations To Be Kept In Mind While Formulating A Pricing Policy:
• Objectives of business- Notwithout considering its impact on all objectives
• Market structure• Competitor’s strategy• Price Sensitivity/ elasticity(even for
monopolist)• Conflicting Interests of Manufacturers and
Middlemen, consumers

4
General Considerations
• Routinisation of Pricing- Speed required in decision-making, quality of data available, competitive market
• Role of Non Business Groups in pricing Decisions- Government, political considerations , farmers and business lobbies, Trade Unions etc

Types of Pricing
• COST BASED PRICING
• BASED ON FIRM’S OBJECTIVE
• COMPETITION BASED PRICING
• PRODUCT LIFE CYCLE PRICING
• CYCLICAL PRICING
• MULTIPRODUCT PRICING
• ADMINISTERED PRICING
5

I. COST BASED PRICING
• Cost Based Pricing– Cost Plus or Mark Up– Marginal Cost pricing– Target Return pricing
6

7
Cost Based Pricing
i. Cost Plus / Full Cost/Average Cost/ Mark-up Pricing
Price set to cover cost plus a percentage for predetermined profits.
P= AC+ m
where, m =mark-up percentage

• Mark up depends on target rate of return, degree of competition, price elastiicty, substitutes etc
- Most common• Simple to fix the price• More defensible on moral grounds
8

9
Cost Based Pricing
Drawbacks:-Historical cost rather than current cost data is
used, which may lead to over/under pricing-Inappropriate if variable cost fluctuates frequently-Some critics say it ignores demand side (But firm
determines mark up on the basis of ‘what the market can bear’)
- Ignores marginal cost as it uses average cost- Not suitable if competition is tough or when
entering new market
10
Marginal Cost Pricing
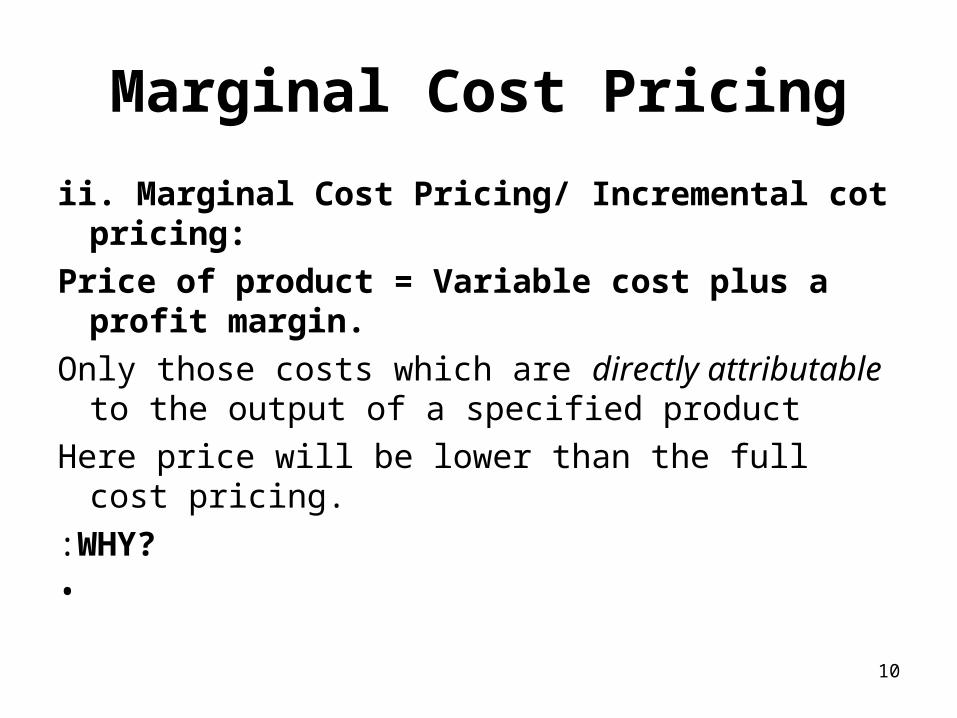
ii. Marginal Cost Pricing/ Incremental cot pricing:
Price of product = Variable cost plus a profit margin.
Only those costs which are directly attributable to the output of a specified product
Here price will be lower than the full cost pricing.
:WHY?•

11
Marginal Cost Pricing
• All past outlays are historical and a firm should deal solely with anticipated revenues and outlays
• Firm is more interested in future changes in cost due to changing decisions
• Unlike fixed costs , MCs are controllable in the short run
• Total costs can not be of use in case of multi- product/ markets/ process situations

Marginal Cost Pricing
Useful to beat competition
Also, to enter the market
Used for pricing public utility where profit is not the motive
Weaknesses:• Can only be a short term strategy (as it omits
fixed costs)• Can be only restricted to pricing of specific
orders12

Cost Based Pricing
Iii) Target Return Pricing
• Producer rationally decides the minimum rate of return which must be earned by the product
• Methodology similar to the above, but margin is decided on the basis of target rate of return, on the basis of experience, consumer’s paying capacity, risk involved etc
13

II. Based on Firm’s Objective
• Pricing Based on Firm’s objective
-Profit Maximisation- considers total cost
-Sales Maximisation- should adopt competitive pricing, say marginal pricing
14

III. COMPETITION BASED PRICING
i. Penetration Pricing : Low price when entering new market dominated by existing players (Nirma, Deccan Air)
ii. Entry Deterring- Price kept low to make market unattractive for competitors (Common in oligopoly)
15

Competition Based Pricing
iii. Going Rate Price:
Why?
Firms do not want price wars
Small/ new firms may not be sure of the effect of charging a different price
Products are close substitutes with high cross elasticity
16

Competition Based Pricing
Popular in monopolistic and oligopoly markets because
a) of low product differentiation and
b) for consumer the cost of switching is minimal
• Uniform price of packaged water or fruit juice
17

18
IV. PRICE DISCRIMINATION
First degree Price Discrimination
-Each unit of output
is sold at a different price
or each consumer is charged
a different price .
Entire consumer’s surplus wiped out
Quantity
Pric
e

19
Second Degree Price Discrimination
A
B
C
D
D
Demand
Pric
e
P1
P3
P2
Q1 Q2 Q3O
Seller gets part of consumer’s surplus.
Highest price of OP1 for OQ1 units.
Price is OP2 for Q1Q2 units
Lowest price of OP3 for the next Q2Q3 units. Monopolist maximises revenue at
TR= (OQ1*AQ1)+ (Q1Q2*BQ2)+ (Q2Q3*CQ3)

20
Third Degree Price Discrimination
Quantity Demanded
Cos
t &
Rev
enue
MC
MR
AR=DDa Db
MRa MRb
QaQb Q
T
AB
O Oo

21
Third Degree Price Discrimination
• Monopolist has 2 markets, A and B.• For market A, Da is the average revenue
(demand) curve and MRa is the marginal revenue curve.
• For market B, Db is the average revenue (demand) curve and MRb is the marginal revenue curve.
• Horizontal summation of the two markets give the aggregate AR=D and MR curves for the monopolist.

22
Third Degree Price Discrimination
• Firm’s MC intersects MR curve at T.
• Drawing a perpendicular from T we get the optimum level of the firm’s aggregate output at OQ.
• At this level of output, MR=MC.

23
Third Degree Price Discrimination
• OQ is divided between the two markets in such a way that the profit maximisation condition (i-e., MC (=TQ ) is equal to MR) is satisfied in both the markets.
• This is achieved by drawing a line from point T parallel to X axis , through MRa and MRb.
• Optimum share for market A is OQa (at price AQa) and for market B the share is OQb (at price BQb).

V. PRODUCT LIFE CYCLE PRICING
• Refers to different pricing strategies for a product depending on the different stages of its life cycle
• Each phase is unique- different demand patterns and competition
• So setting same price will mean less than optimum revenue
24
25
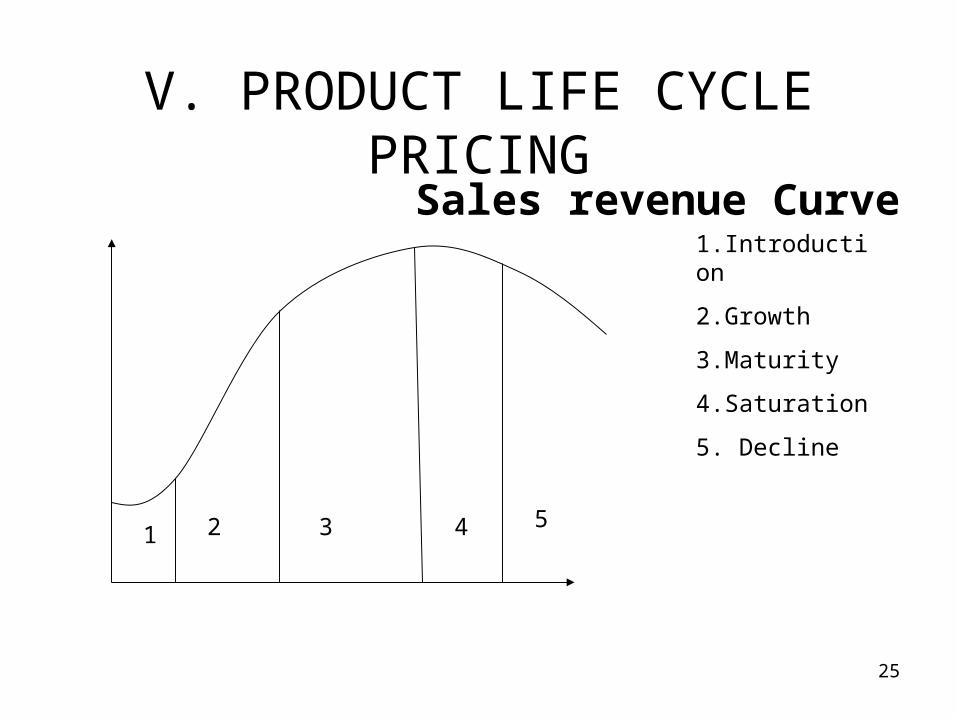
V. PRODUCT LIFE CYCLE PRICING
Sales revenue Curve
1 2 3 4 5
1.Introduction
2.Growth
3.Maturity
4.Saturation
5. Decline

26
PRODUCT LIFE CYCLE PRICING
i) New Product: a)Skimming Policy: Charging very high initial price and super normal
profits-Lower price during maturity• The first ball pens introduced in 1945 cost 80
cents to produce but were priced at $12.50.• Initial high prices of computers• 1st day movie tickets

27
PRODUCT LIFE CYCLE PRICING
Why?• Demand is likely to be less price-elastic in initial
stages• If life of product is likely to be short, the producer
can get as much as possible as fast as possible• The policy can lead to introduction of product for
lower segments later.• High initial price may finance the heavy initial
costs of introducing a new product when other sources of finance may not be available
28
PRODUCT LIFE CYCLE PRICING
Benefits of lower cost due to growing volumes and technological development allows for lowering of prices at a later stage.

29
PRODUCT LIFE CYCLE PRICING
b) Low Penetration Price: Close to customary price- only minor adjustments required eventually.
• Objective of low penetration pricing is to keep off competition
Appropriate where:• Sales respond strongly to lower prices• High volumes lead to lower costs• Product acceptable for mass consumption• To capture a large share of market quickly
where there is a threat of potential competition

30
PRODUCT LIFE CYCLE PRICING
High Skimming price
Low penetration Price

31
PRODUCT LIFE CYCLE PRICING
ii) Rapid Growth- Stable price policy for sustained growth
iii) Maturity: Growth occurs at diminishing rate- firm may introduce minor quality changes with higher prices
iv) Saturation- Lower prices and discounts to clear stocks
v) Decline- Wind up

PRODUCT LIFE CYCLE PRICING
Product Bundling- Two or more products bundled together for a single price
Strategy for both new and mature/ declining product
Saves cost of spreading awareness
Captures part of consumer surplus
Regain customers during decline phase
TOI and ET32

PRODUCT LIFE CYCLE PRICING
Perceived Value pricing: Psychological pricing depending on consumer’s perception of utility- Tanishq jewelry, Parker pens etc-by creating a hype about high quality
Value pricing- variant of iv. Try to create high value and charge a low price ie., price charged is lower than perceived value e.g., heavy discounts
33
Product Life Cycle Pricing
Loss Leader Pricing: Here, multi product firms sell one product at a low price and compensate the loss by another product
Charge lower price for a good that is durable and has a high value but high price for the complementary, low value consumable (HP printers and cartridges)
34

VI.CYCLICAL PRICING
Rigid or flexible?• Rigid price means Firms selling a stable price
irrespective of the business cycle phase (Flexible pricing is meaningless for eatables etc where demand does not change with cycles; dangerous in case of durables as consumers will wait for the next recession to buy durables)
35

VII. MULTIPRODUCT PRICING
• Tata Sons produces steel as well as trucks and cars where steel is used as input
• Demand Interdependence: A firm can produce goods which are substitutes(Zen and wagon R) or complements.
• If substitutes, either price them the same(coke and Thums Up) or resort to perceived value pricing; or even, going price strategy
• One firm’s output may be another’s input
36

MULTIPRODUCT PRICING
Ramsay pricing
• A firm should fix the price close to the marginal cost for product which has high elasticity and charge substantial margins for products which have low elasticity.
Price deviations from marginal cost should be inversely proportional to the price elasticity of the product,
37

TRANSFER PRICING
Transfer Prices are the charges made when a company supplies goods, services, or financial services to its subsidiary or sister concern.
Globally, 60% of transactions are between associated companies. MNCs are required to set Transfer Prices for supply of goods, technical know-how, marketing rights etc from parent to subsidiary or one subsidiary to another.
38

TRANSFER PRICING
Govts keep strict watch on this in order to check tax evasion as companies try to reduce tax incidence globally by transferring higher income to low tax jurisdiction and higher expenditure to high tax countries
• In general regulatory authorities agree on “arms length price”- i.e., same price should be charged whether the transaction is between related or unrelated parties
39

40
VIII. PEAK LOAD PRICING
Peak Load Pricing
• Higher price at peak level of use and lower at slack time
Examples-
Electricity, telephone charges, air fares

41
IX. Administered Price
Administered Price
Originally associated with monopoly
- Now understood as Fixed by authorities
- Specific social objectives- social justice, correcting imbalances, price stability
-Conflict between ‘public utility approach’ and ‘rate of return’ approach

42
Guidelines for Price Fixing
Bates and Parkinson’s Guidelines for Price Fixing:
• Find out how your costs compare with your competitors’.
• Keep an eye on the market-if orders are difficult to come by, drop prices; if easy, raise.
• Goodwill of customers is probably gained more through advertising than keeping price low

43
• If you can sell all your output at prices that give you substantial profit, consider expanding production.
• If you find that your sales vary over seasons, adjust prices
• If your prices seem to be higher than those of your competitors although they scarcely cover costs, you may need to take a re-look at your production methods and organisational process

44
• If you are one of very few producers in the industry, what your competitors are likely to do may be a more important consideration in fixing prices rather than your costs.
• If you are a monopolist and follow a pricing policy that is seen as being against public interest, beware of government action and potential competition…

45

46
Capital Budgeting
Process of conceiving, analysing, evaluating, and selecting the most profitable project for investment.
Significant because
i) capital expenditure is generally irreversible
ii) survival of firm depends on how well planned the capital expenditure is.

47
Prerequisites/Steps in Capital Budgeting
1. Defining Capital Expenditure
Expenditure on acquiring assets which yield returns over a number of years
-Only long term expenditure involving a commitment of at least one year is taken into consideration.

48
Defining Capital Expenditure
Examples:– Expenditure on new capital equipment– Expenditure on long term assets by a new
firm– Expenditure on expansion or diversification of
assets and addition to stock by old firms– Expenditure on replacement of depreciated
capital– Expenditure on R&D and innovation

49
Deciding the Project Period
2. Deciding the Project Period
Determining the span of the project
A clear vision is required for-
a) Effective planning, execution and control;
b) For possible dovetailing of old plan with the new
c) Assessment of economies of scale and determination of plant size
d) Timely arranging of finances

50
Appraisal Criteria
3. Choice of Decision Rules/ Appraisal Criteria -Criteria for accepting or rejecting a project The first step is to clearly define the objective of
investment.Objective may be profit maximization, asset
building, regular cash flow or maximization of short term or long term gains etc.
Normally, criteria for accepting or rejecting is chosen on the basis of the objective of the firm.
.

51
Appraisal Criteria
The second step is to select the criterion for evaluating the projects.
The important criteria for evaluation are:
i) Pay back period
ii) Discounted cash flow (Present value criterion)
iii) IRR.

52
Choice of Decision Rules
Once the evaluation criterion is decided, the third step is to decide on the final selection of the projects.
There are 2 approaches for this -
a) Accept-reject approach
b) Ranking approach
53
Data
4. Relevant, Reliable and Adequate Data on-• Alternative avenues of investment• Cost of the projects• Expected returns from the projects,• Period of maturity and productive life of each
project • Market rate of interest • Availability of internal and external finances

54
i)Pay-back or pay-out method
Pay-back Period :
Time required to recover the total investment outlay from the cumulative net revenue.
In this period cumulative net revenue equals original investment.
Projects are ranked in increasing order of their pay-back period.
All other things being equal, a project with a shorter pay-off period is preferred.

55
Pay-back or pay-out method
Pay- back Period =
Total Investment Outlay/Return per period
If a project costs Rs. 40,000 and is expected to yield an annual income of Rs. 8000, then,
Pay-off period = 40,000/ 8,000
= 5 years

56
Pay-back or pay-out method
- In case inflows are not uniform, it is calculated by taking cumulative total of annual returns until the total equals the investment outlay.
- Simple and realistic method- Crude ‘rule of thumb’ method- But assumes that cash inflows are known with a
high degree of certainty- Neglects the profits over the whole life of the
investment and after the pay off period.

57
ii) NPV Criterion
Time lag between investment and its returns
-Time Value of Money: A Rupee received today is worth more than a Rupee received tomorrow , or present value of an income expected at a future date is lower than the same amount received today.

58
ii) NPV Criterion
The formula for dn (discount rate in the nth year) is given by,
Dn= 1/(1+r)n.
This means that the discount rate (d2) for an income receivable after 2 years will be 1/(1+r)2 and the discount rate (d3) for an income receivable after 3 years will be 1/(1+r)3. The discount rate (dn) for an income receivable after n years will be 1/(1+r)n,

59
ii) NPV Criterion
• Formula for calculating PV of an amount receivable in the nth year is,
• PV= Xn /(1+r)n.
• NPV is the difference between the present value PV of an income stream and the cost of investment, C.
NPV=PV-C

60
ii) NPV Criterion
Present value (PV) of an income of Rs.200 expected after one year at interest rate of 8% per annum (r=0.08) would be,PV=200(1/1+0.08)= 185.19. It means, the present value of Rs. 200 expected after one year is Rs. 185.19 at 8% interest.
61
iii) Internal Rate of Return (IRR) Criterion
• Also called Marginal Efficiency of investment or internal rate of project.
• If a one-year project costing Rs. 100 mn yields Rs. 120 mn at the end of one year, then the IRR is 20%
• IRR is the rate of return at which the discounted present value of receipts and expenditures are equal.
• As long as IRR >market rate of interest , it is worthwhile to borrow and invest.