
1 SELECTION AND IMPLEMENTATION OF NEW …m-n.marketing/downloads/conferences/ecic2016... · NEW...
47
1 SELECTION AND IMPLEMENTATION OF NEW IRONMAKING TECHNOLOGY: EXPERIENCE, PRINCIPLES AND RISK Hatch, 2800 Speakman Drive, Mississauga, Ontario. Canada ECIC- 2016, Linz, Austria Yakov Gordon and Sunil Kumar
Transcript of 1 SELECTION AND IMPLEMENTATION OF NEW …m-n.marketing/downloads/conferences/ecic2016... · NEW...

1
SELECTION AND IMPLEMENTATION OF NEW IRONMAKING TECHNOLOGY:
EXPERIENCE, PRINCIPLES AND RISK
Hatch, 2800 Speakman Drive, Mississauga, Ontario. Canada
ECIC- 2016, Linz, Austria
Yakov Gordon and Sunil Kumar

2
SELETION AND IMPLEMENTATION OF IRONMAKING TECHNOLOGY –
EXPERIENCE, PRINCIPLES AND RISKS
Hatch, 2800 Speakman Drive, Mississauga, Ontario. Canada
ECIC- 2016, Linz, Austria
Yakov Gordon and Sunil Kumar

3
• New Ironmaking Technologies and their implementation • Alternative Ironmaking – Variety of new processes and major features • Scale-up principles of pyro-metallurgical furnaces • Examples of Alternative ironmaking technologies scale-up history:
– Midrex ® – HYL-Energiron ® – Corex ® – RHF – ITmk3®
• Alternative Ironmaking technologies scale-up and ramp-up data • Risk and Benefits in course of new technologies implementation • Conclusions
Agenda

4
Vital Need, Driving Force and Risks Understanding for New Technologies Introduction to Iron & Steel Industry
• New technologies are vital to sustaining the viability of the I & S industry • Restructuring of the entire iron and steel industry in North America in the
seventies and eighties of last century is a prime example of this: – Wide implementation of the mini-mill concept dramatically improved the financial
performance of the industry and enabled of to compete against the flood of steel import from around the world
• The prime incentive for introducing new technology into Iron and Steel industry is one of economics:
– to produce a competitive product with increased profitability – to survive in the market place by producing a new product – environmental regulations or social issues
• Introduction of new technologies is a challenging task, fraught with risks. • This is especially important for the steel industry, which is characterized by:
– being capital intensive – having long lead times for project implementation – providing a low return on investment – being extremely competitive

5
The Process Phases of Implementing New Technologies
• The idea phase - conceptual studies are carried out, including any required scientific development
• The laboratory phase - small scale test work to test key technical assumptions • The pilot phase - integrated pilot scale test work to check scale-up factors and
the performance of the production system • Demonstration scale trials. These are often critical in the metallurgical industry
where a very large number of unknowns have to be managed and often the future of the owner company can ride on the outcome
• Implementation at commercial scale, which covers the period from a board decision to go ahead, through design and construction, training and start-up until the plant meets design capacity
• Achieving break even, followed by achieving planned project return on investment
• Typically only one in 3000 good ideas is successful • Only one in 100 make it from the pilot or prototype scale to commercial • Only one in 4 make it from the demonstration phase to commercial • Everybody in metallurgy would like to be the second when implementing
new technology!!!
6
Successful Management of Risk
• Questions to be asked: – Is there a need for this technology? (market information) – Do we have a process? (scientific information) – Can we scale up? (engineering information) – Are adequate equipment, materials and controls available? (engineering
information) – Do we have a viable business? (business information)
• From a management point of view it is critical to recognize and minimize the risks related to each step of the implementation process
• The implementation team should vary significantly at each step and the role and priorities of people on the teams are different at different stages
• Projects with external “entrepreneurial” capital are especially vulnerable, which leads to “overselling” at an early stage of development to raise the money to continue
• Without proper discipline imposed by the financier on how money is spent, assessment of the proposed development process, the staging, identification of the weaknesses and of the “Go, No-Go” decision points the development process and his money are at risk

7
Implementing Technology Status
• Type 1. Well demonstrated technology, commercially operating in a similar plant setting, at similar scale and supplied as part of a defined vendor or equipment supply package (Midrex or HYL processes)
• Type 2. Well demonstrated technology based on sound engineering principles developed or assembled on a case-by-case basis (titania -magnetite ore processing: NZS and Highveld)
• Type 3. Existing technology specifically adapted to a new circumstance or scale for the proposed project (RHF, Romelt)
• Type 4. New technology developed by others but to be implemented at commercial scale for the first time on the project (ITmk3)
• Type 5. New technology developed internally to be implemented on the project for the first time (HIsmelt)

8
Categories of Risk and Typical Factors of Failure of New Technology Implementation
• Categories of Risks: – Process, i.e. will the technology work at industrial scale? – Commercial, i.e., will the implementation of this technology make money? – Human risk – how might people reduce / increase the technological and financial risk?
• Typical Reasons for Failure: – Unknown or improper scale-up (science/engineering issue) – Cost pressures on inputs (business issue) – Poor engineering of pilot, demonstration or commercial plants (an engineering
issue or, if due to cost pressures – a management issues) – Poor fatal flaws analysis – Improper operator background and training (a management issue) – Unsuitable contractual arrangements (management issue) – Poorly timed market opportunities (a marketing issue)
• The focus of this presentation is on: • Process, i.e. will the technology work at industrial scale? • Unknown or improper scale-up • Poor engineering of pilot, demonstration or commercial plants

9
Fatal Flaws Examples in Scale-up Process
• Solid fuel based reduction of iron ores in a great SL/RN rotary kiln process, built in the early 1970s – During the process scale-up (3 times increase in rotary kiln diameter) the
efficiency of heat and mass transfer was overestimated – As a result, the kiln throughput was limited and the process become uneconomic – The plant was closed at substantial loss to the owner
• Iron Carbide process. – During the process development and scale-up the thermodynamics of iron
reduction and iron carburization processes was not properly addressed – Carburization by CH4 and reduction by H2 – are endothermic processes, which
reduce reactor temperature and decelerate reduction kinetics. – Reduction process requires higher temperature while carburization process by
CO gas requires lower temperature. – These processes were forced to work together in the same single fluidized bed
reactor – As a result, plant achieved only 40% of designed capacity, was shut-down and
demolished at significant loss to the owner

10
Alternative Ironmaking – Variety of New Processes
Natural Gas, Synthetic gas
Coal
Pellets, Sinter, Lump ore
Concentrate,Fine ore
Shaft Furnaces:MidrexHYL
Fluidized bed processes:Fior
CircoredFinmet
Blast Furnace Metallization + Smelter:
Rotary kilnsCorex
HIsmeltDirect Smelting:
Romelt
ITmk3, CircoferDirect Smelting:
Tecnored, RomeltOxyCup Cupola
Metallization + Smelting:Rotary kiln, Primus,
Finex; HIsmelt, FineSmelt, RHF, HISarna
All ironmaking processes could be presented in four quadrants depending on type of iron ore and reductant. Coal/concentrate quadrant accumulates the highest number of new technologies due to minimal requirements to raw material preparation. However, the dominant iron production stays with blast furnace in a forth quadrant

11
DR and Direct Smelting Processes - Major Features

12
Scale-up Principles for Industrial Metallurgical Furnaces
• Pilot plant furnaces and kilns typically operate under the same temperature, chemical and physical conditions expected in the full-scale plant
• The objective is to maintain similarity between pilot- and full-scale processes, i.e., identical similarity numbers, temperatures, raw materials and product composition, heat fluxes etc. at corresponding points and times
• Consequently, even though kinetics (reaction time) will be of the same order, kinematic similarity may have to be sacrificed (attempts to scale velocities may yield unreasonably high, or low, velocities either in pilot- or commercial)
• Heat and mass transfer are the most critical parameters to the successful scale-up of high-temperature processes. Similarity in heat and mass transfer should be maintained or improved
• For a cylindrical type furnace the increase in diameter is the critical scale-up factor
• For a rectangular or rotary hearth furnace the critical scale-up factor is an increase in width. Similarity of distribution along the furnace periphery is provided by installation of additional burners, off-takes, ejectors etc.

13
Metallurgical Furnaces and Kilns Scale-up Examples
• HATCH’s analysis, coupled with experience with the scaling of other direct reduction processes and direct smelting processes, shows that the scale-up factor should not exceed 5-8 times – 5-8 times increase in the furnace diameter for Midrex and HYL direct reduction
shaft furnaces with further diameter increase in the following stages – ~ 5 times increase in the hearth width for RHF processes – 2.2 times increase in SL/RN rotary kiln diameter and 5 times increase in a furnace
cross-section – 2 times increase in Corex Smelter-Gasifier diameter – Scale-up factors of the HIsmelt process is 2.4-fold in smelting reduction vessel
diameter and 5-fold increase in furnace area compared to pilot-scale – Romelt process is scaled-up by 2.5 times increase in the hearth area (width) – 3.85 times increase in hearth diameter for Primus process – ITmk3 process effective width is increased by 3.85 times
14
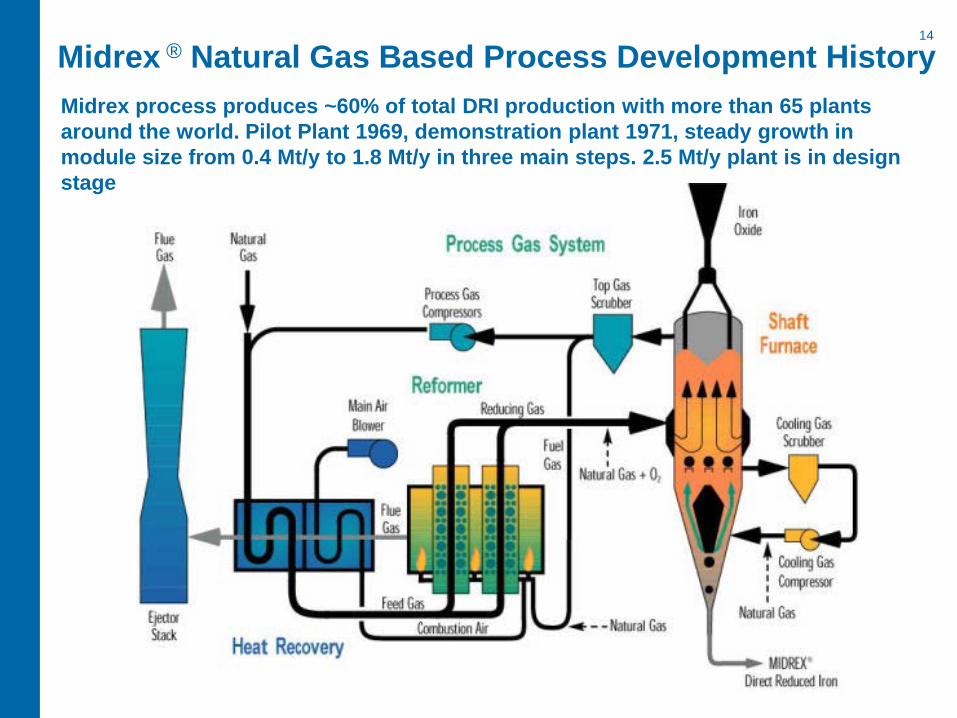
Midrex process produces ~60% of total DRI production with more than 65 plants around the world. Pilot Plant 1969, demonstration plant 1971, steady growth in module size from 0.4 Mt/y to 1.8 Mt/y in three main steps. 2.5 Mt/y plant is in design stage
Midrex ® Natural Gas Based Process Development History

15
Midrex ® NG based process development history (cont’d)
1946 – Surface Combustion Company, built electrically heated vertical furnace 4 ft. diameter, 6 ft tall (Midland-Ross bought Surface Combustion Company in 1959)
1967 - Toledo, Ohio pilot plant (basis for Portland), 1.5 ft. diameter shaft furnace, 2-8 inch diameter full sized reformer tubes, 0.223 tph. Operated one month using low S ore 1969 Start up Oregon plant 2 modules 12 ft. diameter shaft furnace, each reformer
with 120 – 8 inch diameter reformer tubes, 26 tph, 220,000 tpa – problems with high sulfur pellets resulted in loss of reforming capacity due to H2S in off gas.
Desulfurization towers added to flowsheet to limit sulfur in off gas. – hooked two reformers together to feed one shaft furnace. Demonstrated 28 LTPH production. – Had problems with overheating and clustering in the shaft furnace, added natural gas to bustle
gas to get overheating and clustering under control
1970 back to one reformer per shaft furnace, Tonnage 16 to 18 LTPH 1971 replaced 8 inch reformer tube with10 inch reformer tube, Plant rerated to 20 LTPH
Two years after startup plant stabilized at 75% of initial design capacity 1971 Georgetown Steel plant starts up, initial design with 160 reformer tubes,
420,000 tpa, struggled with production, later increased reformer tubes to 200 From 1971 – success story: numerous plants; start-up period in many cases – 14 days; some plants achieve 80-100 % production increase above capacity!

16
HYL Natural Gas based is a well established process with 30 installations around the world. Process has under gone change from batch, to continuous process HYL III and in 1998 the commercialization zero reforming (ZR) technology. Nucor constructing worlds largest single vessel HYL/Energiron ZR plant at 2.5 Mtpa.
HYL® Natural Gas Based Process Development History
FUELNATURAL
GAS
REDUCING GASCOMPRESSOR
H2O
COOLINGNATURAL
GAS
COLD DRI
IRON ORE
COOLING GASCOMPRESSOR
REACTORHYL III
OXYGEN
H2O
CO2REMOVALSYSTEM
QUENCHTOWER
QUENCHTOWER
TAIL GAS
PROCESSNATURAL
GAS
Humidifier
Heat Recuperator
FUELNATURAL
GAS
REDUCING GASCOMPRESSOR
H2O
COOLINGNATURAL
GAS
COLD DRI
IRON ORE
COOLING GASCOMPRESSOR
REACTORHYL III
OXYGEN
H2O
CO2REMOVALSYSTEM
QUENCHTOWER
QUENCHTOWER
TAIL GAS
PROCESSNATURAL
GAS
Humidifier
Heat Recuperator
HBI
HITEMP

17
1950 – Lab tests in steel tubes using coke breeze, ore and limestone. Produced 20 kg of DRI/test. Produced a total of 3,000 kg using this method
1952 – Based on promising results, a large tunnel furnace, operating with a modified Hoganas process was started, had 48 cars, took 44 hrs processing. Plant shut down in 1954 due to high operating costs
1954 – Started 50 tpd plant using Madaras process, a natural gas based batch reduction, a process which was initially tested in the 1930’s. Plant operated 18 months, modified by adding natural gas reformer, then shut down due to failing to achieve acceptable levels of metallization
1955 – Started Research on gas based direct reduction, constructed a pilot plant using single vessel 0.9 m in diameter and 2.7 m in height. Initial production rate was 6 tpd, with a single vessel, later it increased to almost 15 tpd
1957 – Started up HYL I plant, plant has four reactors, cycled through process. Design rate was 230 tpd, with two natural gas reformers. Plant achieved rated capacity in 3-4 months, typical performance 110% of capacity
Plant achieves rated capacity with in 4 months of start-up. While plant achieved design capacity in a few months, HYL had operated two other DRI plants commercially prior to the HYL I plant. The batch Madaras DRI process, a natural gas based process operated for 18 months, provided critical experience to the HYL team
HYL I Natural Gas Based Process Development History

18
1967– Started to develop improved fixed bed reactor, HYL II, modeled and tested in pilot plant but work superseded by HYL III continuous process
1977– Started HYL III pilot plant, able to use reformed gas from operating HYL I plants. production rate 1 t/h 1979– Started up HYL III 2M5 plant 20 tph. Solids flow erratic, at times preferential center
flow. Plant shutdown, reactor modified and restarted 6 months later 1980– Plant achieved rated capacity in 2 weeks, exceeded design capacity after 1 month
and produced at 25 tph. Plant now rated 29 tph, 250,000 tpa, peak 44 tph.
HYL III process achieves nominal capacity in 1.5 years 1981– Pilot plant testing of CO2 removal on the HYL III process 1984 – Pilot Plant testing of HYL process without a natural gas reformer, Zero Reformer,
or ZR process. Again using the same 1.0 tph pilot plant reactor 1998 – Started up 80 tph ZR process M4 plant. Plant reached nominal capacity in 2
weeks. Plant has achieved sustained production rates at109 tph
ZR process achieves nominal capacity in two weeks. Two weeks to achieve design capacity for such a major change is extremely short. The extensive pilot plant testing(14 years from initial pilot plant to commercial plant), combined with 40 years of operational experience are important factors with this very short ramp up
HYL III and HYL ZR NG Based Processes Development

19
Corex® process is coal based two stage reduction smelting process. The first stage is direct reduction of iron oxides in Midrex furnace. The second stage is a melter-gasifier, where DRI are completely metalized, melted, carburized and reducing gas is produced.
Corex® Process Development History - Flowsheet

20
Corex® Process Development History
1978 - Melter Gasifier (MG) pilot plant 0.76 m hearth to 1.0 m upper diameter 1981 - Demonstration Plant 60,000 tpa, MG 3.5 to 5 m diameter, 12 tuyere
1981-1987 – plant ran 6,000 hrs, 10 campaigns, key developments are: dust recycling, burner system, screw discharge
1987 - Iscor, SA. 1st Corex 1000 plant of 300,000 tpa, MG 5.5 to 10 m diameter, 20 tuyeres. 1987 - 1st Campaign 6 days, burned hole in shell, numerous mechanical/
instrumentation stoppages 1988 - 2nd Campaign 6 months, got to 2/3 of capacity, then lost to 1/3. Issues with ore
type, cyclones and trough refractories. Tried numerous fixes, no success. Failure of DRI screw feeder stopped the campaign
1989 - 3rd Campaign started after 8 months of repairs and re-design – Cyclones redesigned – Chinese hats replaced & modified – modeled shaft at 1/5 scale for dust flow, develop operating techniques – Added particle screen to control size on entry to the shaft – modified reduction gas lines, refractories and burners – “it was obvious a total transformation had taken place”
Plant achieved 100% of design capacity in September 1990, about 2.75 years after starting up

21
Rotary Hearth + Smelter production process operates at Inmetco, IDI and in Italy. Stand alone Rotary Hearth furnaces operate in Japan, Korea and China for waste materials processing to DRI. Cold bonded pellets/briquettes using finely ground coal, concentrate and binder are fed on hearth floor. Reduction is complete in 12-15 minutes.
Rotary Hearth Furnace Development History - Flowsheet

22
Rotary Hearth process goes back to mid 1960’s with Midrex® developing Heat Fast® process. In 1990’s the Fastmet ® process was developed and brought into commercial operation in 2000. Other rotary hearth’s developed by Inco, IDI, NSC and Paul Wurth.
Rotary Hearth Furnace Development History
• Heat Fast®
– 1963 – Bench scale test work – 1964 – Lab Simulation at 200 to 300 tph done as a batch process – 1965 – Cooley Pilot plant built 6 m diameter, 2.4 m hearth with 8 tph production rate – 1968 – National Fast Heat plant built, two modules, 36.6 m diameter, 12.2 m hearth width – Design 150 tph/unit. Shutdown after 2 years, numerous mechanical and process problems
– Two years operation, massive 35 times scale-up in production, shutdown • Fastmet®
1981 – Two years of lab and pilot testing 2.7 m diameter rotary hearth. Stopped - recession – 1990 – Research restarted to look at Fastmet® process, computer modeling, bench scale – 1992 – Pilot Plant restarted, over 100 runs on 2.7 m diameter rotary hearth, 160 kg/hr – 1995 – Start running demonstration plant, 8.5 m diameter, 2.5 tph, 20,000 tpa Kobe Steel – 2000 – Start up of commercial plant, 21.5 m diameter, 190,000 tpa BOF Dust/sludge
– Successful start-up, achieved design production in 5 months
23
Rotary Hearth Furnace Development History (cont’d)
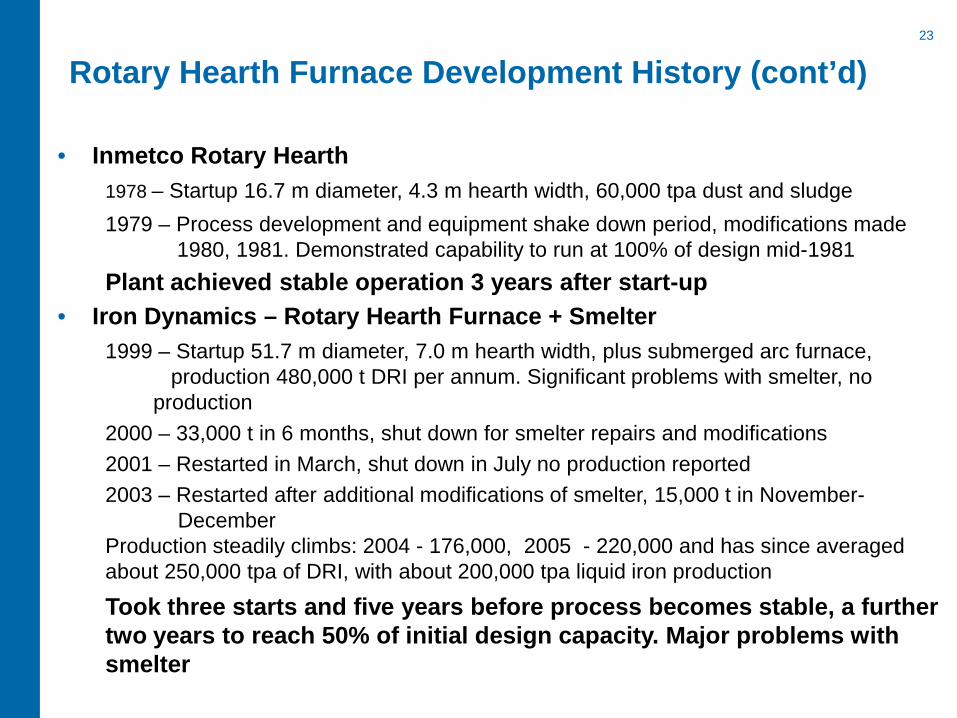
• Inmetco Rotary Hearth 1978 – Startup 16.7 m diameter, 4.3 m hearth width, 60,000 tpa dust and sludge 1979 – Process development and equipment shake down period, modifications made
1980, 1981. Demonstrated capability to run at 100% of design mid-1981 Plant achieved stable operation 3 years after start-up
• Iron Dynamics – Rotary Hearth Furnace + Smelter 1999 – Startup 51.7 m diameter, 7.0 m hearth width, plus submerged arc furnace,
production 480,000 t DRI per annum. Significant problems with smelter, no production
2000 – 33,000 t in 6 months, shut down for smelter repairs and modifications 2001 – Restarted in March, shut down in July no production reported 2003 – Restarted after additional modifications of smelter, 15,000 t in November- December Production steadily climbs: 2004 - 176,000, 2005 - 220,000 and has since averaged about 250,000 tpa of DRI, with about 200,000 tpa liquid iron production
Took three starts and five years before process becomes stable, a further two years to reach 50% of initial design capacity. Major problems with smelter

24
ITmk3® - Process Development - Flowsheet
Fast Met
1995 - 2000
Heat Fast
1965-1968
ITmk3® - Iron Technology Mark 3, is a logical development of RHF process. ITmk3® plant incorporates four major process areas: raw material handling and balling; RHF itself, material cooling and separation, off-gas system

25
ITmk3® - Process History • 1995 - Kobe Steel while doing an RHF experiment at elevated above usual
temperature, found that DRI could be melted and separated to pig iron droplet – nugget and slag
• 1996 – Study of the discovery in the lab, developing the ITmk3 process • 1998 – ITmk3 nuggets made on Midrex pilot RHF with 2.7 m diameter hearth • 1999 – Pilot Plant with a 3.0 m diameter hearth, 0.8 m effective width and
0.35 tph productivity started up in Kakogawa Steel Works. Plant operated for 15 months. The longest of 3 campaigns, included 21 days of continuous operation
• 2003 – Pilot Demonstration Plant (PDP) at Silver Bay, Minnesota, USA, operated from May 2003 to August 2004. The hearth diameter was 11.28 m, effective width – 2 m, 3 t/h of nuggets per hour productivity and 25,000 t/year capacity. The longest of 4 campaigns was 81 days and plant availability of 93% was achieved. 9,000 t of good quality nuggets were produced and tested in three EAF in USA
• 2009, December, Mesabi Nugget - first large scale industrial plant (LSP) with 60 m diameter RHF and 7.6 m effective width was commissioned and started operation. The designed production rate is 62.5 tph and designed capacity is 500,000 tpa

26
ITmk3® RHF Scale-up
Plant Start-up
Hearth ID diameter, m/ capacity, tpa
Effective width, m
Effective hearth area (EHA), m2
Specific productivity,
Kg/m2/h
Width Scale-up factor
Kakogawa Pilot Plant (KPP). October 1999 -December 2000
3.28 m / 3,000 tpa
0.8 2.0 (Only 1/3 of
EHA was used)
27.6
Pilot Demonstration Plant (PDP), May 2003 – August 2004
11.28 m / 25,000 tpa
1.98 47 56.8 PDP/KPP 2.5
Mesabi Nugget Large Scale Plant (LSP), Fall 2009.
60 m / 500,000 tpa
7.63 1,200 56.8 LSP/PDP 3.85
Iron Dynamics 43.28 m / 500,000 tpa
7.0 850 43.2 Reference
Hearth width is a critical parameter for scale-up. The scale-up factor of 3.85 from PDP to LSP is reasonable and is within the acceptable scale-up factor boundaries. The RHF scale- up from IDI to LSP is less than 10% in effective hearth width.

27
ITmk3® - Mesabi Nugget Ramp-up History
• 2009, December, Mesabi Nugget Large Scale Plant (LSP) start-up. • 2010 Production:
– Q1 - 7,200 t; Q2 - 17,200 t; – Q3 - 24,600 t (Progress made, however - productivity continued to be hampered by
equipment availability and refractory issues) – Q4 - 18,000 t (Planned shutdown taken to address productivity issues)
• 2011 – Production: – Q1 36,000 – Marked improvement following planned shutdown; – Q2 38,000 – April reported at 16,000 t – Q3 33,000 – Planned 3 week stop taken in September to improve utilization – Q4 52,943 – Planned shutdown for maintenance.
• 2014 fourth quarter - 96,000 t nugget wit magnetation concentrate • Like many new technology start-ups Mesabi Nugget struggled especially the
first year. Purchase of used, less robust equipment and operation with poor burden containing waste materials, contributed to the slow start-up.
• Specific issues have included: frozen material, conveyor failures, drive system failures, water leaks and refractory failures.

28
ITmk3® - Mesabi Nugget Ramp-up History (cont-d)
• Operating with designed quality burden plant demonstrated 70% capacity with good quality product and 90+ % availability on bi-weekly basis
• The maximum weekly production of 80% of designed capacity was also demonstrated, with a good quality product
• However, quality was not sustained when productivity raised to 88% of designed value. Typical capacity is at 70%
• The ramp-up period for new ironmaking technologies varies from 2 to 5 years, typically of about 3 years
• It is reasonable to expect that after recent improvements it will demonstrate ~70% designed capacity in 2012, guaranteed fuel consumption and other operating parameters
• Mesabi Nugget ITmk3 plant is at the end of the third year of commissioning and is passing through the conventional ramp-up experience

29
Process Scale-up 1st Plant Capacity 1st Plant Capacity Current Max MMtpa
Ramp-up, years
Number of operating units
Comments
Critical parameter
Capacity Designed MMtpa
Achieved MMtpa
ITmk3 3.85 20 0.5 0.4 0.4 >4 1 By-weekly basis
Inmetco 0.06 0.06 0.06 3 1 Feed charge capacity
IDI 0.48 0.25 0.25 5 1 Off-gas system capacity
Fastmet 9.5 0.19 0.19 0.19 0.4 5 Feed charge capacity
SL/RN 2 6 0.2 0.2 0.20 3 multiple Diameter <4.8 m
Corex 1.6-2 5 0.3 0.3 1.50 3 6
Finmet 0.55 0.5 0.5 5 1 Campaign basis
Finex 1.6-2 11 0.6 0.6 1.50 0.4 2
Midrex 8 120 0.22 0.17 1.76 2 >65
HYL I 9 0.075 0.075 1.1 2 14 3 operating now
HYL III 4.5 22 0.2 0.25 1.60 1 >22 Including 3 HYL ZR
Primus 3.85 4.7 0.06 0.06 0.125 2 Feed charge capacity
Hismelt 2.4 8 0.8 0.43 0.0 >6 Monthly basis. Shutdown
Commercial Plants’ Scale-up and Ramp-up Experience
The ramp-up period for varies from 2 to 5 years, typically of about 3 years

30
Process Summary – Pilot/Demonstration and Failed Commercial Plants
Scale Up Capacity # of
Operating Plants
Process Step
Critical Parametr. Prod
Design Mtpa
Achieved Mtpa
Ramp up Yrs Comments
Tecnored Demo Plant 0.075 1 Under development
Romelt Pilot Plant 0.50 0 Successful – 100%
Heat Fast Pilot Plant 8 .068 0.068 1 0 Successful – 100%
Heat Fast Commercial 5.0 17 1.20 n/a 0 Unsuccessful, numerous problems. Shutdown after 2 years.
SLRN Commercial 3 11 0.40 0.26 Unsuccessful – shutdown, 6.0 m
Hismelt Pilot Plant 0.10 0.10 Successful – 100%
Hismelt Commercial 2.4 8 0.80 0.43 5 0 Unsuccessful, numerous problems. Shutdown after 5 years. New development starts in China
Ausiron Pilot Plant 0.17 0.14 Unsuccessful
Iron Carbide
Commercial 0.3 0.12 0 Unsucsessful

31
The Stakeholder Risk and Rewards at Implementation of New Technologies
The main groups of stakeholders in the total process from idea to commercial success are: • The owner/operator • The inventor/researcher • The engineer/constructor • Equipment suppliers • Financiers (internal or external)

32
Distribution of Costs and Benefits in a Typical New Technology Project
Project cost, %
Operating cost benefits,
%
Distribution of project
benefits, %
Cost as % of life
Cycle cost Research and Development 0-10 0 0-5 <1
Engineering, Project and Construction Management
5-15 0 0 <2
Equipment Suppliers 30-40 0 0 <3
Construction Contractors 30-40 0 0 <3
Owner (financier)/operator (100) 100 95-100 >91
33
Distribution of Costs and Benefits in a Typical New Technology Project (cont’d)
• It is the project owner who reaps the bulk of the rewards of successful project implementation, but at the same time carries the entire project risk
• It is the owner’s role to lead the project. Ultimately the risk is entirely on his shoulders and it his responsibility to be equipped properly to handle it
• The contractors and suppliers as a group are generally not big beneficiaries in a project context
• The cost of the design engineers and researchers is an insignificant part of the project life cycle cost but, if underfunded, can put the project in jeopardy
• Doubling the input at this stage barely affects the lifecycle cost and can dramatically increase the lifecycle revenue or ROI
• The project should be structured so that the financial rewards match the risks • The owner must have unimpeded direct access to the best people available
from the technology developer, outside experts or his own staff • The contractual obligations must be matched and supported by the real
expertise

34
Two Stage Methodology Applied in Analyses
First stage: evaluation of all available ironmaking technologies and selection of the best technology. The second stage: performed a detailed financial analysis to select the best technology and determine the economic viability Evaluation Completed in Two Stages
1. Filtering technologies:
• High level flowsheet
• High level/mass & energy balance
• Risk Analysis
• Payback
2. Detailed assessment:
• Functional design specification
• Block flow process diagram
• Detailed project viability analysis

35 Performance Parameters: 1.6 MM tonne/year Capacity, I&S Works location
ITmk3, shaft furnaces with natural gas based shaft furnaces perform well, as do the rotary hearth technologies.
Technology BF Midrex & Coal
HYL & Coal
Midrex & Gas
HYL & Gas
Corex RK RK & Smelter
Typical capacity, MM t/year
> 1 1.6 1.6 1.6 1.6 1.5 0.2 0.2 RK 0.8 Sm
Number of units 1 1 1 1 1 1 8 8RK/2Sm
Pellets, t/t 1.53 1.45 1.44 1..43 1.42 1.5 1.48 1.54
Coke, kg/t 367
Coal, kg/t 160 430 390 914 650 776
Natural Gas, GJ/t 9.2 9.2
Oxygen, Nm3/t 94 245 280 16 16 670 10 10
Electricity, kWh/t 150 150 95 105 60 401 100 634
Power produced, kWh/t 400 834 572 627
Capital cost, MM $/Rank 759/6 842/8 851/9 432/1-2 432/1-2 1075/13 619/3 868/10
Operating Cost. $/t/Rank 371/15 262/10 250/8 224/6-7 222/6-7 289/13 219/5 270/12
Payback, years/Rank 20/15 12/13-14 12/13-14 3/1-4 3/1-4 9/11 5/6-9 5/6-9

36 Performance Parameters: 1.6 MM tonne/y, I & S Works Location
ITmk3, shaft furnaces with natural gas based shaft furnaces perform well, as do the rotary hearth technologies.
Technology Tecnored HIsmelt Romelt Finex ITmk3 RH RH & Smelter
Typical capacity, MM t/year
0.7 0.8 0.6 1.5 0.5 (0.55 designed)
0.6 0.6 RK 0.8 Sm
Number of units 2 2 3 1 3 3 3RK/2Sm
Concentrate, t/t 1.4 1.46 1.45 1.5 1.45 1.32 1.47
Coal, kg/t 807 850 914 853 498 381 350
Natural Gas, GJ/t 5 4.9 5.1
Oxygen, Nm3/t 250 873 623 670 10 10
Electricity, kWh/t 160 333 75 478 200 200 847
Power produced, kWh/t 810 187 1273 449
Capital cost, MM $/Rank 963/12 692/5 1160/14 1370/15 818/7 664/4 900/11
Operating Cost. $/t/Rank 174/1 289/14 196/3 266/11 218/4 183/2 253/9
Payback, years/Rank 3/1-3 11/12 5/6-9 8/10 3/1-4 4/4-5 5/6-9

37 Selection of the Competing Technologies (cont-d)
• The ITmk3 process, and HYL natural gas based shaft furnace direct reduction
technology have similar pay back periods of 3 years and are the winners of the first stage selection process.
• Midrex natural gas based DRI technology could also be considered as a winner with a payback period of 4 years.
• Natural Gas based DRI/HBI technologies could be considered only for I & S Works or IZ location and only for 1.6 MTPA capacity due to natural gas supply limitations.
• Aside from the HYL natural gas based (Midrex) and the ITmk3 process, the Rotary Hearth and Smelter combination may present a suitable alternative. This technology could be also considered as a back up technology for ITmk3 process, which could be easily converted to Rotary Hearth Furnace for HDRI production.
ITmk3 process, Rotary Hearth +Smelter combination and HYL/Midrex gas based technology were selected for the Stage 2 of technology evaluation. The final decision on the selection of the ITmk3 technology should be made after the first commercial plant - Mesabi Nugget in USA proven to be successful.

38 Performance Parameters: 1.6 MM tonne/y, I & S Works Location
ITmk3, shaft furnaces with natural gas based shaft furnaces perform well, as do the rotary hearth technologies.
Technology Tecnored HIsmelt Romelt Finex ITmk3 RH RH & Smelter
Typical capacity, MM t/year
0.7 0.8 0.6 1.5 0.5 (0.55 designed)
0.6 0.6 RK 0.8 Sm
Number of units 2 2 3 1 3 3 3RK/2Sm
Concentrate, t/t 1.4 1.46 1.45 1.5 1.45 1.32 1.47
Coal, kg/t 807 850 914 853 498 381 350
Natural Gas, GJ/t 5 4.9 5.1
Oxygen, Nm3/t 250 873 623 670 10 10
Electricity, kWh/t 160 333 75 478 200 200 847
Power produced, kWh/t 810 187 1273 449
Capital cost, MM $/Rank 963/12 692/5 1160/14 1370/15 818/7 664/4 900/11
Operating Cost. $/t/Rank 174/1 289/14 196/3 266/11 218/4 183/2 253/9
Payback, years/Rank 3/1-3 11/12 5/6-9 8/10 3/1-4 4/4-5 5/6-9
Kostamuksha Concentrate, 1.6 MTPA CapacityOperating hours 8000
Dust 0.03 MTPAIron ore, wet 2.56 MTPA 0.019 t/t nugget
1.60 t/t nugget Natural Gas 8,000 TJ/year 2 tph320 tph 5.00 GJ/t nugget
Moisture 9.1 %Primary Combustion air 1,463 Nm3/t nugget RHF off -gas 5,096 Nm3/t nugget
Limestone, Dolomite, Flurospar, wet 0.39 MTPA 292,600 Nm3/hr 1,019,200 Nm3/hr0.24 t/t nugget Temperature 570 deg C 1450 deg C
49 tphMoisture 0.00 % Secondary Combustion air 3,024 Nm3/t nugget
604,800 Nm3/hrCoal (Reductant + Hearth), wet 0.88 MTPA Temperature 570 deg C
0.55 t/t nugget Nuggets + Slag 2.03 MTPA111 tph Power 20 MW/year Nuggets + Slag 1.27 t/t nugget
Moisture 10.00 % 100 kWh/t nugget 159 tphTemperature 1100 deg C
Binder consumption 0.03 MTPA Dryer Feed 3.87 MTPA0.02 t/t nugget 483 tph
4 tphMoisture 0.00 %
Power 10 MW/year50 kWh/t nugget
Power 6 MW/year30 kWh/t nugget Power Output 107 MW/yr
536 kwh/t nugget
Nuggets + Slag 2.03 MTPANuggets + Slag 1.27 t/t nugget
159 tphPellets 2.75 MTPA Temperature 200 deg C
2.06 t/t nugget344 tph
Slag 0.43 MTPAPower 4 MW/year 0.270 t/t nugget
20 kWh/t nugget 34 tph
Total Nuggets 1.6 MTPAOn Spec Nuggets 1.55 MTPA
194 tphUndersized Nuggets 0.048 MTPA
6 tph
Pellet Plant
ITmk3 Dryer
ITmK3 RHF
Cooler
Magnetic Separation and Screening
Power Plant

39
Capital Cost for 1.6 million tonne Plant ($ millions)
Midrex and HYL are the lowest capital cost technologies , following by ITmk3 and Rotary Hearth furnace + Smelter.
Site I & S Works IZ, City 1, City 2, City 3
Mine
Capital Cost Breakdown
ITmk3 RH+Smelter Midrex/HYL
ITmk3 RH+Smelter ITmk3 RH+Smelter
Material Handling 55 55 45 55 55 55 55
Equipment 304 338 154 304 338 304 338
Materials 152 169 77 152 169 152 169
Labor 80 89 41 80 89 80 89
Water Pumping 2 2 2 2
Infrastructure 118.6 130.6 118.6 130.6
Indirect Spendings 227 249.5 115 226 249.7 226 249.7
Power Plant - 92 384.1
Total 818 900.5 432 937.6 1033.3 1029.6 1417.4

40 IRR for Four Best Technologies as a Function of Capital Cost
IRR for ITmk3 (2.6 и 1.6 MMt/y) plants are 20.3% and 19,7%, respectively, while for RH + Smelter are 18.5% и 15.6%. Midrex/HYL HBI plant has the lowest IRR – 11 %.
20.3%19.7%
18.5%
15.6%
11.0%
17.0%16.4%
15.4%
12.9%
8.9%
14.4%13.9%
13.0%
10.8%
7.1%
0%
5%
10%
15%
20%
25%
ITmk3 Client site/Pellets A
2.6 mtpy
ITmk3 Client site/Pellets A
1.6 mtpy
RHF+Smelter Client site/Pellets A
2.6 mtpy
RHF+Smelter Client site/Pellets A
1.6 mtpy
HYL/Midrex NGClient site/Pellets B
1.6 mtpy
IRR Base Case
+ 15% CAPEX
+ 30% CAPEX
ITmk3 remains viable even at 30% capital cost increase with IRR of 14.4% and 13.9% for 2.6 and 1.6 MM t plants. RHF+Smelter combination for 2.6 MM t plant remains viable at 15% capital cost increase, while at 30% becomes non-viable.
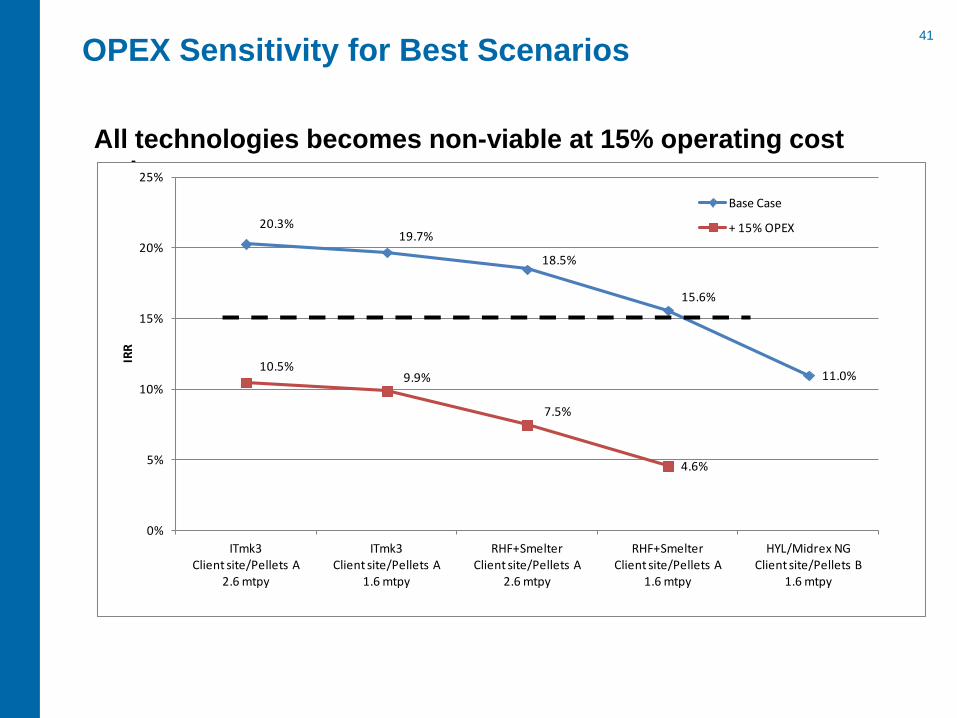
41 OPEX Sensitivity for Best Scenarios
All technologies becomes non-viable at 15% operating cost increase.
20.3%19.7%
18.5%
15.6%
11.0%10.5%
9.9%
7.5%
4.6%
0%
5%
10%
15%
20%
25%
ITmk3 Client site/Pellets A
2.6 mtpy
ITmk3 Client site/Pellets A
1.6 mtpy
RHF+Smelter Client site/Pellets A
2.6 mtpy
RHF+Smelter Client site/Pellets A
1.6 mtpy
HYL/Midrex NGClient site/Pellets B
1.6 mtpy
IRR
Base Case
+ 15% OPEX

42 Sensitivity to Selling Price
All technologies are very sensitive to the selling price. A 15% reduction in selling price makes all technologies not viable. A 15% increase in selling price increases IRR by 70-90% for ITmk3 and RHF+Smelter and by 3 times for HYL/Midrex processes.
20.3% 19.7%18.5%
15.6%
11.0%
36.2% 34.4% 34.1%
30.1%33.3%
53.4% 52.1% 53.1%47.3%
62.5%
6.2% 5.7%3.2% 0.4%
0%
10%
20%
30%
40%
50%
60%
70%
ITmk3 Client site/Pellets A
2.6 mtpy
ITmk3 Client site/Pellets A
1.6 mtpy
RHF+Smelter Client site/Pellets A
2.6 mtpy
RHF+Smelter Client site/Pellets A
1.6 mtpy
HYL/Midrex NGClient site/Pellets B
1.6 mtpy
IRR
Base Case
+ 15% Selling price
+ 30% Selling price
- 15% Selling price

43 ITmk3 Simultaneous Sensitivity to CAPEX and Selling Price 30% increase in ITmk3 CAPEX lowers its IRR below RHF+Smelter to 13.9 - 14.4%. A 13% increase in nuggets selling price equal to pig iron price increases IRR by 63% up to ~ 33%. Simultaneous increase by 30% in CAPEX and 13% in selling price only for ITmk3 makes IRR 3.7% higher than for base case of 24%. •
20.3% 19.7%18.5%
15.6%
11.0%
33.1% 32.5%
14.4% 13.9%
24.0%23.0%
0%
5%
10%
15%
20%
25%
30%
35%
ITmk3 Client site/Pellets A
2.6 mtpy
ITmk3 Client site/Pellets A
1.6 mtpy
RHF+Smelter Client site/Pellets A
2.6 mtpy
RHF+Smelter Client site/Pellets A
1.6 mtpy
HYL/Midrex NGClient site/Pellets B
1.6 mtpy
IRR
Base Case
+ 13% Selling Price ITmk3 only
+ 30% CAPEX ITmk3 only
+ 30% CAPEX and +13% Selling Price ITmk3 only

44
Conclusions
• In order to sustain and enhance its viability the Iron and Steel industry must continuously modernize through the implementation of new technologies. This inherently involves risks
• Unknown or improper scale-up and poor engineering of pilot, demonstration or commercial plants are the major reasons for long ramp-up period or complete failure of new technology
• The scale-up of the critical parameter for a new ironmaking technology is in the range of 2 to 8 times
• The ramp-up period for new ironmaking technologies varies from 2- 5 years, typically of about 3 years
• With proper project management and technology scale-up the “No-Go” decision of the management team on project continuation or technology failure would be premature and non-justified within the 5 year ramp-up period if no fatal flaws were discovered
45
Conclusions (cont-d)
• The major risks of introducing new technologies are ultimately incurred by the owner/operator.
• The owner /operator must develop the appropriate risk management program and to mobilize the required resources
• An essential element of a successful risk management program is the understanding of the distinct phases involved in implementing new technologies and the rigorous evaluation of the development at each project milestone
• Attempts to skip project phases or to transfer responsibility for risks to other parties for whatever reason (for instance perceived cost or schedule pressures) often lead to project failure
• The enlightened management with a properly structured risk management program can successfully introduce new technologies and maintain a viable modern steel industry
• Methodology for selection of new ironmaking technology for specific client conditions was developed and implemented.

46
With Special thanks to Mr. Ian Cameron, Dr. Chris Twigge-
Molecey, Dr. Frank Wheeler of Hatch, and our colleagues from Midrex, HYL, Kobe etc., who helped to collect and analyze the information and prepare this paper
Acknowledgement