
1. Results Summary 2. Background
15
TECHNICAL MEMORANDUM 1 To: Management California Production Services, LLC. 5790 Rocky Canyon Road Creston, 93432 California Date: 07/16/2019 From: Paul Henderson, CPEng Ref: Subject: Water Demand Estimate for California Production Services – Rocky Canyon Project 1. Results Summary The proposed cannabis cultivation at the 5790 Rocky Canyon Road, Creston, CA property has the following estimated water volumes: • Proposed annual water usage of 1,467,343 gal/year (4.5 acre.feet/year), for irrigation • Previous annual water usage of 258,394 (0.79 acre.feet/year), which is no longer used and therefore considered as water offset. 2. Background California Production Services has engaged Paul Henderson, Environmental Engineer, to provide a water demand estimate for the proposed cannabis cultivation at the 5790 Rocky Canyon Road property, located in Creston, within San Luis Obispo County (the County). California Production Services has requested this water demand estimate to satisfy the requirements of the County Cannabis Land Use Ordinance No. 3358. The proposed project is within the Paso Robles Groundwater Basin (PRGWB), Creston Sub-Area. The PRGWB is classified as a Level of Severity (LOS) III basin. The County requires: a. An estimate of existing total water demand prior to cannabis-related activities onsite; b. An estimate of total water demand of the proposed project; c. A detailed description of how the new water demand would be offset; and d. An assessment of the proposed water source’s ability to support the proposed project. Listed below are the general specifications of the proposed cultivation, which relate to this water demand estimate: 1. Total canopy area of Hoophouse: 130,680 sf (100% of structure area) 2. Total canopy area of Greenhouse: 22,000 sf (100% of structure area) 3. Total canopy area of Ancillary Nursery 12,998 sf (70% of structure area) 4. Water supply: one (1) well, with production rate of 17-35 gal/min 5. Irrigation type: Drip/micro (pressure sensitive drip tape) 6. New water storage tanks i) Ten (10) 5,000 gal irrigation water storage tanks ii) One (1) 10,000 gal firefighting water storage tank, pursuant to CalFire regulations.
Transcript of 1. Results Summary 2. Background

TECHNICAL MEMORANDUM
1
To: Management California Production Services, LLC. 5790 Rocky Canyon Road Creston, 93432 California
Date: 07/16/2019
From: Paul Henderson, CPEng Ref: Subject: Water Demand Estimate for California Production Services – Rocky Canyon Project
1. Results Summary
The proposed cannabis cultivation at the 5790 Rocky Canyon Road, Creston, CA property has the following estimated water volumes:
• Proposed annual water usage of 1,467,343 gal/year (4.5 acre.feet/year), for irrigation
• Previous annual water usage of 258,394 (0.79 acre.feet/year), which is no longer used and therefore considered as water offset.
2. Background California Production Services has engaged Paul Henderson, Environmental Engineer, to provide a water demand estimate for the proposed cannabis cultivation at the 5790 Rocky Canyon Road property, located in Creston, within San Luis Obispo County (the County). California Production Services has requested this water demand estimate to satisfy the requirements of the County Cannabis Land Use Ordinance No. 3358. The proposed project is within the Paso Robles Groundwater Basin (PRGWB), Creston Sub-Area. The PRGWB is classified as a Level of Severity (LOS) III basin. The County requires:
a. An estimate of existing total water demand prior to cannabis-related activities onsite;
b. An estimate of total water demand of the proposed project;
c. A detailed description of how the new water demand would be offset; and
d. An assessment of the proposed water source’s ability to support the proposed project. Listed below are the general specifications of the proposed cultivation, which relate to this water demand estimate:
1. Total canopy area of Hoophouse: 130,680 sf (100% of structure area)
2. Total canopy area of Greenhouse: 22,000 sf (100% of structure area)
3. Total canopy area of Ancillary Nursery 12,998 sf (70% of structure area)
4. Water supply: one (1) well, with production rate of 17-35 gal/min
5. Irrigation type: Drip/micro (pressure sensitive drip tape)
6. New water storage tanks
i) Ten (10) 5,000 gal irrigation water storage tanks
ii) One (1) 10,000 gal firefighting water storage tank, pursuant to CalFire regulations.

2
3. Previous Total Water Demand
The previous use of the site was for raising cattle and keeping horses. The following details have been provided:
• A ‘single wide’ house was removed, and a studio apartment was removed. For the purpose of this estimate the following have been considered:
• Irrigation of approximately 20 trees, which are now established, no longer requiring irrigation.
Table 1 provides the estimated water demand for the previous uses of the property.
Table 1 – Previous Annual Use Water Demand Estimate
Description No. of Units
gal/unit/day gal/day average
gal/month gal/year Source
Cattle 30 14.5 435 13,231 158,775 1 Horses 7 14.5 102 3,087 37,048 Tree irrigation (40 gal twice per week per tree)
15 11.4 171 5,214 62,571 2
Total
708 21,533 258,394
1 acre.feet = 3.069E-06 gal
Total = 0.79 acre.ft
Sources from Table 1
1. http://extensionpublications.unl.edu/assets/html/g2060/build/g2060.htm
2. https://www.mrt.com/lifestyles/article/Formula-calculates-how-much-water-each-tree-needs-7432435.php
3
4. Estimate of the Total Water Demand of the Project
4.1 Cultivation Operations
California Production Services proposes to cultivate the project area over three (3) growing cycles per year, which will consist of:
• Three (3) growing periods of 108 days
• Three (3) harvest and planting (non-growing) periods of 14 days
The cultivation operation will be staggered i.e. different areas of the cultivation will be at different stages in the growth cycle. For this reason it is expected that at any point in time plants at all growth stages will require irrigation (from newly planted to ready for harvest), hence the average irrigation rate is used for the entire cultivation at any point in time. For the purpose of this water demand estimate a conservative weighted average has been selected, noting the mass of a plant and the water demand over the lifecycle may not follow a linear pattern and the exact areas (sf) of plants at the various growth phases cannot be known, and will depend on the operation of the cultivation. For the purposes of a conservative water demand estimate a weighted annual average of 0.75 of the Cal Poly ET0. The water demand rates used are provided in Table 2.
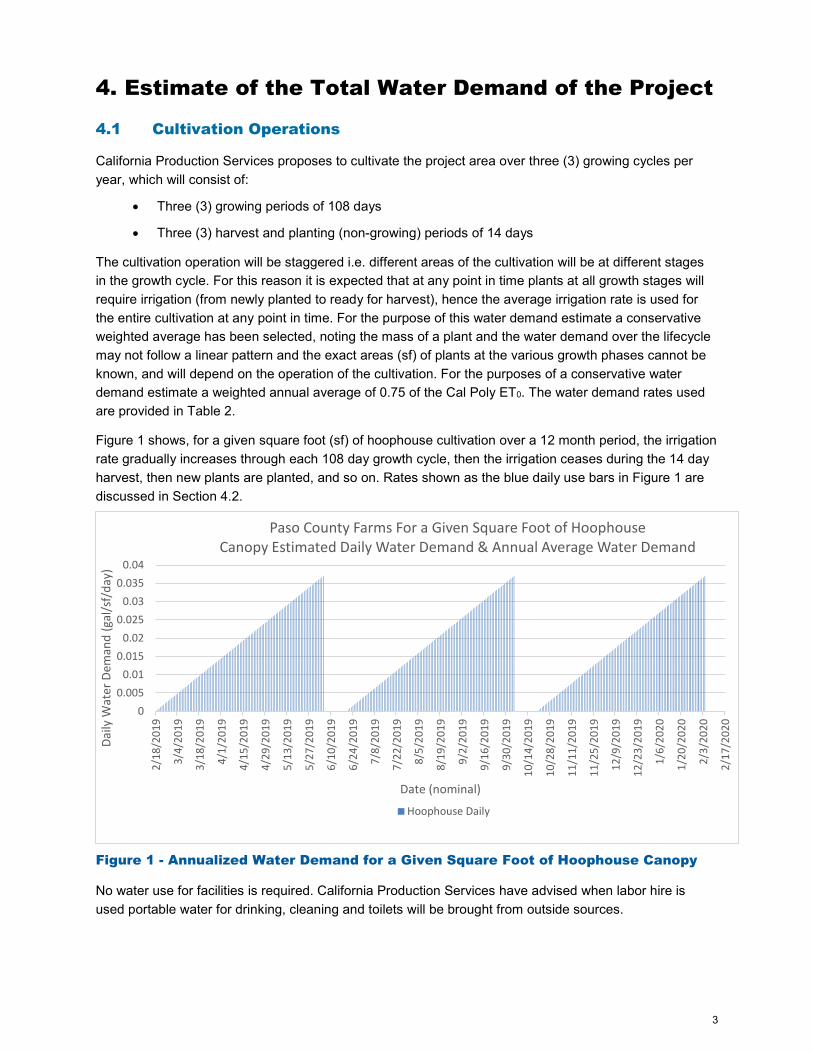
Figure 1 shows, for a given square foot (sf) of hoophouse cultivation over a 12 month period, the irrigation rate gradually increases through each 108 day growth cycle, then the irrigation ceases during the 14 day harvest, then new plants are planted, and so on. Rates shown as the blue daily use bars in Figure 1 are discussed in Section 4.2.
Figure 1 - Annualized Water Demand for a Given Square Foot of Hoophouse Canopy
No water use for facilities is required. California Production Services have advised when labor hire is used portable water for drinking, cleaning and toilets will be brought from outside sources.
00.005
0.010.015
0.020.025
0.030.035
0.04
2/18
/201
9
3/4/
2019
3/18
/201
9
4/1/
2019
4/15
/201
9
4/29
/201
9
5/13
/201
9
5/27
/201
9
6/10
/201
9
6/24
/201
9
7/8/
2019
7/22
/201
9
8/5/
2019
8/19
/201
9
9/2/
2019
9/16
/201
9
9/30
/201
9
10/1
4/20
19
10/2
8/20
19
11/1
1/20
19
11/2
5/20
19
12/9
/201
9
12/2
3/20
19
1/6/
2020
1/20
/202
0
2/3/
2020
2/17
/202
0
Daily
Wat
er D
eman
d (g
al/s
f/da
y)
Date (nominal)
Paso County Farms For a Given Square Foot of Hoophouse Canopy Estimated Daily Water Demand & Annual Average Water Demand
Hoophouse Daily

4
4.2 Water Demand Rates
Due to the legal cannabis cultivation industry in California being in it’s infancy a consensus on cannabis cultivation water demand rates has not been reached in the industry. However, specific site knowledge of California Production Services’ operators and generally accepted rates from neighboring Counties and other sources provide sufficient reference rates for the purpose of this water demand estimate. In the case of this water demand estimate the evapotranspiration (ET) rates provided by the Cal Poly BioResource and Agricultural Engineering (BRAE) Department have been utilized (Cal Poly 2019).
The monthly ET rates utilized are derived from an average rate of similar plants (Tomatoes and Peppers, Flowers, Nursery and Christmas Tree). Attachment 2 provides the monthly Cal Poly ET rates for outdoor growing in the Paso Robles region, which lies within Zone 6 of the Cal Poly data, and is shown on the map provided in Attachment 2. The average ET rate from similar plants has been utilized as the reference crop (ET0) i.e. the outdoor full grown plant values shown in the second column of Table 2.
The rates have been factored down to account for the ET in greenhouses, hoophouses and nursery being lower compared to outdoor growing, potentially reducing ET by averages of between 45% or more (Czyzyk, et al. 2014). Sources for the factored down ET rates are provided in Table 2. Detailed daily estimates are provided in Attachment 1.
For this water demand estimate the following ET reductions have been adopted compared to outdoor ET, and applied to the Cal Poly ET rates:
• Greenhouse 30% reduction, or multiply by 0.70
• Hoophouse 40% reduction, or multiply by 0.60
• Nursery 45% reduction, or multiply by 0.55
Table 2 - Water Demand Rates

5
The monthly fluctuation of estimated water demand, based on the Cal Poly ET rates, is depicted in Figure 2. As would be expected, the water demand is significantly higher in the summer months than the winter months.
Figure 2 - California Production Services Estimated Monthly Water Demand
5. Description of Water Offset
Pursuant to County Ordinance No. 3358 Cannabis cultivation and nursery sites located in the Paso Robles Groundwater Basin (PRGWB) must offset their projected water use at a 1:1 ratio, and offsets can be achieved in the PRGWB by:
• Retrofitting plumbing fixtures (toilets, showerheads, clothes washers, and faucet aerators) within the same groundwater basin;
• Removing existing crops on-site; and/or
• Paying a one-time water offset fee.
In this instance California Production Services have elected to pay a one-time water offset fee, giving consideration to ceasing the previous use provided in Section 3 i.e. no longer irrigating trees, raising cattle or keeping horses.

6
The annual water volume no longer used for previously conducted activities (previous use) is 0.79 acre.feet.
6. Ability of Water Source to Support the Project
6.1 Well Information
The proposed cultivation water will be supplied by the property’s existing well, which will be the only water source used for the cannabis cultivation. The well pump test, completed by Farm Supply Co. on 06/29/2019, shows the well has the ability to supply between 17 and 35 gal/minute. Based on the minimum, 17 gal/min, the well can supply 24,480 gal/day.
Noting the peak estimated water demand of 253,761 gal for the month of July (31 days) the estimated peak daily rate is 8,186 gal/day, 1/3rd of the potential minimum supply rate of the well. The Farm Supply Co. pump test report is provided in Attachment 3.
Based on the above mentioned rates the well should have no issues supplying the water required for the project.
6.2 Water Storage Information
Water tanks will be centrally located near the well and the cultivation. Water will be stored in 10 x 5,000-gallon water tanks and be used in the irrigation process, as well as used for back up water storage. As per CalFire regulations, a 10,000-gallon steel water tank will be accessible to CalFire, and is located at the modified hammer-head turnaround. Table 3 summarizes the water storage volume for the project.
Table 3 - Water Storage Volumes
Water Storage Volume (gal) Number Total Volume (gal) Irrigation Water Storage Tanks 5,000 10 50,000 Steel Fire Fighting Water Tank 10,000 1 10,000
Total 60,000

7
7. Credentials of Water Demand Estimator It is understood the County requires the credentials of individuals or organizations providing the water demand estimate. Because Paul Henderson is currently working through his PE in California a more extensive description of credentials is provided below. Paul Henderson, CPEng can be contacted by:
Email [email protected] Phone (805) 468-9927
7.1 Professional Certifications and Accreditations Paul Henderson is a Registered and Chartered Professional Engineer CPEng (Civil and Environmental) in Australia and a Certified Construction Manager in the USA. Paul in in progress of attaining his California PE in Civil Engineering.
• Registered Professional Engineer Queensland, RPEQ (Civil and Environmental), Australia
o Registration No. 15423
• Chartered Professional Engineer, CPEng (Civil and Environmental), Australia
o Registration No. 3831969
• Certified Construction Manager, CCM, United States of America
7.2 Education Paul Henderson holds bachelors degrees, recognized under the Washington Accord, for Environmental Engineering and Environmental Engineering Technology. A link to the Washington Accord has been provided below. http://www.ieagreements.org/accords/washington/signatories/ Paul Henderson’s tertiary education includes:
• BEng (Env) (Honors) - Bachelor of Engineering, Environmental, Australia
• BTech (Env) - Bachelor of Engineering Technology, Environmental, Australia
• Diploma of Civil Engineering, Otago Polytechnic, New Zealand
7.3 Relevant Experience
Paul has many years of experience in hydrologic and hydraulic modeling, including complex water demand analysis and water balance modeling for the mining industry, civil engineering projects and public works infrastructure.
Paul’s practical experience in agricultural based employment includes managing and operating irrigation systems. Paul’s environmental engineering degrees include significant agricultural engineering portions, in particular water demand analysis and irrigation efficiency for cropping.

8
8. Bibliography Cal Poly. 2019. Irrigation Evaluation Data. March 26. http://www.itrc.org/etdata/index.html. California Water Boards. 2019. Fact Sheet: December 2018 Statewide Conservation Data. California
Water Boards. https://www.waterboards.ca.gov/water_issues/programs/conservation_portal/docs/2019feb/fs020519.pdf.
CSCPD. 2017. Environmental Impact Report (EIR) for the Commercial Cannabis Cultivation and Manufacturing Regulations and Licensing Program (DRAFT). Santa Cruz: County of Santa Cruz Planning Department. http://www.sccoplanning.com/Portals/2/County/Planning/env/Cannabis_EIR/Individual%20EIR%20Sections%20PDF%20Files/3.9_Hydro_CannabisEIR_Draft.pdf.
Czyzyk, Kelsey, Shayne Bement, William Dawson, and Khanjan Mehta. 2014. Quantifying Water Savings with Greenhouse Farming. University Park, PA: College of Engineering, The Pennsylvania State University.

9
Attachment 1 – Calculation Data

From Californina Production Services Drawing SD‐1, Enarged Site Plan dated 3.00 acres conversion sf to acre Phase Areas of Coverage SF of Cultivation % is canopy SF of Canopy
130,680 sf 1 acre = 43,560 sf 1 Hoophouse Outdoor Cultivation + Greenhouses D,E,F 130,680 100% 130,680 0.51 acres 2 Greenhouses A,B,C,D,E,F 22,000 100% 22,000
22,000 sf 3 Ancillary Nursery 18,568 70% 12,998 0.30 acres 1+2+3 All grow areas 171,248 165,678
12,998 sf0.80 acres
34,998 sf
R‐factor 0.7 R‐factor 0.6 R‐factor 0.55A‐factor 0.75 A‐factor 0.75 A‐factor 0.75multiplier 0.53 multiplier 0.45 multiplier 0.41
days Month gal/sf/month gal/sf/month gal/month gal/sf/month gal/month gal/sf/month gal/month gal/month31 January 1.01 0.53 69,498 0.46 10,029 0.42 5,431 84,958 28 February 0.46 0.24 31,221 0.20 4,505 0.19 4,130 39,855 31 March 0.32 0.17 21,812 0.14 3,147 0.13 2,885 27,844 30 April 0.54 0.28 36,994 0.24 5,338 0.22 4,893 47,226 31 May 1.72 0.90 117,826 0.77 17,002 0.71 15,585 150,414 30 June 3.35 1.76 229,878 1.51 33,171 1.38 30,407 293,457 31 July 3.41 1.79 233,727 1.53 33,727 1.41 30,916 298,370 31 August 1.92 1.01 131,512 0.86 18,977 0.79 17,396 167,884 30 September 1.62 0.85 111,197 0.73 16,046 0.67 14,709 141,951 31 October 0.91 0.48 62,655 0.41 9,041 0.38 8,288 79,984 30 November 0.71 0.37 48,756 0.32 7,035 0.29 6,449 62,240 31 December 0.84 0.44 57,309 0.38 8,270 0.34 7,581 73,159
Total 16.80 8.82 1,152,384 7.56 166,289 6.93 148,670 1,467,343 1 gallon = 3.0689E‐06 acre.feet 4.50
Notes:R‐factor = Reduction factor used to convert Cal Poly ET0 for outdoor grown reference crop to indoor growing
A‐factor = Annualized average factor used to allow for crops at different growth stages throughout
the cultivation i.e. some plants fully grown and some plants just planted.
Multiplier = product of R‐factor & A‐factor
Note 1:Evapotranspiration rates shown for outdoor grown plants are used as the reference crop for the purpose of estimating, based on the Cal Poly data
References for evapotranspiration comparison outdoor and greenhousehttps://ieeexplore.ieee.org/stamp/stamp.jsp?arnumber=6970300https://www.sciencedirect.com/science/article/pii/S1674237015300120
Water Storage Volume (gal) Number Total Volume (gal)Irrigation Water Storage Tanks 5000 10 50000Steel Fire Fighting Water Tank 10000 1 10000
Total 60000
Greenhouse Total Area
Hoophouse Area
Total Canopy
Ancillary Nursery
Outdoor Full Grown Plant (Cal Poly ET0)
CombinedAncillary NurseryGreenhouseHoophouse
‐ 0.20 0.40 0.60 0.80 1.00 1.20 1.40 1.60 1.80 2.00
gal/s
f/mon
th
Average Month
Water Demand for California Production ServicesCultivation at Rocky Canyon
Hoophouse
Greenhouse
Ancillary Nursery
0.53 0.24 0.17 0.28 0.90
1.76 1.79 1.01 0.85
0.48 0.37 0.44
0.46 0.20 0.14 0.24
0.77
1.51 1.53
0.86 0.73
0.41 0.32 0.38
0.42
0.19 0.13 0.22
0.71
1.38 1.41
0.79 0.67
0.38 0.29 0.34
‐
0.50
1.00
1.50
2.00
2.50
3.00
3.50
4.00
4.50
5.00
gal/sf/m
onth
Average Month
Estimated Water Demand for California Production ServicesCultivation at Rocky Canyon
Hoophouse
Greenhouse
Ancillary Nursery

10
Attachment 2 – Cal Poly Evapotranspiration Rates

Data from: http://www.itrc.org/etdata/index.html
ETc Table for Irrigation Scheduling and Design - (As modified by DGE for purpose of cannabis cultivation irrigation estimates) Convert inches to gal/sfZone 6 Monthly Evapotranspiration 1"/sf = 0.0833333 cfDrip/Micro Irrigation Typical Year 0.6233766 galIRRIGATION TRAINING AND RESEARCH CENTER, California Polytechnic State University, San Luis ObispoTable does not include adjustments for bare spots and reduced vigor
1997 (Typical Year)Month January February March April May June July August September October November December Annual
inches inches inches inches inches inches inches inches inches inches inches inches inchesNo. of days in month 31 28 31 30 31 30 31 31 30 31 30 31Precipitation 7 0.41 0.07 0.15 0.09 0.02 0.01 0.21 0.61 0.11 3.57 3.39 15.65Grass Reference ETo 1.45 2.6 3.98 5.54 6.89 6.49 6.11 6.01 5.13 3.75 1.79 1.73 51.46Monthly Cannabis ET Rate (average of "x" row 1.625 0.73 0.51 0.865 2.755 5.375 5.465 3.075 2.6 1.465 1.14 1.34 26.935 average 2.25 gal/sf/dayMonthly Cannabis gal/sf 1.01299 0.455065 0.3179 0.5392 1.7174 3.35065 3.4068 1.9169 1.6207792 0.91325 0.7106494 0.8353247Daily Cannabis ET Rate (average of "x" rows in 0.03268 0.016252 0.0103 0.018 0.0554 0.11169 0.1099 0.0618 0.054026 0.02946 0.0236883 0.026946
[b] [c] [d] [c] [d] [e] [f] [g] [h] [i] [j] [k] [l] [m]Apple, Pear, Cherry, Plum and Prune 1.6 0.74 0.45 1.14 3.07 4.88 5.22 5.27 4.64 2.7 1.08 1.33 32.14Apples, Plums, Cherries etc w/covercrop 1.65 2.78 3.28 4.42 5.57 5.51 5.22 5.32 4.74 3.16 1.74 2 45.39Peach, Nectarine and Apricots 1.6 0.74 0.57 1.4 3.1 4.68 4.94 4.95 4.45 2.6 1.08 1.33 31.42Immature Peaches, Nectarines, etc 1.61 0.73 0.35 0.78 1.66 2.45 2.67 2.75 2.66 1.49 1.09 1.34 19.58Almonds 1.6 0.74 0.57 1.84 4.66 5.2 4.97 5 4.57 2.83 1.55 1.33 34.85Almonds w/covercrop 1.65 2.41 2.65 3.87 6.1 6.25 5.85 5.87 5.25 3.3 1.6 1.93 46.72Immature Almonds 1.61 0.73 0.35 0.99 2.51 2.86 2.62 2.79 2.71 1.7 1.36 1.34 21.56Walnuts 1.59 0.74 0.32 1.27 2.65 4.42 5.81 5.87 5.05 2.94 1.5 1.33 33.49Pistachio 1.6 0.74 0.13 1.13 2.13 4.18 5.81 6.12 5.37 3.14 1.6 1.33 33.25Pistachio w/ covercrop 1.65 2.41 2.41 3.59 4.58 5.43 5.91 6.17 5.44 3.58 1.69 1.93 44.79Immature Pistachio 1.61 0.73 0.13 0.65 1.14 2.4 3.22 3.64 3.39 1.84 1.35 1.34 21.43Misc. Deciduous 1.6 0.74 0.13 0.89 1.88 3.84 5.02 5.09 4.59 2.81 1.16 1.33 29.06Cotton 1.65 0.72 0.64 0.43 1.59 5.2 6.37 6.21 2.92 0.15 1.12 1.35 28.36Misc. field crops 1.65 0.72 1.19 1.39 2.42 6.08 5.86 2.34 0.61 0.12 1.12 1.35 24.85Small Vegetables 1.68 2.33 3.97 2.75 3.69 5.86 1.24 0.25 0.61 0.12 1.14 1.57 25.21Tomatoes and Peppers 1.65 0.72 0.89 0.84 3.63 6.91 5.91 1.06 0.61 0.12 1.12 1.35 24.81Potatoes, Sugar beets, Turnip etc.. 1.66 1.09 2.09 5.84 7.63 7.15 5.88 0.31 0.61 0.12 1.12 1.35 34.85Melons, Squash, and Cucumbers 1.65 0.72 0.13 0.16 0.86 0.73 3.29 4.63 1.97 0.12 1.12 1.35 16.75Onions and Garlic 1.68 2.24 3.51 4.94 4.49 0.68 0.01 0.22 0.61 0.12 1.75 1.55 21.79Strawberries 1.65 0.72 1.19 1.39 2.42 6.08 5.86 2.34 0.61 0.12 1.12 1.35 24.85Flowers, Nursery and Christmas Tree 1.6 0.74 0.13 0.89 1.88 3.84 5.02 5.09 4.59 2.81 1.16 1.33 29.06Citrus (no ground cover) 1.65 2.54 2.88 3.61 4.21 3.77 3.56 3.68 3.55 2.35 1.59 1.92 35.31Immature Citrus 1.65 1.58 1.39 1.97 2.15 1.9 1.79 2.01 2.09 1.23 1.36 1.7 20.82Avocado 1.6 0.74 0.13 0.89 1.88 3.84 5.02 5.09 4.59 2.81 1.16 1.33 29.06Misc Subtropical 1.6 0.74 0.13 0.89 1.88 3.84 5.02 5.09 4.59 2.81 1.16 1.33 29.06Grape Vines with 40% canopy 1.61 0.73 0.56 1.73 2.9 2.65 2.36 1.99 1.64 0.15 1.09 1.34 18.75Grape Vines with cover crop (40% canopy) 1.65 1.72 1.6 2.63 3.34 3.08 2.86 2.85 2.61 1.39 1.35 1.75 26.83Grape Vines with 60% canopy 1.61 0.73 0.56 2.3 4.2 3.9 3.49 2.77 2.03 0.16 1.09 1.34 24.19


11
Attachment 3 – Well Test Report


