1. Reduce Airline Cost - · PDF file1. Reduce Airline Cost 2. ... Reduce Airline Cost. 2....
37
O N T
Transcript of 1. Reduce Airline Cost - · PDF file1. Reduce Airline Cost 2. ... Reduce Airline Cost. 2....
O
N
T
1. Reduce Airline Cost
2. Develop Airport Related Businesses
3. Provide Customer Friendly Facilities and Services
4. Expand Air Service
Agenda

1. Reduce Airline Cost
Agenda

Reduce Airline Cost

Reduce Airline Cost
2. Develop Airport Related
Businesses
Agenda

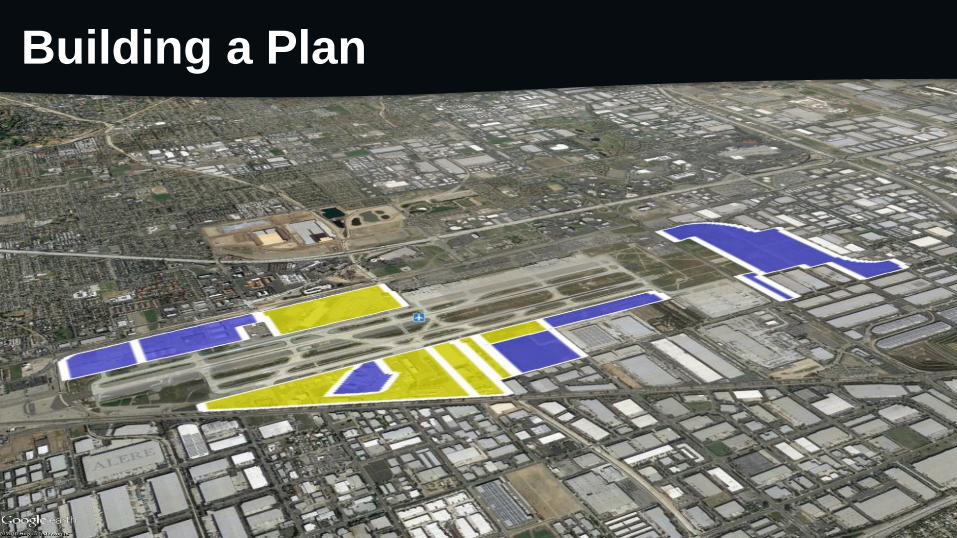
Building a Plan
Building a Plan
Building a Plan

Building a Plan
Building a Plan

3. Provide Customer Friendly
Facilities and Services
Agenda

Provide Customer Friendly
Facilities and Services

4. Expand Air Service
Agenda
Ontario is the Most Convenient Airport
For a Large Part of the Los Angeles
Region
Closest to ONT
Closest to BUR
Closest to LAX
Closest to LGB
Closest to SNA
Closest to SAN
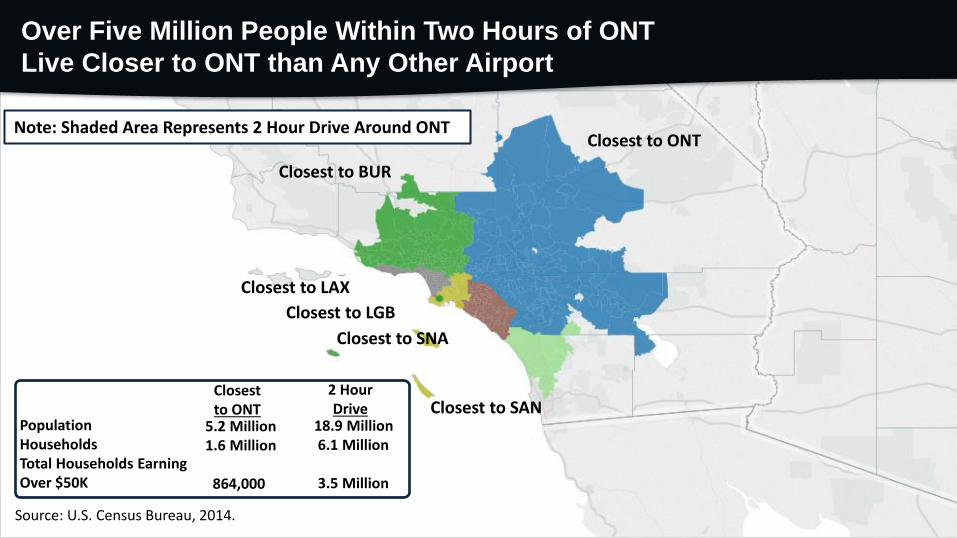
Note: Shaded Area Represents 2 Hour Drive Around ONT
Within 2hour Drive
Closest to ONT
PopulationHouseholdsTotal Households Earning Over $50K
18.9 Million6.1 Million
3.5 Million
5.2 Million1.6 Million
864,000
2 HourDrive
Source: U.S. Census Bureau, 2014.
Over Five Million People Within Two Hours of ONT
Live Closer to ONT than Any Other Airport

Source: U.S. Bureau of the Census, 2010 survey; Target Pro DriveTime mapping; LAX penalized 15 minutes for airport congestion
75-Minute Drive from ONT
60-Minute Drive from LAX
= 500 persons
ONT LAX ONT %
75 mins. 60 mins. of LAX
Population (mil.) 15.0 12.5 121%
Household Income (bil. $) $388.1 $341.1 114%
Median Household Income $64,197 $65,676 98%
ONT
LAX
The Total Population and Household Income Within 75
Minutes of ONT Significantly Exceeds that of LAX
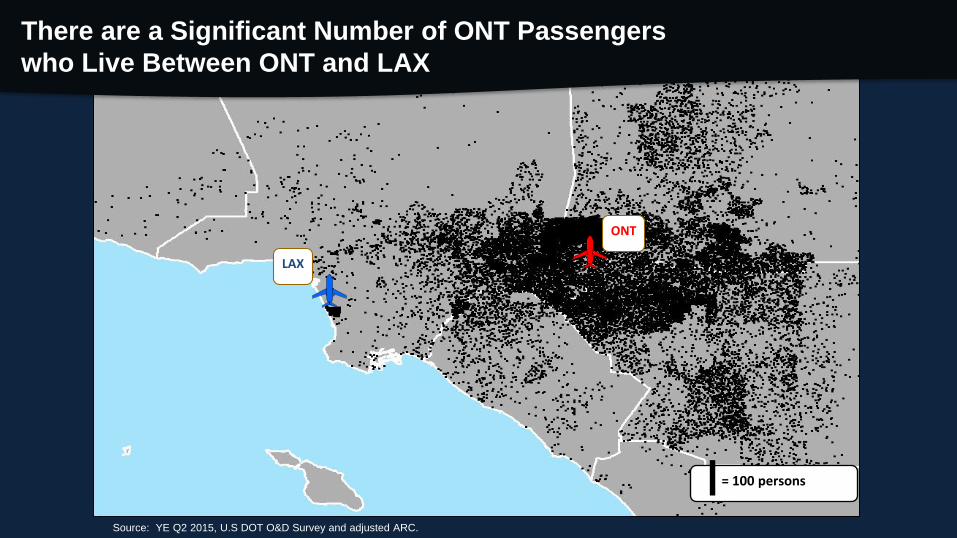
Source: YE Q2 2015, U.S DOT O&D Survey and adjusted ARC.
= 100 persons
ONT
LAX
There are a Significant Number of ONT Passengers
who Live Between ONT and LAX
Ontario International Airport
has been Grossly Underserved
OAKOAKOAKOAKOAKOAKOAKOAKOAK
GDLGDLGDLGDLGDLGDLGDLGDLGDL
SFOSFOSFOSFOSFOSFOSFOSFOSFO
ONTONTONTONTONTONTONTONTONT
LASLASLASLASLASLASLASLASLAS
PDXPDXPDXPDXPDXPDXPDXPDXPDX
SEASEASEASEASEASEASEASEASEA
SMFSMFSMFSMFSMFSMFSMFSMFSMF
DENDENDENDENDENDENDENDENDEN
DFWDFWDFWDFWDFWDFWDFWDFWDFW
IAHIAHIAHIAHIAHIAHIAHIAHIAH
MDWMDWMDWMDWMDWMDWMDWMDWMDW
MEXMEXMEXMEXMEXMEXMEXMEXMEX
PHXPHXPHXPHXPHXPHXPHXPHXPHX
SJCSJCSJCSJCSJCSJCSJCSJCSJC
SLCSLCSLCSLCSLCSLCSLCSLCSLC
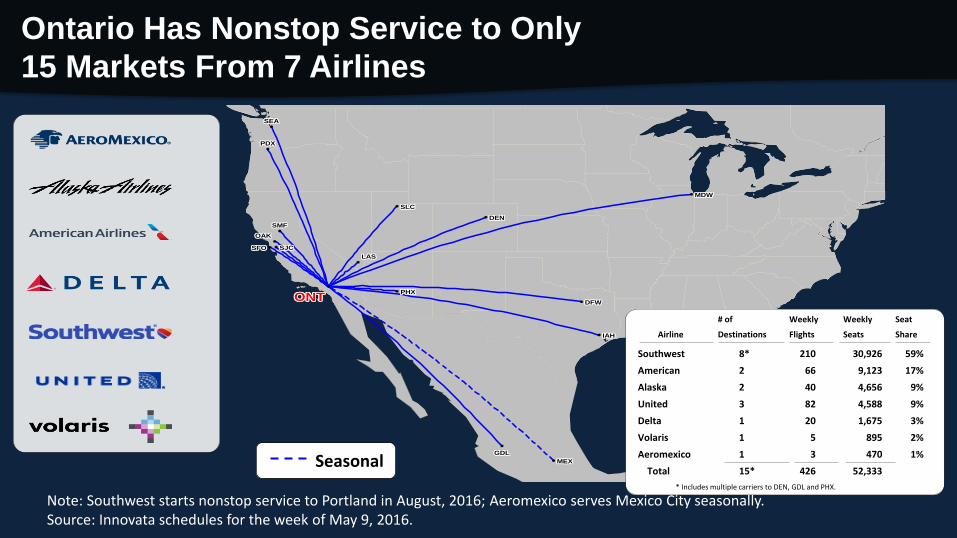
Note: Southwest starts nonstop service to Portland in August, 2016; Aeromexico serves Mexico City seasonally. Source: Innovata schedules for the week of May 9, 2016.
Seasonal
Southwest
American
Alaska
United
Delta
Volaris
Aeromexico
Total
30,926
9,123
4,656
4,588
1,675
895
470
52,333
8*
2
2
3
1
1
1
15*
210
66
40
82
20
5
3
426
59%
17%
9%
9%
3%
2%
1%
Airline
# of
Destinations
Weekly
Flights
Weekly
Seats
Seat
Share
* Includes multiple carriers to DEN, GDL and PHX.
Ontario Has Nonstop Service to Only
15 Markets From 7 Airlines
66%
32%
18%10%
7% 7%2% 1%
-3% -3%-7%
-11% -11% -12% -15% -15% -16% -16% -16% -18% -20% -21% -21%-26%
-29% -30% -31%-36% -39% -41%
-48%
-74%
-100%
-75%
-50%
-25%
0%
25%
50%
75%
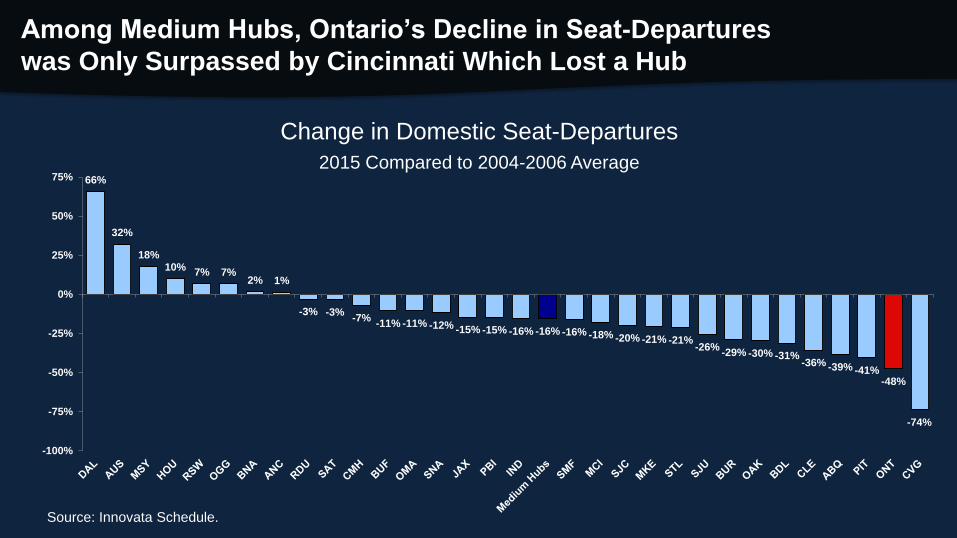
Change in Domestic Seat-Departures
2015 Compared to 2004-2006 Average
Source: Innovata Schedule.
Among Medium Hubs, Ontario’s Decline in Seat-Departures
was Only Surpassed by Cincinnati Which Lost a Hub
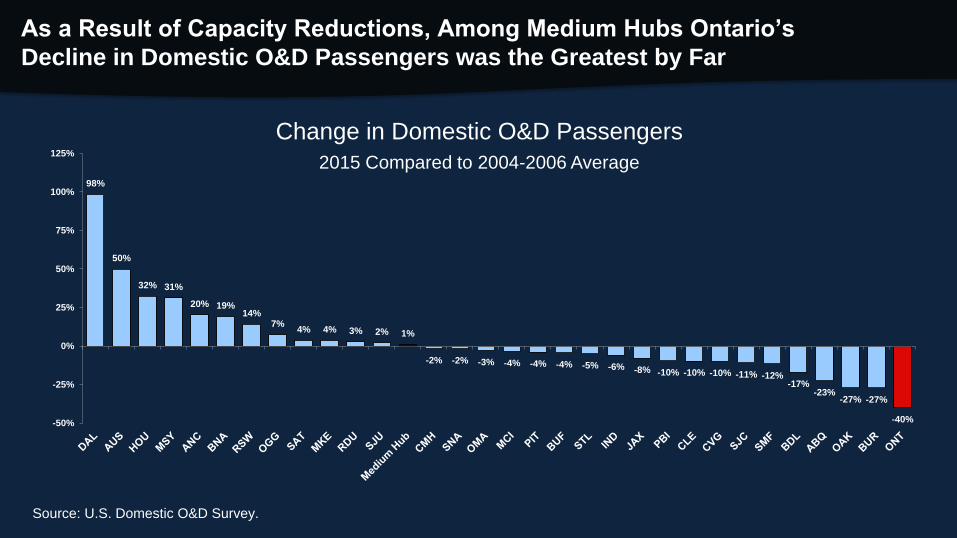
98%
50%
32% 31%
20% 19%14%
7%4% 4% 3% 2% 1%
-2% -2% -3% -4% -4% -4% -5% -6% -8% -10% -10% -10% -11% -12%-17%
-23%-27% -27%
-40%-50%
-25%
0%
25%
50%
75%
100%
125%
Source: U.S. Domestic O&D Survey.
As a Result of Capacity Reductions, Among Medium Hubs Ontario’s
Decline in Domestic O&D Passengers was the Greatest by Far
Change in Domestic O&D Passengers
2015 Compared to 2004-2006 Average
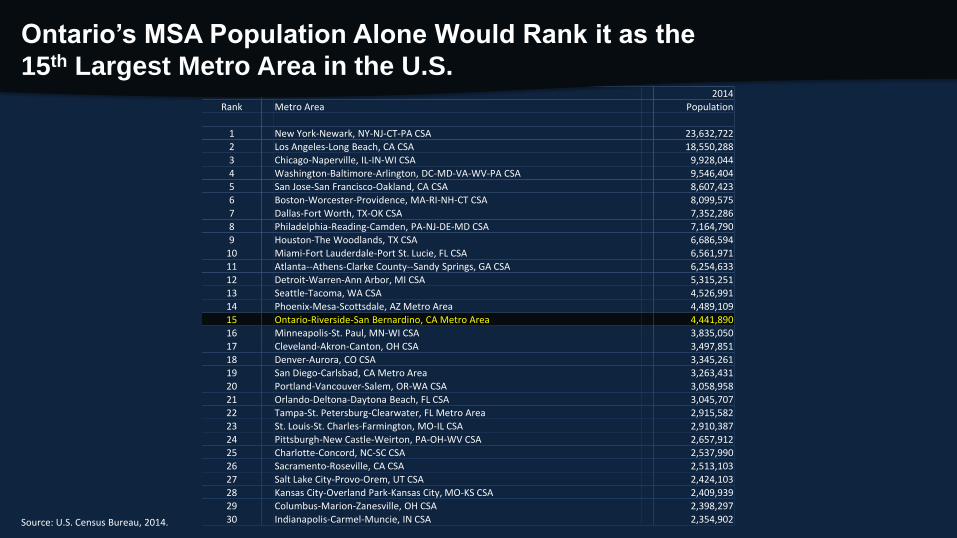
2014
Rank Metro Area Population
1 New York-Newark, NY-NJ-CT-PA CSA 23,632,722
2 Los Angeles-Long Beach, CA CSA 18,550,288
3 Chicago-Naperville, IL-IN-WI CSA 9,928,044
4 Washington-Baltimore-Arlington, DC-MD-VA-WV-PA CSA 9,546,404
5 San Jose-San Francisco-Oakland, CA CSA 8,607,423
6 Boston-Worcester-Providence, MA-RI-NH-CT CSA 8,099,575
7 Dallas-Fort Worth, TX-OK CSA 7,352,286
8 Philadelphia-Reading-Camden, PA-NJ-DE-MD CSA 7,164,790
9 Houston-The Woodlands, TX CSA 6,686,594
10 Miami-Fort Lauderdale-Port St. Lucie, FL CSA 6,561,971
11 Atlanta--Athens-Clarke County--Sandy Springs, GA CSA 6,254,633
12 Detroit-Warren-Ann Arbor, MI CSA 5,315,251
13 Seattle-Tacoma, WA CSA 4,526,991
14 Phoenix-Mesa-Scottsdale, AZ Metro Area 4,489,109
15 Ontario-Riverside-San Bernardino, CA Metro Area 4,441,890
16 Minneapolis-St. Paul, MN-WI CSA 3,835,050
17 Cleveland-Akron-Canton, OH CSA 3,497,851
18 Denver-Aurora, CO CSA 3,345,261
19 San Diego-Carlsbad, CA Metro Area 3,263,431
20 Portland-Vancouver-Salem, OR-WA CSA 3,058,958
21 Orlando-Deltona-Daytona Beach, FL CSA 3,045,707
22 Tampa-St. Petersburg-Clearwater, FL Metro Area 2,915,582
23 St. Louis-St. Charles-Farmington, MO-IL CSA 2,910,387
24 Pittsburgh-New Castle-Weirton, PA-OH-WV CSA 2,657,912
25 Charlotte-Concord, NC-SC CSA 2,537,990
26 Sacramento-Roseville, CA CSA 2,513,103
27 Salt Lake City-Provo-Orem, UT CSA 2,424,103
28 Kansas City-Overland Park-Kansas City, MO-KS CSA 2,409,939
29 Columbus-Marion-Zanesville, OH CSA 2,398,297
30 Indianapolis-Carmel-Muncie, IN CSA 2,354,902Source: U.S. Census Bureau, 2014.
Ontario’s MSA Population Alone Would Rank it as the
15th Largest Metro Area in the U.S.

Source: Census Bureau, U.S. DOT T-100 Report, YE December 2015.
110
30 28 27 23 21 20 19 19 17 16 15 14 14 12 11 11 10 8 7
0
20
40
60
80
100
120
Population
Per Domestic Flight
MSA/CSA
Ontario has by Far the Largest Population per
Domestic Flight Among the 20 Largest Metro Areas
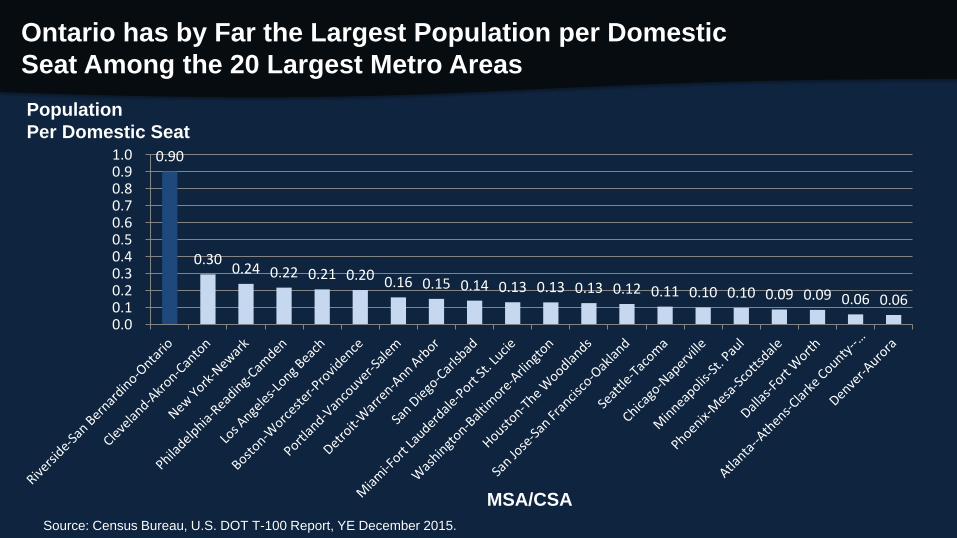
0.90
0.30 0.24 0.22 0.21 0.20 0.16 0.15 0.14 0.13 0.13 0.13 0.12 0.11 0.10 0.10 0.09 0.09 0.06 0.06
0.00.10.20.30.40.50.60.70.80.91.0
Source: Census Bureau, U.S. DOT T-100 Report, YE December 2015.
Population
Per Domestic Seat
Ontario has by Far the Largest Population per Domestic
Seat Among the 20 Largest Metro Areas
MSA/CSA
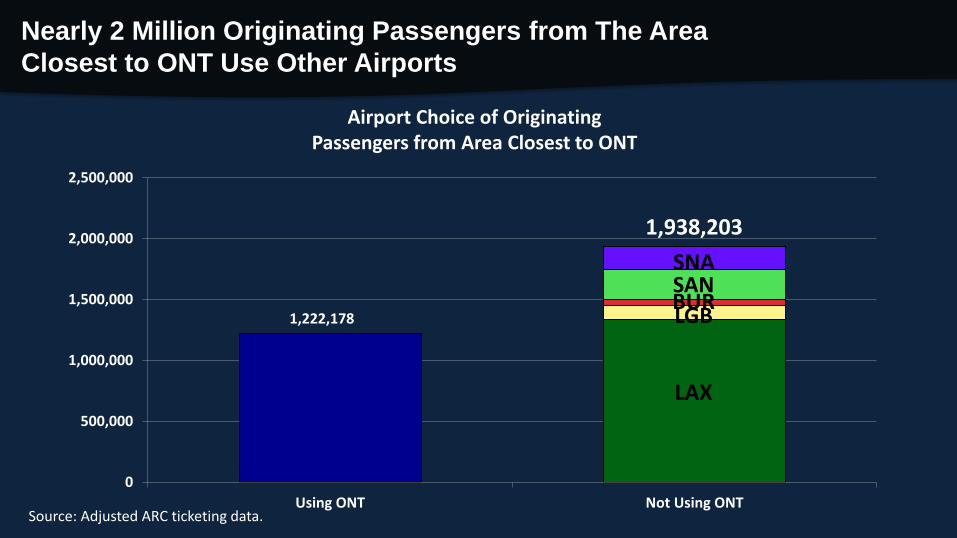
1,222,178
0
500,000
1,000,000
1,500,000
2,000,000
2,500,000
Using ONT Not Using ONT
Airport Choice of Originating Passengers from Area Closest to ONT
Source: Adjusted ARC ticketing data.
1,938,203
LGB
LAX
BURSANSNA
Nearly 2 Million Originating Passengers from The Area
Closest to ONT Use Other Airports
ONT has Significant Growth Potential
in the Region While the Other Airports
Do Not
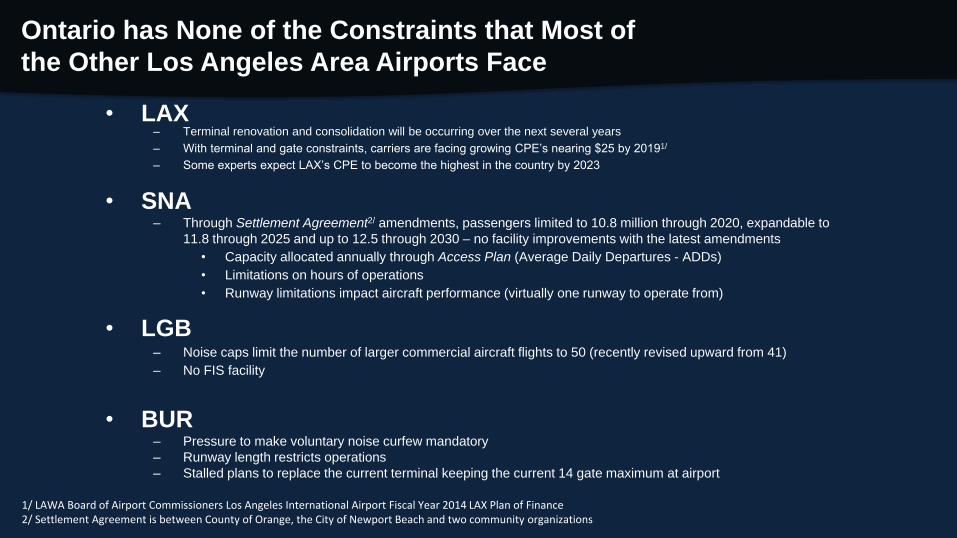
• LAX– Terminal renovation and consolidation will be occurring over the next several years
– With terminal and gate constraints, carriers are facing growing CPE’s nearing $25 by 20191/
– Some experts expect LAX’s CPE to become the highest in the country by 2023
• SNA– Through Settlement Agreement2/ amendments, passengers limited to 10.8 million through 2020, expandable to
11.8 through 2025 and up to 12.5 through 2030 – no facility improvements with the latest amendments
• Capacity allocated annually through Access Plan (Average Daily Departures - ADDs)
• Limitations on hours of operations
• Runway limitations impact aircraft performance (virtually one runway to operate from)
• LGB– Noise caps limit the number of larger commercial aircraft flights to 50 (recently revised upward from 41)
– No FIS facility
• BUR– Pressure to make voluntary noise curfew mandatory
– Runway length restricts operations
– Stalled plans to replace the current terminal keeping the current 14 gate maximum at airport
1/ LAWA Board of Airport Commissioners Los Angeles International Airport Fiscal Year 2014 LAX Plan of Finance2/ Settlement Agreement is between County of Orange, the City of Newport Beach and two community organizations
Ontario has None of the Constraints that Most of
the Other Los Angeles Area Airports Face
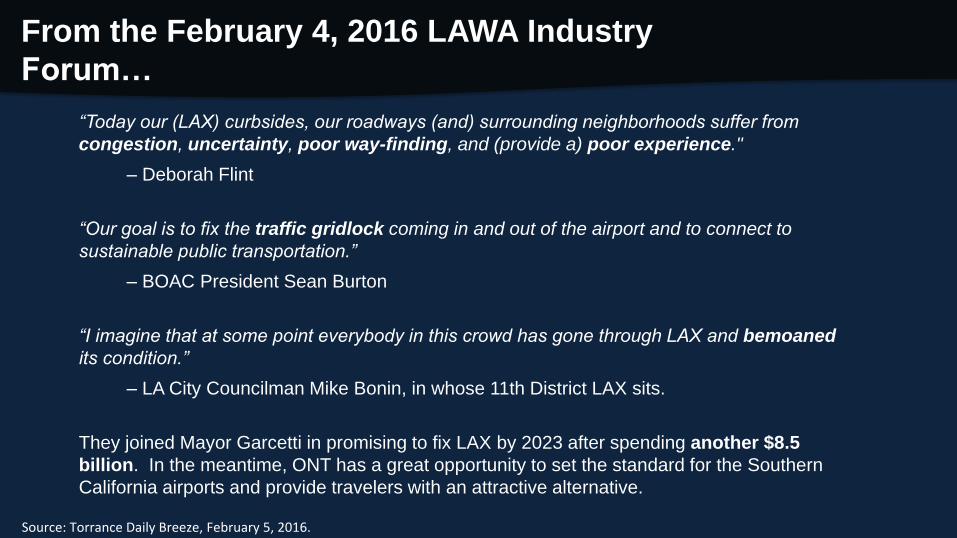
Source: Torrance Daily Breeze, February 5, 2016.
“Today our (LAX) curbsides, our roadways (and) surrounding neighborhoods suffer from
congestion, uncertainty, poor way-finding, and (provide a) poor experience."
– Deborah Flint
“Our goal is to fix the traffic gridlock coming in and out of the airport and to connect to
sustainable public transportation.”
– BOAC President Sean Burton
“I imagine that at some point everybody in this crowd has gone through LAX and bemoaned
its condition.”
– LA City Councilman Mike Bonin, in whose 11th District LAX sits.
They joined Mayor Garcetti in promising to fix LAX by 2023 after spending another $8.5
billion. In the meantime, ONT has a great opportunity to set the standard for the Southern
California airports and provide travelers with an attractive alternative.
From the February 4, 2016 LAWA Industry
Forum…
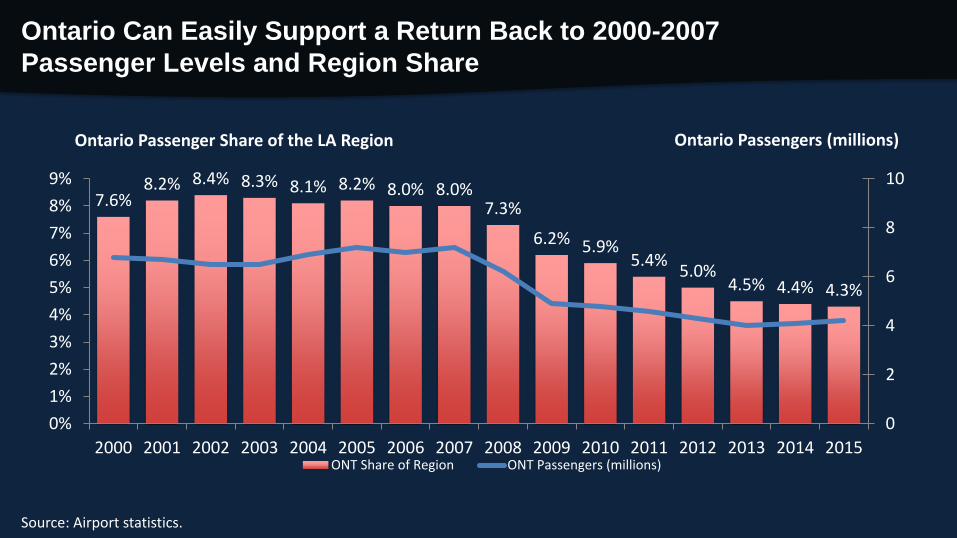
Ontario Passenger Share of the LA Region
Source: Airport statistics.
7.6%8.2% 8.4% 8.3% 8.1% 8.2% 8.0% 8.0%
7.3%
6.2% 5.9%5.4%
5.0%4.5% 4.4% 4.3%
0
2
4
6
8
10
0%
1%
2%
3%
4%
5%
6%
7%
8%
9%
2000 2001 2002 2003 2004 2005 2006 2007 2008 2009 2010 2011 2012 2013 2014 2015ONT Share of Region ONT Passengers (millions)
Ontario Passengers (millions)
Ontario Can Easily Support a Return Back to 2000-2007
Passenger Levels and Region Share
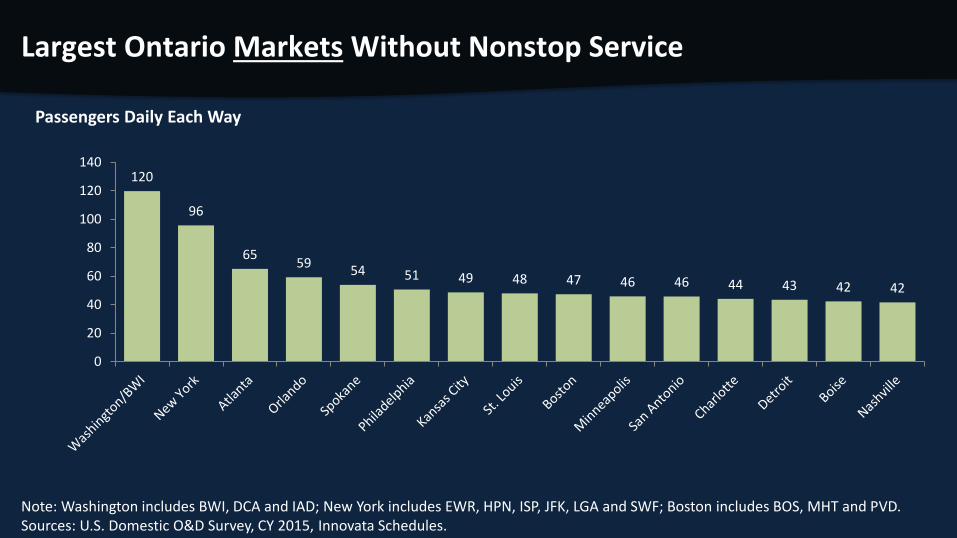
Passengers Daily Each Way
Note: Washington includes BWI, DCA and IAD; New York includes EWR, HPN, ISP, JFK, LGA and SWF; Boston includes BOS, MHT and PVD.Sources: U.S. Domestic O&D Survey, CY 2015, Innovata Schedules.
120
96
6559
54 51 49 48 47 46 46 44 43 42 42
0
20
40
60
80
100
120
140
Largest Ontario Markets Without Nonstop Service
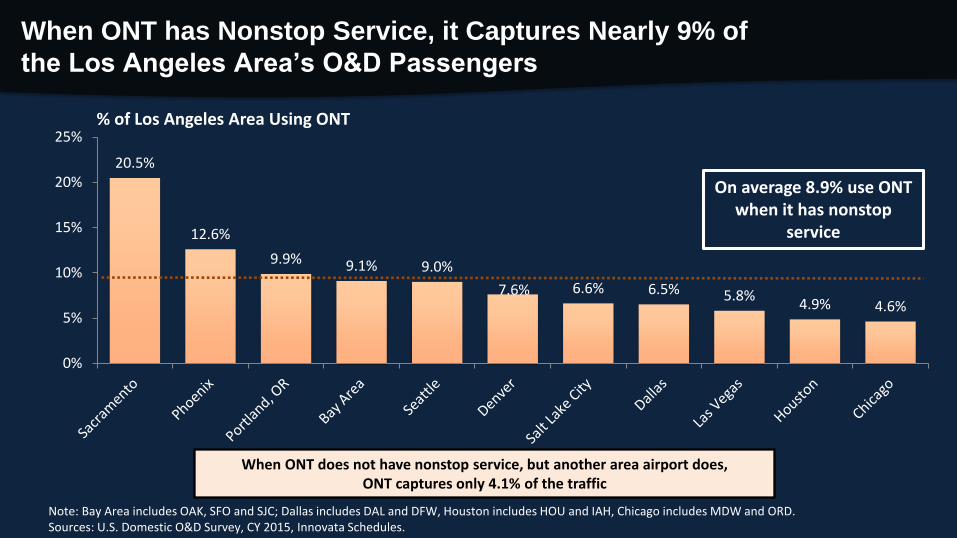
% of Los Angeles Area Using ONT
Note: Bay Area includes OAK, SFO and SJC; Dallas includes DAL and DFW, Houston includes HOU and IAH, Chicago includes MDW and ORD.Sources: U.S. Domestic O&D Survey, CY 2015, Innovata Schedules.
20.5%
12.6%
9.9% 9.1% 9.0%
7.6% 6.6% 6.5% 5.8%4.9% 4.6%
0%
5%
10%
15%
20%
25%
On average 8.9% use ONT when it has nonstop
service
When ONT does not have nonstop service, but another area airport does, ONT captures only 4.1% of the traffic
When ONT has Nonstop Service, it Captures Nearly 9% of
the Los Angeles Area’s O&D Passengers

Passengers Daily Each Way
Note: Assumes ONT captures 8.9% of each of the markets where they do not have nonstop service, but another LA Area airport does have a nonstop.Sources: U.S. Domestic O&D Survey, CY 2015, Innovata Schedules.
0
100
200
300
400
500
600
700
Currently Use ONT
Recapture from Other LA Area Airportsif ONT had nonstop service
596
244
173 160 157 138101 99 90 86 86 62 59 56 54
If ONT Captured 8.9% of the Regions O&D Passengers,
ONT’s Top Unserved Markets are Much Larger
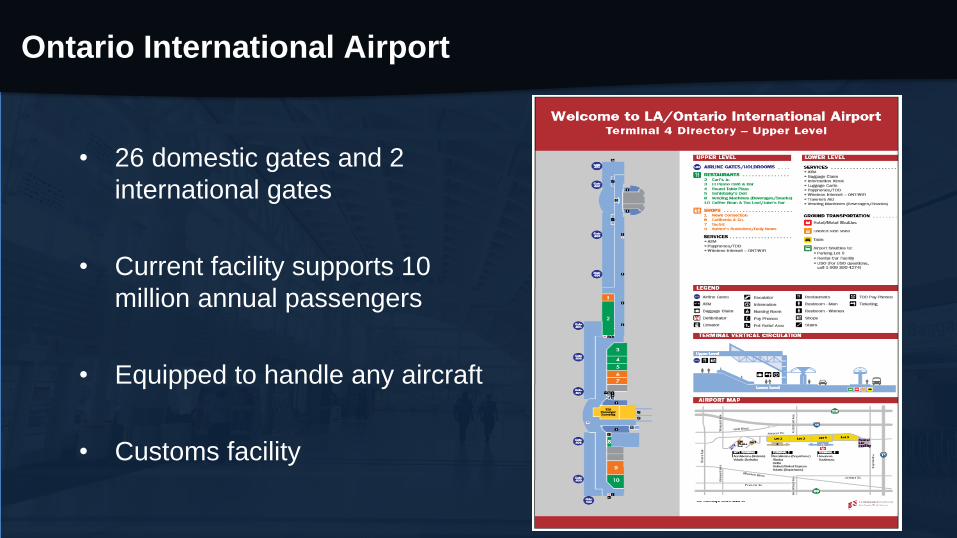
• 26 domestic gates and 2
international gates
• Current facility supports 10
million annual passengers
• Equipped to handle any aircraft
• Customs facility
Ontario International Airport
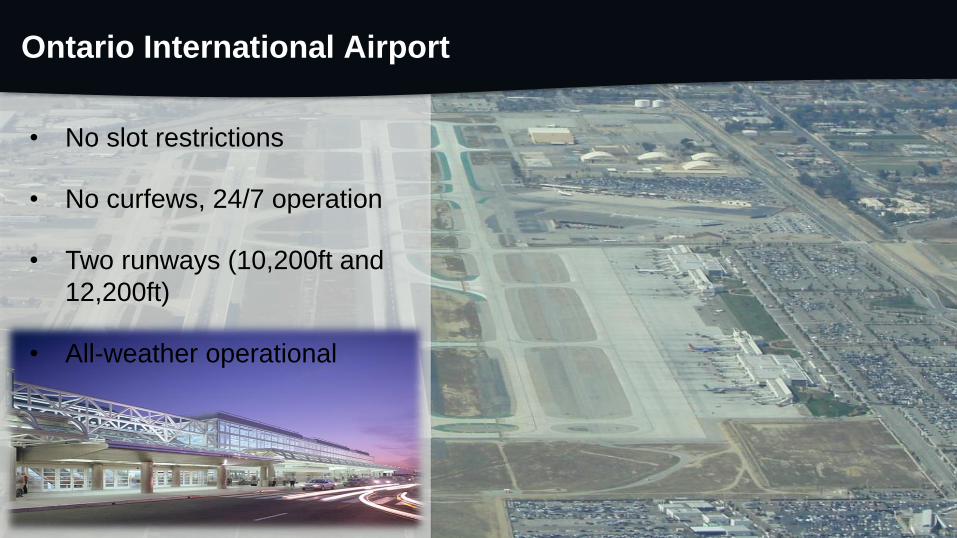
Ontario International Airport
• No slot restrictions
• No curfews, 24/7 operation
• Two runways (10,200ft and
12,200ft)
• All-weather operational
Why Go Anywhere Else???