1 Project Number: DZT-1002 An Interactive Qualifying Project
43
1 Project Number: DZT-1002 An Interactive Qualifying Project Report: Submitted to the Faculty of WORCESTER POLYTECHNIC INSTITUTE in partial fulfillment of the requirements for the Degree of Bachelor of Science By Gregory Andujar _____________________________ Approved by Professor Dalin Tang, Project Advisor ___________________________________________
Transcript of 1 Project Number: DZT-1002 An Interactive Qualifying Project

1
Project Number: DZT-1002
An Interactive Qualifying Project Report:
Submitted to the Faculty of
WORCESTER POLYTECHNIC INSTITUTE
in partial fulfillment of the requirements for the
Degree of Bachelor of Science
By
Gregory Andujar _____________________________
Approved by Professor Dalin Tang, Project Advisor
___________________________________________

2
Abstract
With the use of resources that are available from the Internet, television as well
as text references, an eight-week stock-market simulation was conducted using different
trading strategies to investigate the different effects. The knowledge gained throughout
this simulation project will allow the investigator to become a more adept investor in the
future.
3
Table of Contents
Abstract ············································································································· 2
Table of Contents ································································································· 3
1 Introduction ··························································· 5 1.1 Goals for Simulation 5
1.2 History of Stock Market 6
1.3 How to invest 8
1.4 Risks and Payoffs of Investing 11
1.4.1 The Payoffs 11
1.4.2 The Risks 12
2 Penny Stock Trading ··················································13 2.1 Penny Stock Trading Method 13
2.2 Stocks Chosen 14
2.3 Trades Simulation 20
2.3.1 Week 1 20
2.3.2 Week 2 20
2.3.3 Week 3 20
2.3.4 Week 4 21
2.3.5 Week 5 21
2.3.6 Week 6 22
2.4 Conclusions and Results 22
3 Short Term Stock Market Trading ····························· 24 3.1 Short Term Stock Trading Method 24
3.2 Stocks Chosen 25
3.3 Trades Simulation 32
3.3.1 Week 1 32
3.3.2 Week 2 32
3.3.3 Week 3 33
4
3.3.4 Week 4 33
3.3.5 Week 5 33
3.3.6 Week 6 34
3.4 Conclusions and Results 34
4 Long Term Trading ·················································· 35 4.1 Long Term Trading Method 35
4.2 Stocks Chosen 36
4.3 Trades Simulation 38
4.3.1 Week 1 38
4.3.2 Week 2 39
4.3.3 Week 3 39
4.3.4 Week 4 39
4.3.5 Week 5 40
4.3.6 Week 6 40
4.4 Conclusions and Results 40
5 Conclusions ······························································ 41 5.1 Did I Meet My Goals 41
5.2 Comparison of Trading Methods 41
5.3 Summary of Project Experience 42
References ··································································· 43

5
1 Introduction
1.1 Goals for Simulation
The overall goal for the stock market simulation is to establish a firm
understanding in general concepts related to the stock market and investing. I
researched several different types of investment strategies and will run simulations to
test the observations. I will then explain in depth everything that leads to my results.
First, as one of my goals I will need to familiarize myself with the general
operations of the market and develop a working knowledge that will possibly help me in
future real life investments. Most of the general operations of the market include major
reasons for market fluctuations. I will talk about topics such as oil prices, interest rates,
etc in detail. I must examine the market for a few weeks before I make my initial
investments.
Second goal, I will determine all trends that I come across that will motivate me
to invest in the venture. I will use technical as well as fundamental analysis in order to
make intelligent investment decisions. I will also look at quarterly earnings and
statements that would justify further investigation into a company. Research will filters
out poor performing sectors of the market and helps me concentrate on the strong ones.
Once I have chosen a sector of the economy that historically has a strong performance, I
will examine the stocks placed within that sector. Then I will further filter the chosen
sector using specific criteria to determine the stronger stocks. Finally I will analyze the
company’s financial report and detailed background information in order to make an
educated decision on whether to buy or pass on the stock. All of this will help me avoid
naïve investment errors.
6
I will start with 6 stocks selected by using the above process. Then each pair of
stocks, the total being 3 pairs, will be treated individually using my selected methods as
well as techniques. This simulation will allow me to analyze the individual methods used
and make conclusion based on their individual performance. For this simulation I will
start with $35,000, then at the end of the six-week simulation I will compare and contrast
the profits, and losses from each method and thus determine which performed best and
would continue to perform better after the allotted period. The history of the stock market
and who trades in it will be discussed in the first chapter. After that the following
chapters, will discuss my different trading methods and their results. The final chapter
will be dedicated to what I have learned, conclude and my explanations for my
conclusion.
1.2 History of the Stock Market
Stock markets was not originally the super-sophisticated, simultaneous,
worldwide trading exchanges of today. Not until 1531 was it that the first institution in
Antwerp, Belgium roughly approximating a stock market emerged [1]. However, as
Investopedia says, this was, “…the first stock market, sans stock.” Rather than buying
and selling shares the brokers and lenders would meet to “deal in business, government
and even individual debt issues [6].”
Later in the 1600’s this changed when Britain, France, and the Netherlands all
began sending voyages to the East Indies. Since few explorers could gather the means
for conducting an overseas trade voyage, companies were formed to raise money from
investors, who received a share of profits based on their initial investment.
This business organization developed a form of risk management. Because as
India’s Imperial Gazette has reported, the earliest British voyages to the Indies were not

7
successful and resulted ships being lost and the personal fortunes of financier’s being
seized by creditors [7]. This led to London merchants forming a corporation in
September 1599, which would limit each member’s liability to the amount they each
invested, so that if the voyage failed, nothing else than this amount could be seized. The
Queen at the time gave the merchants a fifteen year charter in 1600, naming the
corporation the “Governor and Company of Merchants of London trading with the East
Indies [5]”, more commonly known as “The East India Company.” The formula proved
successful, getting King James I to grant charters to more companies by 1609 and
creating business growth in other port European countries. Yet it was the Dutch East
India company that actually first allowed outside investors to purchase shares entitling
them to a fixed percentage of the company’s profits, the first company to issue stocks
and bonds to the general public, thru the Amsterdam Stock Exchange in 1602 according
to Britannica[7].
As for Stock market trading in the United States it goes as far back as over 200
years in the form of colonial government bonds that were sold for the purpose of
financing the American Revolution and were to be paid at a profit to the buyer. During
the same time private banks were raising money by selling stocks in their company to
raise money for themselves. This was a new form of investing at the time and was a
good why to get richer for the wealthy. Later in 1792, a meeting between twenty-four
wealthy merchants resulted in the creation of the New York Stock Exchange (NYSE).
This was brought upon by the merchants agreeing to meet daily on Wall Street to daily
trade stocks and bonds.
Further on in the mid-1800s, United States was experiencing a rapid economic
growth. As these companies needed funds expand and meet the new demands on the
public they realized that investors would be interested in buying stock, as partial
ownership in the company. This as history has shown facilitated the expansion of

8
companies and the proved the great potential of the recently founded stock market to
both the investors and the companies.
By 1900, millions of dollars worth of stocks were traded on the street market. In
1921, after twenty years of street trading, the stock market moved indoors [5]. Then
came along the Industrial Revolution, which played a pivotal role in changing the face of
the stock market. From the development industrial revolution a new form of investing
began to emerge when initial investors started to realize that by re-selling the stock to
others who saw value in a company a profit could be made. This was the beginning of
the secondary market, which became known also as the speculators market. This part of
the market was more volatile than before, because it was now fueled by speculation
about the company’s future.
The NYSE acted as a more stable investment alternative, for people interested in
throwing their capital into the stock market arena. As for the smaller companies that
make up the stock market they formed into what would become the American Stock
Exchange (AMEX). Growth in the number of market participants led the government
deciding that more regulation of the stock market was needed to protect those investing.
Following the Great Crash in 1934 history was made when Congress passed the
Securities and Exchange Act [7]. The act formed the Securities and Exchange
Commission (SEC), which through the act and succeeding amendments regulates
American stock market trading with the help of the exchanges. It also includes
overseeing the requirements for a company to issue stock shares to the public and
ensures that the company offers relevant information to potential investors. The SEC
also oversees the daily actions of market exchanges and how they trade the securities
offered. Although historically, investing in stocks was a “hobby” for the rich, an average
person can know too realize the value of the investing in stocks vs. traditional assets like
land or a house.

9
1.3 How to Invest
Researching is not only the first thing to do but also the most important. When
researching an investment there are five documents you want to get your hands on to
research the potential of a stock:
The 10k– this is the annual filing with the Securities and Exchange Commission (SEC)
and is probably the single most important research document available to investors
about a company.
The most recent 10Q- a smaller version of the 10K that is filed at the end of each
quarter instead of each year.
Proxy statement– includes information on the Board of Directors as well as
management pay and shareholder proposals
The most recent annual report– read the report from the Chairman, CEO, and
sometimes CFO or other high-ranking officers to see how they view the business. Not all
annual reports are created equally.
A statistical showing going back five or ten years.
There are five types of assets an investor is likely to own:
Common stock- a form of corporate equity ownership, called "common" to distinguish it
from preferred stock. In the event of bankruptcy, common stock investors receive their
funds after preferred stock holders, bondholders, creditors, etc. On the other hand,
common shares on average perform better than preferred shares or bonds over time.
Preferred stocks- a hybrid between common stocks and a bond. Each share of
preferred stock is paid a dividend, which receives first priority and has dibs over the
common stockholders at the company's assets in the event of bankruptcy.
Bonds- consist of corporate bonds, municipal bonds, savings bonds, US government
treasuries and etc.

10
Money markets- highly liquid funds that are designed to protect your purchasing power
and is considered to be a cash equivalent.
Real estate investment trust or REITs- a special type of company designation that
allows no taxation at the company level provided more than 90% of earnings are paid
out to the shareholders. The assets are often invested in a variety of real estate projects
and properties.
Mutual funds- including exchange-traded funds, index funds and actively managed
funds.
The typical four major ways to invest in the market are through a 401k, an IRA,
brokerage account, or a dividend reinvestment plan (DRIP). For this purpose I am only
going to cover brokerage account plans.
Brokerage accounts allow you to purchase stocks bonds, mutual funds, and
other investments by paying professionals to buy or sell the items you tell them to. The
fee you pay them is called a "commission", and can range from as low as $5 to $10
dollars, to upwards of several hundred dollars. The difference in price arises when you
choose between either a discount or traditional broker. Traditional brokerages give a
wider range of services, and a price tag to match. They are along the lines of
professional money managers and can offer advice as to what investments could be
right for you. Discount brokers tailor to the more self-sufficient investor and thus don't
offer advice as to what to put your money into, leaving you to make your own financial
decisions and charging you much less than their traditional counterparts.
In opening a new account, the minimum investment can vary, usually ranging
from $500-$1,000. Most require commissions of $8-$30 and have easy-to-navigate web
sites. Almost all allow you to invest in mutual funds just as easily as in common stocks,
which is a big plus for those who are just getting involved in managing their own
finances. Once you have opened an account, you have the ability to invest your money.

11
1.4 Risks and Payoffs of Investing
1.4.1 The Payoffs
If you plan to invest in the share market, you will be relying predominantly on the
business activities of major public companies listed on the stock exchange for income
and capital growth. As these companies are in business to maximize profits; the more
profitable they become the greater the chance shareholders will come out in front.
Public companies listed on the stock exchange normally pay their shareholders
two dividends each year, an interim dividend and final dividend. This is great news if you
are seeking a regular income flow. As for stocks that have the capacity to increase in
value; it is possible for you to make a profit on the sale. You will mainly find capital
growth is dependent on a company’s capacity to continually grow its business. The more
profit it makes the greater the chance your annual dividend payments will increase. The
high liquidity of stocks since they can be sold within a matter of minutes of contacting a
stockbroker or instantly if you do the transaction on-line and you will ordinarily get your
money back within a few days of selling them. As share prices are published daily, you
can make a quick profit if your shares increase in value same as if they decrease to
minimize your losses. The brokerage fees stockbrokers charge in respect to buying and
selling shares is minimal. On-line brokers normally charge around 0.4 percent of the
purchase and sale price. There are no ongoing costs associated with owning shares
unlike in the case of any real estate you may own. Great news if you own a substantial
share portfolio. Also significant taxation benefits associated with investing in the share
market that may appeal to you.

12
1.4.2 The Risks
Share prices fluctuate daily in line with the prevailing market, which may not
appeal to you if your shares fall from the initial value purchased for. There are three
major risks associated with investing in the share market that you will need to be aware
of.
Decrease in value-You can lose a substantial sum if your share portfolio were to fall in
value. And there is no guarantee they will recover or that you will get back your initial
outlay. This means you will need to constantly monitor your share portfolio, and weed
out companies that are not performing to your satisfaction.
No Dividend Payments- The payment of a dividend is at the discretion of the company
directors. There is a risk if a company’s business activities were to decline that dividend
payments could fall or cease.
Liquidation- There is a risk a company could become insolvent and cease trading. If
this happens shareholders will rank last in terms of getting back their initial investment.
And there is no guarantee you will receive a payment.
To limit my exposure to potential poor performance it pays to invest in quality
blue chip companies that are trading profitably over a long period of time.

13
2 Penny Stock Trading
A penny stock refers to a share in a company that can trades for less than $5.00.
[5] This is the official definition, and is used by the Securities and Exchange
Commission, but for the most the held criteria applied by the general public and most
retail investors are share price being less than $1, and can even be a fractions of one
cent, a money cap of less than $50 million or less than $25 million, and trading on more
little known markets.
2.1 Penny Stock Trading Method
Going in the simulation, I did not know what to expect from my penny stocks
since they can be so volatile. A goal I have set is that I just want to come out even in
terms of money gained and lost. Another goal is that I wanted to make at least 4 trades
throughout this entire simulation. I also am making it a goal that I want to be fairly
aggressive so I can make some serious gains, since I did not want to sit on stocks and
hope for the best. Also a goal for my penny stocks was to set a price goal for certain my
stocks. Most importantly, my goal was to gain knowledge of the stock market and the
trading world. By doing research in the different sectors and companies, I learned a lot.
The stock market provides an opportunity to build your finances, but the chance to lose it
all is also present.
Quick gains and such make penny stock trading worthwhile. After researching,
some industries seemed to be more penny stock-friendly. A good industry with potential
was the Biotechnology and Drugs industry. Another industry was the Software and
Programming industry. This industry is huge. There are many companies, the funding is
very good, and there is plenty competition in the market allowing for new companies to

14
emerge and succeed. Put in the fact that industry is always evolving and technology is
constantly changing and getting better. This thus gives the market great potential for
cheap shares to that can increase rapidly, which makes it ideal for penny stock trading.
The last market was the Chemical Manufacturing industry. Many industries rely on the
chemical manufacturing industry to help run their business. New demands constantly
arise as well keeping the market very competitive. Creating potential for growth exists in
this industry. From my research I noticed that searching for penny stocks is a very broad
operation. Once I purchased a company, many decisions concerning the company to be
made in the upcoming weeks. With penny stocks, small gains/losses can add up very
quickly because of the large amount of money I was investing in each stock. Going into
the trading, I decided that I would not keep any stock for more than 2-3 weeks. The
companies I was investing in were considered “risky” because of the price, therefore I
did not want to sit and wait on a company for too long. Another reason was the fact that
our trading period was merely 7 weeks. In general, if the stock fell $0.15 below the price
it was purchased at, I would sell the stock and buy a new one. Still for when a stock
increases in price it is not as cut and dry, since I want to get as much out of my stocks
as I can.
2.2 Stocks Chosen
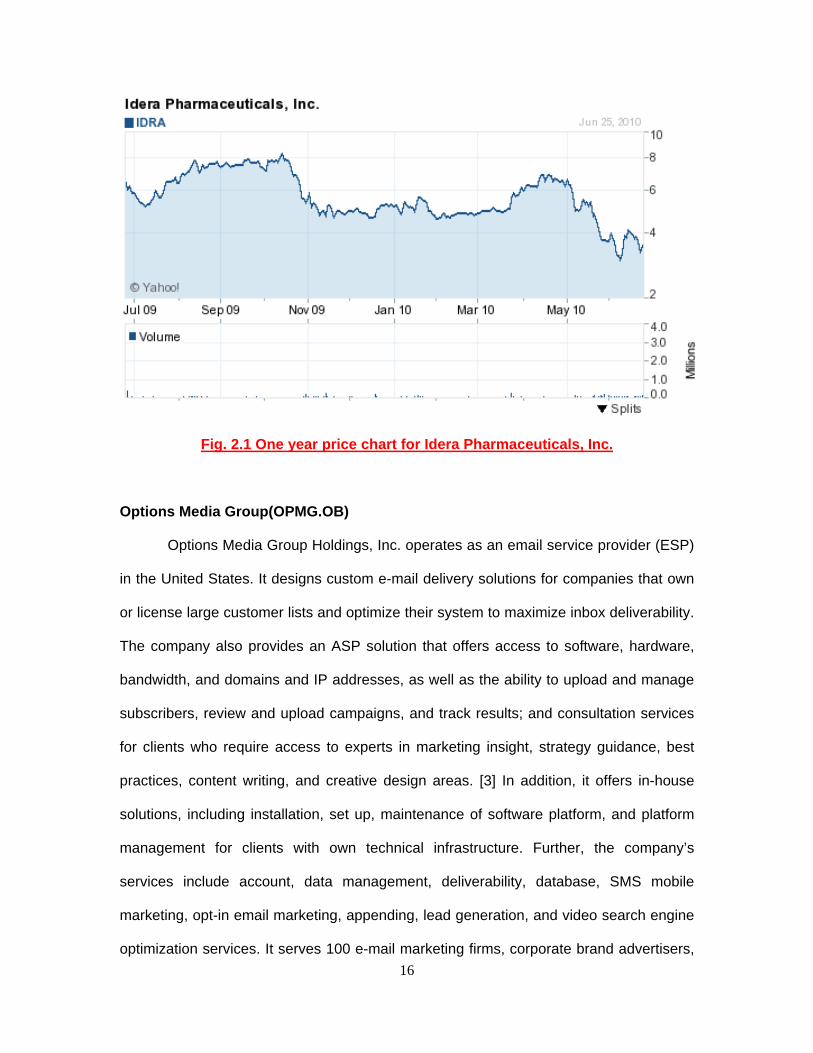
Idera Pharmaceuticals Inc. (IDRA)
Idera Pharmaceuticals, Inc., a biotechnology company, discovers and develops
DNA- and RNA-based drug candidates for the treatment of infectious diseases,
autoimmune and inflammatory diseases, cancer, and asthma and allergies, and for use
as vaccine adjuvants. The company designs and creates proprietary Toll-Like Receptors
(TLR) to modulate immune responses, including TLR agonist, a compound that

15
stimulates an immune response through the targeted TLR; and TLR antagonist, a
compound that blocks activation of an immune response through the targeted TLR. [3]
Its drug candidates include IMO-2125, a TLR9 agonist, which is in Phase 1 clinical trial
for hepatitis C virus infection; and TLR7, 8, and 9 agonists that are in research stage for
viral diseases. The company also develops IMO-3100, a dual TLR7/TLR9 antagonist,
which is in preclinical development stage for autoimmune and inflammatory diseases,
such as lupus, rheumatoid arthritis, multiple sclerosis, psoriasis, and colitis. In addition,
its drug candidates also comprise TLR7 and TLR8 agonists that are in research stage
for solid tumor cancers. The company has a licensing and collaboration agreement with
Merck KGaA to research, develop, and commercialize TLR9 agonists for the treatment
of cancer, excluding cancer vaccines; a license and research collaboration agreement
with Merck & Co., Inc. to research, develop, and commercialize therapeutic and
prophylactic vaccine products containing its TLR7, 8, and 9 agonists in the fields of
cancer, infectious diseases, and Alzheimer’s disease; and a research collaboration and
option agreement, and a license, development, and commercialization agreement with
Novartis International Pharmaceutical, Ltd. to discover, develop, and commercialize
TLR9 agonists for the treatment of asthma and allergies. [3] The company was founded
in 1989 and is based in Cambridge, Massachusetts.
16
Fig. 2.1 One year price chart for Idera Pharmaceuticals, Inc.
Options Media Group(OPMG.OB)
Options Media Group Holdings, Inc. operates as an email service provider (ESP)
in the United States. It designs custom e-mail delivery solutions for companies that own
or license large customer lists and optimize their system to maximize inbox deliverability.
The company also provides an ASP solution that offers access to software, hardware,
bandwidth, and domains and IP addresses, as well as the ability to upload and manage
subscribers, review and upload campaigns, and track results; and consultation services
for clients who require access to experts in marketing insight, strategy guidance, best
practices, content writing, and creative design areas. [3] In addition, it offers in-house
solutions, including installation, set up, maintenance of software platform, and platform
management for clients with own technical infrastructure. Further, the company’s
services include account, data management, deliverability, database, SMS mobile
marketing, opt-in email marketing, appending, lead generation, and video search engine
optimization services. It serves 100 e-mail marketing firms, corporate brand advertisers,

17
and agencies. Options Media Group Holdings, Inc. was founded in 2000 and is
headquartered in Boca Raton, Florida.
Fig. 2.2 One year price chart for Options Media Group
Intellicheck Mobilisa Inc (IDN)
Intellicheck Mobilisa, Inc. develops and markets wireless technology and identity
systems to mobile and handheld wireless devices for the government, military, and
commercial markets. The company’s commercial identification products include
IDvCheck, a document verification software for reading and verifying, in one swipe or
scan, the encoded format contained on the U.S. and Canadian driver licenses, state
issued non-driver identification cards, and military IDs. [3] Its defense security products
comprise Defense ID System that reads barcodes, magnetic stripes, and RFID and OCR
codes printed on identification cards to offer law enforcement personnel and military
security officers additional information for protecting their facilities. The company sells its
products directly, as well as through resellers and license agreements. Intellicheck

18
Mobilisa, Inc. was founded in 1994 and its headquarters is in Port Townsend,
Washington.
Fig. 2.3 One year price chart for IntellicheckMobilisa, Inc.
Wolfe Creek Mining, Inc.,
Wolfe Creek Mining, Inc. a development stage company, engages in the
recovery, separation, cleaning, and recycling of plastics. It intends to produce and supply
recycled commercial plastics to automotive and consumer product industries; and
construct plastics recycling facilities near automotive shredder locations. The company,
through its strategic partners, would also convert waste and scrap plastic into energy
products, such as synthetic oil. Wolfe Creek Mining, Inc. is based in Spokane,
Washington.

19
Fig. 2.1 One year price chart for Wolfe Creek Minning
Adventrx Pharmaceuticals, Inc. (ANX)
A specialty pharmaceutical company, focusing on in-licensing, developing,
and commercializing proprietary product candidates for the treatment of cancer.
Its lead product candidates include ANX-530, an emulsion formulation of
chemotherapy drug vinorelbine to treat advanced non-small cell lung cancer as a
single agent or in combination with cisplatin, as well as to treat advanced or
metastatic breast cancer; and ANX-514, an emulsion formulation of the
chemotherapy drug docetaxel for the treatment of breast, non-small cell lung,
prostate, gastric, and head and neck cancers. The company was founded in
1995 is headquartered in San Diego, California.

20
2.3Trades Simulation
2.3.1 Week 1
For the first week I choose two penny stocks that I believe to be very profitable
because of they’re past results. I started with a total of 5,000 dollars. For simplicity, I am
setting the brokerage fee to be zero.
Date Symbol Buy/ Sell
Price SharesNet Cost/Proceeds
Profit/Loss
Total Cash
Total Gain/Loss
6/7 IDRA Buy 3.67 500 1835 3145 6/7 OPMG.OB Buy 0.04 500 20 3125
Table 2.1 Week 1 Penny Stock Trading
2.3.2 Week 2
At the beginning of this week I choose to keep IDRA to sell my 500 OPMG.OB
shares at 0.03 since the price was stagnant at 0.03 for most of the previous week and
had a loss of 5. I then invested in 500 IDN shares at 1.43 costing 715 and then sold
them at 1.40 losing 15. So I decided to stay with only my 500 shares of IDRA, since the
company was still doing well for me.
Date Symbol Buy/ Sell
Price SharesNet Cost/Proceeds
Profit/Loss
Total Cash
Total Profit
6/14 IDRA 4.06 500 195 6/14 OPMG.OB Sell 0.03 500 15 -5 3140 6/14 IDN Buy 1.43 500 715 2425 6/16 IDN Sell 1.41 500 700 -15 3125
Table 2.2 Week 2 Penny Stock Trading
2.3.3 Week 3
To start the week I choose to invest in a very new company that just went public
on 4/05/2010 Wolf Creek Mining. I weighed the risks and decided that investing in a new

21
company like this one could truly reap the benefits of investing in a start up company. I
bought stocks in WCRM.OB at 1.00 each and plan on keeping it throughout the rest of
the week. When the week closed on 6/25 WCRM closed at 1.25 a stock giving me a
week’s gain of 500. And I sold my 500 shares of IDRA at 3.87 a total of 1935 a gain of
100
Date Symbol Buy/ Sell
Price SharesNet Cost/Proceeds
Profit/Loss
Total Cash
Total Profit
6/21 IDRA Sell 3.87 500 1935 100 5060 80 6/21 WCRM.OB Buy 1.00 2000 2000 3040 6/25 WCRM.OB 1.25 2000 3040 500
Table 2.3 Week 3 Penny Stock Trading
2.3.4 Week 4
Since I saw such a large spike in my WCRM.OB stock I choose to sell and not
take a chance with the volatility of this type of stock and sold all 2000 stocks at 1.50 for a
total of 3000 a gain of 1000 dollars. On that same day I went back to one of my old stock
picks IDN, which I bought at 2000 shares at 1.55 and sold the stock on 6/30 for 1.59 a
share giving a gain of 80 dollars
Date Symbol Buy/ Sell
Price SharesNet Cost/Proceeds
Profit/Loss
Total Cash
Total Profit
6/29 WCRM.OB Sell 1.50 2000 3000 1000 6040 6/29 IDN Buy 1.55 2000 3100 2920 6/30 IDN Sell 1.59 2000 3180 80 6100 1100
Table 2.4 Week 4 Penny Stock Trading
2.3.5 Week 5
After the large profit I made with WCRM.OB I choose to invest in a biotech
company ANX because I would not take much damage from any company I invested in
since I am already up over 1000 dollars on my original total cash I began with. This

22
investment proved to be profitable and sold on 7/9 for 1.64 a share a profit of 260
dollars.
Date Symbol Buy/ Sell
Price SharesNet Cost/Proceeds
Profit/Loss
Total Cash
Total Profit
7/6 ANX Buy 1.51 2000 3020 3100 7/9 ANX Sell 1.64 2000 3280 260 6400 1400
Table 2.5 Week 5 Penny Stock Trading
2.3.6 Week 6
Beginning this week I looked at the ANX stock that I had just sold at the close of
the previous week and saw that stock was on the up swing and thus I bought 2000
shares at 1.70 on 7/12 and then sold my shares for 1.91 on 7/14, unfortunately missing
the opportunity to sell the stock at a high price of 2.04 on 7/13. Despite missing out on
this I still managed to make a profit of 420 dollars.
Date Symbol Buy/ Sell
Price SharesNet Cost/Proceeds
Profit/Loss
Total Cash
Total Profit
7/12 ANX Buy 1.70 2000 3400 2980 7/14 ANX Sell 1.91 2000 3820 420 6800 1800
Table 2.6 Week 6 Penny Stock Trading
2.4 Conclusions and Results
My results after the 6 week trading simulation of my penny stocks was anything
but what I expected because despite it being very volatile I was still able to make a good
amount of profit. When investing in the stock market, the goal of any investor is to add to
the money that he/she already has, or at least break even. My main concern was to
break even and yet I surpassed this. I was able to do this by staying on top of things
constantly keeping track of everything and making as many trades as I saw fit so that I

23
would not loose money. Ultimately my main goal was to gain a better understanding of
the stock market and penny stock trading, which was certainly achieved. I was a first
time trader, making this a learning process from beginning to end.
Starting the simulation I was very happy with the initial stocks that I chose since I
felt I made sufficient research on each company. But what I truly believe help me was
that I took a very aggressive when I came to selling when a my stock holdings were not
doing to well. I just did not want to hold on to a stock for to long and then find that I was
losing my money rather than making money. However, in some cases, I didn’t hold on
to a stock long enough and missed an opportunity to produce more income. What truly
helped this was that I made it my job to constantly check on my shares, yet there were
some days where I neglected to check the price of my stock. My main reasoning being
the volatile nature of penny stocks, creates a small window of opportunity for profit and
thanks to my surveillance of the my stocks a was able to make profit.
All in all my experience with penny stock trading was a very good one.
And know my new goal for future trading is to apply the knowledge to turn my gains into
even bigger gains.

24
3 Short Term Stock Trading
Short-term trading can be very lucrative, but also risky. It can last for as little as a
few days to as long as several days or weeks. To succeed at this strategy, traders must
understand the risks and the rewards of each trade. They must not only know how to
spot good short-term opportunities, but also must be able to protect themselves from
unforeseen events. In this section, I will examine the basics of spotting good short-term
trades and show how to profit from them.
3.1 Short Term Stock Trading Method
Short Term Stock Trading is considered to be the safest form of stock trading. As
in daytime trading the stock is held for a short time but what differs with short term
trading is that the stock is usually held for at least a few days and not just for a few
hours. This is termed short position, which is longer than one day and usually holding
position is about two days but from time to time it can last even for weeks and months.
When one says short position means selling a stock in expectation of the moment when
the price of the sold stock will fall and the trader will buy this stock once again but at a
lower price than he sold it. A common strategy within short-term trading, which is called
stock pick is when a trader analyses a certain stock which can be profitable for future
gain. [1] The stock can be held for both long and short time periods depending on the
trader’s analysis of the stock invested on. Stock picking can be complicated since there
is no way in which a trader can determine a stock’s future price. And that’s why careful
analysis and monitoring is your only guarantee of success in stock trading.
25
3.2 Stocks Chosen
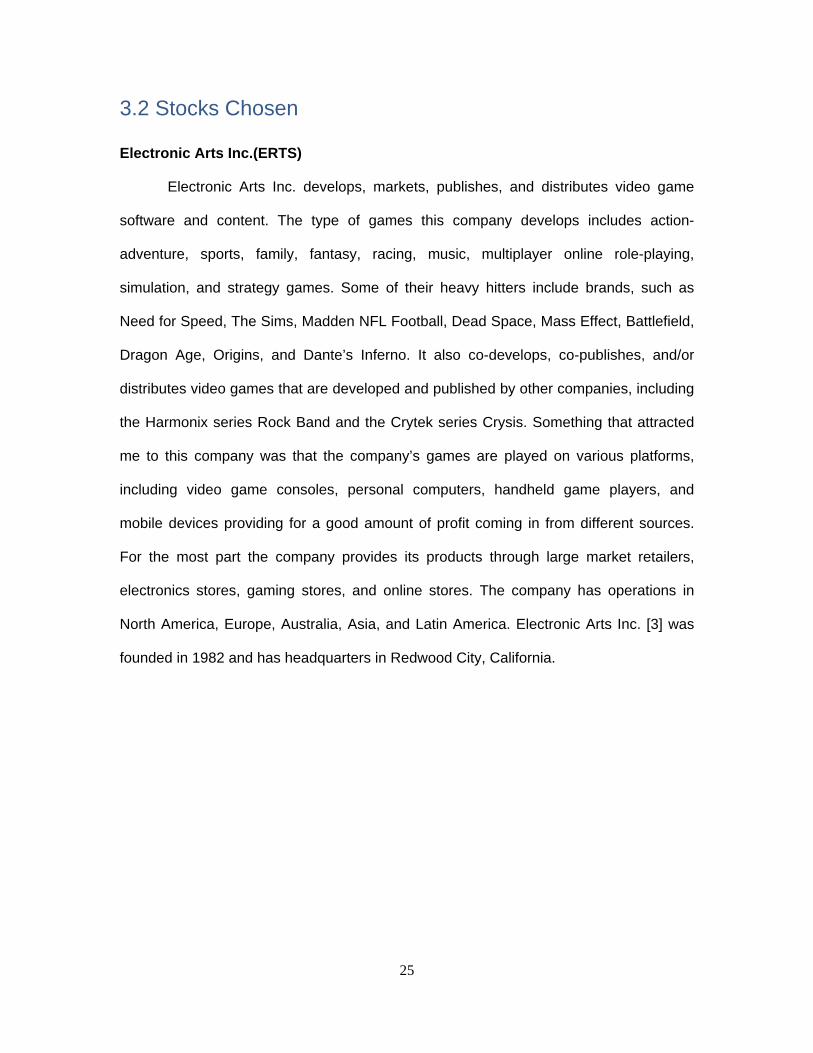
Electronic Arts Inc.(ERTS)
Electronic Arts Inc. develops, markets, publishes, and distributes video game
software and content. The type of games this company develops includes action-
adventure, sports, family, fantasy, racing, music, multiplayer online role-playing,
simulation, and strategy games. Some of their heavy hitters include brands, such as
Need for Speed, The Sims, Madden NFL Football, Dead Space, Mass Effect, Battlefield,
Dragon Age, Origins, and Dante’s Inferno. It also co-develops, co-publishes, and/or
distributes video games that are developed and published by other companies, including
the Harmonix series Rock Band and the Crytek series Crysis. Something that attracted
me to this company was that the company’s games are played on various platforms,
including video game consoles, personal computers, handheld game players, and
mobile devices providing for a good amount of profit coming in from different sources.
For the most part the company provides its products through large market retailers,
electronics stores, gaming stores, and online stores. The company has operations in
North America, Europe, Australia, Asia, and Latin America. Electronic Arts Inc. [3] was
founded in 1982 and has headquarters in Redwood City, California.

26
Fig. 3.1 One year price chart for Electronic Arts, Inc.
Blackboard Inc,(BBBB)
Blackboard Inc. founded in 1997 and its home offices in Washington, the District
of Columbia, provides enterprise software applications and related services to the
education industry in the United States. It offers Blackboard Learn, a Web-based
teaching and learning platform, which comprises Course Delivery Module that allows
educational institutions to support an online teaching and learning environment and
other software directed to the use of this Product. Further, the company provides
professional services comprising training, implementation, installation, maintenance, and
other consulting services. It serves colleges, universities, schools and other education
providers, textbook publishers, student-focused merchants, and corporate and
government clients.

27
Fig. 3.2 One year price chart for Blackboard, Inc.
Digital Globe Inc.(DGI)
Digital Globe, Inc. provides commercial earth imagery products and solutions.
The company collects its imagery products and services via its three high-resolution
imagery satellites. It provides a range of on- and off-line distribution options, which
enable customers to access and integrate the company’s imagery into their business
operations and applications, including desktop software applications; Web services that
provide direct on-line access to its content archive; file transfer protocol; and physical
media, such as CD, DVD, and hard drive. The company also offers its imagery through
direct access program that allows certain customers, approved by the U.S. government,
to task and downlink data directly from its satellites. Digital Globe’s principal customers
include the U.S. and foreign defense and intelligence agencies, and various commercial
customers, such as Internet portals, companies in the energy and telecommunications
sector, utility and agricultural industries, and the U.S. and foreign civil government
agencies. The company was formerly known as Earth Watch, Incorporated and changed

28
its name to Digital Globe, Inc. in August 2002. Digital Globe was incorporated in 1994
and its headquarters in Longmont, Colorado.
Fig. 3.3 One year price chart for DigitalGlobe, Inc.
Clean Diesel Technologies Inc. (CDTI)
Clean Diesel Technologies, Inc. founded in 1994 and its central offices in
Bridgeport, Connecticut, designs, develops, markets, and licenses technologies and
solutions for the emission reduction market. The company’s technologies and solutions
reduce harmful emissions from internal combustion engines while improving fuel
economy and engine power. Its products and solutions include the Platinum Plus fuel-
borne catalyst, a diesel fuel soluble additive that reduces particulates, unburned
hydrocarbons, and carbon monoxide emissions. [3] The company sells its products to
distributors and resellers, as well as to various transportation segments, including on-
road, off-road, rail and marine, and other end users. Clean Diesel Technologies offers its
products through its distribution network, direct sales, sales consultants, and agents
primarily in the United States, Europe, and Asia.

29
Fig. 3.4 One year price chart for Clean Diesel Technologies, Inc.
Asure Software (ASUR)
Forgent Networks, Inc. which does business as Asure Software, operates as the
provider of Web-based workforce management solutions that enable organizations to
manage office environment, as well as their human resource and payroll processes
worldwide. The company under the trade name iEmployee, offers Web-based solutions,
which include time and attendance, timesheets, human resource benefits, expenses,
and others. Its Net Simplicity product line provides solutions to common office
administration problems. [3] This product line’s principal product, Meeting Room
Manager, automates the entire facility scheduling processes, such as reserving rooms,
requesting equipment, ordering food, sending invitations, and reporting on the meeting
environment. Forgent sells its software products and services through direct Web and
telesales model. The company was founded in 1985 and has its home offices in Austin,
Texas
30
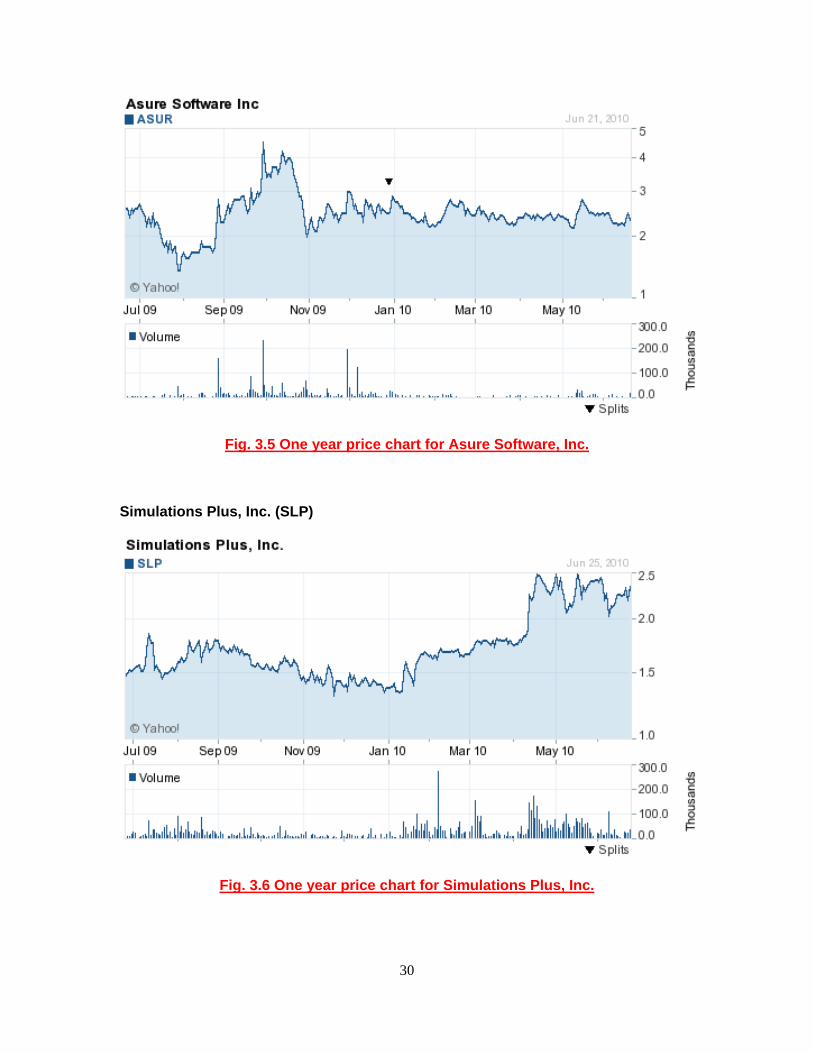
Fig. 3.5 One year price chart for Asure Software, Inc.
Simulations Plus, Inc. (SLP)
Fig. 3.6 One year price chart for Simulations Plus, Inc.

31
Ubisoft Entertain. (UEN.F)
A French computer and video game publisher and developer, partially owned by
Electronic Arts (20%) but still independent, with headquarters in Montreuil-sous-Bois,
France. The company has a worldwide presence with studios in 17 countries and
subsidiaries in 28 countries. As of 2008, it was the third-largest independent video game
publisher in Europe, and the fourth largest in the United States. Ubisoft's revenue for
2002-2003 was 453 million euro; for fiscal year 2003-2004, this grew to €508 million. [3]
As of 2009, Ubisoft employed more than 5,750 people, of which over 4,800 are classed
as working in production. The company's largest development studio is Ubisoft Montreal,
which in 2004 employed approximately 1,600 people. [3] Yves Guillemot, a founding
brother, was the chairman and CEO. As for 2008–2009, Ubisoft's revenue was €1,058
million, reaching the 1 billion euro milestone for the first time in its history.
Fig. 3.7 One year price chart for Ubisoft Entertain.

32
3.3 Trades Simulation
3.3.1 Week 1
For this week I decided to just see how much profit these two companies could
make for me. I started with 15,000 dollars. For simplicity the brokerage fee is being set
to zero.
Date Symbol Buy/ Sell
Price SharesNet Cost/Proceeds
Profit/Loss
Total Cash
Total Profit
6/7 ERTS Buy 15.81 500 7905 7075 6/7 BBBB Buy 38.92 100 3892 3163
Table 3.1 Week 1 Short Term Trading
3.3.2 Week 2
After the first week of having both my ERTS and BBBB stocks I sold my stocks in
the two respective companies at 16.29 for ERTS shares and at 38.69 for BBBB shares
this came to a combined total of 12,014 giving me a profit of 217. I then invested into
Digital Globe Inc. 500 shares at 25.96 on the same day 6/14 and then sold the stocks for
26.12 on 6/16 for a total of 13060 making a profit of 80. I then invested in Clean Diesel
Technologies Inc. for 10000 shares at 1.20 and sold at 1.11 a total of 11100 and lost
900 it the next day because of the money I lost investing on 6/17. I ended the week by
buying 4700 shares in Asure Software Inc. at 2.36.
Date Symbol Buy/ Sell
Price SharesNet Cost/Proceeds
Profit/Loss
Total Cash
Total Profit
6/14 ERTS Sell 16.29 500 8145 +240 11308 240 6/14 BBBB Sell 38.69 100 3869 -23 15177 217 6/14 DGI Buy 25.96 500 12980 2217 6/16 DGI Sell 26.12 500 13060 +80 15277 297 6/16 CDTI Buy 1.20 10000 12000 3277 6/18 CDTI Sell 1.11 10000 11100 -900 14377 -603 6/18 ASUR Buy 2.36 4700 11092 3285
Table 3.2 Week 2 Short Term Trading

33
3.3.3 Week 3
This week I choose to take a risk and ride this stock out through the first half of
the week and then sold my holding of 4700 stocks in ASUR at 2.25 each for a loss of
517 on 6/23. On that same day I bought holdings in SLP, which was doing well for the
past couple of weeks. I bought a total of 4800 stocks at 2.20 for a total of 10560.
Date Symbol Buy/ Sell
Price SharesNet Cost/Proceeds
Profit/Loss
Total Cash
Total Profit
6/23 ASUR Sell 2.25 4700 10575 -517 13860 -1120 6/23 SLP Buy 2.20 4800 10560 3300
Table 3.3 Week 3 Short Term Trading
3.3.4 Week 4
To begin this week I choose to Sell SLP and buy stock in CDTI at 1.00 a
company I had previously invested in.
Date Symbol Buy/ Sell
Price SharesNet Cost/Proceeds
Profit/Loss
Total Cash
Total Profit
6/28 SLP Sell 2.45 4800 11760 1200 15060 80 6/29 CDTI Buy 1.00 10000 10000 5060
Table 3.4 Week 4 Short Term Trading
3.3.5 Week 5
This week on 7/6 I choose to sell my stake in CDTI at 1.10 and made a 1000
dollar. The next day I invested in UEN.F at 6.41 a video game company I believe will be
profitable.
Date Symbol Buy/ Sell
Price SharesNet Cost/Proceeds
Profit/Loss
Total Cash
Total Profit
7/6 CDTI Sell 1.10 10000 11000 1000 16060 1080 7/7 UEN.F Buy 6.41 2000 12820 3240
Table 3.5 Week 5 Short Term Trading

34
3.3.6 Week 6
Seeing potential in my UEN.F stock I kept my shares in the company, I also
chose to stay with the company because I didn’t want to take chances with a new
company. I sold my shares on 7/16 at 6.85 for a profit of 880 dollars.
Date Symbol Buy/ Sell
Price SharesNet Cost/Proceeds
Profit/Loss
Total Cash
Total Profit
7/16 UEN.F Sell 6.85 2000 13700 880 16940 1940
Table 3.6 Week 6 Short Term Trading
3.4 Conclusions and Results
For the most part the simulation went pretty well yet at times I had to part with
stocks that were losing money. By watching the market daily I was able to buy in
generally low trends or at constant up trends depending on the stock. The few I lost
money I sold them before too much damage has been done. I have learned a lot through
our simulation and it was very interesting to see how different stocks would do in the
market. I found that there were a few that if you felt like taking a chance, they would
sometime prove to be a very good investment but sometimes a bad investment. In the
end I only made dollars from the simulation. Not a considerable amount but not too bad
for some one who has never traded before.
This simulation by far proved to be the most challenging for me because at times
I had to comeback from a very large deficit of over 1,000 dollars, which if I was dealing
with real money would both hurt my pockets and psyche. Over all a good experience as
to what to and not to do for future trading in devours.

35
4 Long Term Trading
Long term trading has several significant advantages, including the effects of
compounding, the opportunity to earn from dividends, reduction of the impact of price
fluctuations, the ability to make corrections in a more timely manner, less time spent
monitoring stocks.
4.1 Long Term Trading Method
When it comes to this type of trading time can be an investor’s best friend
because it gives compounding time to work its magic. Holding a stock to take advantage
of payouts from dividends is another way to increase the value of ones investment.
Companies can offer the ability to reinvest dividends with additional share purchases
increasing the overall value of your investment. [1] In the long term investment you are
less affected by short term volatility. The market tends to address all factors that keep
changing in the short term. So a person involved in long term investment or trading will
not be affected as much by short term instability due to factors such as liquidity. In the
long term, good stocks, which may have been affected due to some other factors, will
give better than average returns. Long-term investors, especially those who invest in a
diversified portfolio, can ride out down markets without dramatically affecting their ability
to reach their goals.
Simply investors that begin early and stay in the market have a better chance of
riding out the bad times and capitalizing on the periods when the market is rising.

36
4.2 Stocks Chosen
Nike, Inc. Common Stock (NKE)
Nike, Inc. designs, develops, and markets footwear, apparel, equipment, and
accessory products worldwide. The company provides shoes for running, training,
basketball, soccer, aquatic activities, baseball, football, cheerleading, golf, lacrosse,
outdoor activities, skateboarding, tennis, volleyball, walking, wrestling, and other athletic
and recreational uses. The company also offers sports-inspired apparel, athletic bags,
accessory items and a line of performance equipment, including bags, socks, sport
balls, eyewear, timepieces, electronic devices, bats, gloves, protective equipment, golf
clubs, and various more for sports activities. The company also markets its products
under the brand names of Converse, Chuck Taylor, All Star, One Star, Umbro, Jack
Purcell, Cole Haan, Bragano, and Hurley. It sells its products to retail accounts through
stores, independent distributors, and licensees, as well as through its Website,
nikestore.com. As of May 31, 2009, Nike, Inc. operated 338 retail stores in the United
States and 336 retail stores internationally. [3] The company was founded in 1964 and
has its headquarters in Beaverton, Oregon. en la bodega as usual, and every1 doing
good

37
Fig. 4.1 One year price chart for Nike, Inc.
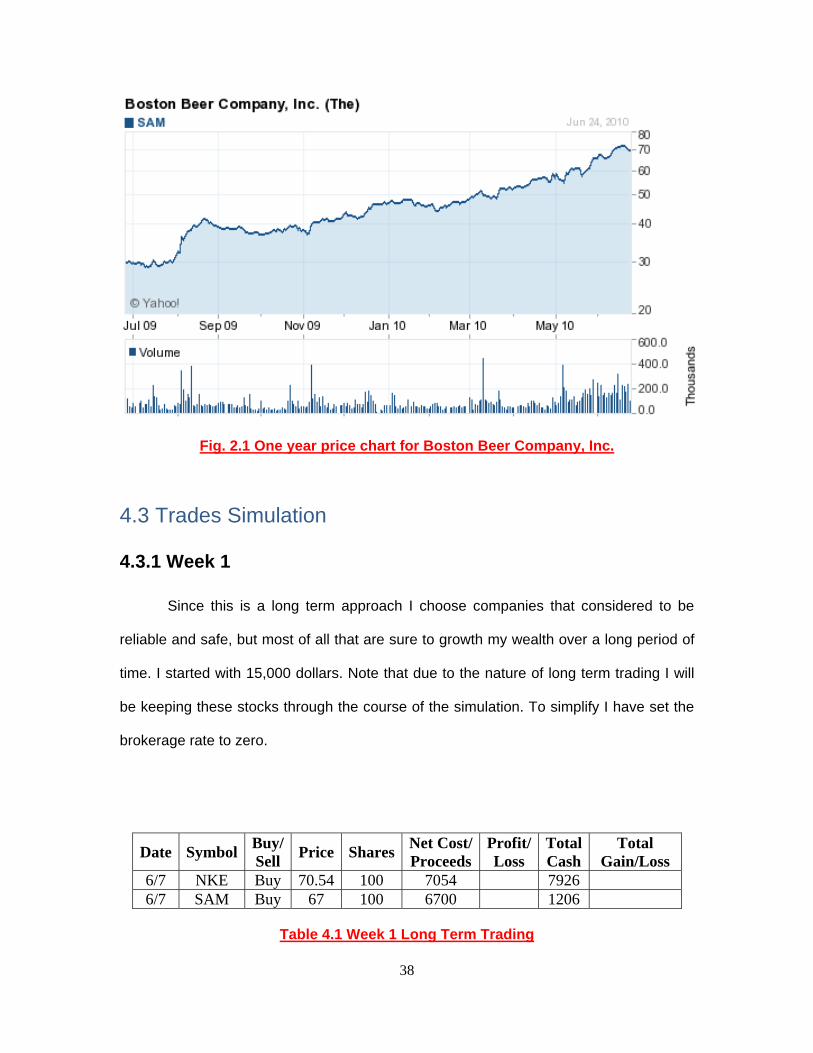
Boston Beer Company, Inc. (SAM)
The Boston Beer Company, Inc. makes low alcohol beverages primarily in the
United States, Canada, Europe, Israel, the Caribbean, the Pacific Rim, and Mexico. The
company markets approximately 20 beers under the ‘Samuel Adams’ or the ‘Sam
Adams’ brand names; 8 flavored malt beverage products under the ‘Twisted Tea’ brand
name; and 1 hard cider product under the ‘HardCore Cider’ brand name. It also
produces malt beverages and hard cider products under contract for third parties. The
company sells its products to a network of wholesale distributors, who then sell to
retailers, such as pubs, restaurants, grocery chains, package stores, stadiums, and
other retail outlets. The Boston Beer Company, Inc. was founded in 1984 and is based in
Boston, Massachusetts.
38
Fig. 2.1 One year price chart for Boston Beer Company, Inc.
4.3 Trades Simulation
4.3.1 Week 1
Since this is a long term approach I choose companies that considered to be
reliable and safe, but most of all that are sure to growth my wealth over a long period of
time. I started with 15,000 dollars. Note that due to the nature of long term trading I will
be keeping these stocks through the course of the simulation. To simplify I have set the
brokerage rate to zero.
Date Symbol Buy/ Sell
Price SharesNet Cost/Proceeds
Profit/Loss
Total Cash
Total Gain/Loss
6/7 NKE Buy 70.54 100 7054 7926 6/7 SAM Buy 67 100 6700 1206
Table 4.1 Week 1 Long Term Trading

39
4.3.2 Week 2
Since last week NKE has gone from 70.54 to 72.49 gaining a 195 for my 100
shares. As for SAM it also went up from 67 to 70.49 a gain of 349 on my 100 shares.
Date Symbol Buy/ Sell
Price SharesNet Cost/Proceeds
Profit/Loss
Total Cash
Total Gain/Loss
6/14 NKE 72.49 100 7249 1206 195 6/14 SAM 70.49 100 7049 1206 349
Table 4.2 Week 2 Long Term Trading
4.3.3 Week 3
So far my stocks have risen in price since last week NKE went up to 74.35 per
share and SAM has gone up to 72.79 a share.
Date Symbol Buy/ Sell
Price SharesNet Cost/Proceeds
Profit/Loss
Total Cash
Total Gain/Loss
6/21 NKE 74.35 100 7435 1206 381 6/21 SAM 72.79 100 7279 1206 579
Table 4.3 Week 3 Long Term Trading
4.3.4 Week 4
This week both my stock in each company have dropped since last week NKE
by 4.72, dropping 0.91 from the price I originally bought my shares at. As for SAM the
pirce per share also dropped from 72.79 to 70.24 a difference of
Date Symbol Buy/ Sell
Price SharesNet Cost/Proceeds
Profit/Loss
Total Cash
Total Gain/Loss
6/28 NKE 69.63 100 6963 1206 -91 6/28 SAM 70.24 100 7024 1206 324
Table 4.4 Week 4 Long Term Trading

40
4.3.5 Week 5
For the second week in a row my shares in NKE and SAM have dropped giving
me total loss of 512 from the original amount I bought the shares for.
Date Symbol Buy/ Sell
Price SharesNet Cost/Proceeds
Profit/Loss
Total Cash
Total Gain/Loss
7/6 NKE 66.34 100 6634 1206 -420 7/6 SAM 66.08 100 6608 1206 -92
Table 4.5 Week 5 Long Term Trading
4.3.6 Week 6
Though both NKE and SAM proved to be profitable although the amount of profit
over the six week span was very minimal.
Date Symbol Buy/ Sell
Price SharesNet Cost/Proceeds
Profit/Loss
Total Cash
Total Profit
7/16 NKE Sell 70.35 100 7035 8261 7/16 SAM Sell 68.49 100 6849 15110 110
Table 4.6 Week 6 Long Term Trading
4.4 Conclusions and Results
In order to keep true to the nature of long term trading I decided to maintain the
stocks that I originally bought throughout the 6 week simulation span because I believe
the companies I had chosen to be very good reputable companies whose products
speak for themselves. This proved to be a very nail biting experience especially when I
was seeing my money slowly dwindle away at times hoping that the next day the stock
will go up. Overall the amount of profit was very little but at least I didn’t lose any money.

41
5 Conclusions
5.1 Did I Meet My Goals
I set up project goals and personal goals that I believed were reasonable to
achieve in the term long project. Project goals were to complete a successful simulation,
hopefully at least break even, have a better grasp of stock trading. A personal goal was
the fact that I wanted to come out on top and earn the most money that I possibly could.
In order to prove that in fact their type of trading policy was and is the best.
I feel that my goals for the project were met. I learned about trading in the stock
market. I learned how to research stocks and how to trade them.
The preceding project was a three term project which culminated into an IQP
report. This project is supposed to teach students about the stock market. During our
three terms doing this project we researched the market find out how it works. Then we
will each chose a different type of trading policy. After choosing our policy we started a
simulation that lasted about three months. When the simulation was done we compared
and contrasted what method has done the best, and which method earned the most
money.
5.2 Comparison of Trading Methods
Comparatively short term trading did the best over our simulation period. This
may be due to the fact that since the simulation was short other methods didn’t have
time to reach their full potential. Penny stock trading was very close to short term trading
because of the similarities in the holding time of the stocks. Long term trading comes in

42
third with a profit gain of just a little over 100 dollars. This method didn’t do well because
in order to make money with this method the stocks need to be held onto longer than 10
weeks, which is much longer than time span I had for my simulation.
Method
Gains
Losses Net Result% Increase
on initial investment
Penny Stock Trading 1800 0 1800 36% Short Term Trading 1940 0 1940 12.93% Long Term Trading 110 0 110 0.73%
Totals 3850 0 3850 11%
Table 5.1: Comparison of Gains and Losses
5.3 Summary of Project Experience
From beginning to end this project was a great learning experience. I learned
about the market and how it works. And now when I actually plan to invest in the future I
can use the knowledge that was gained from this project. Now I feel that if I do invest in
stocks we will be able to make some money based on what I did in this project. A
familiarity of the market is something that aids any investor from an expert to the person
sitting at home trading on their computer.

43
References
1. Fundamentals of the Stock Market, Wyss, B. Oneill, McGraw Hill, New York ©
2001
2. http://www.moneycentral.msn.com/
3. http://finance.yahoo.com/
4. http://www.nasdaq.com
5. http://www.wikipedia.com
6. http://www.investopedia.com
7. http://www.britannica.com