1 Prevalence and Correlates of HIV Risk Behaviors of Inmates in a State Prison System Titilayo...
27
1 Prevalence and Correlates of HIV Risk Behaviors of Inmates in a State Prison System Titilayo Abiona, MD, FMCPH Adedeji Adefuye, MD, MPH, FRIPH Joseph Balogun, PT, PhD, FACSM Patricia Sloan, EdD, RN, FAAN College of Health Sciences, Chicago State University
-
Upload
kaliyah-cage -
Category
Documents
-
view
218 -
download
5
Transcript of 1 Prevalence and Correlates of HIV Risk Behaviors of Inmates in a State Prison System Titilayo...

1
Prevalence and Correlates of HIV Risk Behaviors of Inmates in a
State Prison System
Titilayo Abiona, MD, FMCPH Adedeji Adefuye, MD, MPH, FRIPHJoseph Balogun, PT, PhD, FACSM Patricia Sloan, EdD, RN, FAAN
College of Health Sciences, Chicago State University

2
Background
• Higher HIV/AIDS rates among inmates vs. general population
• HIV prevalence ~ 4 & 10x higher among inmates than in the general population
• What is the exact mechanism linking incarceration with HIV infection?

3
Conceptual Model1.
HIV infected and uninfected persons in the community
go to prison-Risk Behaviors
2. Some inmates get
HIV in prison-Risk Behaviors
3. HIV infected and
uninfected inmates released
into the community
4.HIV transmission occurs from infected inmates
to uninfected partners and vice versa
-Risk Behaviors

4
Background
• Inmates engage in risk behaviors before, during & after incarceration
• Examining risk behaviors of inmates is essential for understanding the role of incarceration in HIV infection

5
Specific Objectives
• Describe pre-incarceration risk behaviors of inmates
• Identify and quantify risk behaviors during incarceration
• Determine the socio-demographic characteristics associated with risk behaviors during incarceration
6
Methods
• Study Location– 17 randomly selected Illinois Correctional Facilities
• Study Design– Cross-Sectional Descriptive
• Study Population– Male and female inmates – 18 years of age or older– Continuously incarcerated for at least six months– Able to speak and write English

7
Methods• Sample Size Determination
– Computer Programs for Epidemiologists (PEPI) version 4.0– A minimum sample size of 1025 was calculated – Over-sampling done to adjust for non-participation– 2,000 inmates finally selected
• Multi-stage sampling technique• Data collected with a structured questionnaire• Statistical Analysis: SPSS 15. Descriptive and Inferential
Analysis done• Study protocol approved by the CSU IRB

8
Results• 1,819 participants: 1, 293 (71.1%)men and 526
(28.9%) women completed the survey• Response rate = 91%• Overall average response rate to survey
questions = 96%• Number of participants that responded to each
question varied• 71% (1293)of participants were men

9
Table 1: Socio-demographic Characteristics of ParticipantsCharacteristic Women,% n=526 Men, % n=1293 P-Value
Mean Age (SD) 36.4 (9.7) 35.4 (10.1) 0.05
Marital StatusNever MarriedMarried/CohabitingPreviously Married
50.121.928.0
56.119.724.2
0.07
EthnicityWhiteAfrican AmericanHispanic/LatinoOther (Native Americans etc)
39.151.34.65.0
26.657.211.05.2
<0.001
No. of Times Incarcerated1-34-67 and more
85.212.82.0
77.617.35.1
<0.001

10
Table 1: Sociodemographic Characteristics of Participants Cont’d
Characteristic Women,% n=526
Men, % n=1293
P-Value
No. of Years Spent in Prison during Current Sentence<11-34-67 or more
40.130.910.818.2
20.929.816.732.0
<0.001
Ever Had HIV TestingYesNo
91.18.9
84.515.5
<0.001

11
Table 2: Pre-Incarceration Risk BehaviorsBehavior Sample
SizeFrequency Percentage
2 or more Vaginal Partners in the 6 months before arrest
1762 1037 58.9
2 or more Anal Partners in the 6 months before arrest
1741 333 19.1
Never/Rarely Used Condoms for Vaginal Sex in the 6 months before arrest
1653 1097 66.4
Never/Rarely Used Condoms for Anal Sex in the 6 months before arrest
781 547 70.0
Ever Injected Drugs 1740 255 14.7
Ever Shared Needles 255 142 55.7
Obtained Tattoo from non-professional artist 1100 799 72.6
Obtained Body Piercing from non-professional artist
878 364 41.4

12
Figure 1: % of Respondents who never/rarely used Condoms in the 6 Months before Arrest
Vaginal Sex Anal Sex0
20
40
60
80
100
64.8 69.769.6 70.8
Male Female
P < 0.05
13
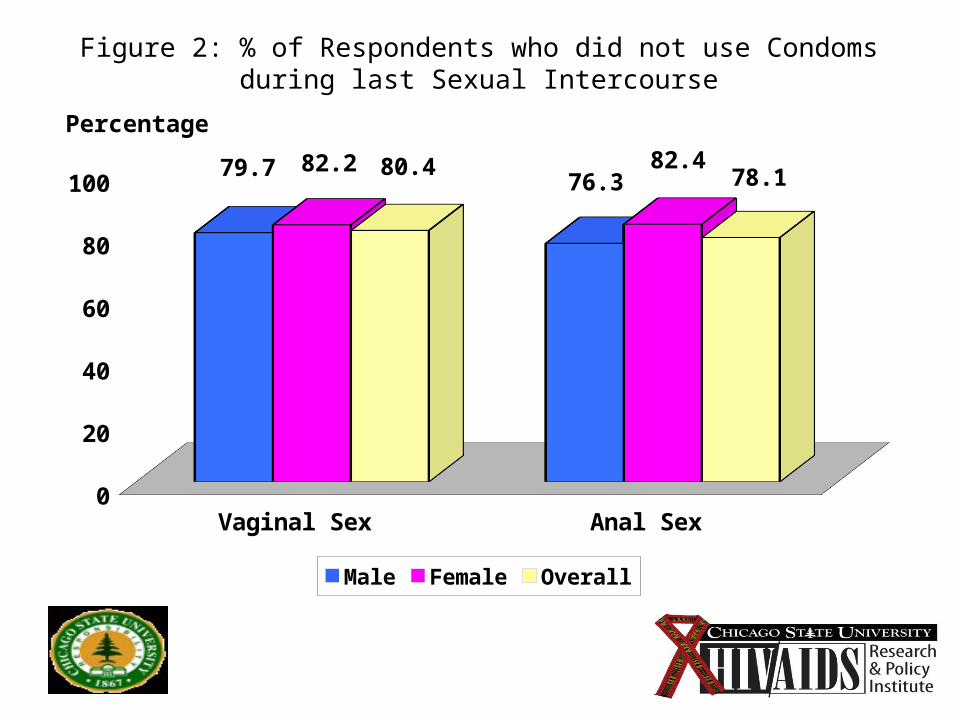
Figure 2: % of Respondents who did not use Condoms during last Sexual Intercourse
Vaginal Sex Anal Sex0
20
40
60
80
100 79.776.3
82.2 82.480.4 78.1
Male Female Overall
Percentage

14
Figure 5: % of Respondents who had ever Injected Drugs
Male Female0
5
10
15
20
25
12.1
20.5
P < 0.001
Percentage

15
Figure 9 % of Respondents who obtained Tattoos and Body Piercing from non-professional artists
Tattoo Body Piercing0
20
40
60
80
100 77
48.1
62.3
32.2
Male Female
P < 0.001P < 0.001
Percentage

16
Table 3: Risk Behaviors during Incarceration
Behavior Sample Size Frequency Percentage
Sexual Intercourse 1783 158 8.9
Injection Drug Use 1754 15 0.9
Needle Sharing 1754 10 0.6
Tattooing 1777 295 16.6
Body Piercing 1766 24 1.4

17
Figure 10: Types of Sexual Intercourse during Incarceration (n=158)
Anal
Oral
Vaginal
0 10 20 30 40 50 60
14.6
54.4
41.8
Percentage

18
Figure 11: Context of Sexual Intercourse during Incarceration (n=158)
Consensual93%
Forced7%

19
Table 4: Characteristics and Behaviors Associated with Sexual Intercourse during Incarceration
Characteristic Frequency (%) Unadjusted Odd’s Ratio (CI)
Adjusted Odd’s Ratio (CI)
Level of Prison SecurityMaximumMediumMinimum
21/327 (6.4)39/911 (4.3)89/554 (16.1)
10.65 (0.38-1.13)1.02 (1.70-4.58)
10.60 (0.29-1.24)0.90 (0.37-2.16)
No. of Years spent in Prison During Current Incarceration<11 or more
11/475 (2.3)138/1306 (10.6)
14.98 (2.67-9.29)
110.57 (3.60-31.04)
No. of Times Incarcerated1-34 or more
135/1370 (9.9)9/348 (2.6)
10.24 (0.12-0.48)
10.36 (0.16-0.79)
GenderFemaleMale
90/521 (17.3)56/1250 (4.5)
10.23 (0.16-0.32)
10.47 (0.21-1.03)
EthnicityWhiteAfrican AmericanHispanic/LatinoOthers- Native Americans, Asian Americans etc.
46/533 (8.6)86/973 (8.8)8/164 (4.9)9/92 (9.8)
11.03 (0.71-1.49)0.54 (0.25-1.18)1.15 (0.54-2.43)
11.26 (0.70-2.27)0.59 (0.20-1.75)1.59 (0.52-4.84)
P < 0.001; P <0.05

20
Table 4: Characteristics and Behaviors Associated with Sexual Intercourse during Incarceration Cont’d
Characteristic Frequency (%) Unadjusted Odd’s Ratio (CI)
Adjusted Odd’s Ratio (CI)
Marital StatusNever MarriedMarried/Living with someone as MarriedPreviously Married
96/957 (10.0)23/364 (6.3)28/452 (6.2)
10.61 (0.38-0.97)0.59 (0.38-0.92)
10.53 (0.23-1.20)0.74 (0.37-1.48)
Sexual OrientationHeterosexualBisexualGay/Lesbian
61/1368 (4.5)62/161 (38.5)19/51 (37.3)
113.42 (8.92-20.18)12.72 (6.82-23.72)
111.84 (5.73-24.47)6.72 (2.32-19.40)
Age<4040 or more
108/1164 (9.3)39/579 (6.7)
10.71 (0.48-1.03)
11.25 (0.66-2.39)
Got Tattoos in PrisonNoYes
57/915 (6.2)51/300 (17.0)
13.13 (2.04-4.55)
13.83 (2.20-6.65)
P < 0.001

21
Conclusions• Inmates engage in risk behaviors before
and during incarceration• Longer duration of stay in prison, non
heterosexual orientation and receiving a tattoo in prison were associated with sexual intercourse in prison
• Findings support both the importation and deprivation models of inmate behavior

22
Recommendations
• HIV prevention interventions should be commenced as soon as possible after incarceration
• Current policies about risk reduction mechanisms in prison need review

23
Study Limitations• Possible Underreporting- Social Desirability Bias• Use of a self administered questionnaire and Social
desirability bias may affect results and generalizability of findings
• Non response to questions may be a source of bias • The small numbers of inmates reporting HIV risk
behaviors in prison prevented the identification of independent risk factors for some behaviors
• Inmates who were selected but refused to participate in the study may differ significantly from those who participated. This may have affected the prevalence of the risk behaviors reported.

24
Future Research
• The role of tattooing in HIV transmission: risk marker or mode of transmission?
• Risk behaviors of partners of inmates• Spatial analysis of inmate residencies after
release, distribution of HIV cases, and HIV prevention services in Illinois

25
Acknowledgements• Illinois General Assembly and the Illinois Department of
Public Health- Funding• Dr. Mainza Lukobo-Durrell- contribution to
conceptualizing the study• Research assistants –Josie McDonald, Wayne Scott-
Williams, Jerry Goldstein and Emmanuel Osunkoya- for their dedication throughout the period of the study
• State Representative Constance Howard- co-sponsoring the bill which created the African American HIV/AIDS Response Act and for her personal involvement in establishing the collaboration between the Institute and IDOC
• IDOC officials-support in facilitating data collection

26

27