1 Peak Oil and Australia Probable impacts and possible options Bruce Robinson and Sherry Mayo ? ? ?...
57
1 Peak Oil and Australia Probable impacts and possible options Bruce Robinson and Sherry Mayo ? ? ? ? ? Look Out Australia ! Something serious is looming on the radar
-
Upload
angelina-bryan -
Category
Documents
-
view
222 -
download
4
Transcript of 1 Peak Oil and Australia Probable impacts and possible options Bruce Robinson and Sherry Mayo ? ? ?...

1
Peak Oil and AustraliaProbable impacts and possible options
Bruce Robinson and Sherry Mayo
? ? ? ? ?
Look Out Australia ! Something serious is looming on the radar
2
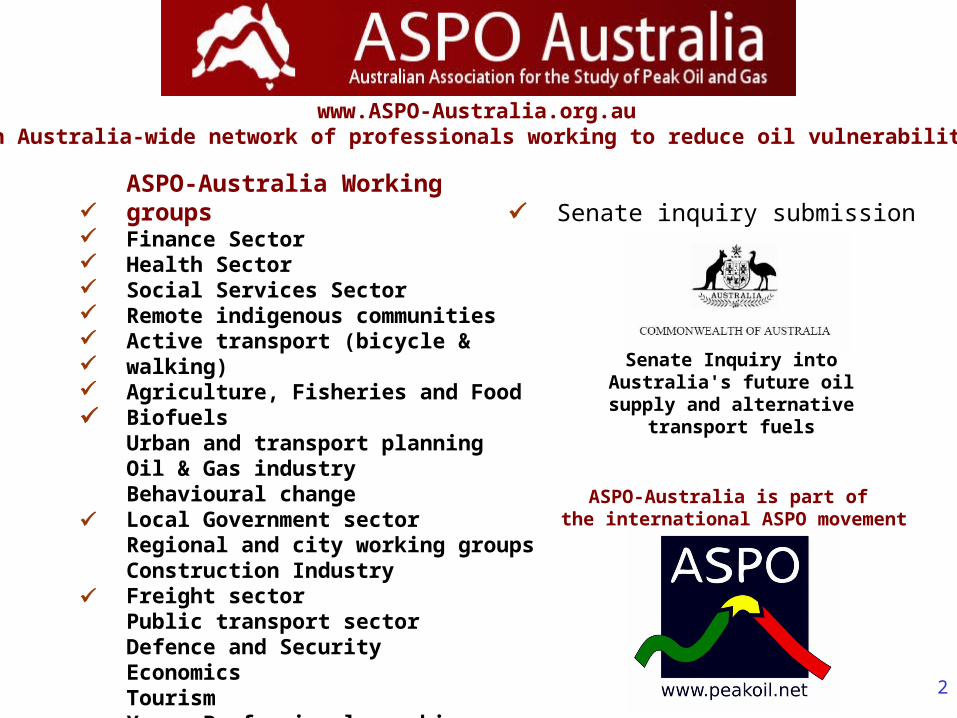
www.ASPO-Australia.org.auAn Australia-wide network of professionals working to reduce oil vulnerability
ASPO-Australia Working groupsFinance SectorHealth Sector Social Services SectorRemote indigenous communitiesActive transport (bicycle & walking)Agriculture, Fisheries and FoodBiofuels Urban and transport planning Oil & Gas industryBehavioural changeLocal Government sectorRegional and city working groupsConstruction IndustryFreight sectorPublic transport sectorDefence and Security EconomicsTourism Young Professionals working group
Senate inquiry submission
ASPO-Australia is part of the international ASPO movement
Senate Inquiry into Australia's future oil supply and alternative
transport fuels

3
Summary
Australia, now Oil demand, production, use (transport)
Geography, population3 different countries remote, rural, urban
High Oil Vulnerability Australia will be badly affected by oil depletion,
unless substantial changes are made
Possible change options for government

4
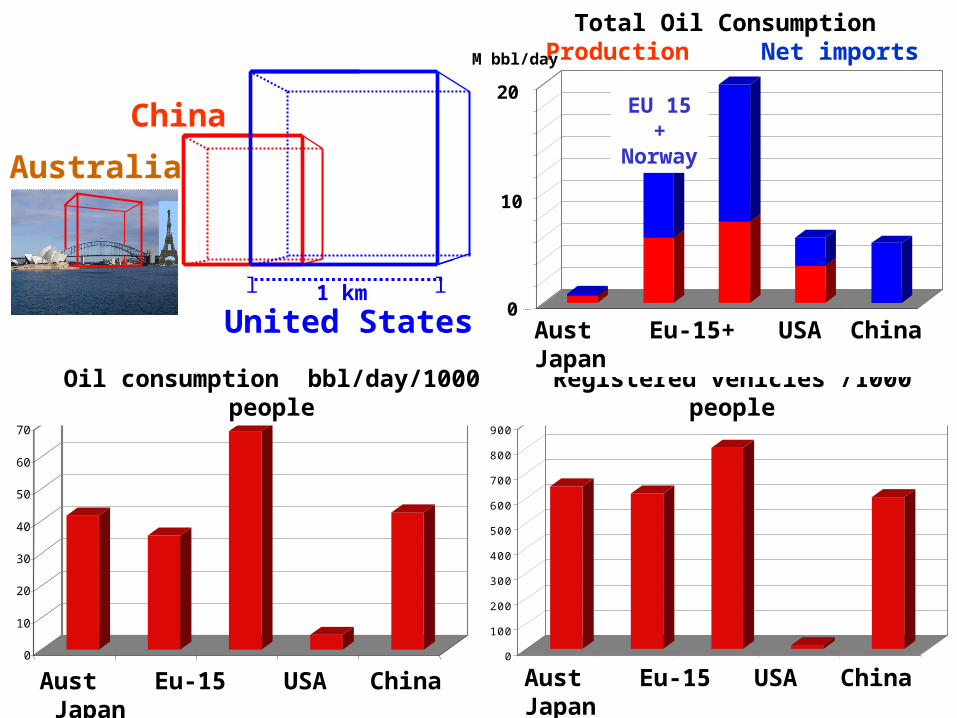
80% of Australia’s oil usage is in transport
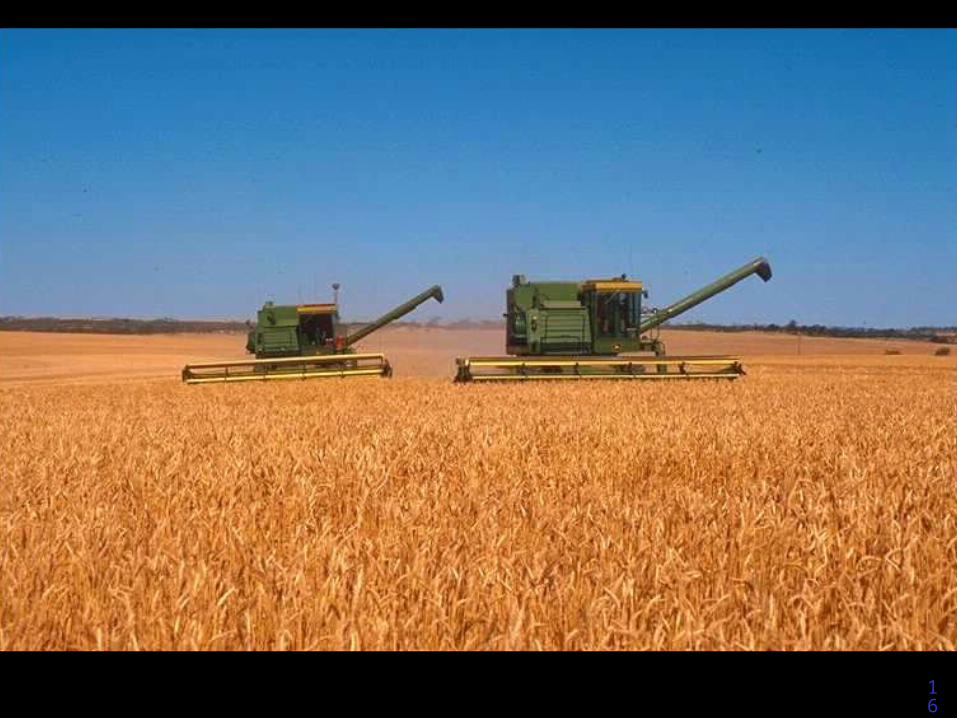
If Australia’s 20 M tpa wheat crop → ethanol = 9%
Australia uses 45,000 megalitres of oil each year
a 360m cube
Sydney Harbour Bridge is 134 m high
=1.3 EfT3
5
0
10
20
30
40
50
60
70
Oil consumption bbl/day/1000 people
Aust Eu-15 USA China Japan0
100
200
300
400
500
600
700
800
900
Australia EU-15 USA China Japan
Registered Vehicles per 1000
Aust Eu-15 USA China Japan
Registered vehicles /1000 people
0
2,000,000
4,000,000
6,000,000
8,000,000
10,000,000
12,000,000
14,000,000
16,000,000
18,000,000
20,000,000
Australia EU-15 USA China J apan
Oil Consumption bbl/day (blue = net imports, red = production)Total Oil Consumption
Production Net imports
Aust Eu-15+ USA China Japan
20
0
10
M bbl/day
EU 15 + Norway
1 km
Australia
China
United Statesl l

6
Energyfiles LtdEnergyfiles Ltd
EENERGYNERGYFFILEILESS
www.energyfiles.cowww.energyfiles.comm
Oil production is not shared equitablyUS: 5% of world's population uses 25% of world oil
RichPoor
7
0.0
0.2
0.4
0.6
0.8
1.0
1 11 21 31 41 51 611965 202520051985
1.0
0.0
0.2
0.4
0.6
0.8
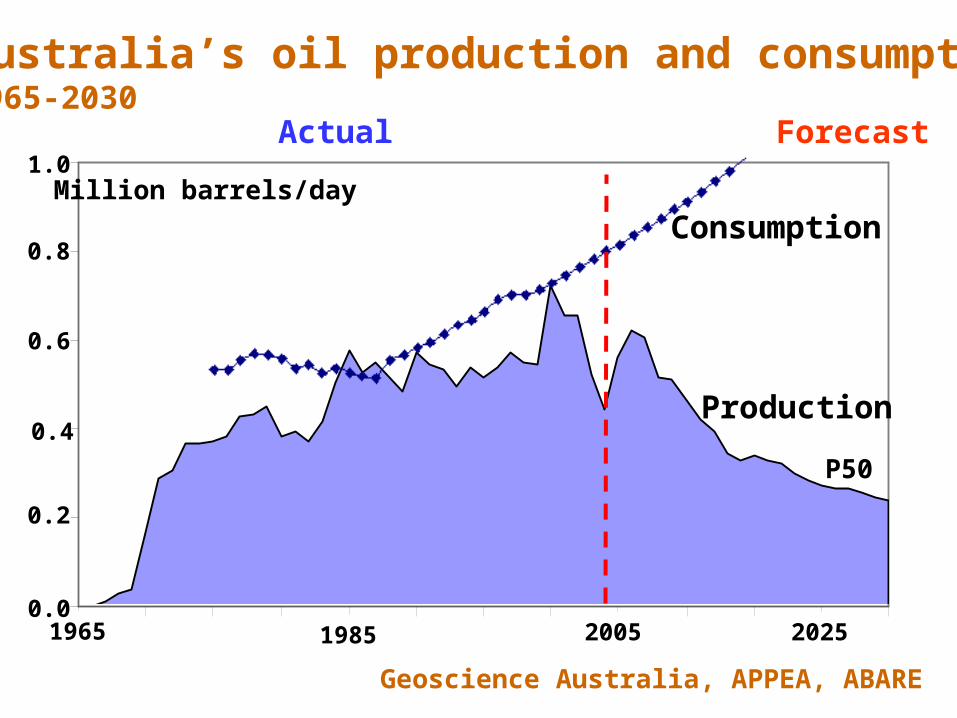
Geoscience Australia, APPEA, ABARE
Australia’s oil production and consumption1965-2030
Million barrels/day
Actual Forecast
Consumption
Production
P50
8
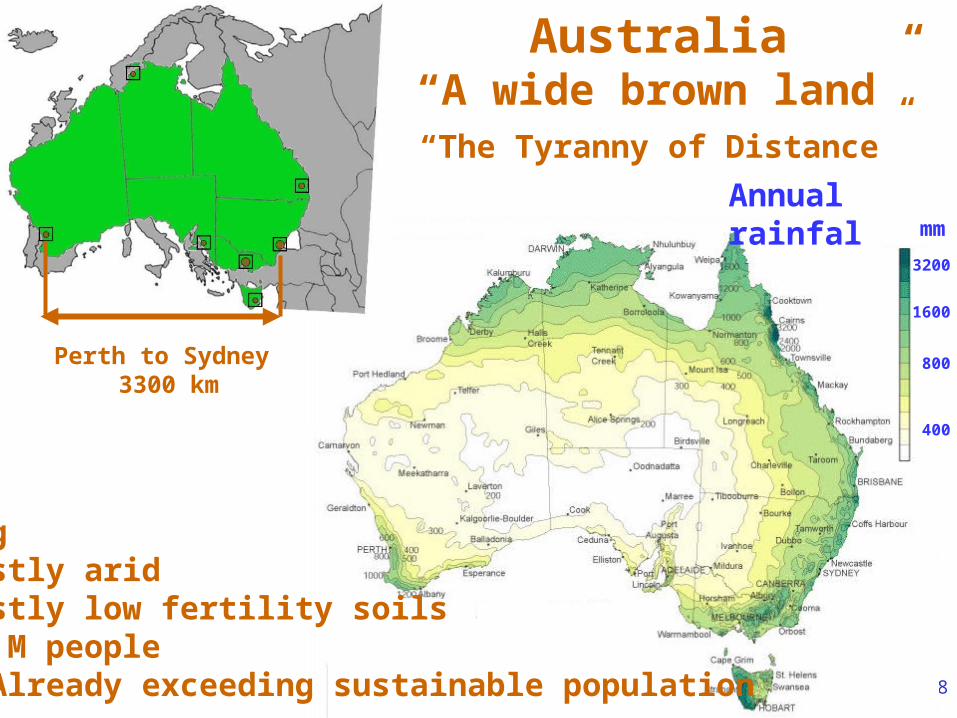
Australia“A wide brown land”“The Tyranny of Distance”
Annual rainfall
3200
1600
mm
800
400
Perth to Sydney 3300 km
BigMostly aridMostly low fertility soils20 M people Already exceeding sustainable population
9

10
Remoteness classificationMajor citiesInner regionalOuter regionalRemoteVery remote
Very remote
Major cities
Outer regional
Remote
Inner regional
3 separate countries Remote Regional Urban 3% 31% 66%
11
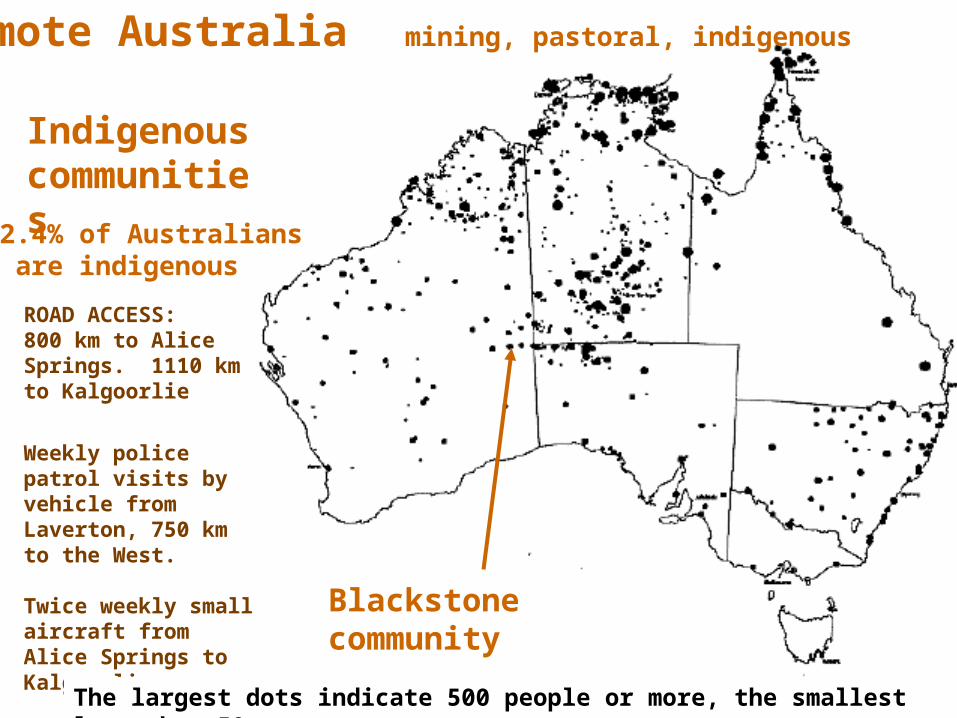
Indigenous communities
Blackstone community
ROAD ACCESS:800 km to Alice Springs. 1110 km to Kalgoorlie
Weekly police patrol visits by vehicle from Laverton, 750 km to the West.
Twice weekly small aircraft from Alice Springs to Kalgoorlie,
The largest dots indicate 500 people or more, the smallest less than 50
2.4% of Australians are indigenous
Remote Australia mining, pastoral, indigenous
12
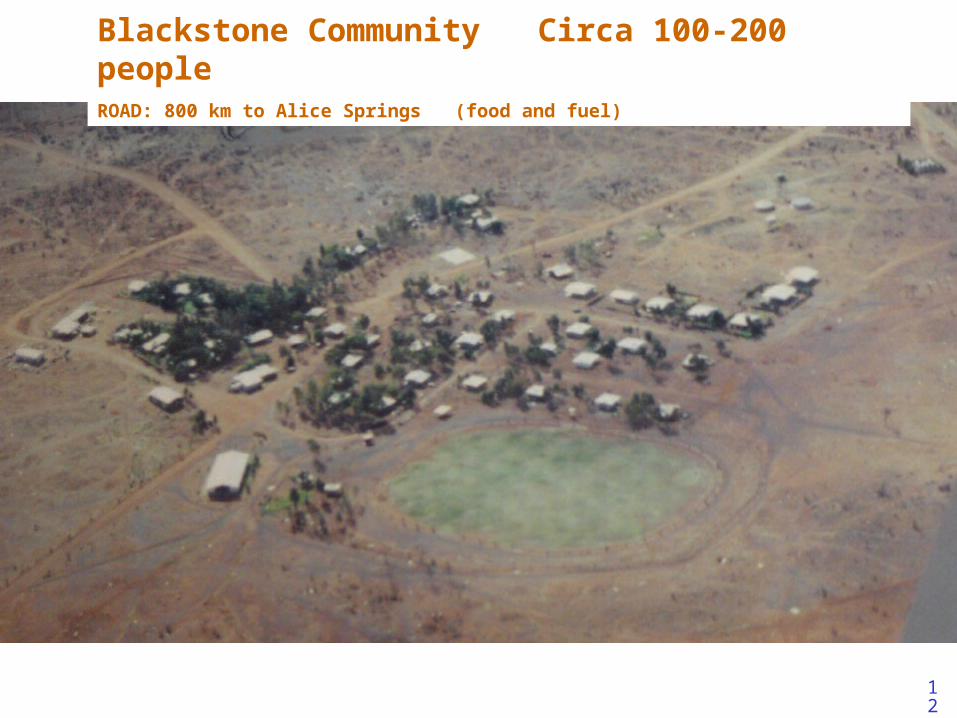
Blackstone Community Circa 100-200 peopleROAD: 800 km to Alice Springs (food and fuel)

13
Iron ore train, Pilbara ~ 200M tonne p.a.
Road trains
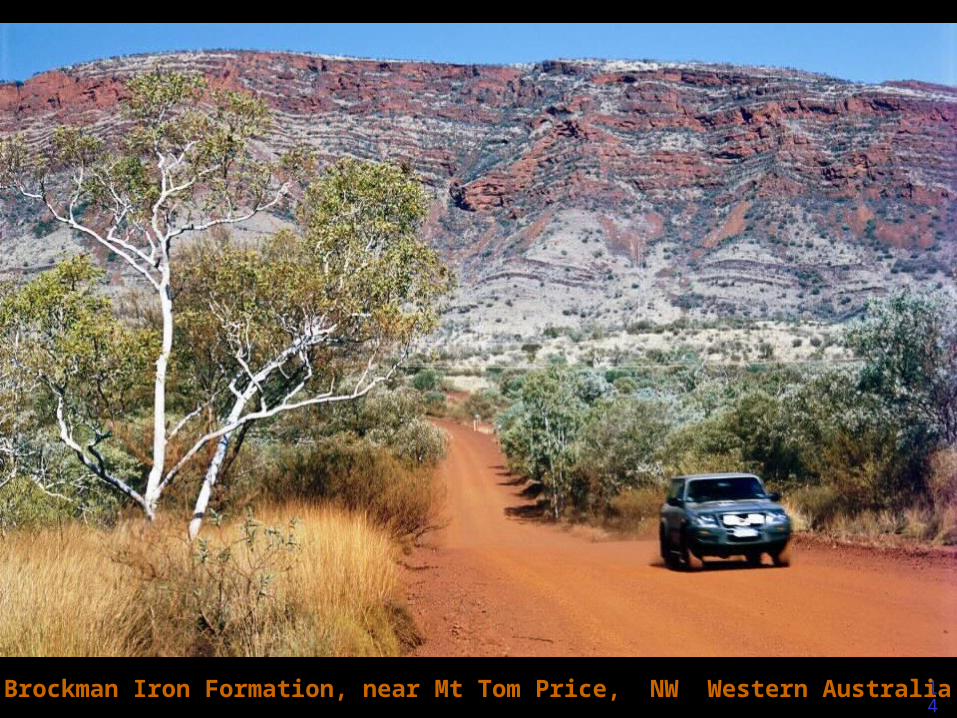
14Brockman Iron Formation, near Mt Tom Price, NW Western Australia

15
Rural Australia
Sparsely populated
16
17
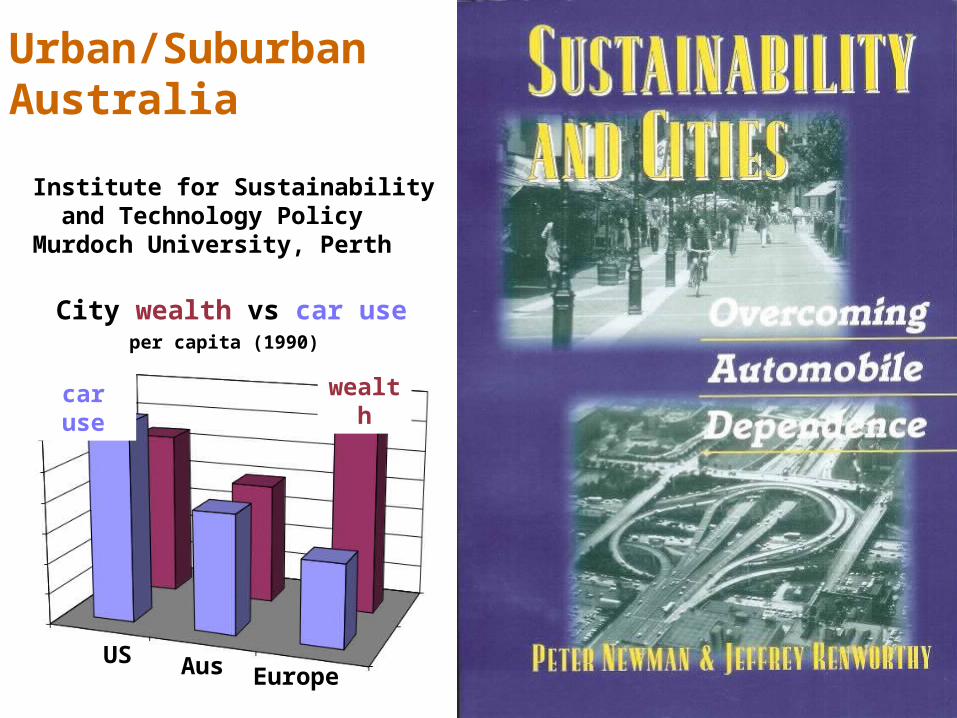
Urban/Suburban Australia
Institute for Sustainability and Technology PolicyMurdoch University, Perth
City wealth vs car useper capita (1990)
AusUSEurope
car use wealth
18
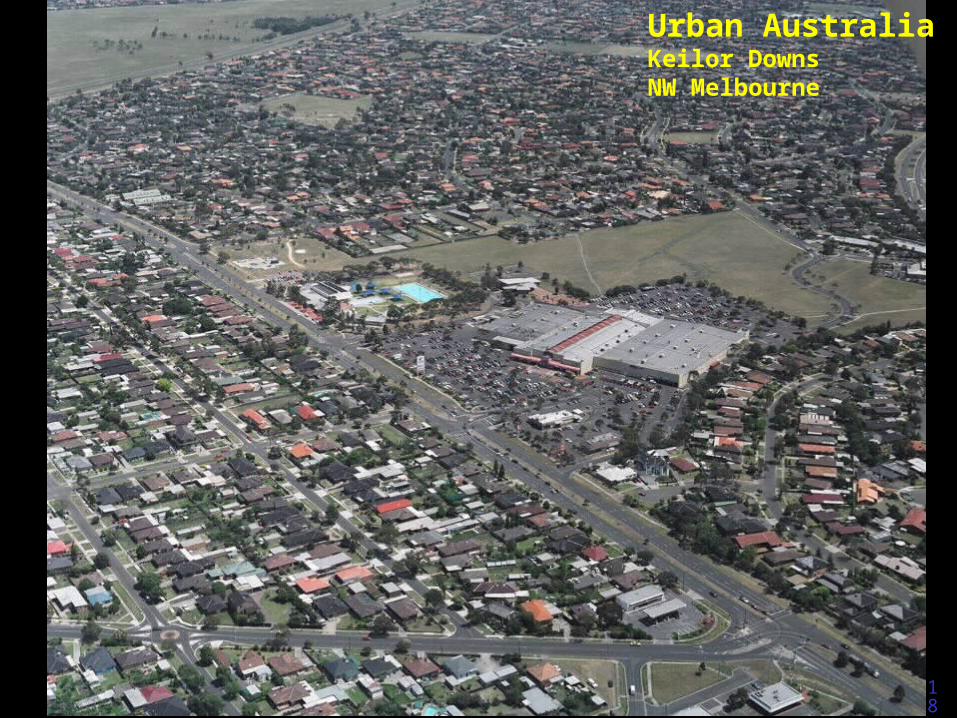
Urban AustraliaKeilor DownsNW Melbourne
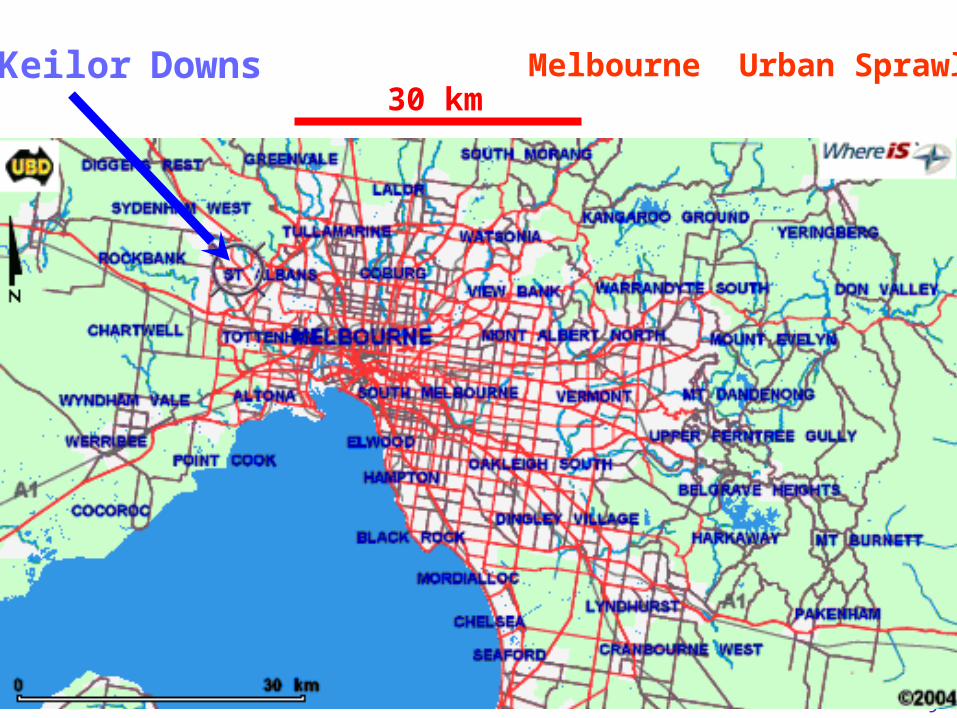
19
Melbourne Urban Sprawl30 km
Keilor Downs

20
Urban passenger mode shares Australia
0%
10%
20%
30%
40%
50%
60%
70%
80%
90%
100%
1945 1950 1955 1960 1965 1970 1975 1980 1985 1990 1995 2000
Mo
de
sh
are
(p
er
cen
t)
Car
Rail
BusOther
Potterton BTRE 2003
High automobile-dependence
Public transport share is very low
Car
21
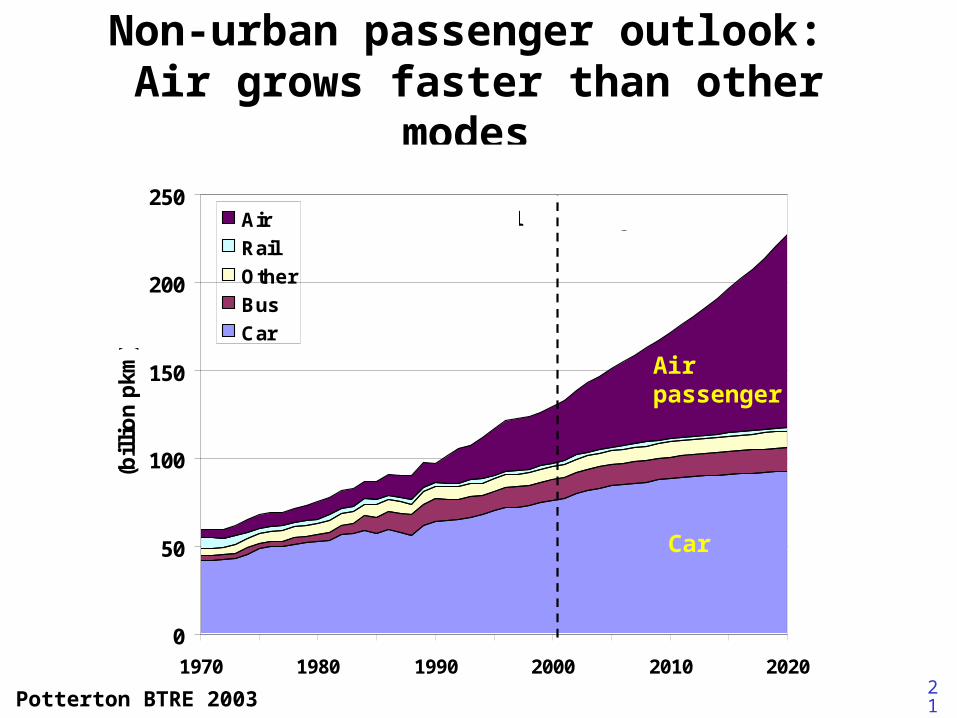
Non-urban passenger outlook: Air grows faster than other modes
0
50
100
150
200
250
1970 1980 1990 2000 2010 2020
(bil
lio
n p
km)
Air
Rail
Other
Bus
Car
Actual Projections
Potterton BTRE 2003
Air passenger
Car
22
$10 PER LITRE PETROL: A SCENARIO(a ten-fold increase)
David Rice, Senior WA Transport Planner
The scenario means “What if petrol reaches $10/l?Planners should include this scenario, as well as “business-as-usual”
But why $10/l?
Simplememorable
an illustration of ‘expensive’
www.aspo-australia.org.au under "bibliography"
23
24
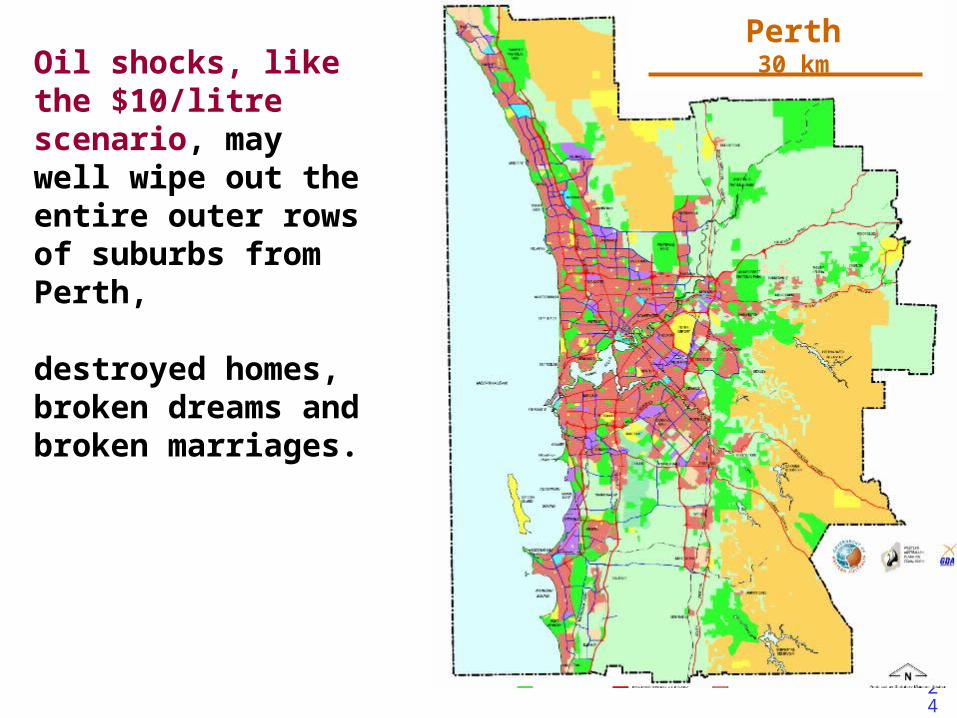
Oil shocks, like the $10/litre scenario, may well wipe out the entire outer rows of suburbs from Perth,
destroyed homes, broken dreams and broken marriages.
Perth30 km
25
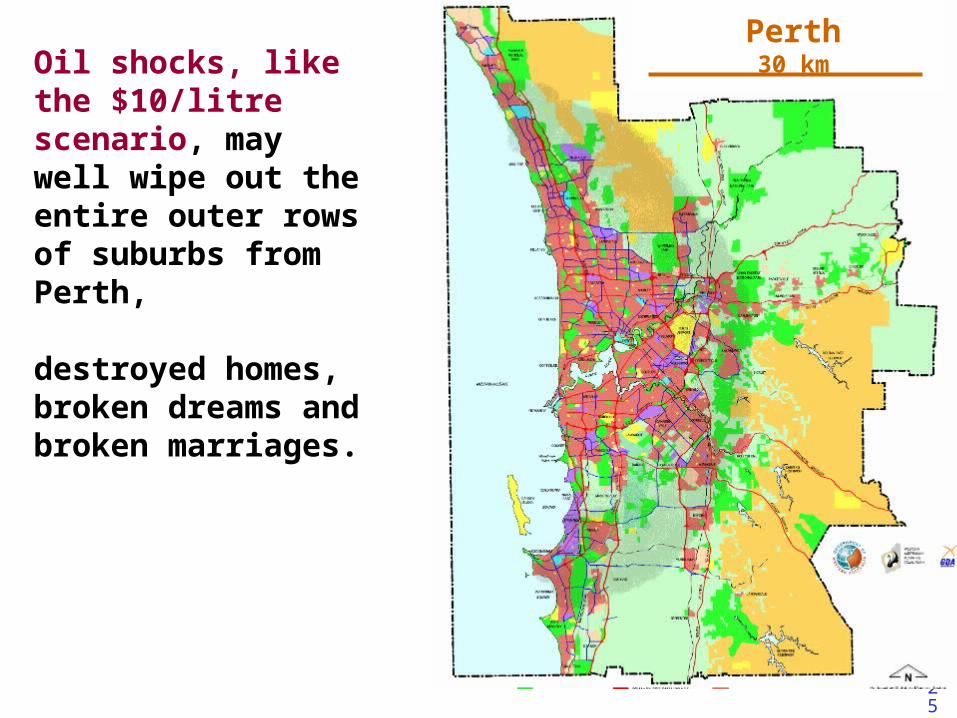
Oil shocks, like the $10/litre scenario, may well wipe out the entire outer rows of suburbs from Perth, with the same results of destroyed homes, broken dreams and broken marriages.
Perth30 kmOil shocks, like the
$10/litre scenario, may well wipe out the entire outer rows of suburbs from Perth,
destroyed homes, broken dreams and broken marriages.

26
Oil shocks, like the $10/litre scenario, may well wipe out the entire outer rows of suburbs from Perth, with the same results of destroyed homes, broken dreams and broken marriages.
Perth30 kmOil shocks, like the
$10/litre scenario, may well wipe out the entire outer rows of suburbs from Perth,
destroyed homes, broken dreams and broken marriages.

27
Oil shocks, like the $10/litre scenario, may well wipe out the entire outer rows of suburbs from Perth, with the same results of destroyed homes, broken dreams and broken marriages.
Perth30 kmOil shocks, like the
$10/litre scenario, may well wipe out the entire outer rows of suburbs from Perth,
destroyed homes, broken dreams and broken marriages.

28
Perth30 kmThe outskirts of all
Australian cities will be hard hit by oil depletion, as public transport infrastructure is very poor
29
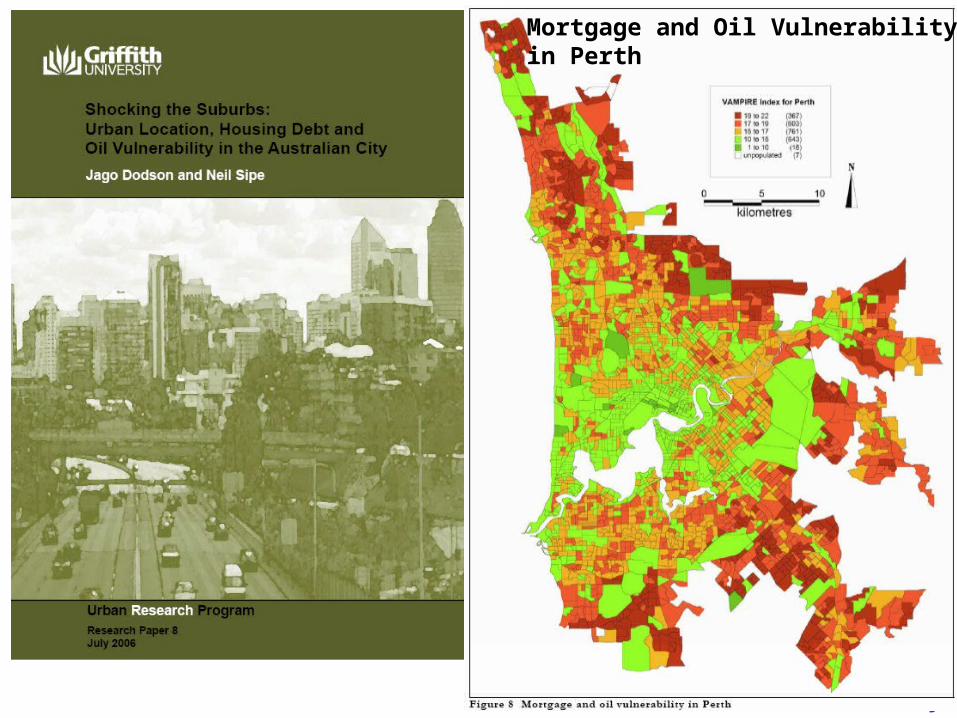
Mortgage and Oil Vulnerabilityin Perth
30
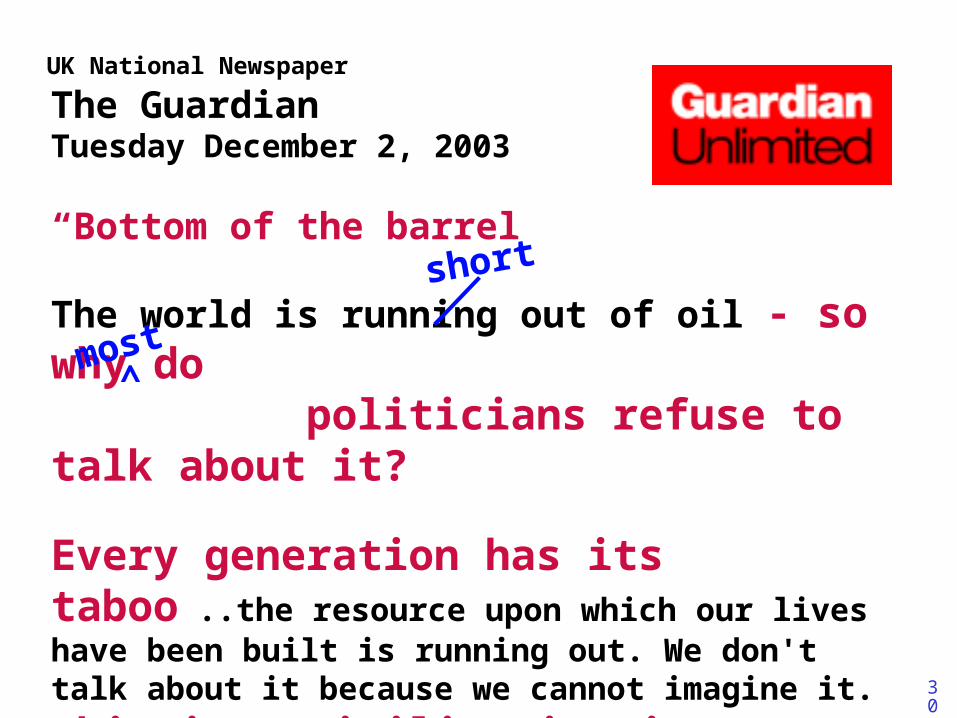
The Guardian Tuesday December 2, 2003
“Bottom of the barrel
The world is running out of oil - so why do politicians refuse to talk about it?
Every generation has its taboo ..the resource upon which our lives have been built is running out. We don't talk about it because we cannot imagine it.
This is a civilisation in denial”.
George Monbiot see www.monbiot.com
short
most^
UK National Newspaper
31
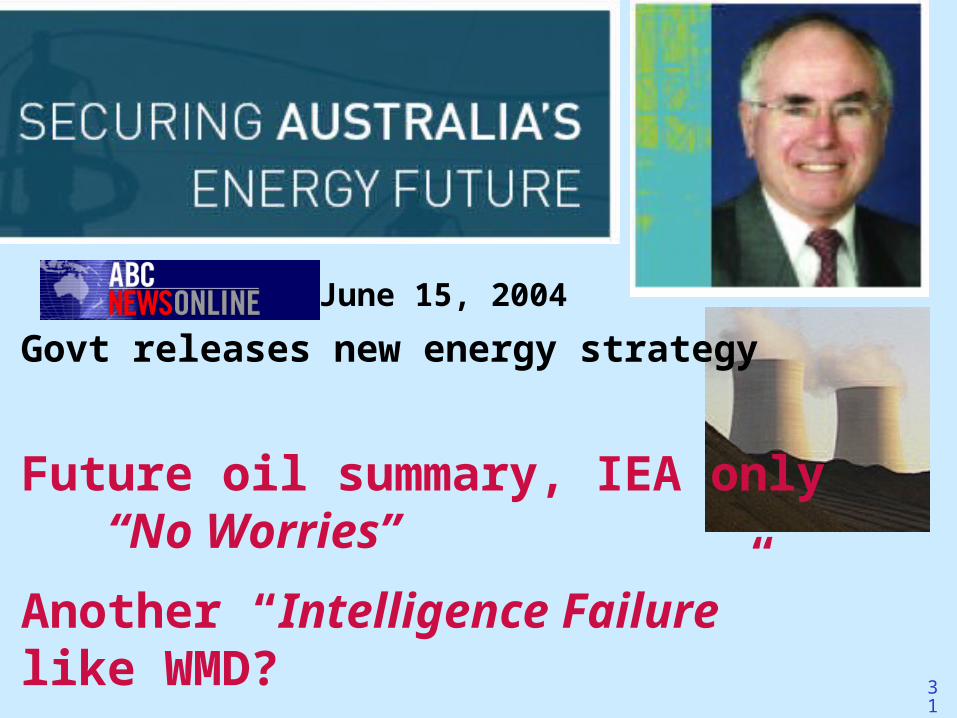
Govt releases new energy strategy
Future oil summary, IEA only “No Worries”
Another “Intelligence Failure” like WMD?
June 15, 2004
32
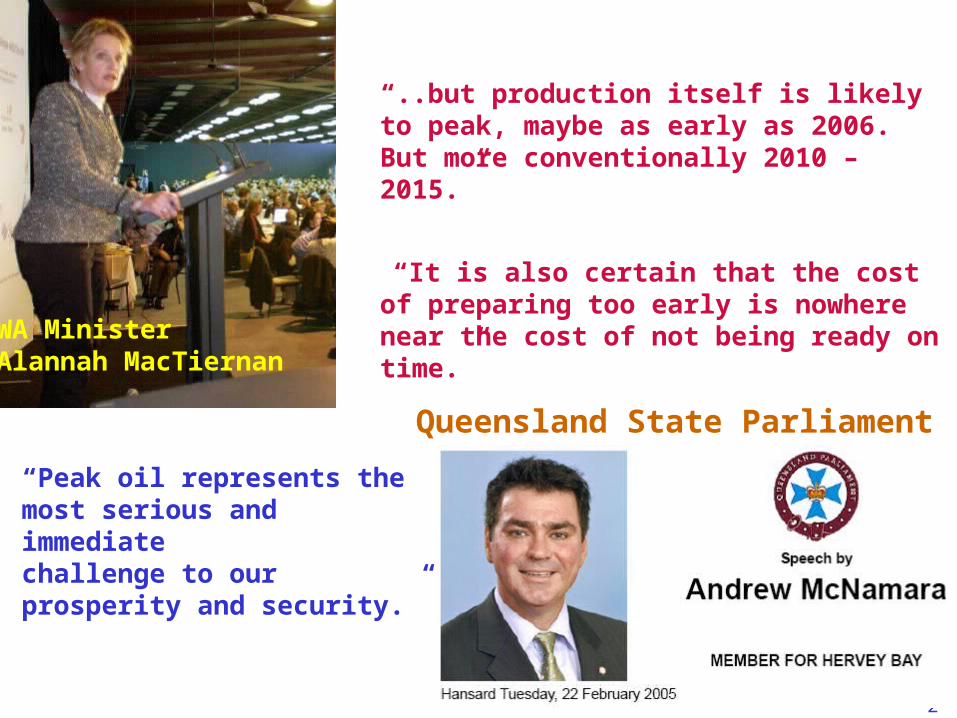
“..but production itself is likely to peak, maybe as early as 2006. But more conventionally 2010 – 2015.”
“It is also certain that the cost of preparing too early is nowhere near the cost of not being ready on time.”
WA Minister Alannah MacTiernan
“Peak oil represents the most serious and immediatechallenge to our prosperity and security.”
Queensland State Parliament

33
0
10
20
30
40
50
1930 1950 1970 1990 2010 2030 2050
0
1 0
2 0
3 0
4 0
5 0
World oil shortfall scenarios
Past Production of Oil
ForecastProduction
Demand Growth
Deprivation, war
City design/lifestyle
Pricing / taxes
Transport mode shifts
Efficiency
Other petroleum fuels gas, tar-sands
Other fuels
Gb/year
• no single “Magic Bullet” solution, • Noah! Start now! Hard to build the ark under water
2005
after Swenson, 2000
34
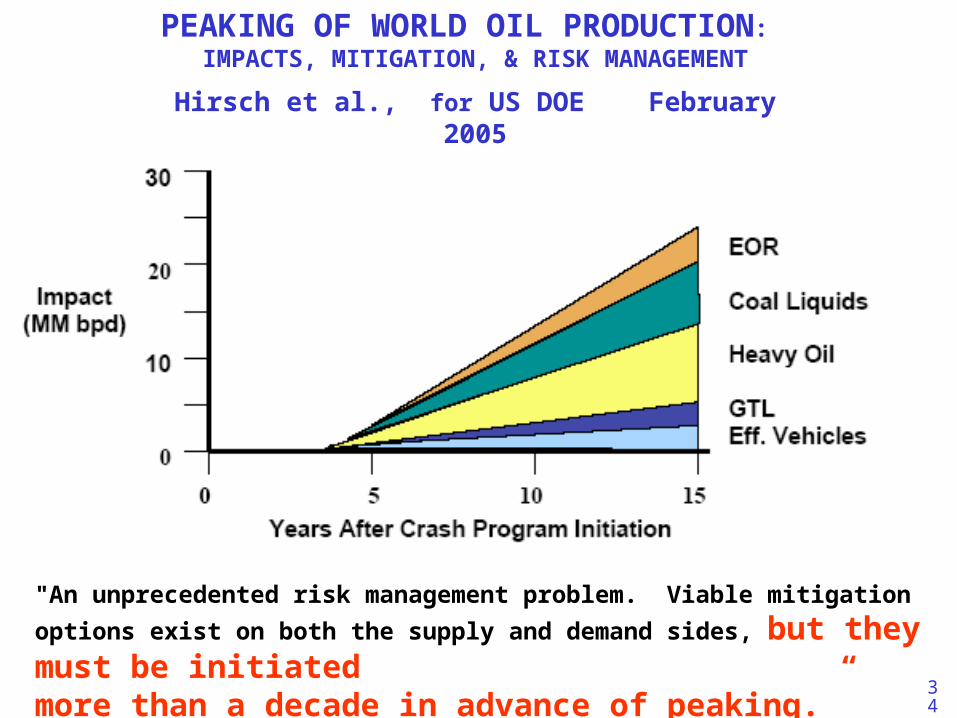
"An unprecedented risk management problem. Viable mitigation options exist
on both the supply and demand sides, but they must be initiated more than a decade in advance of peaking.”
PEAKING OF WORLD OIL PRODUCTION:IMPACTS, MITIGATION, & RISK MANAGEMENT
Hirsch et al., for US DOE February 2005
35
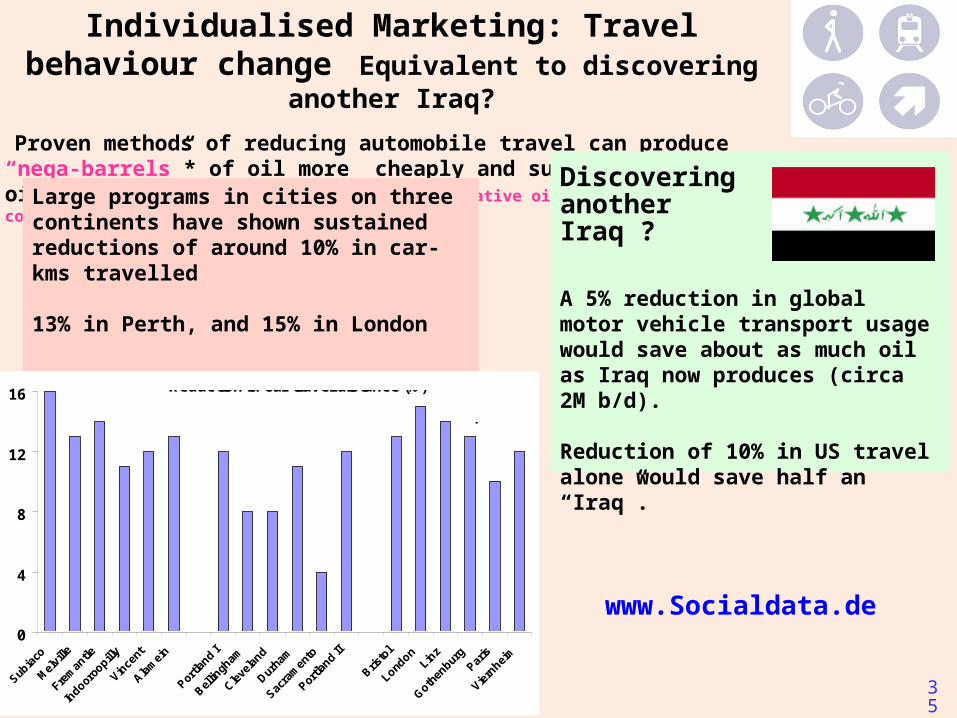
Individualised Marketing: Travel behaviour change
Equivalent to discovering another Iraq?
Proven methods of reducing automobile travel can produce “nega-barrels”* of oil more cheaply and sustainably than oil can be found by exploration. (*negative oil, saved by conservation)
Large programs in cities on three continents have shown sustained reductions of around 10% in car-kms travelled
13% in Perth, and 15% in London
www.Socialdata.de0
4
8
12
16Australia
AmericaEurope
Reduction in car travel distance (%)
%
A 5% reduction in global motor vehicle transport usage would save about as much oil as Iraq now produces (circa 2M b/d).
Reduction of 10% in US travel alone would save half an “Iraq”.
Discovering another Iraq ?
36
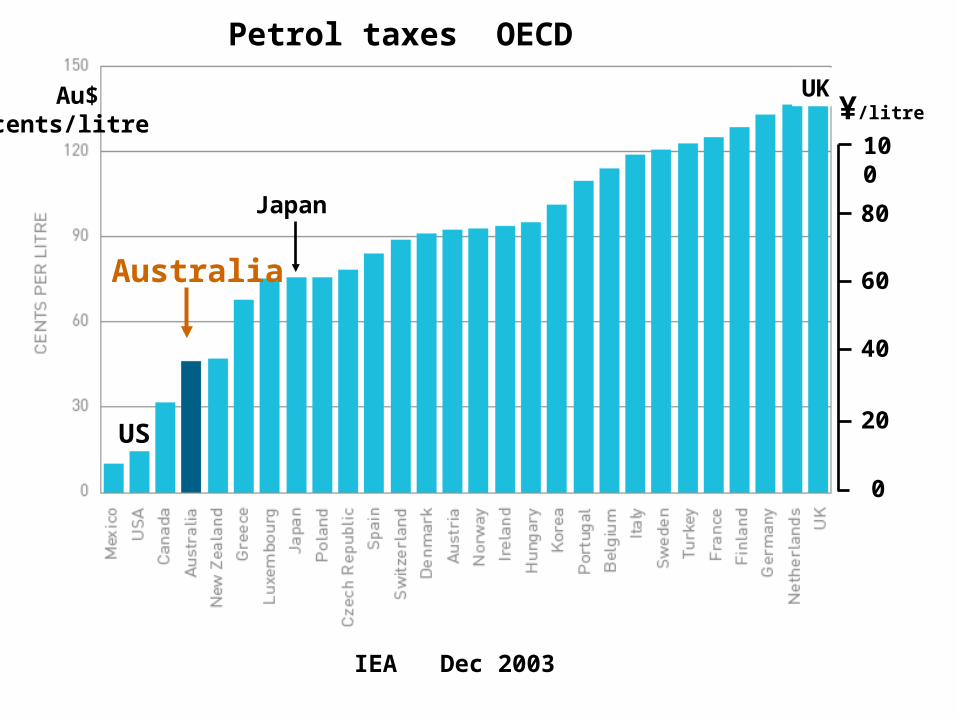
Petrol taxes OECD
IEA Dec 2003
UK
Australia
US
Japan
¥/litre
Au$cents/litre
80
60
0
20
40
100
37
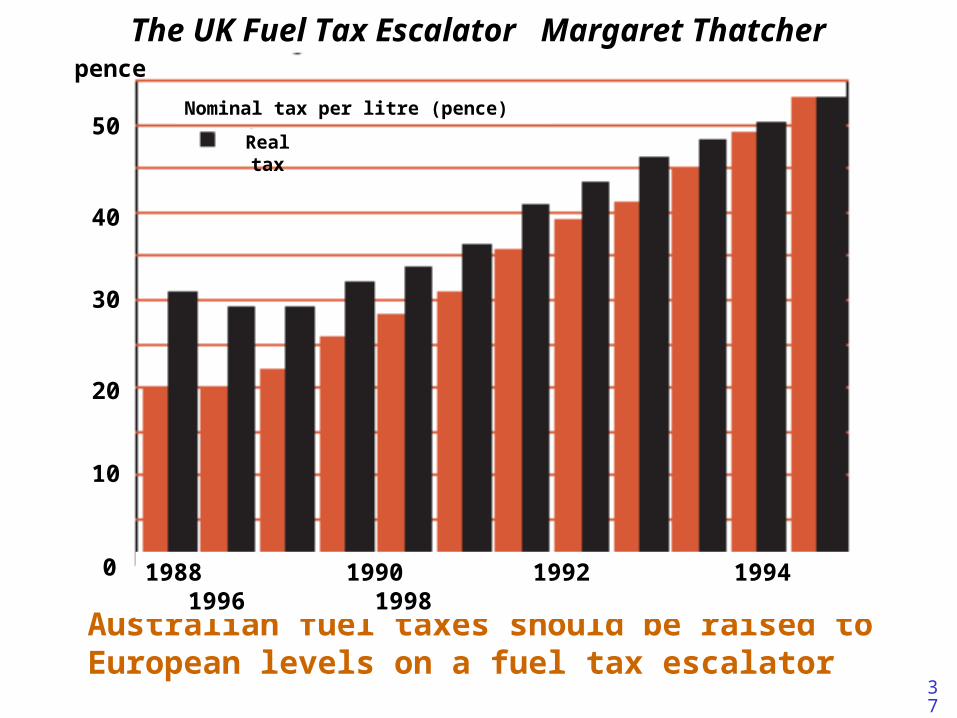
The UK Fuel Tax Escalator Margaret Thatcher
Australian fuel taxes should be raised to European levels on a fuel tax escalator
1988 1990 1992 1994 1996 1998
Nominal tax per litre (pence)
Real tax
10
30
50
40
20
0
pence

38
-
1
2
3
4
5
6
1965 1975 1985 1995 2005
Oil Consumptionmillion barrels/day
UK
Australia (x 5)
Japan
M bbl/d
BP Statistical Review of World Energy, 2006
UK Fuel Tax Escalator started
Japan
Australia (x 5)
UK
0
39
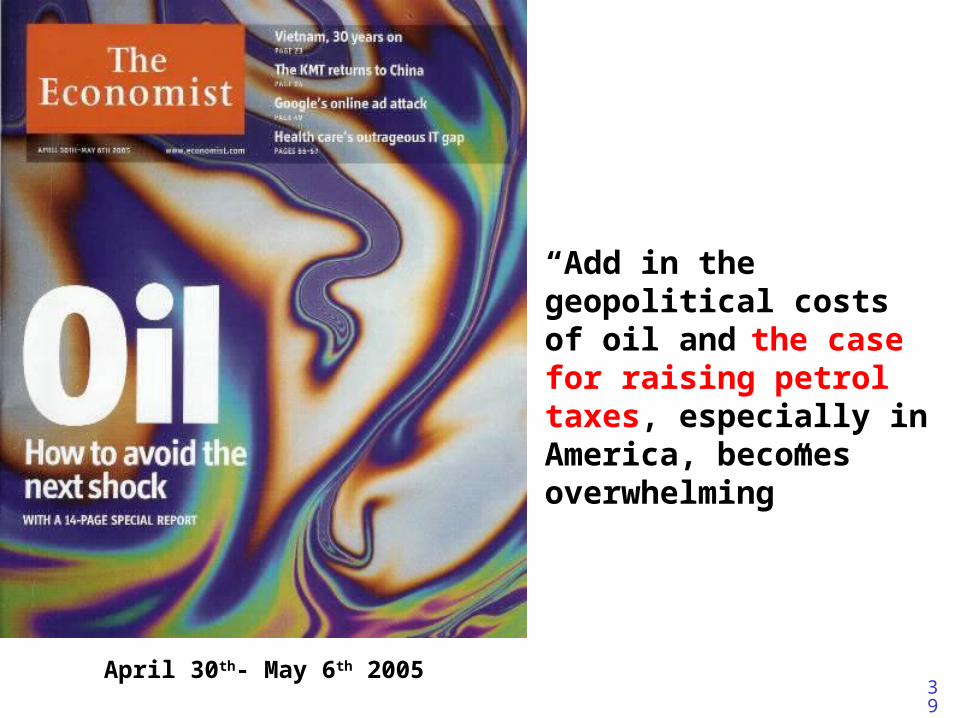
“Add in the geopolitical costs of oil and the case for raising petrol taxes, especially in America, becomes overwhelming”
April 30th- May 6th 2005
40
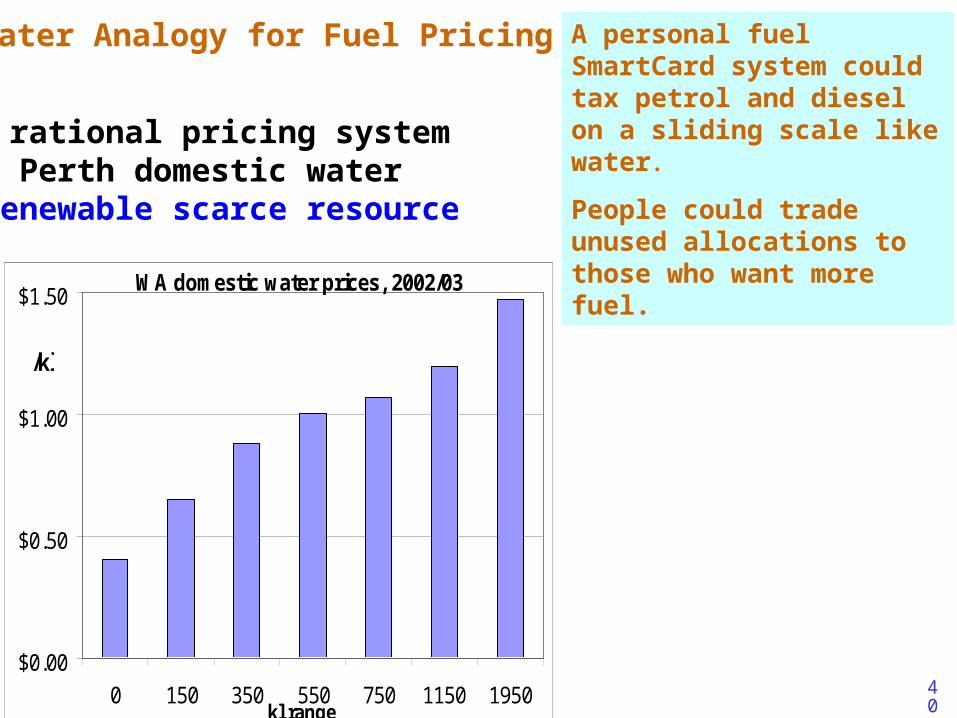
$0.00
$0.50
$1.00
$1.50
0 150 350 550 750 1150 1950
WA domestic water prices, 2002/03
/kl
kl range
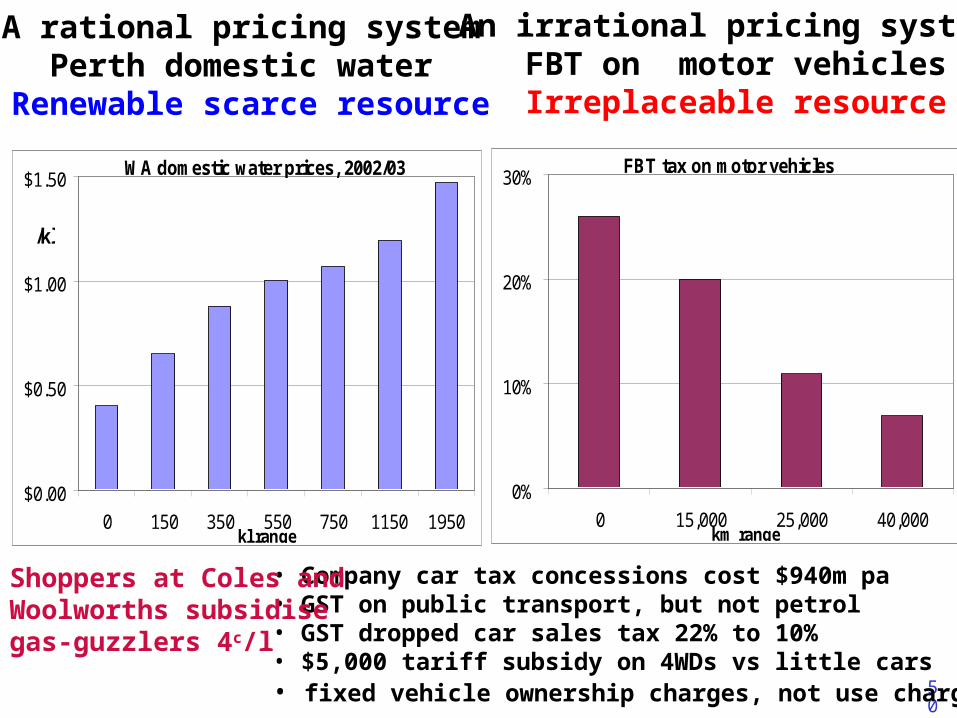
A rational pricing system Perth domestic water
Renewable scarce resource
A personal fuel SmartCard system could tax petrol and diesel on a sliding scale like water.
People could trade unused allocations to those who want more fuel.
Water Analogy for Fuel Pricing
41
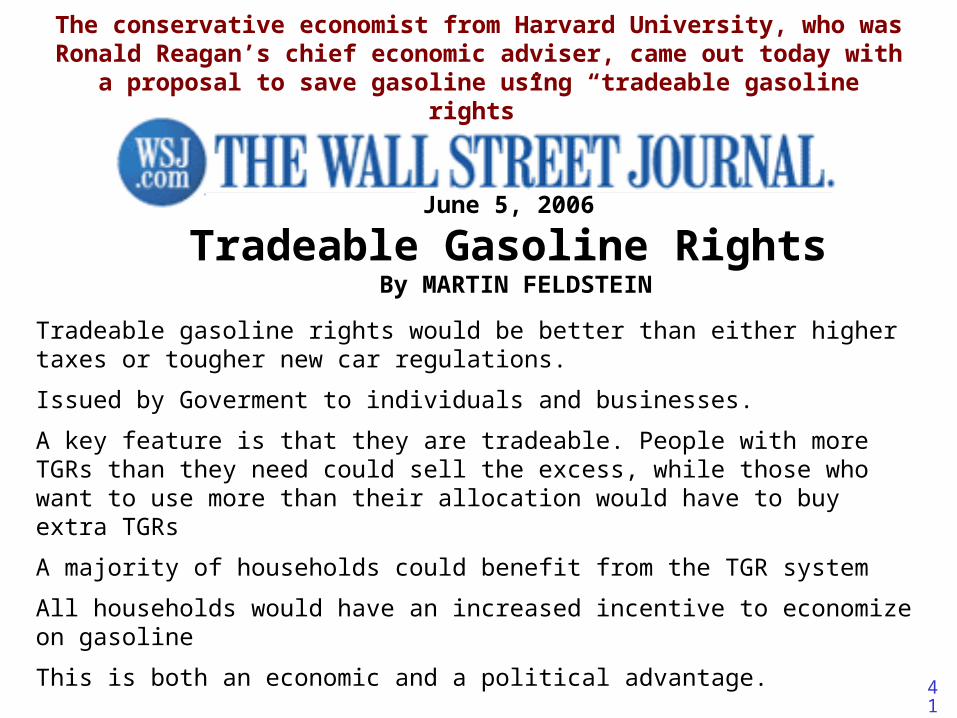
Tradeable gasoline rights would be better than either higher taxes or tougher new car regulations.
Issued by Goverment to individuals and businesses.
A key feature is that they are tradeable. People with more TGRs than they need could sell the excess, while those who want to use more than their allocation would have to buy extra TGRs
A majority of households could benefit from the TGR system
All households would have an increased incentive to economize on gasoline
This is both an economic and a political advantage.
June 5, 2006
Tradeable Gasoline Rights By MARTIN FELDSTEIN
The conservative economist from Harvard University, who was Ronald Reagan’s chief economic adviser, came out today with a proposal to save gasoline using “tradeable gasoline rights”
42
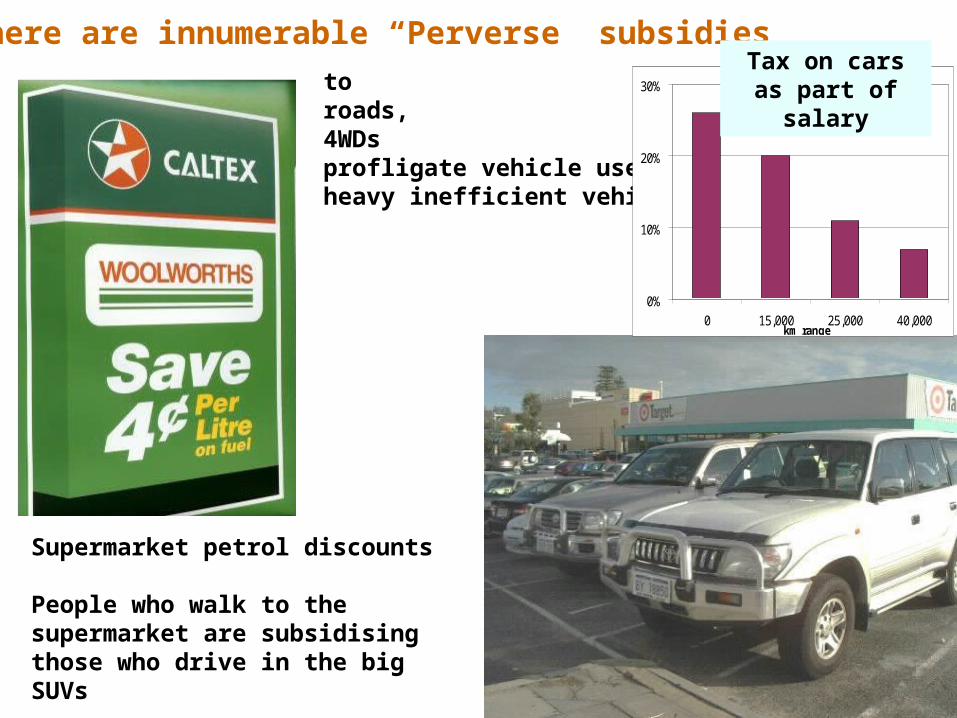
toroads,4WDsprofligate vehicle usersheavy inefficient vehicles
Supermarket petrol discounts
People who walk to the supermarket are subsidising those who drive in the big SUVs
There are innumerable “Perverse” subsidies
0%
10%
20%
30%
0 15,000 25,000 40,000
FBT tax on motor vehicles
km range
Tax on cars as part of salary
43
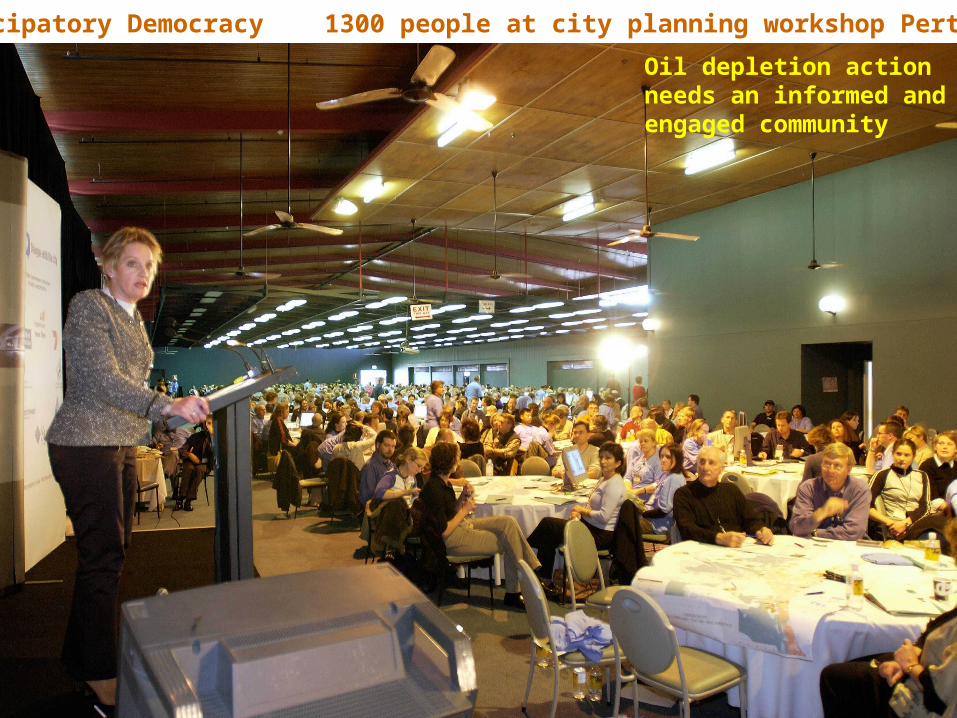
Participatory Democracy 1300 people at city planning workshop Perth 2003
Oil depletion actionneeds an informed and engaged community
44
1: “Talk about it, Talk about it”2. Engage people, “Participatory democracy”3. Dismantle the "perverse policies" that subsidise heavy car use and excessive freight transport.
Australian Government Policy and Action Options
4. Encourage frugal use of fuel, and disadvantage profligate users. Fuel taxes should be incrementally raised to European levels to reduce usage.5: SmartCard personal fuel allocation system. A flexible tradeable mechanism for short-term oil shocks, as well for encouraging people to reduce their fuel usage..6. Concentrate on the psychological and social dimensions of automobile dependence, not just “technological fixes”7. Implement nationwide "individualised marketing" travel demand management.8. Railways, cyclepaths and public transport are better investments than more roads.9. Give priority for remaining oil and gas supplies to food production, essential services and indigenous communities, using the Smart-Card system.10. Review the oil vulnerability of every industry and community sector and how each may reduce their risks.11 Promote through the United Nations an Intergovernmental Panel on Oil Depletion, and a Kyoto-like protocol to allocate equitably the declining oil among nations. An international tradable sliding scale allocation mechanism is one hypothetical option.
45
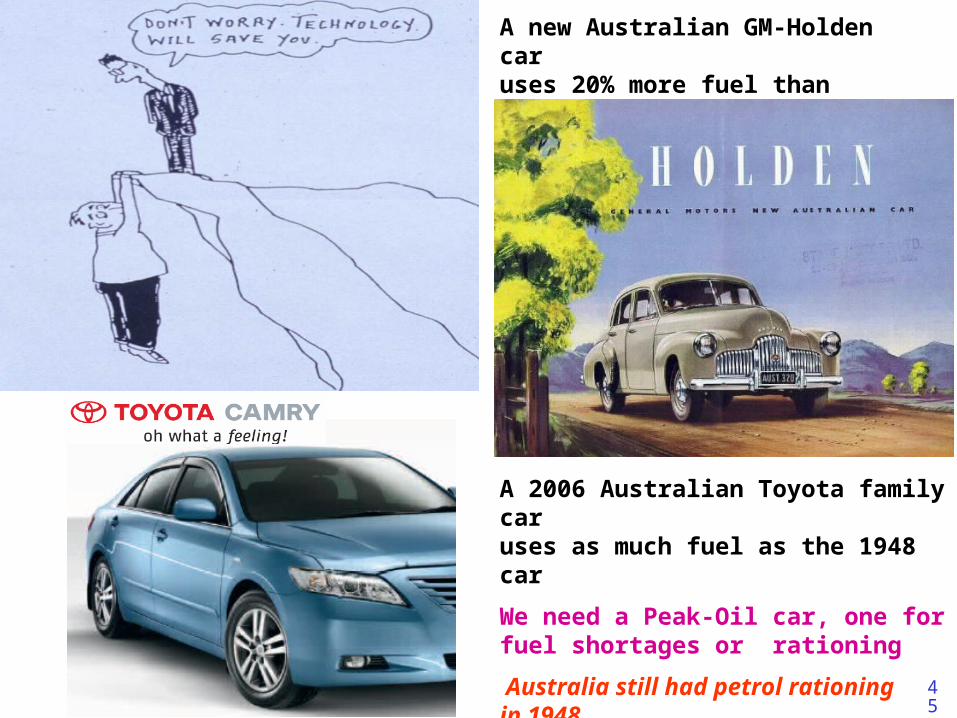
A new Australian GM-Holden car uses 20% more fuel than Australia's first car, the 1948 Holden
A 2006 Australian Toyota family car uses as much fuel as the 1948 car
We need a Peak-Oil car, one for fuel shortages or rationing
Australia still had petrol rationing in 1948
46
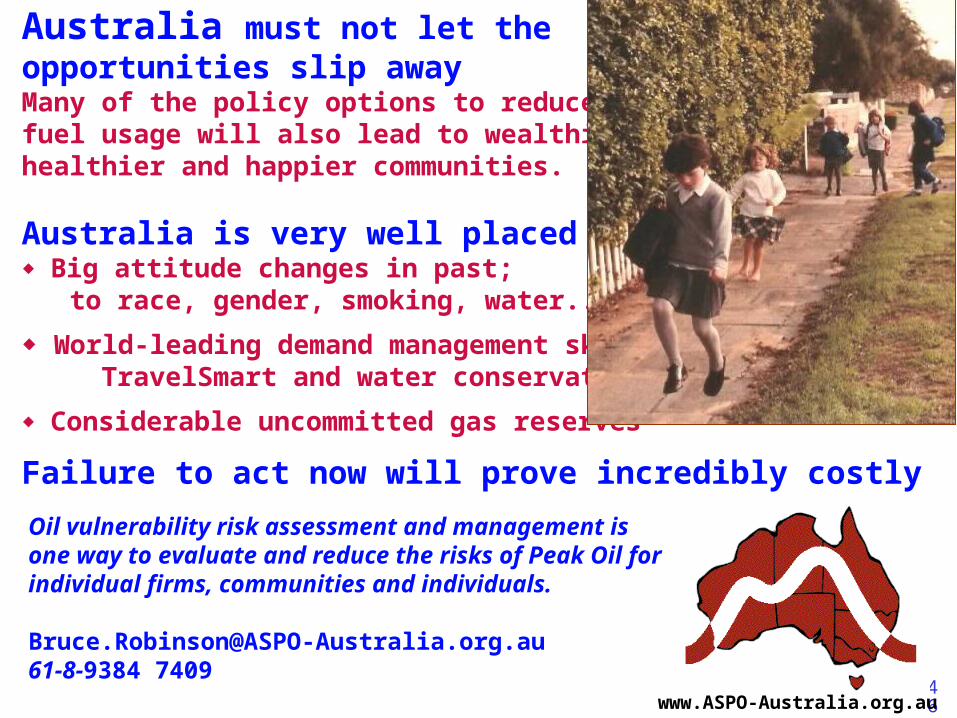
Australia must not let the opportunities slip awayMany of the policy options to reduce fuel usage will also lead to wealthier, healthier and happier communities.
Australia is very well placed globally Big attitude changes in past;
to race, gender, smoking, water..
World-leading demand management skills TravelSmart and water conservation
Considerable uncommitted gas reserves
Failure to act now will prove incredibly costly
www.ASPO-Australia.org.au
Oil vulnerability risk assessment and management is one way to evaluate and reduce the risks of Peak Oil for individual firms, communities and individuals.
[email protected] 61-8-9384 7409

47
some additional slides follow, for questions, or if time permits
48
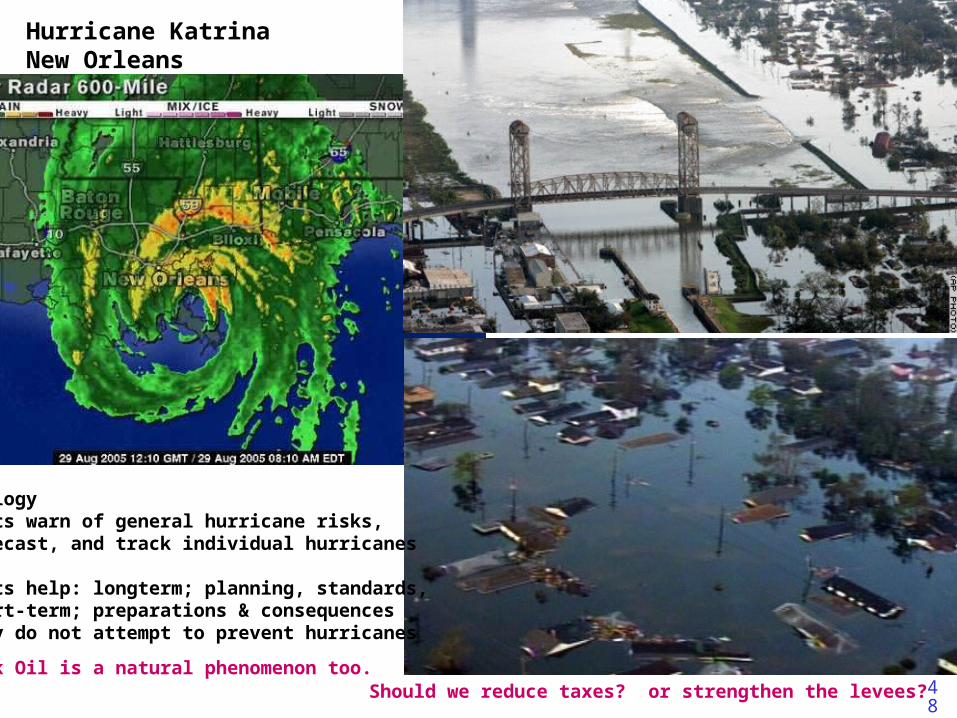
Hurricane KatrinaNew Orleans
AnalogyGovts warn of general hurricane risks,forecast, and track individual hurricanes
Govts help: longterm; planning, standards, short-term; preparations & consequencesThey do not attempt to prevent hurricanes
Peak Oil is a natural phenomenon too. Should we reduce taxes? or strengthen the levees?
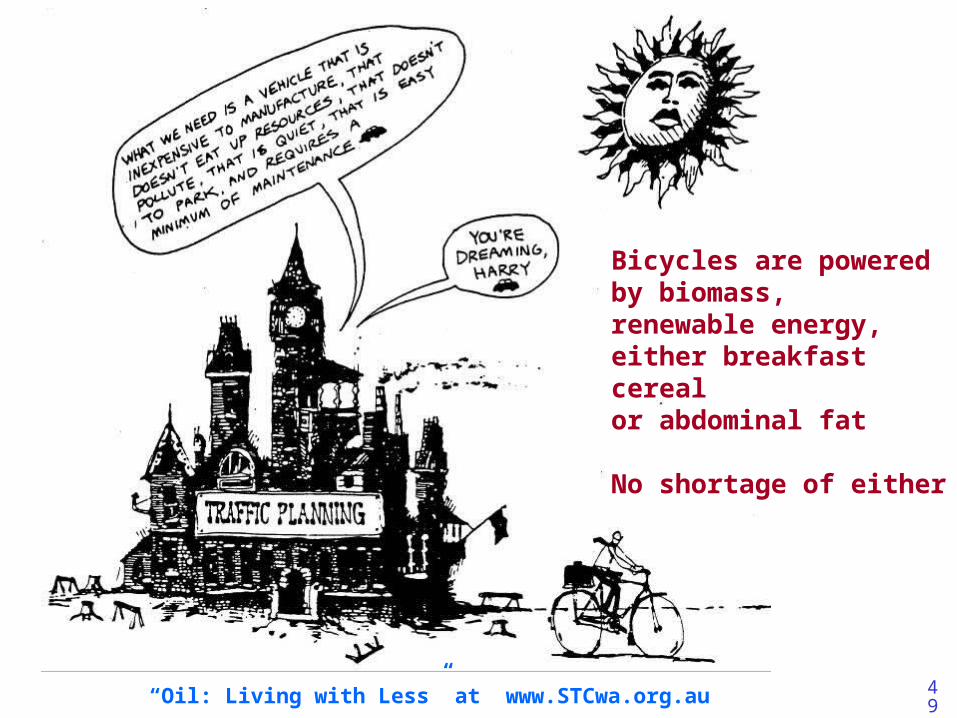
49“Oil: Living with Less” at www.STCwa.org.au
Bicycles are powered by biomass, renewable energy,either breakfast cereal or abdominal fat
No shortage of either
50
$0.00
$0.50
$1.00
$1.50
0 150 350 550 750 1150 1950
WA domestic water prices, 2002/03
/kl
kl range
A rational pricing system Perth domestic water
Renewable scarce resource
0%
10%
20%
30%
0 15,000 25,000 40,000
FBT tax on motor vehicles
km range
An irrational pricing system FBT on motor vehiclesIrreplaceable resource
• Company car tax concessions cost $940m pa• GST on public transport, but not petrol• GST dropped car sales tax 22% to 10%• $5,000 tariff subsidy on 4WDs vs little cars• fixed vehicle ownership charges, not use charges
Shoppers at Coles and Woolworths subsidise gas-guzzlers 4c/l

51
some additional slides follow, for questions, or if time permits

52
China
US
Australia
53
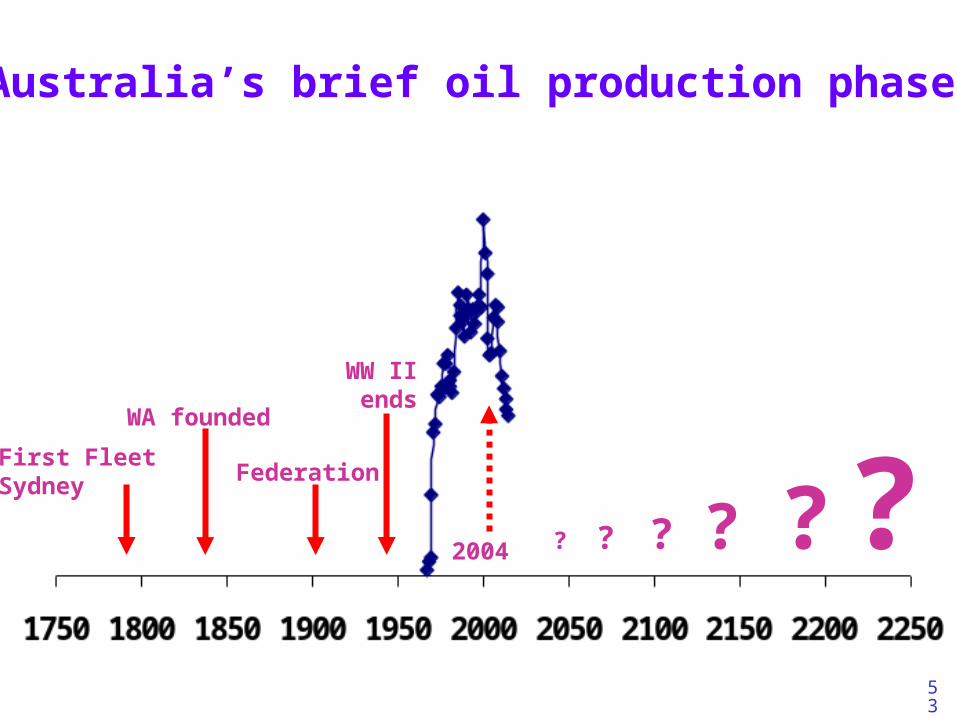
Australia’s brief oil production phase
First FleetSydney
WA founded
Federation
WW II ends
? ? ? ? ? ? 2004
54
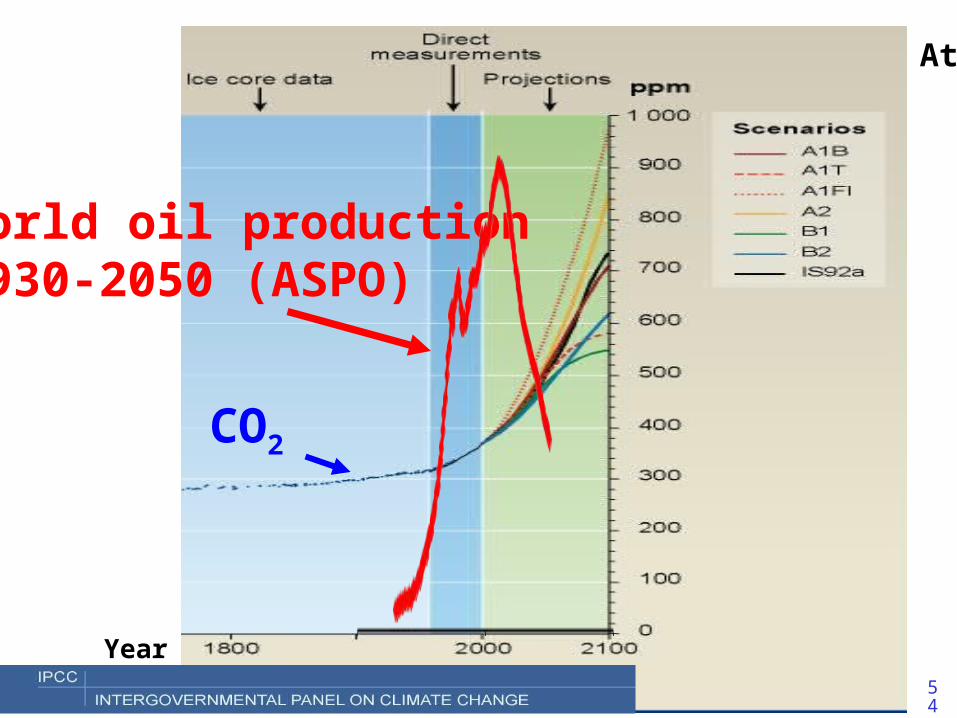
IPCC Atmospheric CO2
World oil production1930-2050 (ASPO)
CO2
Year

55
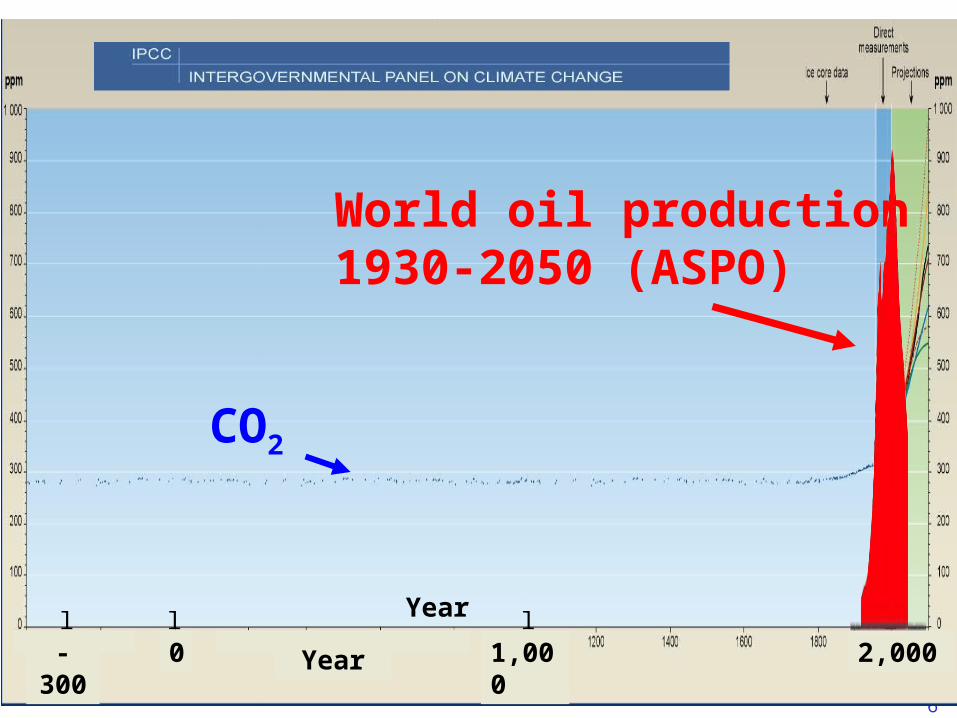
World oil production1930-2050 (ASPO)
1,000 2,000
Year
CO2
1,500
56
World oil production1930-2050 (ASPO)
CO2
Year
1,0000l
2,000l
-300l
Year
l
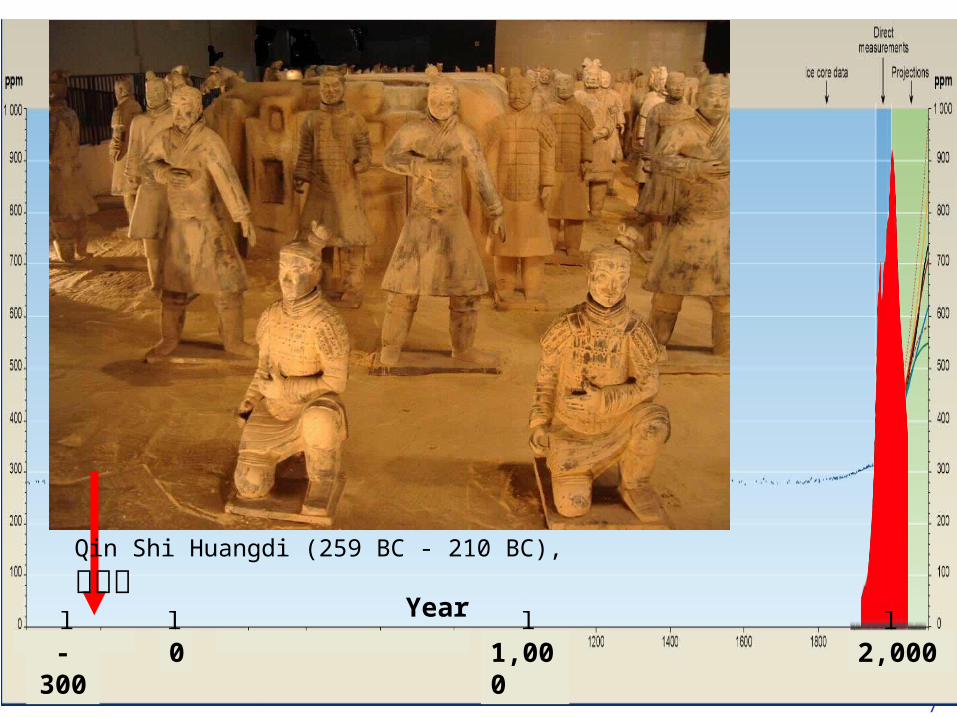
57
1,0000l
2,000l
-300ll
Qin Shi Huangdi (259 BC - 210 BC),
秦始皇 Year